Glen Lyn, VA Map & Demographics
Glen Lyn Map
Glen Lyn Overview
$30,699
PER CAPITA INCOME
$81,250
AVG FAMILY INCOME
$73,750
AVG HOUSEHOLD INCOME
36.6%
WAGE / INCOME GAP [ % ]
63.4¢/ $1
WAGE / INCOME GAP [ $ ]
0.44
INEQUALITY / GINI INDEX
78
TOTAL POPULATION
45
MALE POPULATION
33
FEMALE POPULATION
136.36
MALES / 100 FEMALES
73.33
FEMALES / 100 MALES
46.3
MEDIAN AGE
3.1
AVG FAMILY SIZE
2.7
AVG HOUSEHOLD SIZE
30
LABOR FORCE [ PEOPLE ]
48.4%
PERCENT IN LABOR FORCE
Glen Lyn Zip Codes
Glen Lyn Area Codes
Income in Glen Lyn
Income Overview in Glen Lyn
Per Capita Income in Glen Lyn is $30,699, while median incomes of families and households are $81,250 and $73,750 respectively.
| Characteristic | Number | Measure |
| Per Capita Income | 78 | $30,699 |
| Median Family Income | 22 | $81,250 |
| Mean Family Income | 22 | $96,000 |
| Median Household Income | 29 | $73,750 |
| Mean Household Income | 29 | $84,107 |
| Income Deficit | 22 | $0 |
| Wage / Income Gap (%) | 78 | 36.56% |
| Wage / Income Gap ($) | 78 | 63.44¢ per $1 |
| Gini / Inequality Index | 78 | 0.44 |
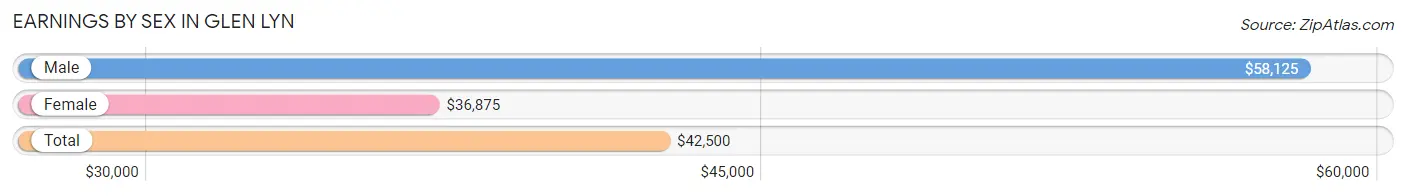
Earnings by Sex in Glen Lyn
Average Earnings in Glen Lyn are $42,500, $58,125 for men and $36,875 for women, a difference of 36.6%.
| Sex | Number | Average Earnings |
| Male | 14 (41.2%) | $58,125 |
| Female | 20 (58.8%) | $36,875 |
| Total | 34 (100.0%) | $42,500 |
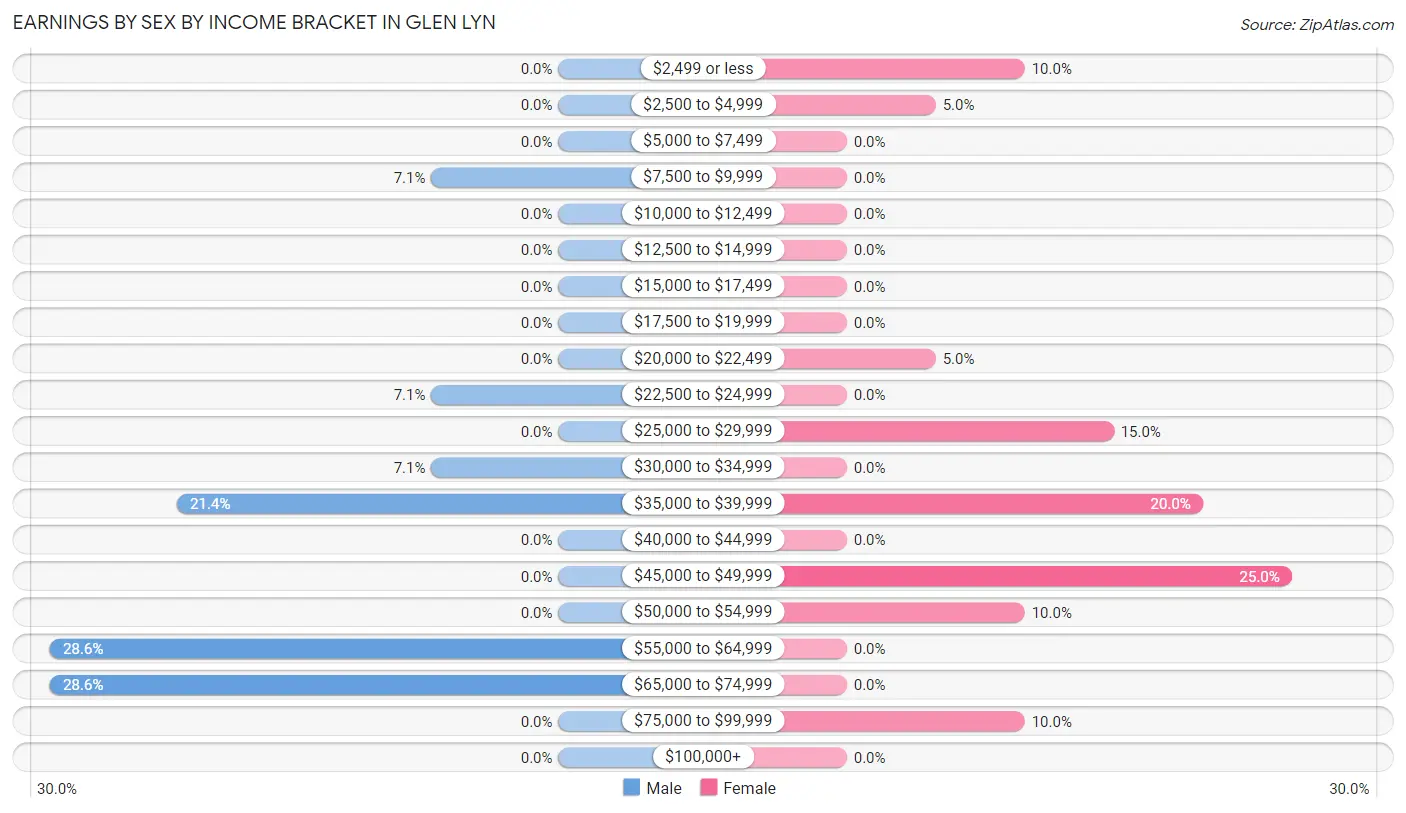
Earnings by Sex by Income Bracket in Glen Lyn
The most common earnings brackets in Glen Lyn are $55,000 to $64,999 for men (4 | 28.6%) and $45,000 to $49,999 for women (5 | 25.0%).
| Income | Male | Female |
| $2,499 or less | 0 (0.0%) | 2 (10.0%) |
| $2,500 to $4,999 | 0 (0.0%) | 1 (5.0%) |
| $5,000 to $7,499 | 0 (0.0%) | 0 (0.0%) |
| $7,500 to $9,999 | 1 (7.1%) | 0 (0.0%) |
| $10,000 to $12,499 | 0 (0.0%) | 0 (0.0%) |
| $12,500 to $14,999 | 0 (0.0%) | 0 (0.0%) |
| $15,000 to $17,499 | 0 (0.0%) | 0 (0.0%) |
| $17,500 to $19,999 | 0 (0.0%) | 0 (0.0%) |
| $20,000 to $22,499 | 0 (0.0%) | 1 (5.0%) |
| $22,500 to $24,999 | 1 (7.1%) | 0 (0.0%) |
| $25,000 to $29,999 | 0 (0.0%) | 3 (15.0%) |
| $30,000 to $34,999 | 1 (7.1%) | 0 (0.0%) |
| $35,000 to $39,999 | 3 (21.4%) | 4 (20.0%) |
| $40,000 to $44,999 | 0 (0.0%) | 0 (0.0%) |
| $45,000 to $49,999 | 0 (0.0%) | 5 (25.0%) |
| $50,000 to $54,999 | 0 (0.0%) | 2 (10.0%) |
| $55,000 to $64,999 | 4 (28.6%) | 0 (0.0%) |
| $65,000 to $74,999 | 4 (28.6%) | 0 (0.0%) |
| $75,000 to $99,999 | 0 (0.0%) | 2 (10.0%) |
| $100,000+ | 0 (0.0%) | 0 (0.0%) |
| Total | 14 (100.0%) | 20 (100.0%) |
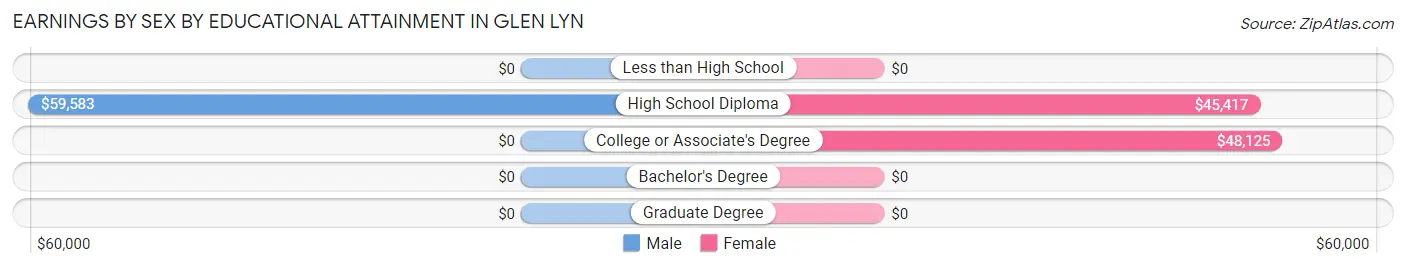
Earnings by Sex by Educational Attainment in Glen Lyn
Average earnings in Glen Lyn are $58,750 for men and $45,417 for women, a difference of 22.7%. Men with an educational attainment of high school diploma enjoy the highest average annual earnings of $59,583, while those with high school diploma education earn the least with $59,583. Women with an educational attainment of college or associate's degree earn the most with the average annual earnings of $48,125, while those with high school diploma education have the smallest earnings of $45,417.
| Educational Attainment | Male Income | Female Income |
| Less than High School | - | - |
| High School Diploma | $59,583 | $45,417 |
| College or Associate's Degree | - | - |
| Bachelor's Degree | - | - |
| Graduate Degree | - | - |
| Total | $58,750 | $45,417 |
Family Income in Glen Lyn
Family Income Brackets in Glen Lyn
According to the Glen Lyn family income data, there are 6 families falling into the $50,000 to $74,999 income range, which is the most common income bracket and makes up 27.3% of all families.
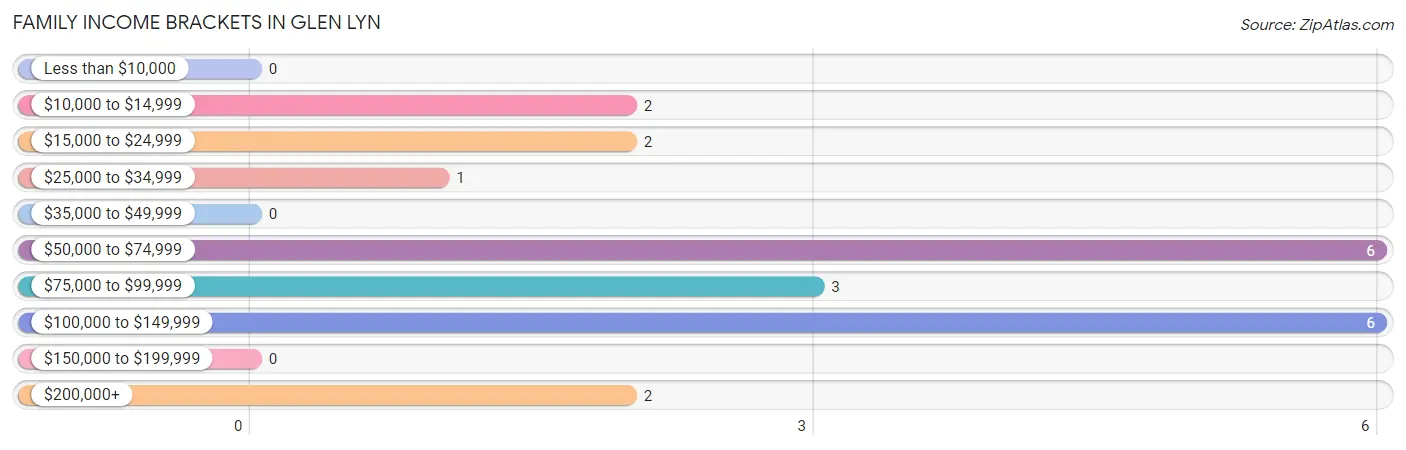
| Income Bracket | # Families | % Families |
| Less than $10,000 | 0 | 0.0% |
| $10,000 to $14,999 | 2 | 9.1% |
| $15,000 to $24,999 | 2 | 9.1% |
| $25,000 to $34,999 | 1 | 4.5% |
| $35,000 to $49,999 | 0 | 0.0% |
| $50,000 to $74,999 | 6 | 27.3% |
| $75,000 to $99,999 | 3 | 13.6% |
| $100,000 to $149,999 | 6 | 27.3% |
| $150,000 to $199,999 | 0 | 0.0% |
| $200,000+ | 2 | 9.1% |
Family Income by Famaliy Size in Glen Lyn
3-person families (5 | 22.7%) account for the highest median family income in Glen Lyn with $113,750 per family, while 3-person families (5 | 22.7%) have the highest median income of $37,917 per family member.
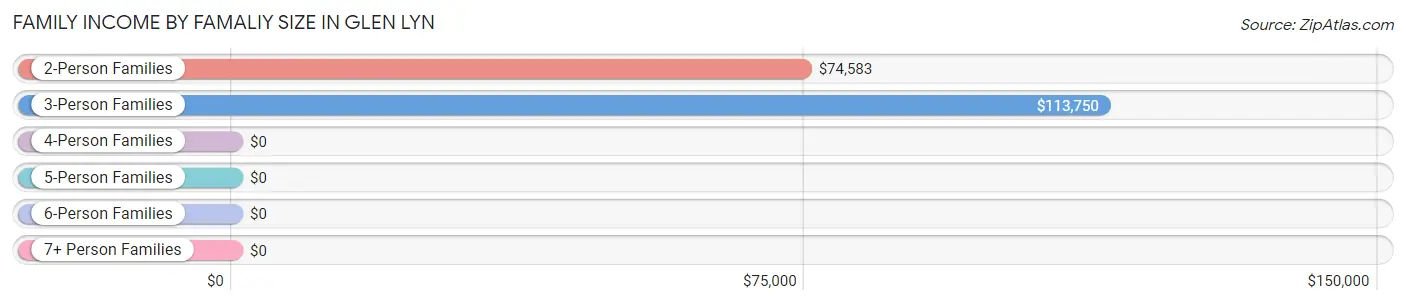
| Income Bracket | # Families | Median Income |
| 2-Person Families | 13 (59.1%) | $74,583 |
| 3-Person Families | 5 (22.7%) | $113,750 |
| 4-Person Families | 1 (4.5%) | $0 |
| 5-Person Families | 3 (13.6%) | $0 |
| 6-Person Families | 0 (0.0%) | $0 |
| 7+ Person Families | 0 (0.0%) | $0 |
| Total | 22 (100.0%) | $81,250 |
Family Income by Number of Earners in Glen Lyn
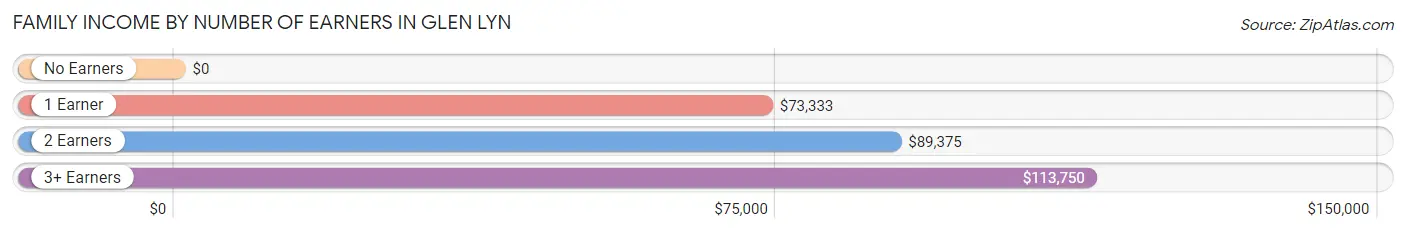
| Number of Earners | # Families | Median Income |
| No Earners | 4 (18.2%) | $0 |
| 1 Earner | 8 (36.4%) | $73,333 |
| 2 Earners | 5 (22.7%) | $89,375 |
| 3+ Earners | 5 (22.7%) | $113,750 |
| Total | 22 (100.0%) | $81,250 |
Household Income in Glen Lyn
Household Income Brackets in Glen Lyn
With 8 households falling in the category, the $100,000 to $149,999 income range is the most frequent in Glen Lyn, accounting for 27.6% of all households.
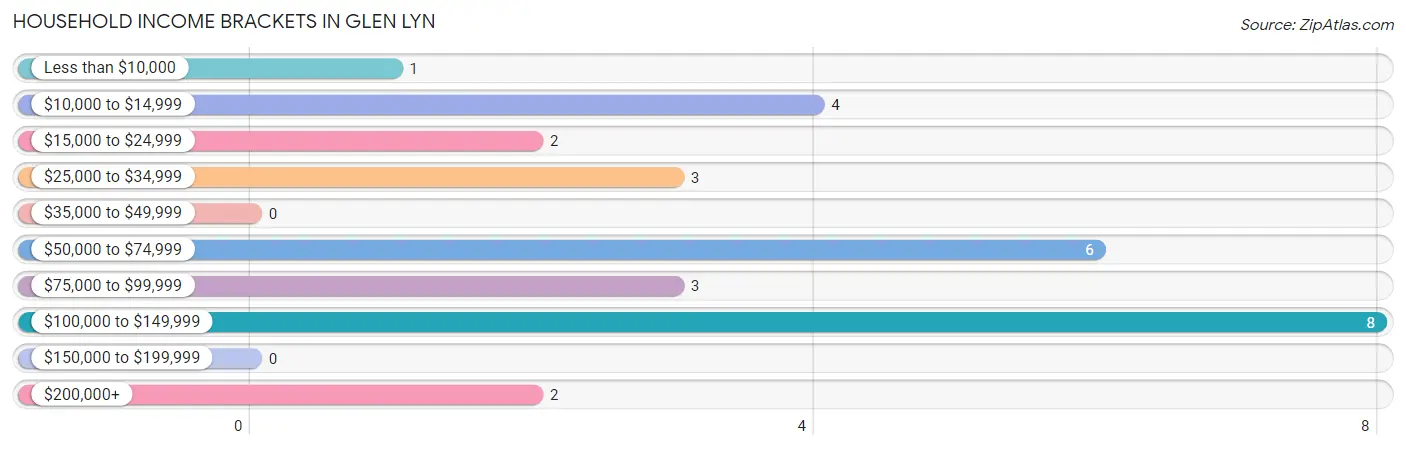
| Income Bracket | # Households | % Households |
| Less than $10,000 | 1 | 3.4% |
| $10,000 to $14,999 | 4 | 13.8% |
| $15,000 to $24,999 | 2 | 6.9% |
| $25,000 to $34,999 | 3 | 10.3% |
| $35,000 to $49,999 | 0 | 0.0% |
| $50,000 to $74,999 | 6 | 20.7% |
| $75,000 to $99,999 | 3 | 10.3% |
| $100,000 to $149,999 | 8 | 27.6% |
| $150,000 to $199,999 | 0 | 0.0% |
| $200,000+ | 2 | 6.9% |
Household Income by Householder Age in Glen Lyn
The median household income in Glen Lyn is $73,750, with the highest median household income of $104,375 found in the 45 to 64 years age bracket for the primary householder. A total of 13 households (44.8%) fall into this category.
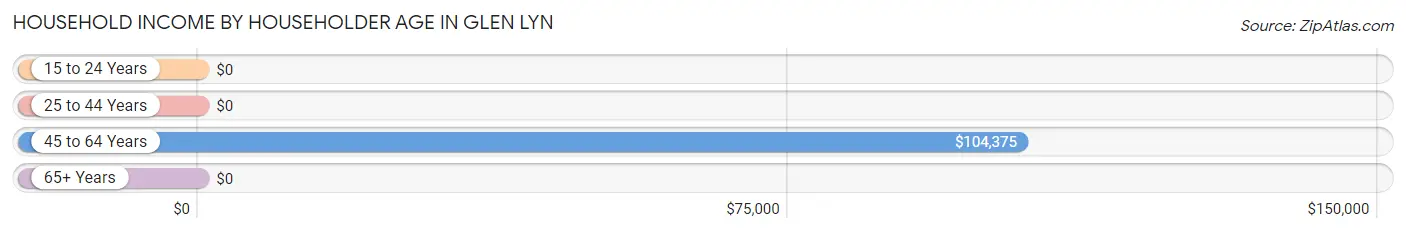
| Income Bracket | # Households | Median Income |
| 15 to 24 Years | 0 (0.0%) | $0 |
| 25 to 44 Years | 9 (31.0%) | $0 |
| 45 to 64 Years | 13 (44.8%) | $104,375 |
| 65+ Years | 7 (24.1%) | $0 |
| Total | 29 (100.0%) | $73,750 |
Poverty in Glen Lyn
Income Below Poverty by Sex and Age in Glen Lyn
With 31.1% poverty level for males and 21.2% for females among the residents of Glen Lyn, 6 to 11 year old males and 6 to 11 year old females are the most vulnerable to poverty, with 6 males (100.0%) and 2 females (66.7%) in their respective age groups living below the poverty level.
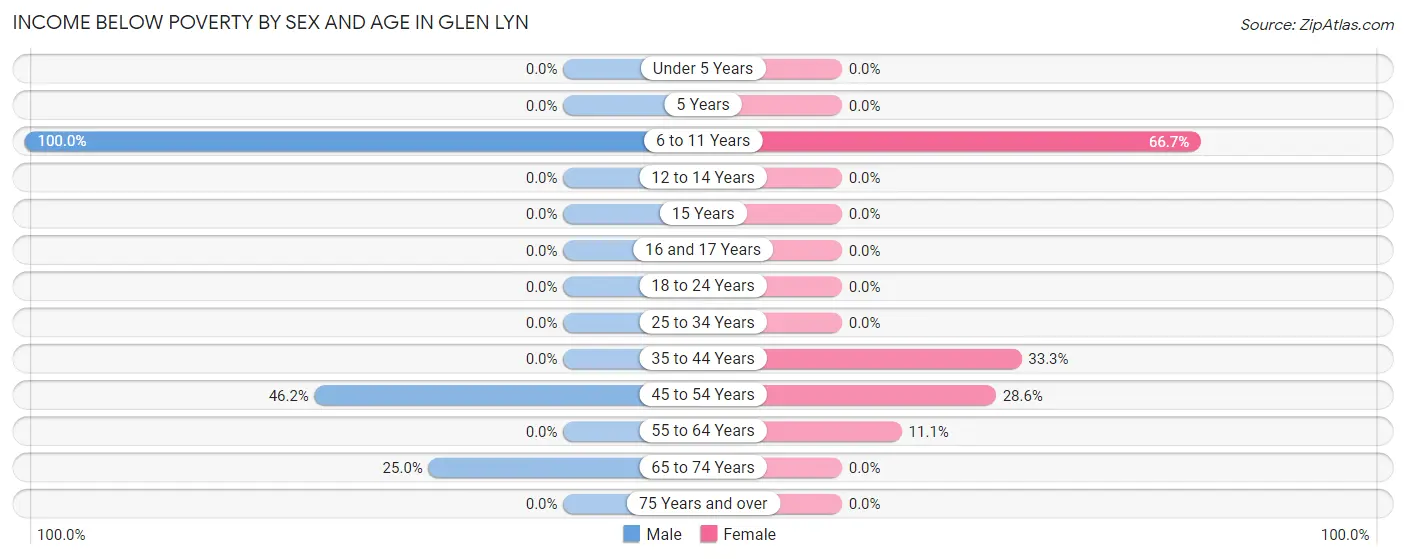
| Age Bracket | Male | Female |
| Under 5 Years | 0 (0.0%) | 0 (0.0%) |
| 5 Years | 0 (0.0%) | 0 (0.0%) |
| 6 to 11 Years | 6 (100.0%) | 2 (66.7%) |
| 12 to 14 Years | 0 (0.0%) | 0 (0.0%) |
| 15 Years | 0 (0.0%) | 0 (0.0%) |
| 16 and 17 Years | 0 (0.0%) | 0 (0.0%) |
| 18 to 24 Years | 0 (0.0%) | 0 (0.0%) |
| 25 to 34 Years | 0 (0.0%) | 0 (0.0%) |
| 35 to 44 Years | 0 (0.0%) | 2 (33.3%) |
| 45 to 54 Years | 6 (46.2%) | 2 (28.6%) |
| 55 to 64 Years | 0 (0.0%) | 1 (11.1%) |
| 65 to 74 Years | 2 (25.0%) | 0 (0.0%) |
| 75 Years and over | 0 (0.0%) | 0 (0.0%) |
| Total | 14 (31.1%) | 7 (21.2%) |
Income Above Poverty by Sex and Age in Glen Lyn
According to the poverty statistics in Glen Lyn, males aged under 5 years and females aged under 5 years are the age groups that are most secure financially, with 100.0% of males and 100.0% of females in these age groups living above the poverty line.
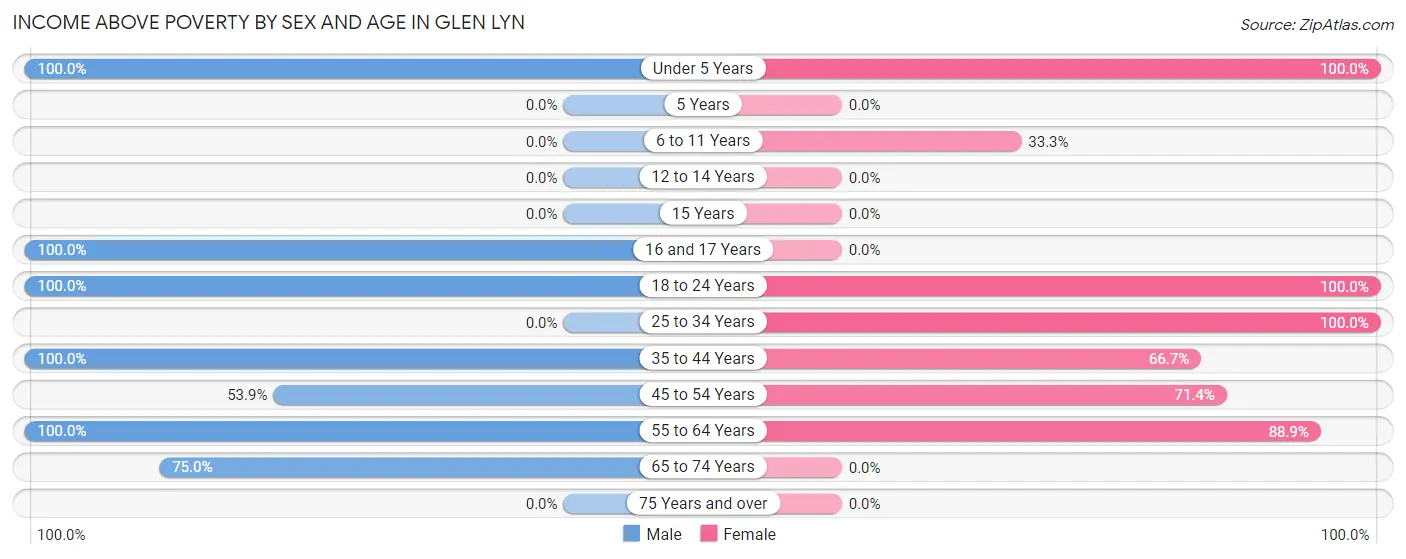
| Age Bracket | Male | Female |
| Under 5 Years | 4 (100.0%) | 3 (100.0%) |
| 5 Years | 0 (0.0%) | 0 (0.0%) |
| 6 to 11 Years | 0 (0.0%) | 1 (33.3%) |
| 12 to 14 Years | 0 (0.0%) | 0 (0.0%) |
| 15 Years | 0 (0.0%) | 0 (0.0%) |
| 16 and 17 Years | 2 (100.0%) | 0 (0.0%) |
| 18 to 24 Years | 4 (100.0%) | 3 (100.0%) |
| 25 to 34 Years | 0 (0.0%) | 2 (100.0%) |
| 35 to 44 Years | 3 (100.0%) | 4 (66.7%) |
| 45 to 54 Years | 7 (53.8%) | 5 (71.4%) |
| 55 to 64 Years | 5 (100.0%) | 8 (88.9%) |
| 65 to 74 Years | 6 (75.0%) | 0 (0.0%) |
| 75 Years and over | 0 (0.0%) | 0 (0.0%) |
| Total | 31 (68.9%) | 26 (78.8%) |
Income Below Poverty Among Married-Couple Families in Glen Lyn
The poverty statistics for married-couple families in Glen Lyn show that 19.1% or 4 of the total 21 families live below the poverty line. Families with 3 or 4 children have the highest poverty rate of 100.0%, comprising of 2 families. On the other hand, families with 1 or 2 children have the lowest poverty rate of 0.0%, which includes 0 families.
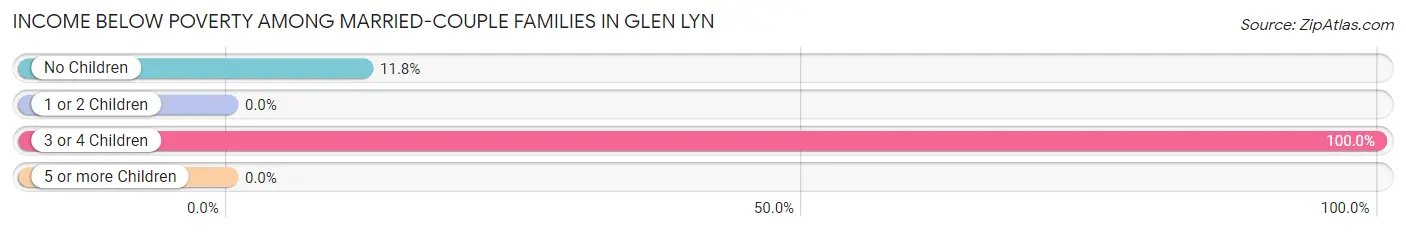
| Children | Above Poverty | Below Poverty |
| No Children | 15 (88.2%) | 2 (11.8%) |
| 1 or 2 Children | 2 (100.0%) | 0 (0.0%) |
| 3 or 4 Children | 0 (0.0%) | 2 (100.0%) |
| 5 or more Children | 0 (0.0%) | 0 (0.0%) |
| Total | 17 (80.9%) | 4 (19.1%) |
Income Below Poverty Among Single-Parent Households in Glen Lyn
| Children | Single Father | Single Mother |
| No Children | 0 (0.0%) | 0 (0.0%) |
| 1 or 2 Children | 0 (0.0%) | 0 (0.0%) |
| 3 or 4 Children | 0 (0.0%) | 0 (0.0%) |
| 5 or more Children | 0 (0.0%) | 0 (0.0%) |
| Total | 0 (0.0%) | 0 (0.0%) |
Income Below Poverty Among Married-Couple vs Single-Parent Households in Glen Lyn
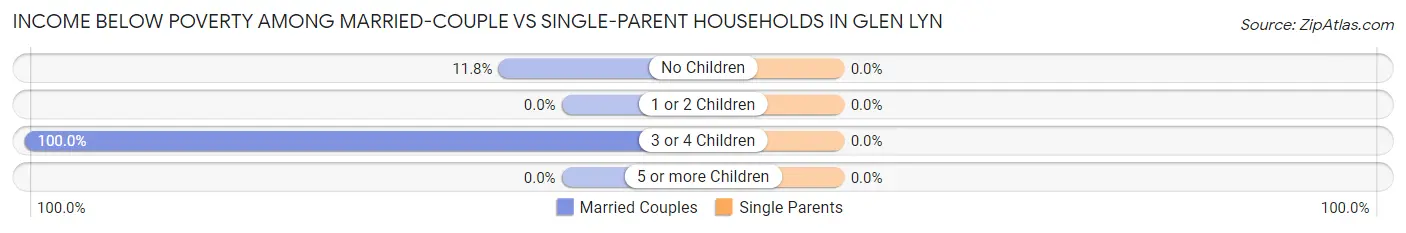
| Children | Married-Couple Families | Single-Parent Households |
| No Children | 2 (11.8%) | 0 (0.0%) |
| 1 or 2 Children | 0 (0.0%) | 0 (0.0%) |
| 3 or 4 Children | 2 (100.0%) | 0 (0.0%) |
| 5 or more Children | 0 (0.0%) | 0 (0.0%) |
| Total | 4 (19.1%) | 0 (0.0%) |
Race in Glen Lyn
The most populous races in Glen Lyn are White / Caucasian (78 | 100.0%), and Hispanic or Latino (1 | 1.3%).
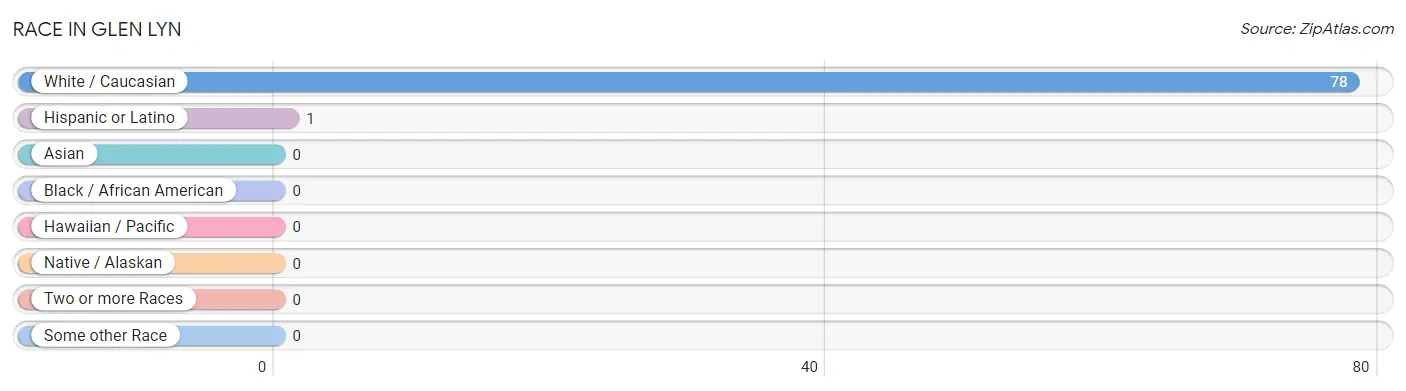
| Race | # Population | % Population |
| Asian | 0 | 0.0% |
| Black / African American | 0 | 0.0% |
| Hawaiian / Pacific | 0 | 0.0% |
| Hispanic or Latino | 1 | 1.3% |
| Native / Alaskan | 0 | 0.0% |
| White / Caucasian | 78 | 100.0% |
| Two or more Races | 0 | 0.0% |
| Some other Race | 0 | 0.0% |
| Total | 78 | 100.0% |
Ancestry in Glen Lyn
The most populous ancestries reported in Glen Lyn are American (21 | 26.9%), English (12 | 15.4%), German (4 | 5.1%), Irish (4 | 5.1%), and Mexican (1 | 1.3%), together accounting for 53.8% of all Glen Lyn residents.
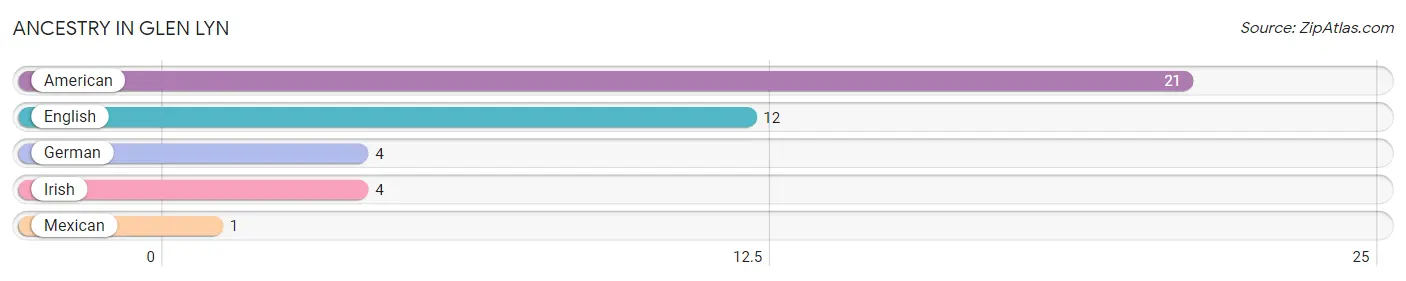
| Ancestry | # Population | % Population |
| American | 21 | 26.9% |
| English | 12 | 15.4% |
| German | 4 | 5.1% |
| Irish | 4 | 5.1% |
| Mexican | 1 | 1.3% | View All 5 Rows |
Immigrants in Glen Lyn

| Immigration Origin | # Population | % Population | View All 0 Rows |
Sex and Age in Glen Lyn
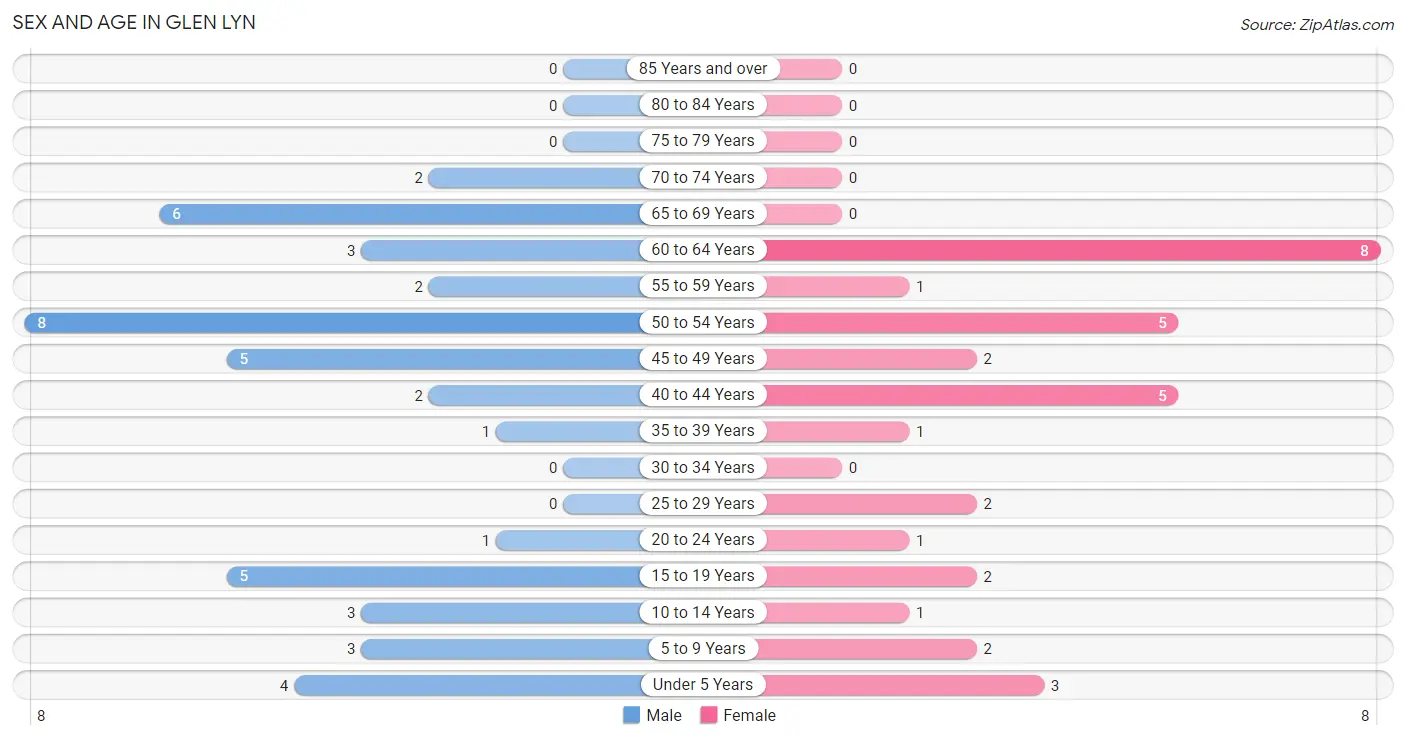
Sex and Age in Glen Lyn
The most populous age groups in Glen Lyn are 50 to 54 Years (8 | 17.8%) for men and 60 to 64 Years (8 | 24.2%) for women.
| Age Bracket | Male | Female |
| Under 5 Years | 4 (8.9%) | 3 (9.1%) |
| 5 to 9 Years | 3 (6.7%) | 2 (6.1%) |
| 10 to 14 Years | 3 (6.7%) | 1 (3.0%) |
| 15 to 19 Years | 5 (11.1%) | 2 (6.1%) |
| 20 to 24 Years | 1 (2.2%) | 1 (3.0%) |
| 25 to 29 Years | 0 (0.0%) | 2 (6.1%) |
| 30 to 34 Years | 0 (0.0%) | 0 (0.0%) |
| 35 to 39 Years | 1 (2.2%) | 1 (3.0%) |
| 40 to 44 Years | 2 (4.4%) | 5 (15.1%) |
| 45 to 49 Years | 5 (11.1%) | 2 (6.1%) |
| 50 to 54 Years | 8 (17.8%) | 5 (15.1%) |
| 55 to 59 Years | 2 (4.4%) | 1 (3.0%) |
| 60 to 64 Years | 3 (6.7%) | 8 (24.2%) |
| 65 to 69 Years | 6 (13.3%) | 0 (0.0%) |
| 70 to 74 Years | 2 (4.4%) | 0 (0.0%) |
| 75 to 79 Years | 0 (0.0%) | 0 (0.0%) |
| 80 to 84 Years | 0 (0.0%) | 0 (0.0%) |
| 85 Years and over | 0 (0.0%) | 0 (0.0%) |
| Total | 45 (100.0%) | 33 (100.0%) |
Families and Households in Glen Lyn
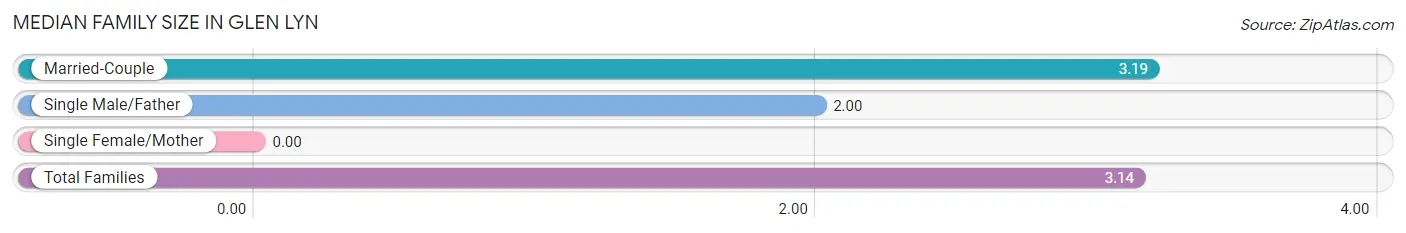
Median Family Size in Glen Lyn
| Family Type | # Families | Family Size |
| Married-Couple | 21 (95.5%) | 3.19 |
| Single Male/Father | 1 (4.5%) | 2.00 |
| Single Female/Mother | 0 (0.0%) | - |
| Total Families | 22 (100.0%) | 3.14 |
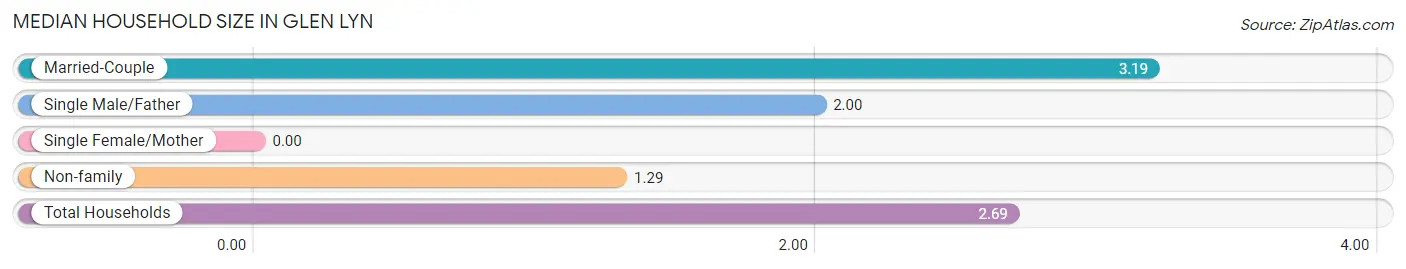
Median Household Size in Glen Lyn
| Household Type | # Households | Household Size |
| Married-Couple | 21 (72.4%) | 3.19 |
| Single Male/Father | 1 (3.5%) | 2.00 |
| Single Female/Mother | 0 (0.0%) | - |
| Non-family | 7 (24.1%) | 1.29 |
| Total Households | 29 (100.0%) | 2.69 |
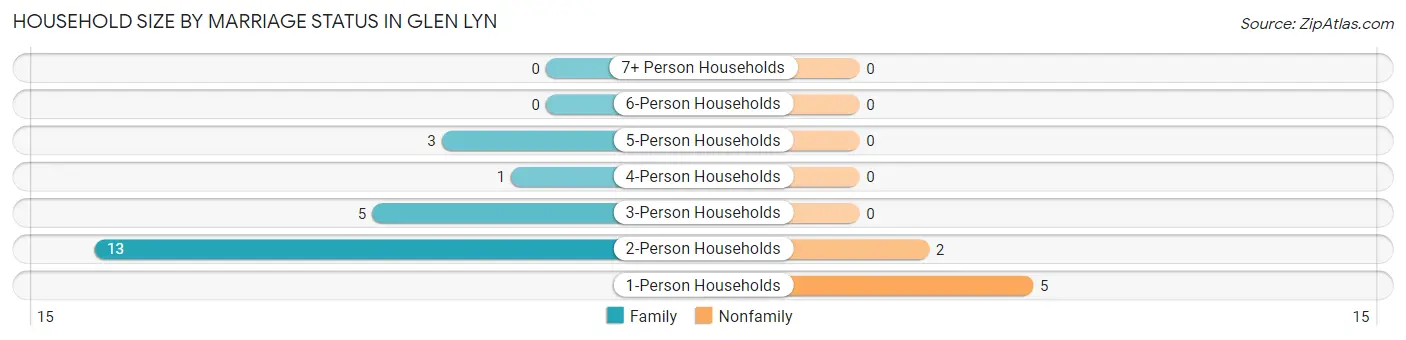
Household Size by Marriage Status in Glen Lyn
Out of a total of 29 households in Glen Lyn, 22 (75.9%) are family households, while 7 (24.1%) are nonfamily households. The most numerous type of family households are 2-person households, comprising 13, and the most common type of nonfamily households are 1-person households, comprising 5.
| Household Size | Family Households | Nonfamily Households |
| 1-Person Households | - | 5 (17.2%) |
| 2-Person Households | 13 (44.8%) | 2 (6.9%) |
| 3-Person Households | 5 (17.2%) | 0 (0.0%) |
| 4-Person Households | 1 (3.5%) | 0 (0.0%) |
| 5-Person Households | 3 (10.3%) | 0 (0.0%) |
| 6-Person Households | 0 (0.0%) | 0 (0.0%) |
| 7+ Person Households | 0 (0.0%) | 0 (0.0%) |
| Total | 22 (75.9%) | 7 (24.1%) |
Female Fertility in Glen Lyn
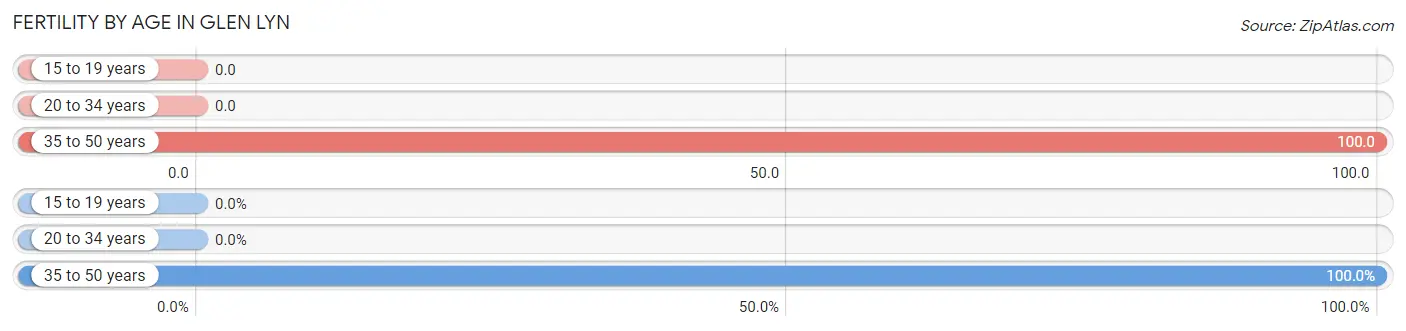
Fertility by Age in Glen Lyn
Average fertility rate in Glen Lyn is 67.0 births per 1,000 women. Women in the age bracket of 35 to 50 years have the highest fertility rate with 100.0 births per 1,000 women. Women in the age bracket of 35 to 50 years acount for 100.0% of all women with births.
| Age Bracket | Women with Births | Births / 1,000 Women |
| 15 to 19 years | 0 (0.0%) | 0.0 |
| 20 to 34 years | 0 (0.0%) | 0.0 |
| 35 to 50 years | 1 (100.0%) | 100.0 |
| Total | 1 (100.0%) | 67.0 |
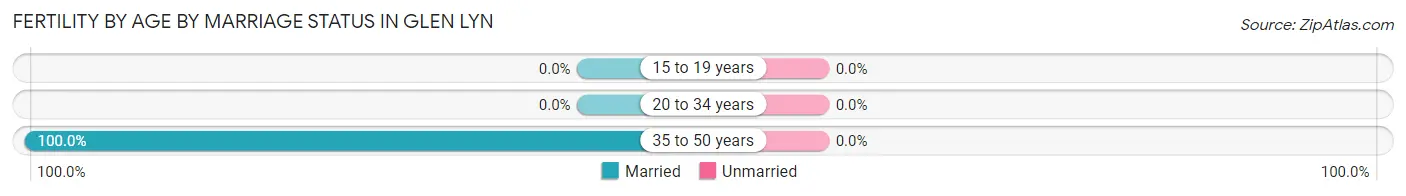
Fertility by Age by Marriage Status in Glen Lyn
| Age Bracket | Married | Unmarried |
| 15 to 19 years | 0 (0.0%) | 0 (0.0%) |
| 20 to 34 years | 0 (0.0%) | 0 (0.0%) |
| 35 to 50 years | 1 (100.0%) | 0 (0.0%) |
| Total | 1 (100.0%) | 0 (0.0%) |
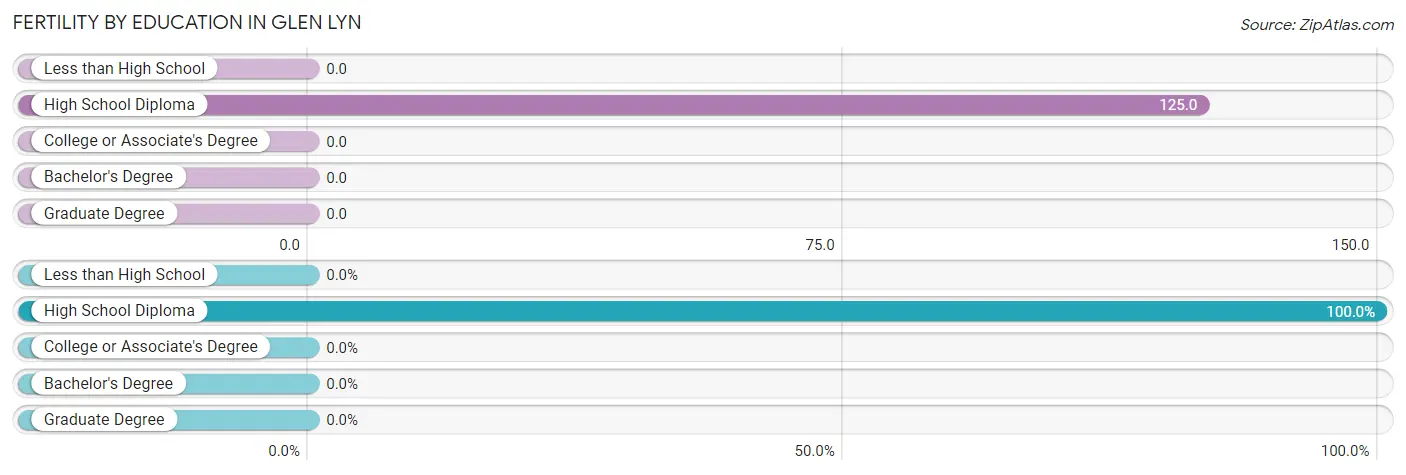
Fertility by Education in Glen Lyn
| Educational Attainment | Women with Births | Births / 1,000 Women |
| Less than High School | 0 (0.0%) | 0.0 |
| High School Diploma | 1 (100.0%) | 125.0 |
| College or Associate's Degree | 0 (0.0%) | 0.0 |
| Bachelor's Degree | 0 (0.0%) | 0.0 |
| Graduate Degree | 0 (0.0%) | 0.0 |
| Total | 1 (100.0%) | 67.0 |
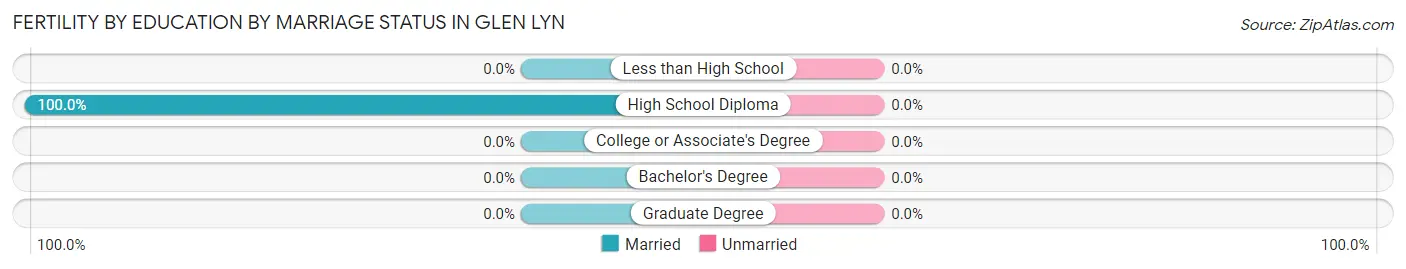
Fertility by Education by Marriage Status in Glen Lyn
| Educational Attainment | Married | Unmarried |
| Less than High School | 0 (0.0%) | 0 (0.0%) |
| High School Diploma | 1 (100.0%) | 0 (0.0%) |
| College or Associate's Degree | 0 (0.0%) | 0 (0.0%) |
| Bachelor's Degree | 0 (0.0%) | 0 (0.0%) |
| Graduate Degree | 0 (0.0%) | 0 (0.0%) |
| Total | 1 (100.0%) | 0 (0.0%) |
Employment Characteristics in Glen Lyn
Employment by Class of Employer in Glen Lyn
Among the 29 employed individuals in Glen Lyn, private company employees (15 | 51.7%), not-for-profit organizations (5 | 17.2%), and local government employees (3 | 10.3%) make up the most common classes of employment.
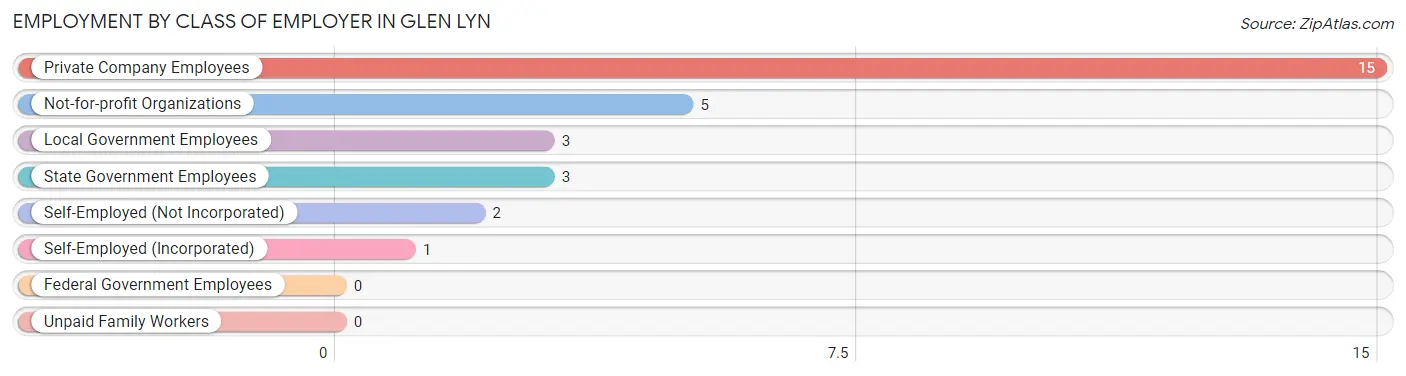
| Employer Class | # Employees | % Employees |
| Private Company Employees | 15 | 51.7% |
| Self-Employed (Incorporated) | 1 | 3.5% |
| Self-Employed (Not Incorporated) | 2 | 6.9% |
| Not-for-profit Organizations | 5 | 17.2% |
| Local Government Employees | 3 | 10.3% |
| State Government Employees | 3 | 10.3% |
| Federal Government Employees | 0 | 0.0% |
| Unpaid Family Workers | 0 | 0.0% |
| Total | 29 | 100.0% |
Employment Status by Age in Glen Lyn
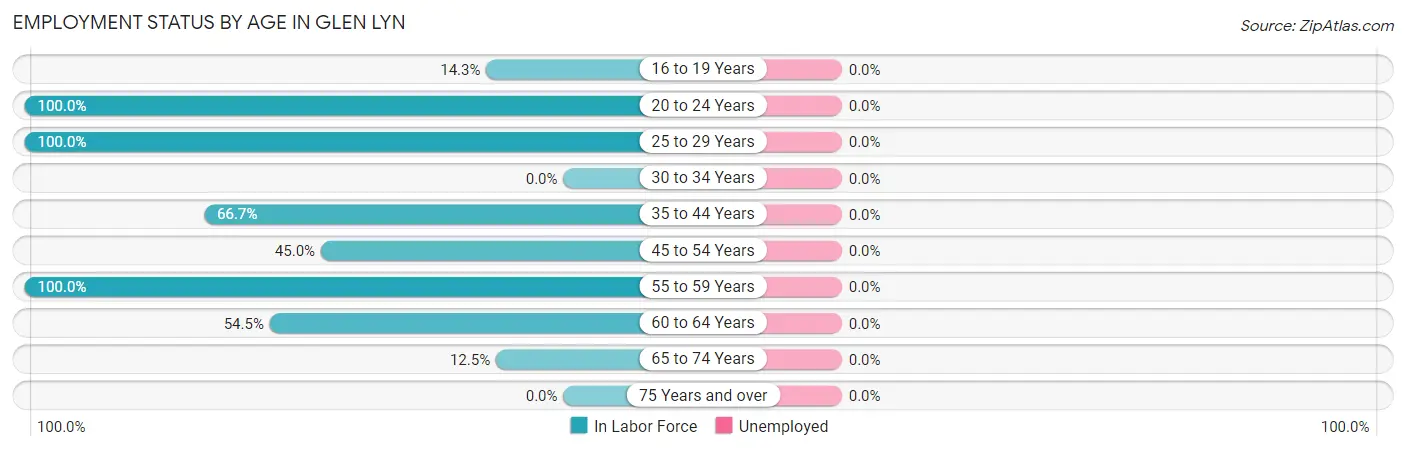
| Age Bracket | In Labor Force | Unemployed |
| 16 to 19 Years | 1 (14.3%) | 0 (0.0%) |
| 20 to 24 Years | 2 (100.0%) | 0 (0.0%) |
| 25 to 29 Years | 2 (100.0%) | 0 (0.0%) |
| 30 to 34 Years | 0 (0.0%) | 0 (0.0%) |
| 35 to 44 Years | 6 (66.7%) | 0 (0.0%) |
| 45 to 54 Years | 9 (45.0%) | 0 (0.0%) |
| 55 to 59 Years | 3 (100.0%) | 0 (0.0%) |
| 60 to 64 Years | 6 (54.5%) | 0 (0.0%) |
| 65 to 74 Years | 1 (12.5%) | 0 (0.0%) |
| 75 Years and over | 0 (0.0%) | 0 (0.0%) |
| Total | 30 (48.4%) | 0 (0.0%) |
Employment Status by Educational Attainment in Glen Lyn
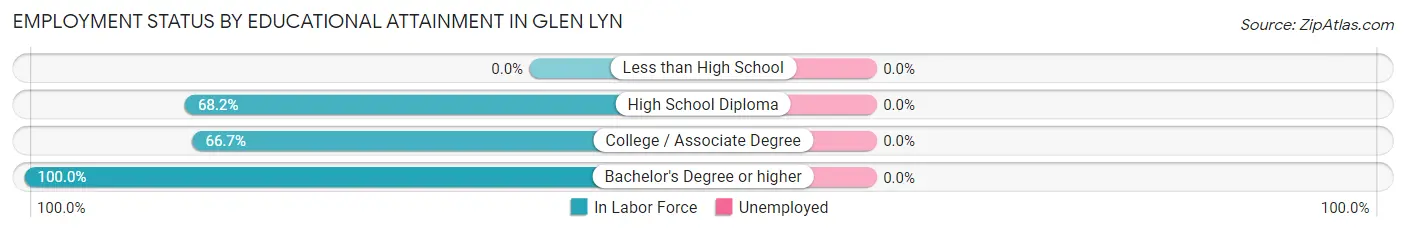
| Educational Attainment | In Labor Force | Unemployed |
| Less than High School | 0 (0.0%) | 0 (0.0%) |
| High School Diploma | 15 (68.2%) | 0 (0.0%) |
| College / Associate Degree | 10 (66.7%) | 0 (0.0%) |
| Bachelor's Degree or higher | 1 (100.0%) | 0 (0.0%) |
| Total | 26 (57.8%) | 0 (0.0%) |
Employment Occupations by Sex in Glen Lyn
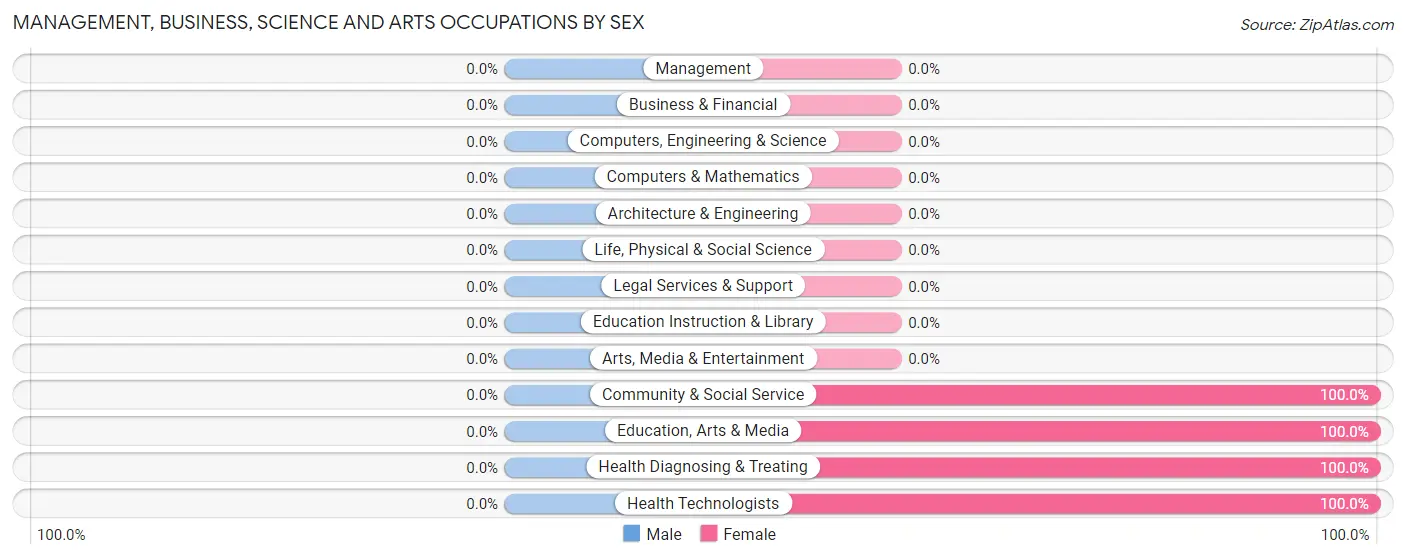
Management, Business, Science and Arts Occupations
The most common Management, Business, Science and Arts occupations in Glen Lyn are Community & Social Service (2 | 6.7%), Education, Arts & Media (2 | 6.7%), Health Diagnosing & Treating (2 | 6.7%), and Health Technologists (2 | 6.7%).
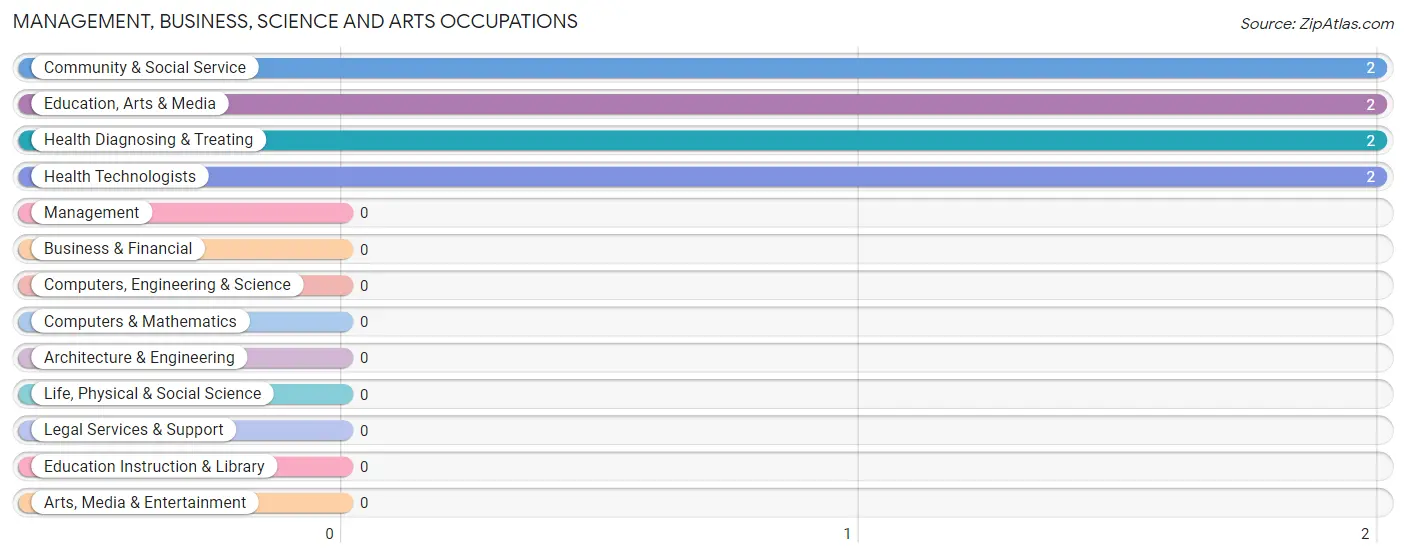
Management, Business, Science and Arts Occupations by Sex
| Occupation | Male | Female |
| Management | 0 (0.0%) | 0 (0.0%) |
| Business & Financial | 0 (0.0%) | 0 (0.0%) |
| Computers, Engineering & Science | 0 (0.0%) | 0 (0.0%) |
| Computers & Mathematics | 0 (0.0%) | 0 (0.0%) |
| Architecture & Engineering | 0 (0.0%) | 0 (0.0%) |
| Life, Physical & Social Science | 0 (0.0%) | 0 (0.0%) |
| Community & Social Service | 0 (0.0%) | 2 (100.0%) |
| Education, Arts & Media | 0 (0.0%) | 2 (100.0%) |
| Legal Services & Support | 0 (0.0%) | 0 (0.0%) |
| Education Instruction & Library | 0 (0.0%) | 0 (0.0%) |
| Arts, Media & Entertainment | 0 (0.0%) | 0 (0.0%) |
| Health Diagnosing & Treating | 0 (0.0%) | 2 (100.0%) |
| Health Technologists | 0 (0.0%) | 2 (100.0%) |
| Total (Category) | 0 (0.0%) | 4 (100.0%) |
| Total (Overall) | 14 (46.7%) | 16 (53.3%) |
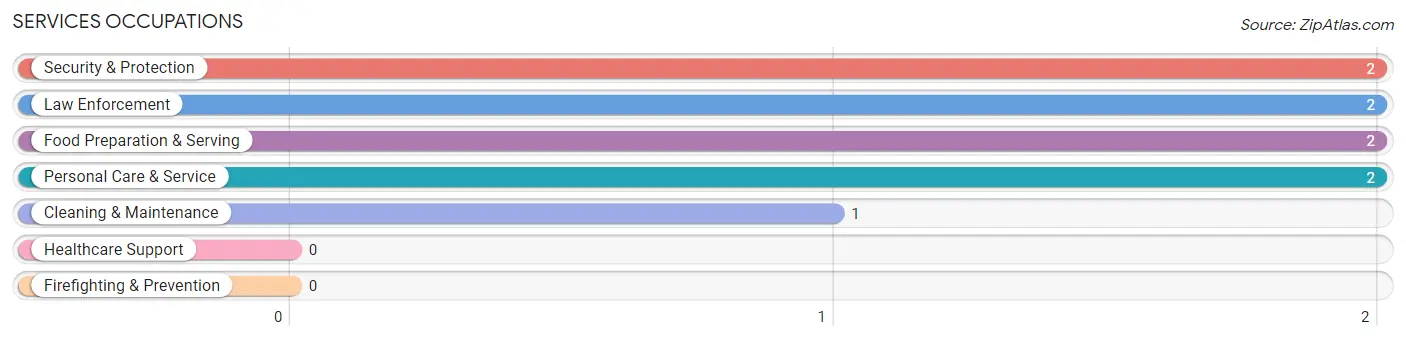
Services Occupations
The most common Services occupations in Glen Lyn are Security & Protection (2 | 6.7%), Law Enforcement (2 | 6.7%), Food Preparation & Serving (2 | 6.7%), Personal Care & Service (2 | 6.7%), and Cleaning & Maintenance (1 | 3.3%).
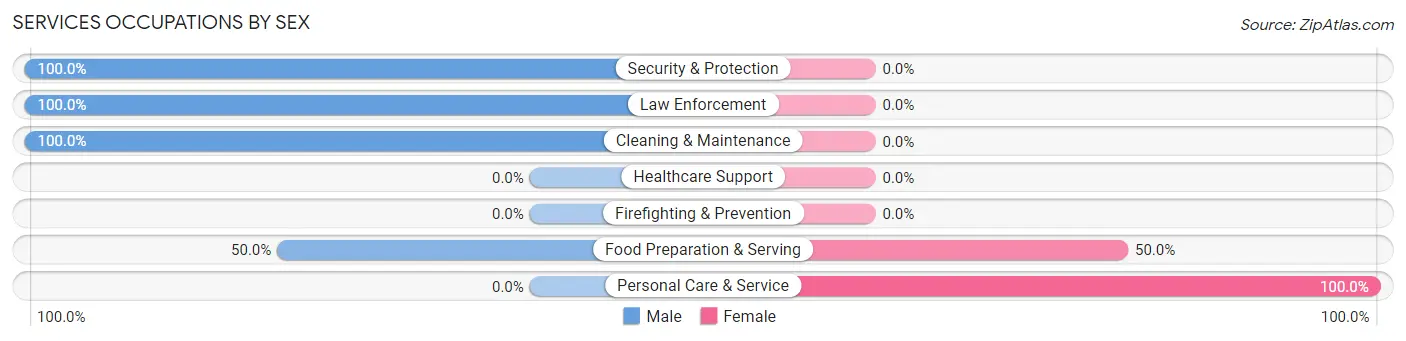
Services Occupations by Sex
Within the Services occupations in Glen Lyn, the most male-oriented occupations are Security & Protection (100.0%), Law Enforcement (100.0%), and Cleaning & Maintenance (100.0%), while the most female-oriented occupations are Personal Care & Service (100.0%), and Food Preparation & Serving (50.0%).
| Occupation | Male | Female |
| Healthcare Support | 0 (0.0%) | 0 (0.0%) |
| Security & Protection | 2 (100.0%) | 0 (0.0%) |
| Firefighting & Prevention | 0 (0.0%) | 0 (0.0%) |
| Law Enforcement | 2 (100.0%) | 0 (0.0%) |
| Food Preparation & Serving | 1 (50.0%) | 1 (50.0%) |
| Cleaning & Maintenance | 1 (100.0%) | 0 (0.0%) |
| Personal Care & Service | 0 (0.0%) | 2 (100.0%) |
| Total (Category) | 4 (57.1%) | 3 (42.9%) |
| Total (Overall) | 14 (46.7%) | 16 (53.3%) |
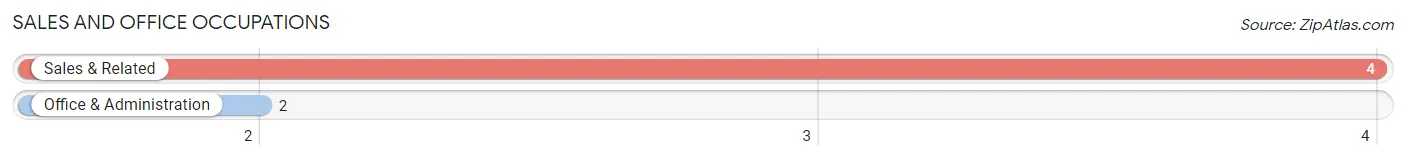
Sales and Office Occupations
The most common Sales and Office occupations in Glen Lyn are Sales & Related (4 | 13.3%), and Office & Administration (2 | 6.7%).
Sales and Office Occupations by Sex
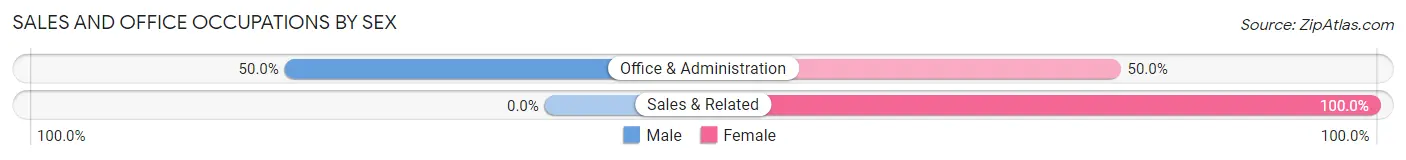
| Occupation | Male | Female |
| Sales & Related | 0 (0.0%) | 4 (100.0%) |
| Office & Administration | 1 (50.0%) | 1 (50.0%) |
| Total (Category) | 1 (16.7%) | 5 (83.3%) |
| Total (Overall) | 14 (46.7%) | 16 (53.3%) |
Natural Resources, Construction and Maintenance Occupations
The most common Natural Resources, Construction and Maintenance occupations in Glen Lyn are Construction & Extraction (4 | 13.3%), and Installation, Maintenance & Repair (2 | 6.7%).
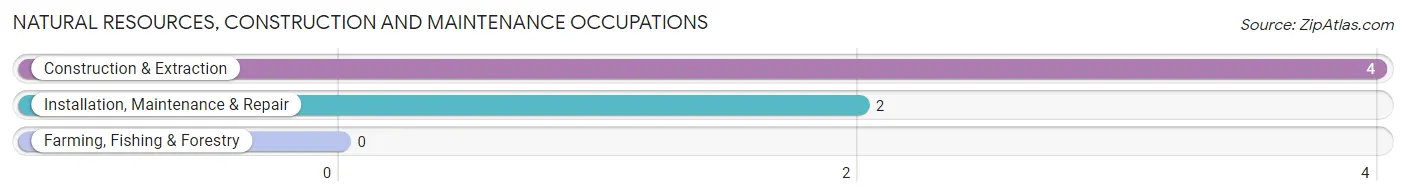
Natural Resources, Construction and Maintenance Occupations by Sex
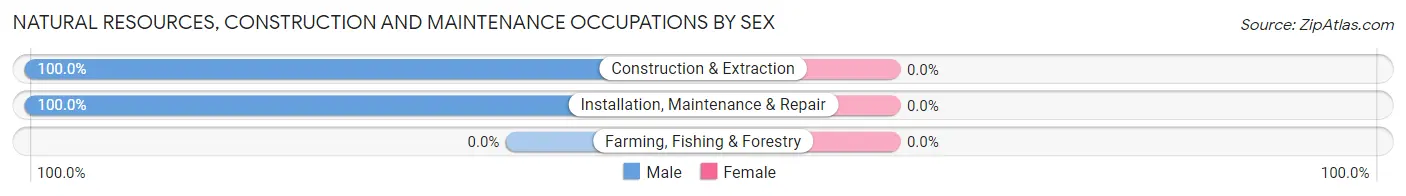
| Occupation | Male | Female |
| Farming, Fishing & Forestry | 0 (0.0%) | 0 (0.0%) |
| Construction & Extraction | 4 (100.0%) | 0 (0.0%) |
| Installation, Maintenance & Repair | 2 (100.0%) | 0 (0.0%) |
| Total (Category) | 6 (100.0%) | 0 (0.0%) |
| Total (Overall) | 14 (46.7%) | 16 (53.3%) |
Production, Transportation and Moving Occupations
The most common Production, Transportation and Moving occupations in Glen Lyn are Production (5 | 16.7%), and Material Moving (2 | 6.7%).
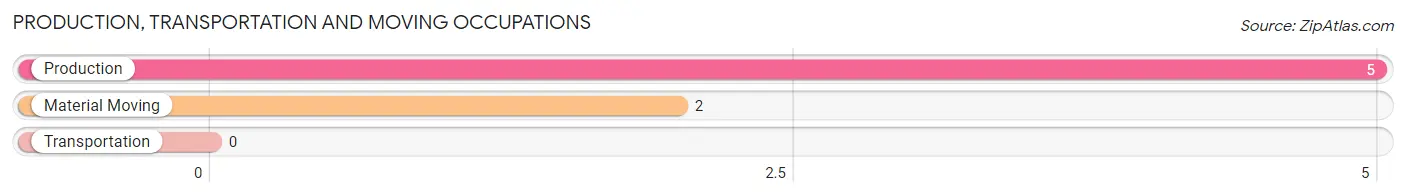
Production, Transportation and Moving Occupations by Sex
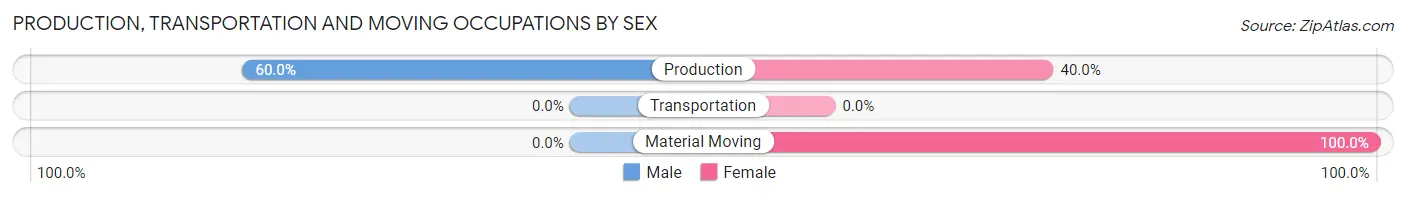
| Occupation | Male | Female |
| Production | 3 (60.0%) | 2 (40.0%) |
| Transportation | 0 (0.0%) | 0 (0.0%) |
| Material Moving | 0 (0.0%) | 2 (100.0%) |
| Total (Category) | 3 (42.9%) | 4 (57.1%) |
| Total (Overall) | 14 (46.7%) | 16 (53.3%) |
Employment Industries by Sex in Glen Lyn
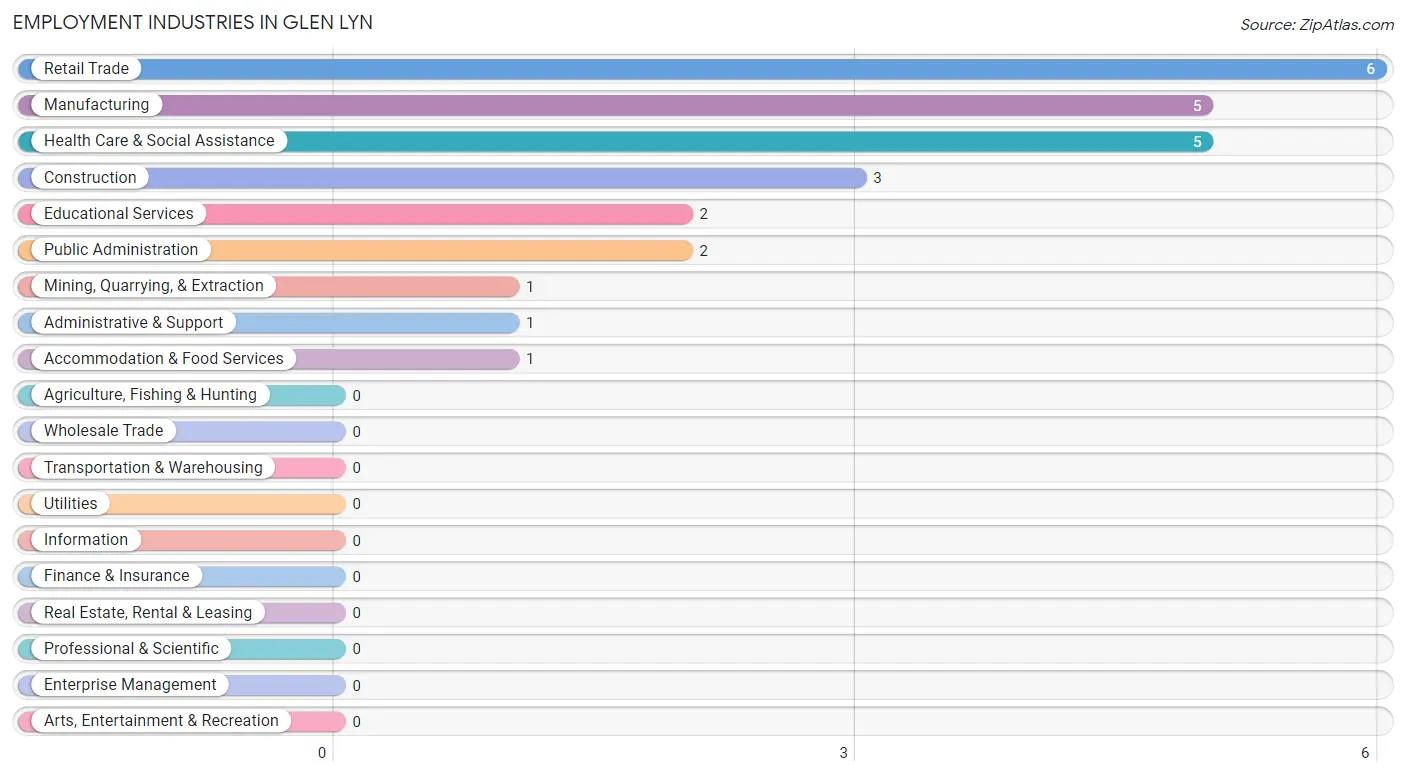
Employment Industries in Glen Lyn
The major employment industries in Glen Lyn include Retail Trade (6 | 20.0%), Manufacturing (5 | 16.7%), Health Care & Social Assistance (5 | 16.7%), Construction (3 | 10.0%), and Educational Services (2 | 6.7%).
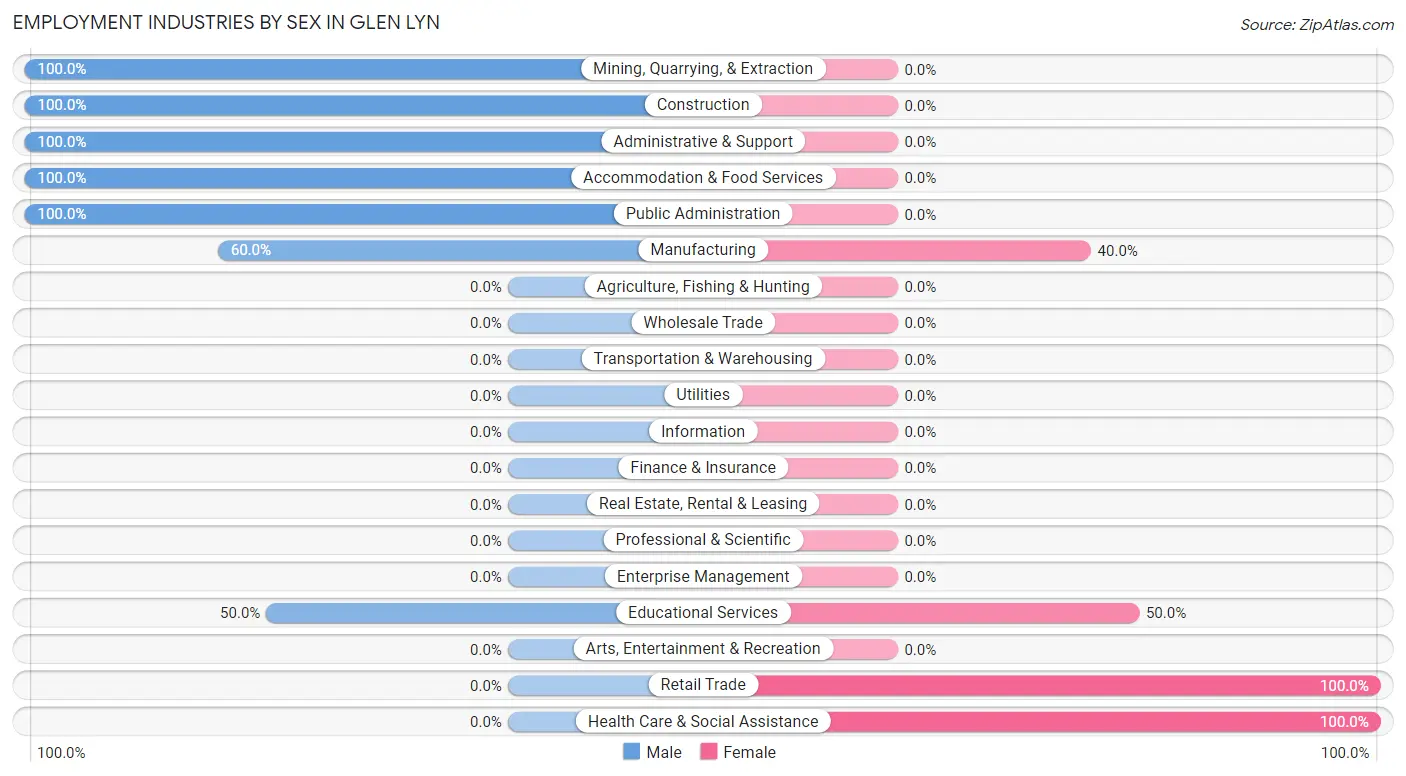
Employment Industries by Sex in Glen Lyn
The Glen Lyn industries that see more men than women are Mining, Quarrying, & Extraction (100.0%), Construction (100.0%), and Administrative & Support (100.0%), whereas the industries that tend to have a higher number of women are Retail Trade (100.0%), Health Care & Social Assistance (100.0%), and Educational Services (50.0%).
| Industry | Male | Female |
| Agriculture, Fishing & Hunting | 0 (0.0%) | 0 (0.0%) |
| Mining, Quarrying, & Extraction | 1 (100.0%) | 0 (0.0%) |
| Construction | 3 (100.0%) | 0 (0.0%) |
| Manufacturing | 3 (60.0%) | 2 (40.0%) |
| Wholesale Trade | 0 (0.0%) | 0 (0.0%) |
| Retail Trade | 0 (0.0%) | 6 (100.0%) |
| Transportation & Warehousing | 0 (0.0%) | 0 (0.0%) |
| Utilities | 0 (0.0%) | 0 (0.0%) |
| Information | 0 (0.0%) | 0 (0.0%) |
| Finance & Insurance | 0 (0.0%) | 0 (0.0%) |
| Real Estate, Rental & Leasing | 0 (0.0%) | 0 (0.0%) |
| Professional & Scientific | 0 (0.0%) | 0 (0.0%) |
| Enterprise Management | 0 (0.0%) | 0 (0.0%) |
| Administrative & Support | 1 (100.0%) | 0 (0.0%) |
| Educational Services | 1 (50.0%) | 1 (50.0%) |
| Health Care & Social Assistance | 0 (0.0%) | 5 (100.0%) |
| Arts, Entertainment & Recreation | 0 (0.0%) | 0 (0.0%) |
| Accommodation & Food Services | 1 (100.0%) | 0 (0.0%) |
| Public Administration | 2 (100.0%) | 0 (0.0%) |
| Total | 14 (46.7%) | 16 (53.3%) |
Education in Glen Lyn
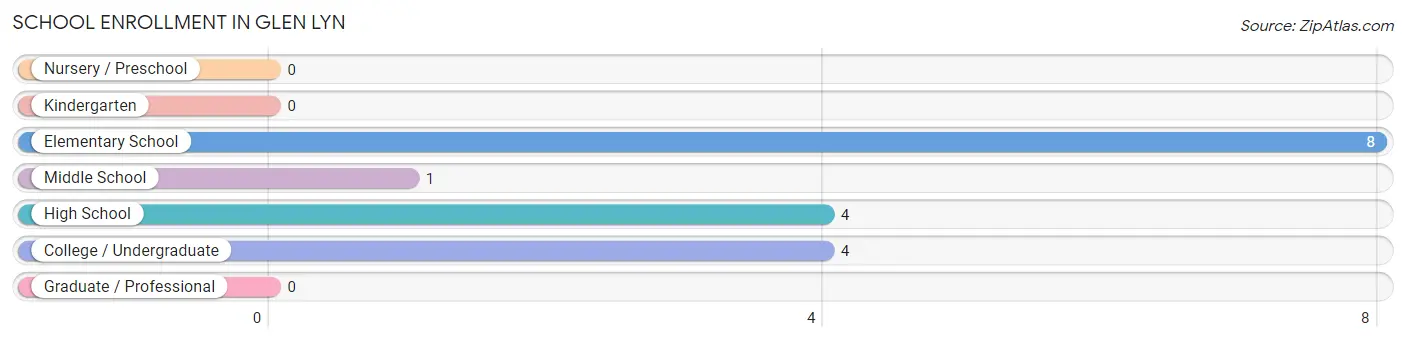
School Enrollment in Glen Lyn
The most common levels of schooling among the 17 students in Glen Lyn are elementary school (8 | 47.1%), high school (4 | 23.5%), and college / undergraduate (4 | 23.5%).
| School Level | # Students | % Students |
| Nursery / Preschool | 0 | 0.0% |
| Kindergarten | 0 | 0.0% |
| Elementary School | 8 | 47.1% |
| Middle School | 1 | 5.9% |
| High School | 4 | 23.5% |
| College / Undergraduate | 4 | 23.5% |
| Graduate / Professional | 0 | 0.0% |
| Total | 17 | 100.0% |
School Enrollment by Age by Funding Source in Glen Lyn
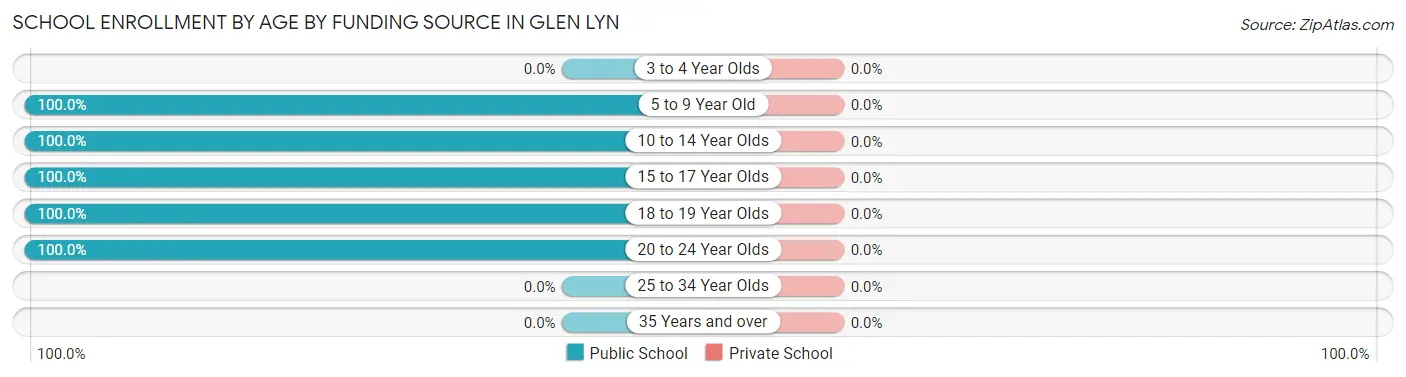
| Age Bracket | Public School | Private School |
| 3 to 4 Year Olds | 0 (0.0%) | 0 (0.0%) |
| 5 to 9 Year Old | 5 (100.0%) | 0 (0.0%) |
| 10 to 14 Year Olds | 4 (100.0%) | 0 (0.0%) |
| 15 to 17 Year Olds | 2 (100.0%) | 0 (0.0%) |
| 18 to 19 Year Olds | 5 (100.0%) | 0 (0.0%) |
| 20 to 24 Year Olds | 1 (100.0%) | 0 (0.0%) |
| 25 to 34 Year Olds | 0 (0.0%) | 0 (0.0%) |
| 35 Years and over | 0 (0.0%) | 0 (0.0%) |
| Total | 17 (100.0%) | 0 (0.0%) |
Educational Attainment by Field of Study in Glen Lyn
, and psychology (1 | 100.0%) are the most common fields of study among 1 individuals in Glen Lyn who have obtained a bachelor's degree or higher.
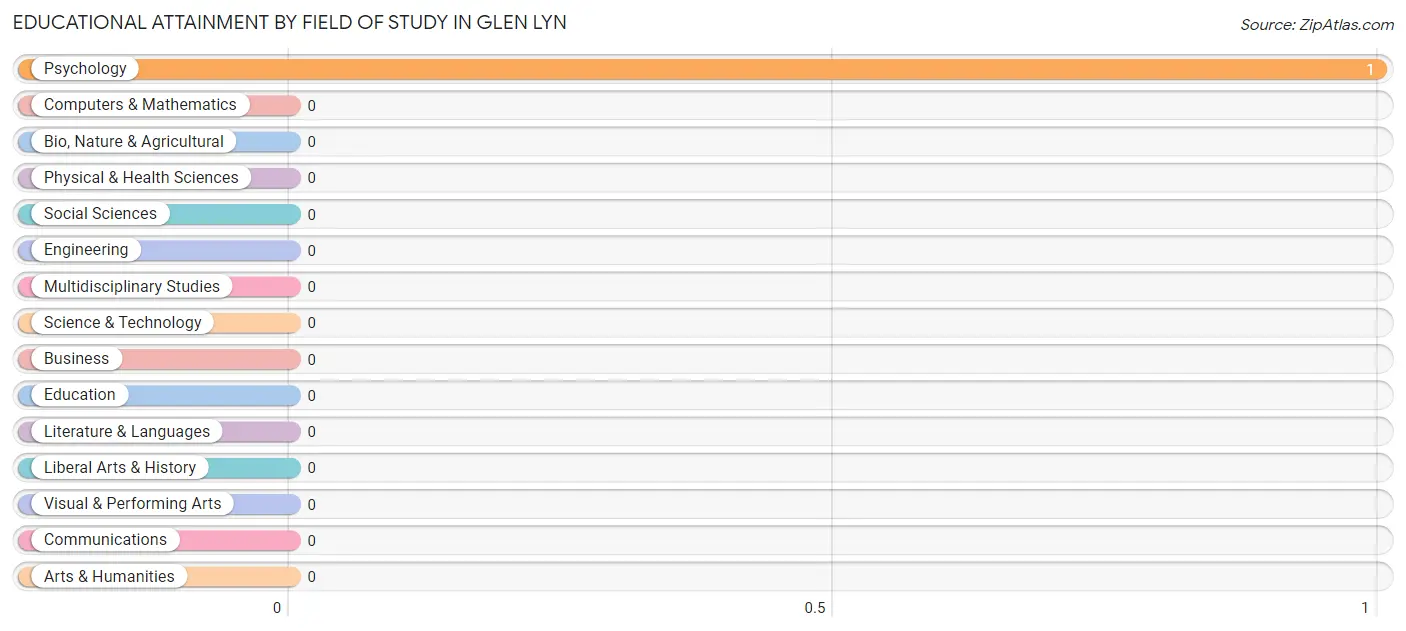
| Field of Study | # Graduates | % Graduates |
| Computers & Mathematics | 0 | 0.0% |
| Bio, Nature & Agricultural | 0 | 0.0% |
| Physical & Health Sciences | 0 | 0.0% |
| Psychology | 1 | 100.0% |
| Social Sciences | 0 | 0.0% |
| Engineering | 0 | 0.0% |
| Multidisciplinary Studies | 0 | 0.0% |
| Science & Technology | 0 | 0.0% |
| Business | 0 | 0.0% |
| Education | 0 | 0.0% |
| Literature & Languages | 0 | 0.0% |
| Liberal Arts & History | 0 | 0.0% |
| Visual & Performing Arts | 0 | 0.0% |
| Communications | 0 | 0.0% |
| Arts & Humanities | 0 | 0.0% |
| Total | 1 | 100.0% |
Transportation & Commute in Glen Lyn
Vehicle Availability by Sex in Glen Lyn
The most prevalent vehicle ownership categories in Glen Lyn are males with 2 vehicles (6, accounting for 46.2%) and females with 2 vehicles (9, making up 37.5%).
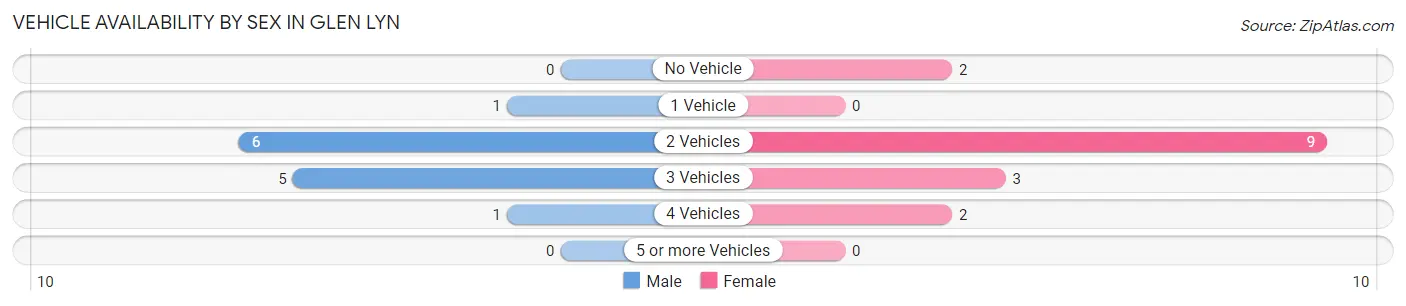
| Vehicles Available | Male | Female |
| No Vehicle | 0 (0.0%) | 2 (12.5%) |
| 1 Vehicle | 1 (7.7%) | 0 (0.0%) |
| 2 Vehicles | 6 (46.2%) | 9 (56.2%) |
| 3 Vehicles | 5 (38.5%) | 3 (18.8%) |
| 4 Vehicles | 1 (7.7%) | 2 (12.5%) |
| 5 or more Vehicles | 0 (0.0%) | 0 (0.0%) |
| Total | 13 (100.0%) | 16 (100.0%) |
Commute Time in Glen Lyn
The most frequently occuring commute durations in Glen Lyn are 45 to 59 minutes (9 commuters, 31.0%), 20 to 24 minutes (6 commuters, 20.7%), and 15 to 19 minutes (5 commuters, 17.2%).
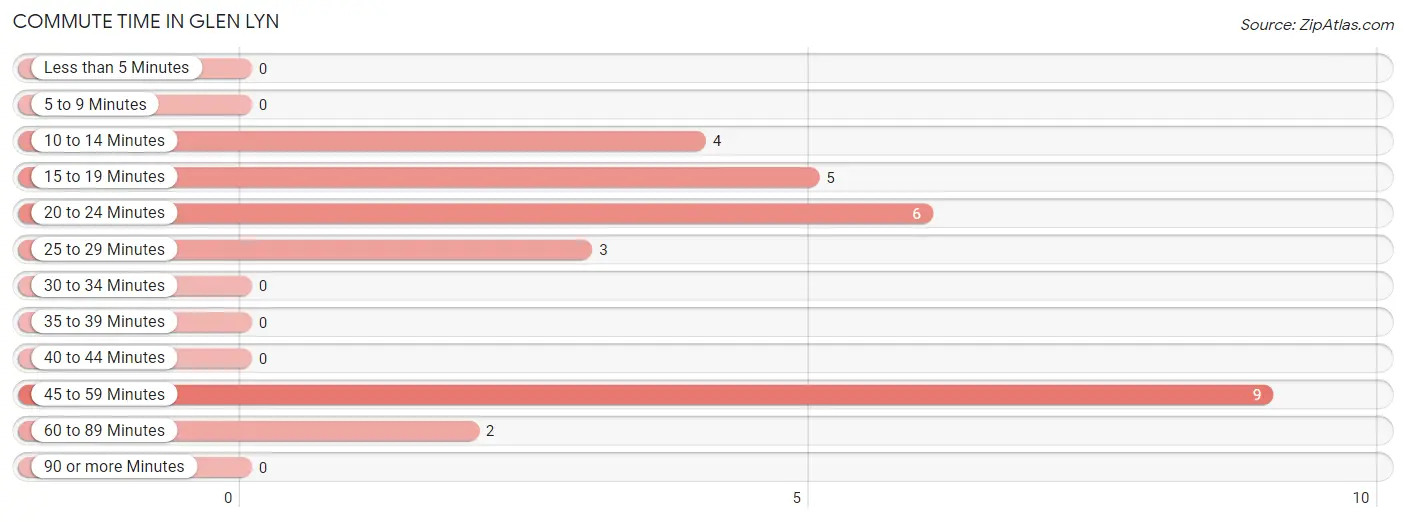
| Commute Time | # Commuters | % Commuters |
| Less than 5 Minutes | 0 | 0.0% |
| 5 to 9 Minutes | 0 | 0.0% |
| 10 to 14 Minutes | 4 | 13.8% |
| 15 to 19 Minutes | 5 | 17.2% |
| 20 to 24 Minutes | 6 | 20.7% |
| 25 to 29 Minutes | 3 | 10.3% |
| 30 to 34 Minutes | 0 | 0.0% |
| 35 to 39 Minutes | 0 | 0.0% |
| 40 to 44 Minutes | 0 | 0.0% |
| 45 to 59 Minutes | 9 | 31.0% |
| 60 to 89 Minutes | 2 | 6.9% |
| 90 or more Minutes | 0 | 0.0% |
Commute Time by Sex in Glen Lyn
The most common commute times in Glen Lyn are 45 to 59 minutes (6 commuters, 46.2%) for males and 15 to 19 minutes (5 commuters, 31.2%) for females.
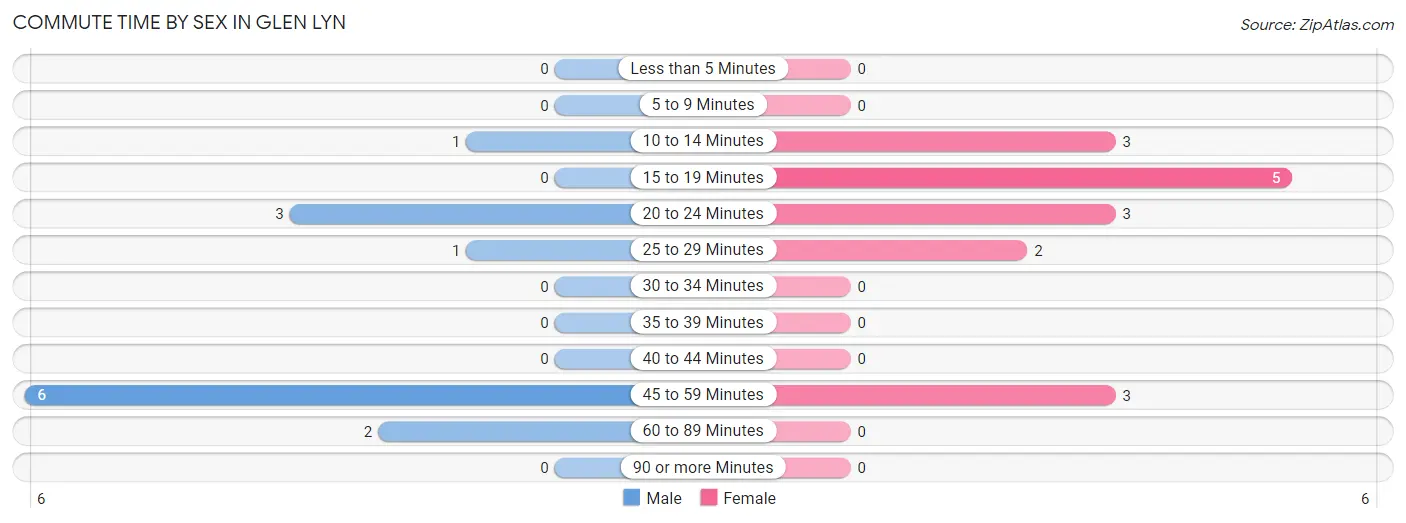
| Commute Time | Male | Female |
| Less than 5 Minutes | 0 (0.0%) | 0 (0.0%) |
| 5 to 9 Minutes | 0 (0.0%) | 0 (0.0%) |
| 10 to 14 Minutes | 1 (7.7%) | 3 (18.8%) |
| 15 to 19 Minutes | 0 (0.0%) | 5 (31.2%) |
| 20 to 24 Minutes | 3 (23.1%) | 3 (18.8%) |
| 25 to 29 Minutes | 1 (7.7%) | 2 (12.5%) |
| 30 to 34 Minutes | 0 (0.0%) | 0 (0.0%) |
| 35 to 39 Minutes | 0 (0.0%) | 0 (0.0%) |
| 40 to 44 Minutes | 0 (0.0%) | 0 (0.0%) |
| 45 to 59 Minutes | 6 (46.2%) | 3 (18.8%) |
| 60 to 89 Minutes | 2 (15.4%) | 0 (0.0%) |
| 90 or more Minutes | 0 (0.0%) | 0 (0.0%) |
Time of Departure to Work by Sex in Glen Lyn
The most frequent times of departure to work in Glen Lyn are 6:30 AM to 6:59 AM (3, 23.1%) for males and 7:30 AM to 7:59 AM (5, 31.2%) for females.
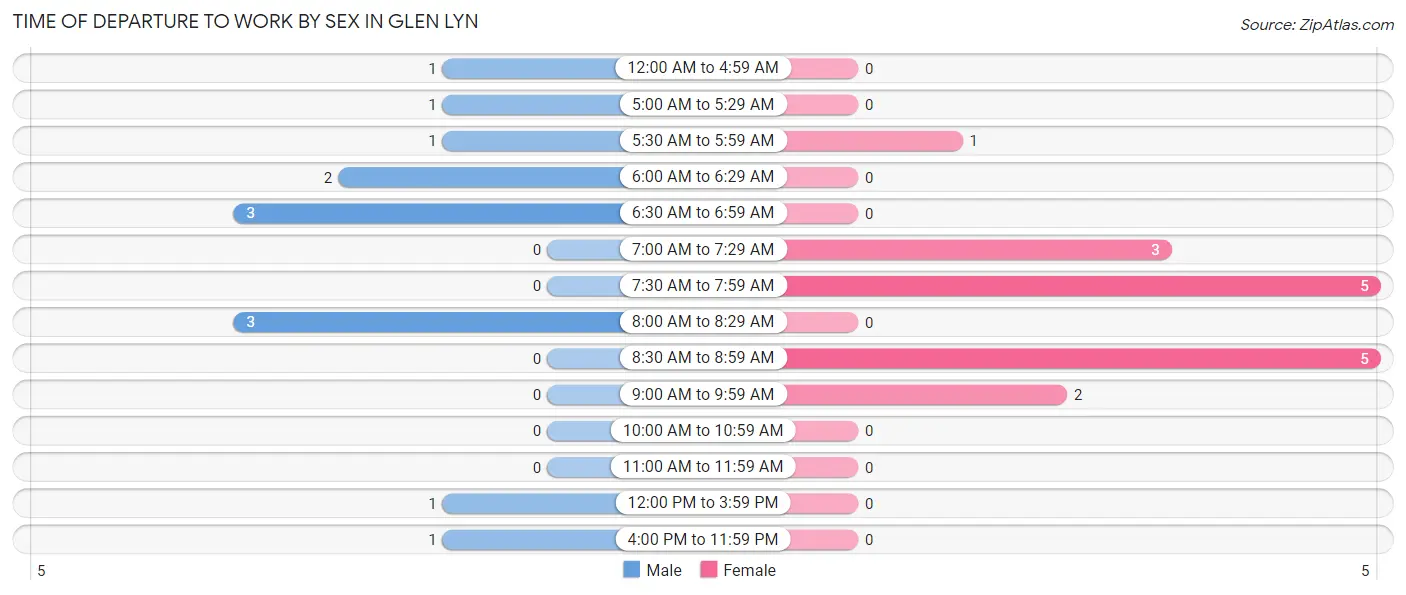
| Time of Departure | Male | Female |
| 12:00 AM to 4:59 AM | 1 (7.7%) | 0 (0.0%) |
| 5:00 AM to 5:29 AM | 1 (7.7%) | 0 (0.0%) |
| 5:30 AM to 5:59 AM | 1 (7.7%) | 1 (6.2%) |
| 6:00 AM to 6:29 AM | 2 (15.4%) | 0 (0.0%) |
| 6:30 AM to 6:59 AM | 3 (23.1%) | 0 (0.0%) |
| 7:00 AM to 7:29 AM | 0 (0.0%) | 3 (18.8%) |
| 7:30 AM to 7:59 AM | 0 (0.0%) | 5 (31.2%) |
| 8:00 AM to 8:29 AM | 3 (23.1%) | 0 (0.0%) |
| 8:30 AM to 8:59 AM | 0 (0.0%) | 5 (31.2%) |
| 9:00 AM to 9:59 AM | 0 (0.0%) | 2 (12.5%) |
| 10:00 AM to 10:59 AM | 0 (0.0%) | 0 (0.0%) |
| 11:00 AM to 11:59 AM | 0 (0.0%) | 0 (0.0%) |
| 12:00 PM to 3:59 PM | 1 (7.7%) | 0 (0.0%) |
| 4:00 PM to 11:59 PM | 1 (7.7%) | 0 (0.0%) |
| Total | 13 (100.0%) | 16 (100.0%) |
Housing Occupancy in Glen Lyn
Occupancy by Ownership in Glen Lyn
Of the total 29 dwellings in Glen Lyn, owner-occupied units account for 23 (79.3%), while renter-occupied units make up 6 (20.7%).
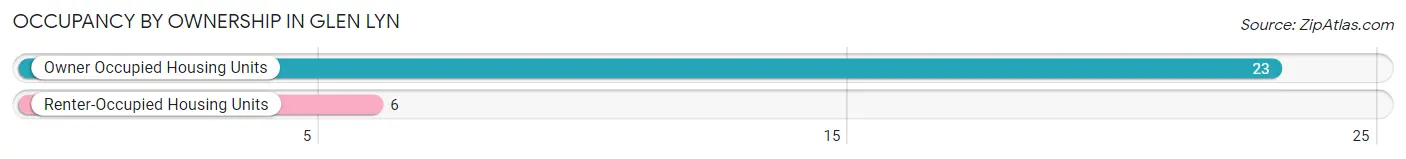
| Occupancy | # Housing Units | % Housing Units |
| Owner Occupied Housing Units | 23 | 79.3% |
| Renter-Occupied Housing Units | 6 | 20.7% |
| Total Occupied Housing Units | 29 | 100.0% |
Occupancy by Household Size in Glen Lyn
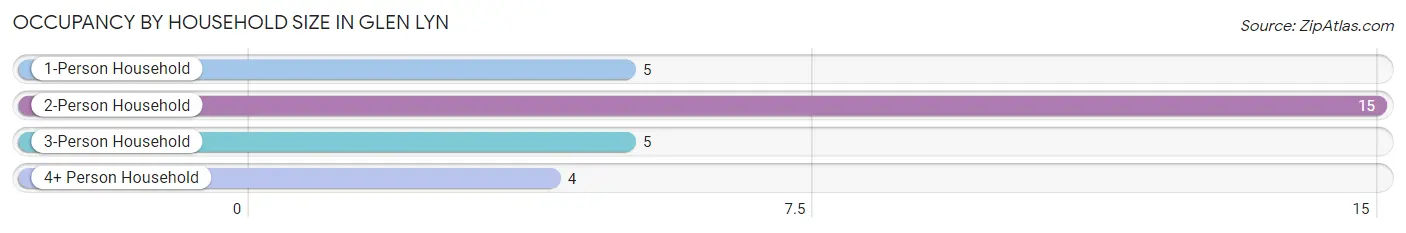
| Household Size | # Housing Units | % Housing Units |
| 1-Person Household | 5 | 17.2% |
| 2-Person Household | 15 | 51.7% |
| 3-Person Household | 5 | 17.2% |
| 4+ Person Household | 4 | 13.8% |
| Total Housing Units | 29 | 100.0% |
Occupancy by Ownership by Household Size in Glen Lyn
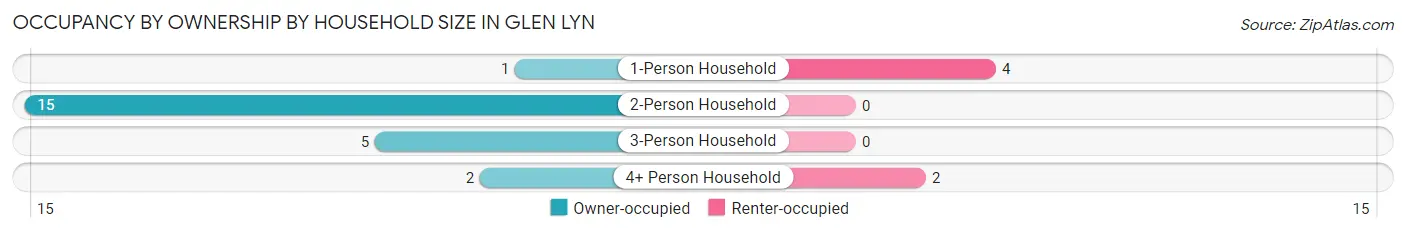
| Household Size | Owner-occupied | Renter-occupied |
| 1-Person Household | 1 (20.0%) | 4 (80.0%) |
| 2-Person Household | 15 (100.0%) | 0 (0.0%) |
| 3-Person Household | 5 (100.0%) | 0 (0.0%) |
| 4+ Person Household | 2 (50.0%) | 2 (50.0%) |
| Total Housing Units | 23 (79.3%) | 6 (20.7%) |
Occupancy by Educational Attainment in Glen Lyn
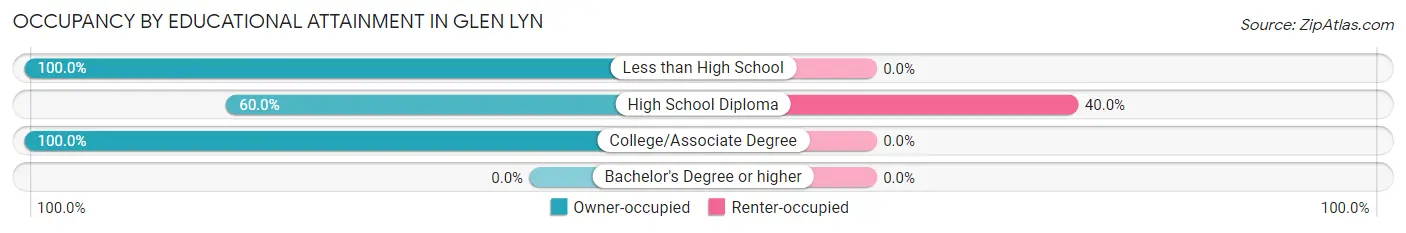
| Household Size | Owner-occupied | Renter-occupied |
| Less than High School | 2 (100.0%) | 0 (0.0%) |
| High School Diploma | 9 (60.0%) | 6 (40.0%) |
| College/Associate Degree | 12 (100.0%) | 0 (0.0%) |
| Bachelor's Degree or higher | 0 (0.0%) | 0 (0.0%) |
Occupancy by Age of Householder in Glen Lyn
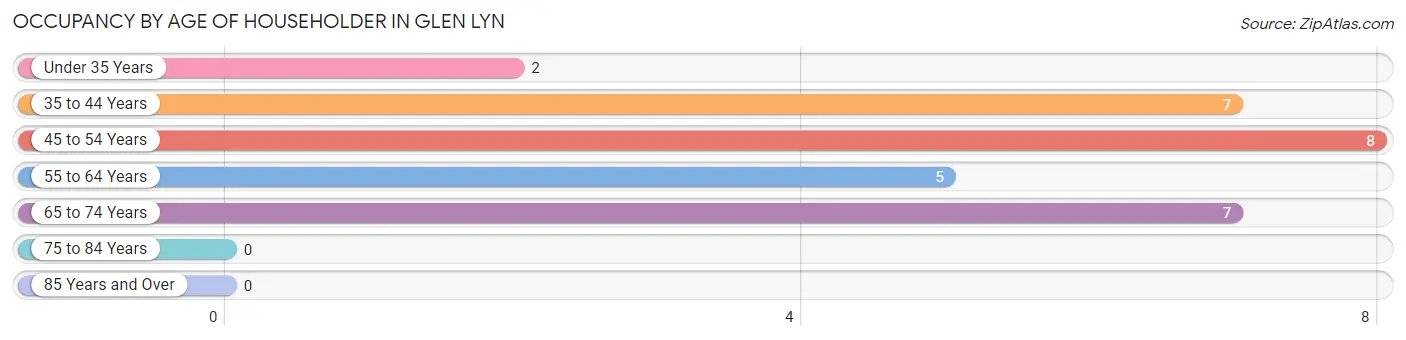
| Age Bracket | # Households | % Households |
| Under 35 Years | 2 | 6.9% |
| 35 to 44 Years | 7 | 24.1% |
| 45 to 54 Years | 8 | 27.6% |
| 55 to 64 Years | 5 | 17.2% |
| 65 to 74 Years | 7 | 24.1% |
| 75 to 84 Years | 0 | 0.0% |
| 85 Years and Over | 0 | 0.0% |
| Total | 29 | 100.0% |
Housing Finances in Glen Lyn
Median Income by Occupancy in Glen Lyn
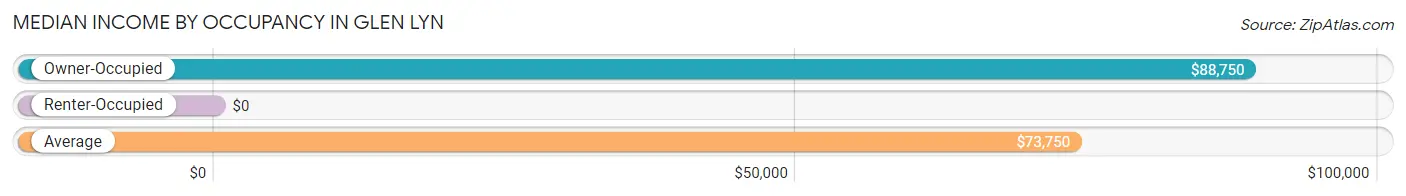
| Occupancy Type | # Households | Median Income |
| Owner-Occupied | 23 (79.3%) | $88,750 |
| Renter-Occupied | 6 (20.7%) | $0 |
| Average | 29 (100.0%) | $73,750 |
Occupancy by Householder Income Bracket in Glen Lyn
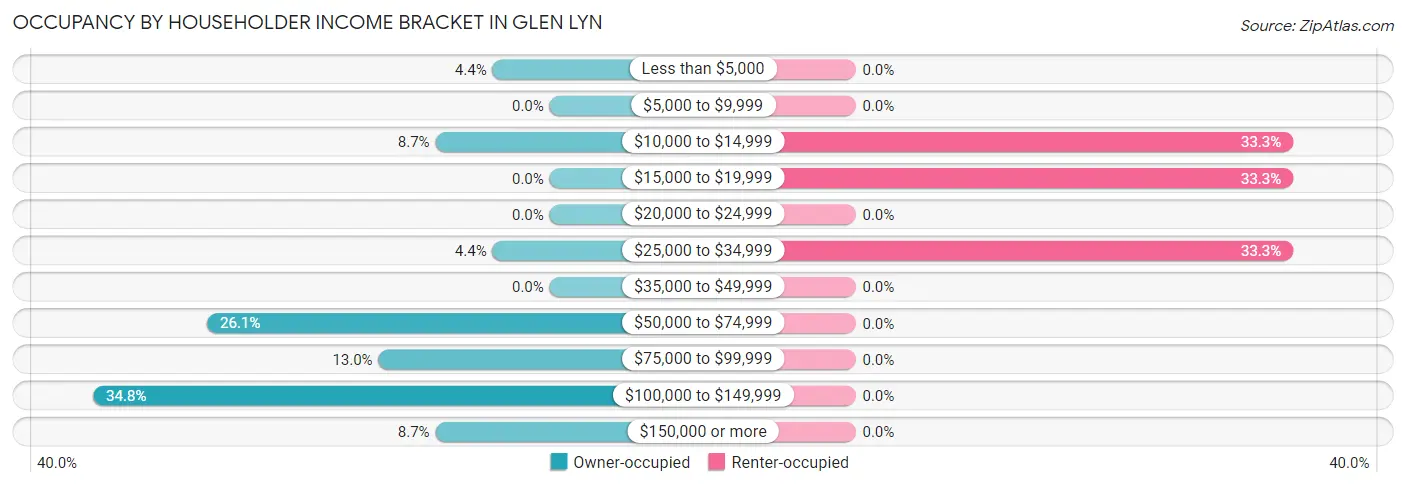
| Income Bracket | Owner-occupied | Renter-occupied |
| Less than $5,000 | 1 (4.3%) | 0 (0.0%) |
| $5,000 to $9,999 | 0 (0.0%) | 0 (0.0%) |
| $10,000 to $14,999 | 2 (8.7%) | 2 (33.3%) |
| $15,000 to $19,999 | 0 (0.0%) | 2 (33.3%) |
| $20,000 to $24,999 | 0 (0.0%) | 0 (0.0%) |
| $25,000 to $34,999 | 1 (4.3%) | 2 (33.3%) |
| $35,000 to $49,999 | 0 (0.0%) | 0 (0.0%) |
| $50,000 to $74,999 | 6 (26.1%) | 0 (0.0%) |
| $75,000 to $99,999 | 3 (13.0%) | 0 (0.0%) |
| $100,000 to $149,999 | 8 (34.8%) | 0 (0.0%) |
| $150,000 or more | 2 (8.7%) | 0 (0.0%) |
| Total | 23 (100.0%) | 6 (100.0%) |
Monthly Housing Cost Tiers in Glen Lyn
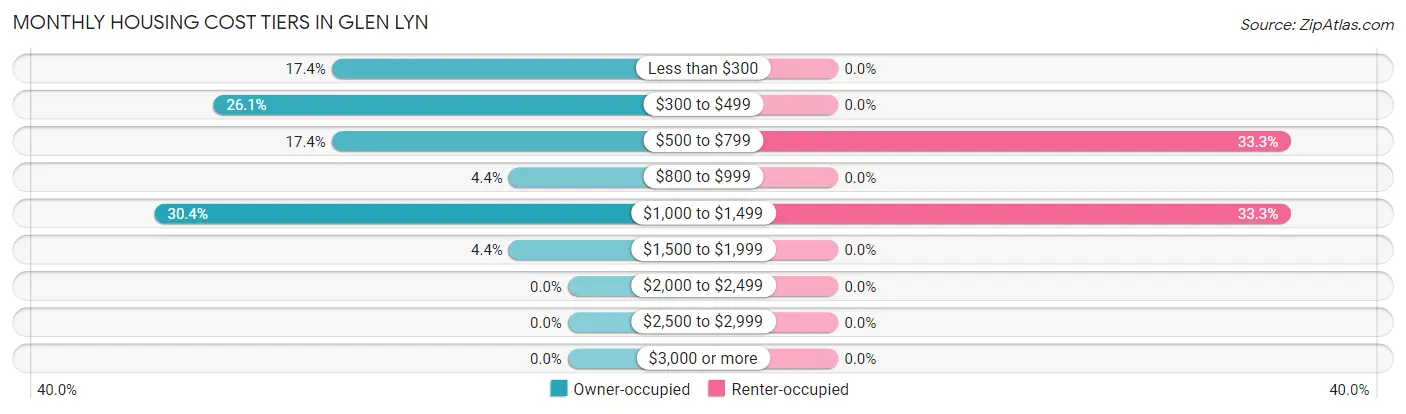
| Monthly Cost | Owner-occupied | Renter-occupied |
| Less than $300 | 4 (17.4%) | 0 (0.0%) |
| $300 to $499 | 6 (26.1%) | 0 (0.0%) |
| $500 to $799 | 4 (17.4%) | 2 (33.3%) |
| $800 to $999 | 1 (4.3%) | 0 (0.0%) |
| $1,000 to $1,499 | 7 (30.4%) | 2 (33.3%) |
| $1,500 to $1,999 | 1 (4.3%) | 0 (0.0%) |
| $2,000 to $2,499 | 0 (0.0%) | 0 (0.0%) |
| $2,500 to $2,999 | 0 (0.0%) | 0 (0.0%) |
| $3,000 or more | 0 (0.0%) | 0 (0.0%) |
| Total | 23 (100.0%) | 6 (100.0%) |
Physical Housing Characteristics in Glen Lyn
Housing Structures in Glen Lyn
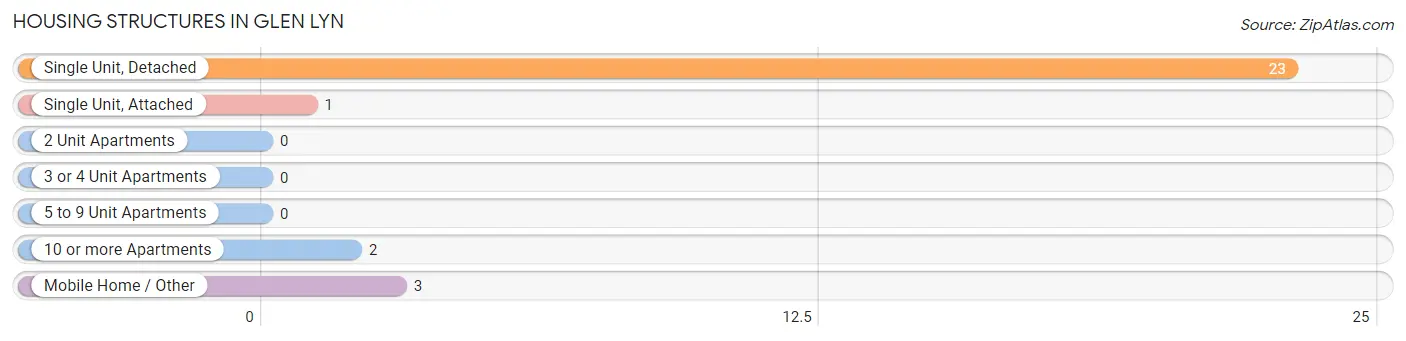
| Structure Type | # Housing Units | % Housing Units |
| Single Unit, Detached | 23 | 79.3% |
| Single Unit, Attached | 1 | 3.5% |
| 2 Unit Apartments | 0 | 0.0% |
| 3 or 4 Unit Apartments | 0 | 0.0% |
| 5 to 9 Unit Apartments | 0 | 0.0% |
| 10 or more Apartments | 2 | 6.9% |
| Mobile Home / Other | 3 | 10.3% |
| Total | 29 | 100.0% |
Housing Structures by Occupancy in Glen Lyn
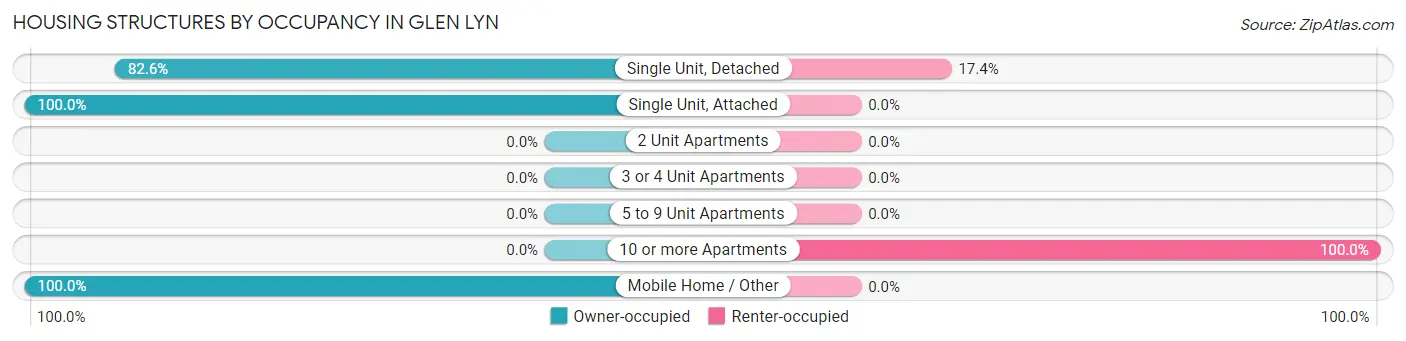
| Structure Type | Owner-occupied | Renter-occupied |
| Single Unit, Detached | 19 (82.6%) | 4 (17.4%) |
| Single Unit, Attached | 1 (100.0%) | 0 (0.0%) |
| 2 Unit Apartments | 0 (0.0%) | 0 (0.0%) |
| 3 or 4 Unit Apartments | 0 (0.0%) | 0 (0.0%) |
| 5 to 9 Unit Apartments | 0 (0.0%) | 0 (0.0%) |
| 10 or more Apartments | 0 (0.0%) | 2 (100.0%) |
| Mobile Home / Other | 3 (100.0%) | 0 (0.0%) |
| Total | 23 (79.3%) | 6 (20.7%) |
Housing Structures by Number of Rooms in Glen Lyn
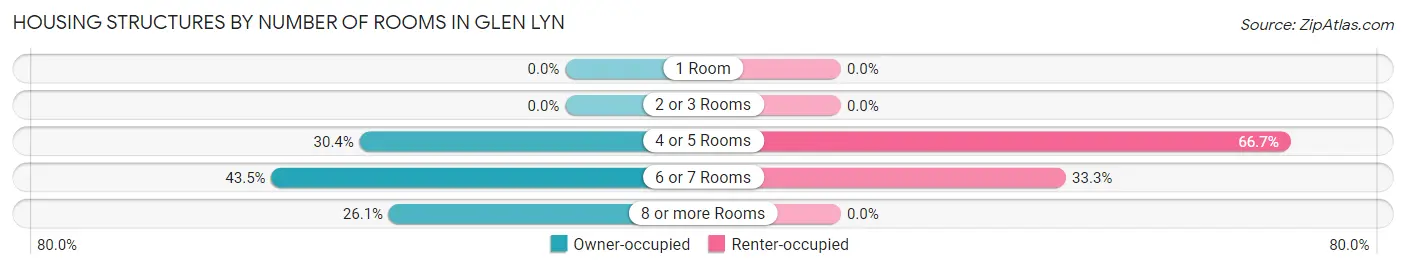
| Number of Rooms | Owner-occupied | Renter-occupied |
| 1 Room | 0 (0.0%) | 0 (0.0%) |
| 2 or 3 Rooms | 0 (0.0%) | 0 (0.0%) |
| 4 or 5 Rooms | 7 (30.4%) | 4 (66.7%) |
| 6 or 7 Rooms | 10 (43.5%) | 2 (33.3%) |
| 8 or more Rooms | 6 (26.1%) | 0 (0.0%) |
| Total | 23 (100.0%) | 6 (100.0%) |
Housing Structure by Heating Type in Glen Lyn
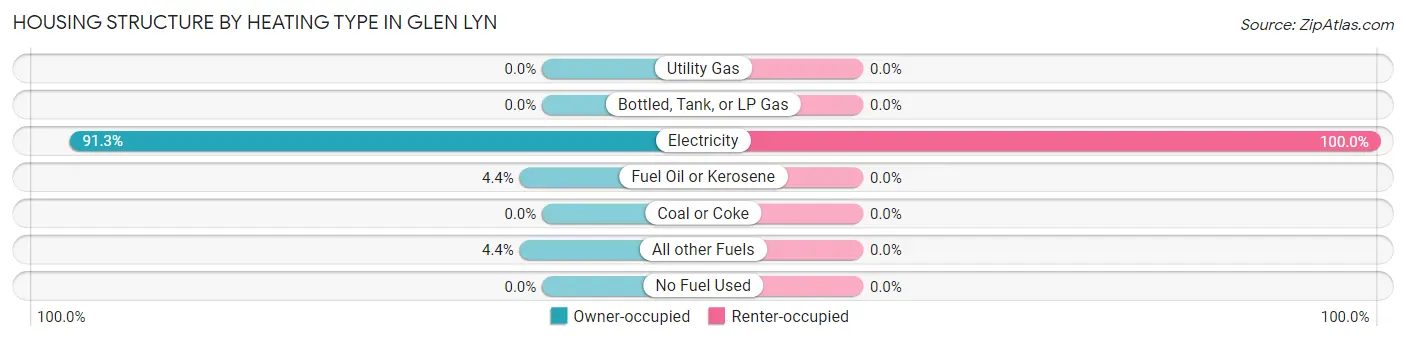
| Heating Type | Owner-occupied | Renter-occupied |
| Utility Gas | 0 (0.0%) | 0 (0.0%) |
| Bottled, Tank, or LP Gas | 0 (0.0%) | 0 (0.0%) |
| Electricity | 21 (91.3%) | 6 (100.0%) |
| Fuel Oil or Kerosene | 1 (4.3%) | 0 (0.0%) |
| Coal or Coke | 0 (0.0%) | 0 (0.0%) |
| All other Fuels | 1 (4.3%) | 0 (0.0%) |
| No Fuel Used | 0 (0.0%) | 0 (0.0%) |
| Total | 23 (100.0%) | 6 (100.0%) |
Household Vehicle Usage in Glen Lyn
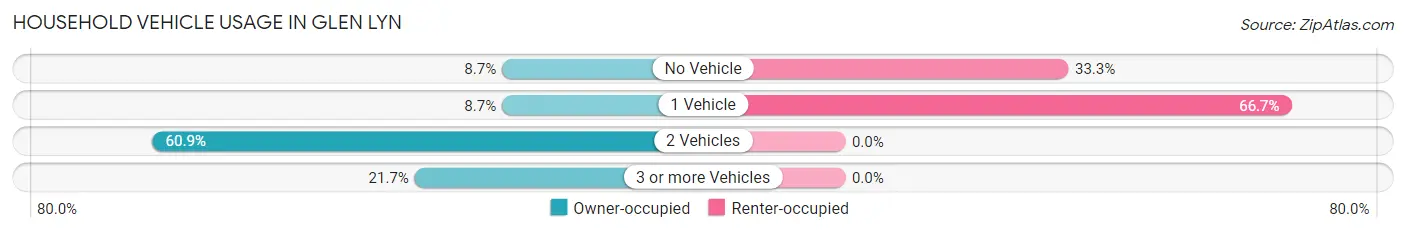
| Vehicles per Household | Owner-occupied | Renter-occupied |
| No Vehicle | 2 (8.7%) | 2 (33.3%) |
| 1 Vehicle | 2 (8.7%) | 4 (66.7%) |
| 2 Vehicles | 14 (60.9%) | 0 (0.0%) |
| 3 or more Vehicles | 5 (21.7%) | 0 (0.0%) |
| Total | 23 (100.0%) | 6 (100.0%) |
Real Estate & Mortgages in Glen Lyn
Real Estate and Mortgage Overview in Glen Lyn
| Characteristic | Without Mortgage | With Mortgage |
| Housing Units | 14 | 9 |
| Median Property Value | $112,500 | $0 |
| Median Household Income | $96,250 | $0 |
| Monthly Housing Costs | $388 | $0 |
| Real Estate Taxes | - | - |
Property Value by Mortgage Status in Glen Lyn
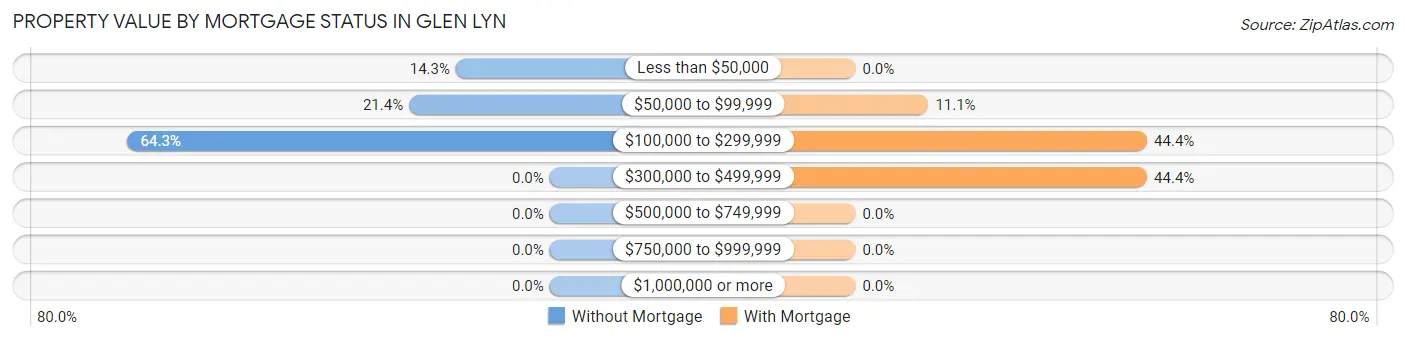
| Property Value | Without Mortgage | With Mortgage |
| Less than $50,000 | 2 (14.3%) | 0 (0.0%) |
| $50,000 to $99,999 | 3 (21.4%) | 1 (11.1%) |
| $100,000 to $299,999 | 9 (64.3%) | 4 (44.4%) |
| $300,000 to $499,999 | 0 (0.0%) | 4 (44.4%) |
| $500,000 to $749,999 | 0 (0.0%) | 0 (0.0%) |
| $750,000 to $999,999 | 0 (0.0%) | 0 (0.0%) |
| $1,000,000 or more | 0 (0.0%) | 0 (0.0%) |
| Total | 14 (100.0%) | 9 (100.0%) |
Household Income by Mortgage Status in Glen Lyn
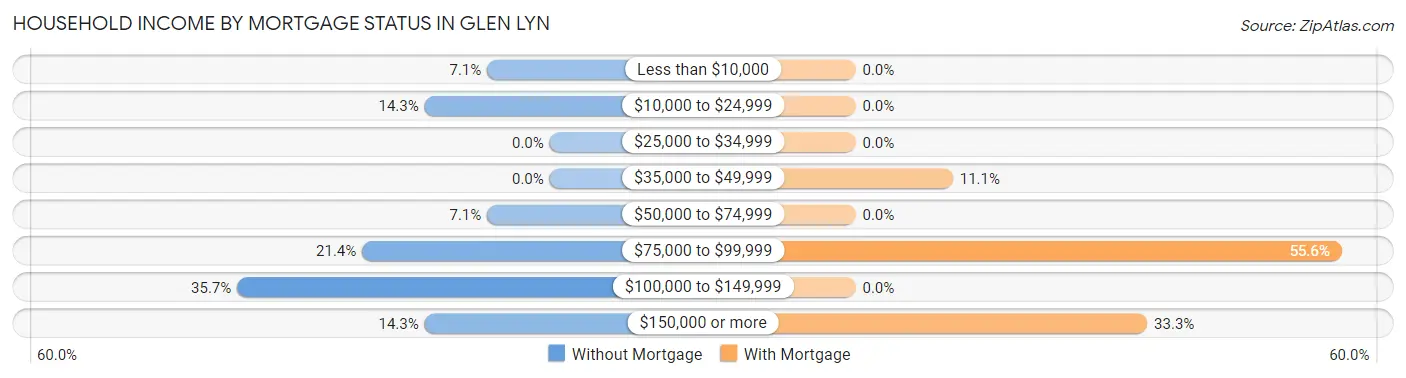
| Household Income | Without Mortgage | With Mortgage |
| Less than $10,000 | 1 (7.1%) | 0 (0.0%) |
| $10,000 to $24,999 | 2 (14.3%) | 0 (0.0%) |
| $25,000 to $34,999 | 0 (0.0%) | 0 (0.0%) |
| $35,000 to $49,999 | 0 (0.0%) | 1 (11.1%) |
| $50,000 to $74,999 | 1 (7.1%) | 0 (0.0%) |
| $75,000 to $99,999 | 3 (21.4%) | 5 (55.6%) |
| $100,000 to $149,999 | 5 (35.7%) | 0 (0.0%) |
| $150,000 or more | 2 (14.3%) | 3 (33.3%) |
| Total | 14 (100.0%) | 9 (100.0%) |
Property Value to Household Income Ratio in Glen Lyn
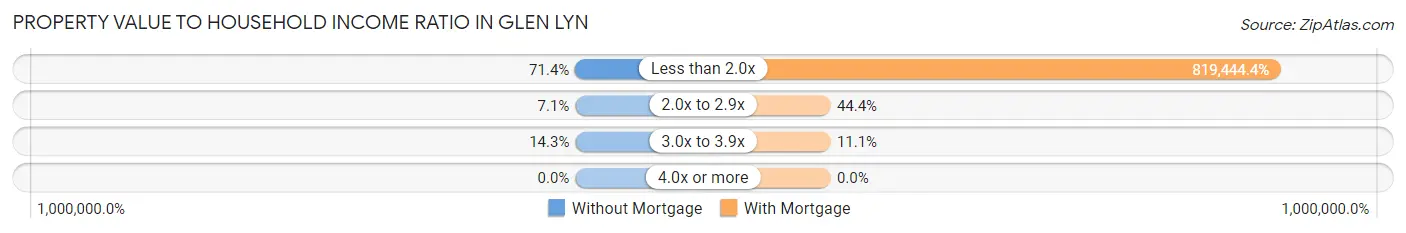
| Value-to-Income Ratio | Without Mortgage | With Mortgage |
| Less than 2.0x | 10 (71.4%) | 73,750 (819,444.4%) |
| 2.0x to 2.9x | 1 (7.1%) | 4 (44.4%) |
| 3.0x to 3.9x | 2 (14.3%) | 1 (11.1%) |
| 4.0x or more | 0 (0.0%) | 0 (0.0%) |
| Total | 14 (100.0%) | 9 (100.0%) |
Real Estate Taxes by Mortgage Status in Glen Lyn
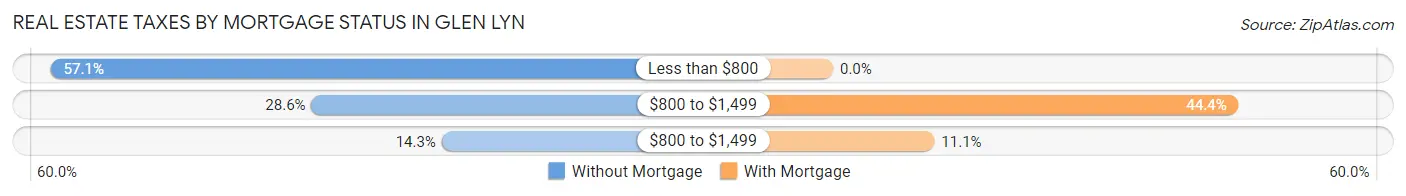
| Property Taxes | Without Mortgage | With Mortgage |
| Less than $800 | 8 (57.1%) | 0 (0.0%) |
| $800 to $1,499 | 4 (28.6%) | 4 (44.4%) |
| $800 to $1,499 | 2 (14.3%) | 1 (11.1%) |
| Total | 14 (100.0%) | 9 (100.0%) |
Health & Disability in Glen Lyn
Health Insurance Coverage by Age in Glen Lyn
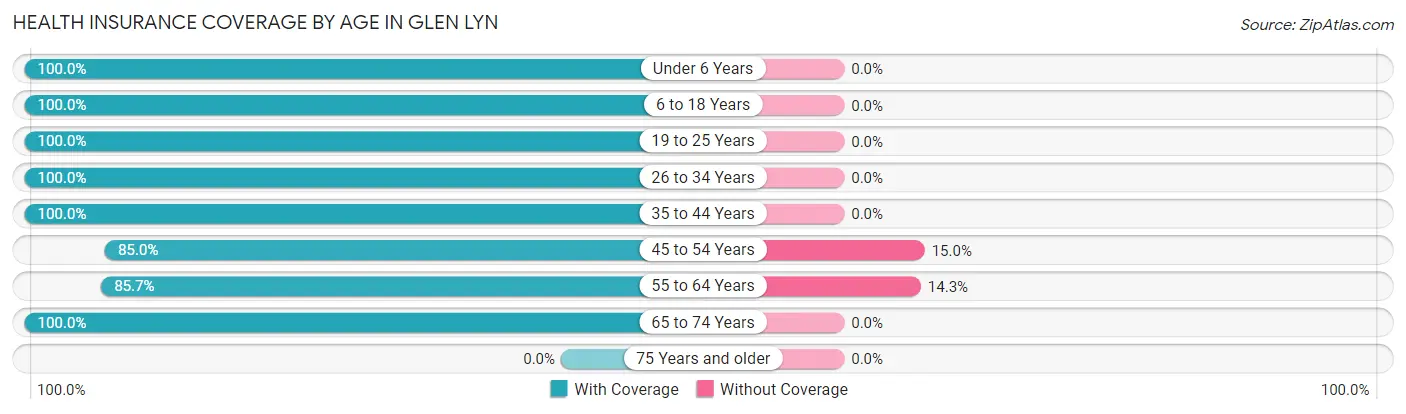
| Age Bracket | With Coverage | Without Coverage |
| Under 6 Years | 7 (100.0%) | 0 (0.0%) |
| 6 to 18 Years | 13 (100.0%) | 0 (0.0%) |
| 19 to 25 Years | 5 (100.0%) | 0 (0.0%) |
| 26 to 34 Years | 2 (100.0%) | 0 (0.0%) |
| 35 to 44 Years | 9 (100.0%) | 0 (0.0%) |
| 45 to 54 Years | 17 (85.0%) | 3 (15.0%) |
| 55 to 64 Years | 12 (85.7%) | 2 (14.3%) |
| 65 to 74 Years | 8 (100.0%) | 0 (0.0%) |
| 75 Years and older | 0 (0.0%) | 0 (0.0%) |
| Total | 73 (93.6%) | 5 (6.4%) |
Health Insurance Coverage by Citizenship Status in Glen Lyn
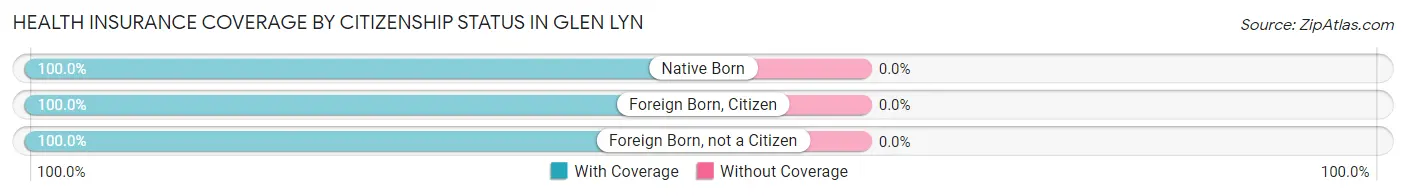
| Citizenship Status | With Coverage | Without Coverage |
| Native Born | 7 (100.0%) | 0 (0.0%) |
| Foreign Born, Citizen | 13 (100.0%) | 0 (0.0%) |
| Foreign Born, not a Citizen | 5 (100.0%) | 0 (0.0%) |
Health Insurance Coverage by Household Income in Glen Lyn
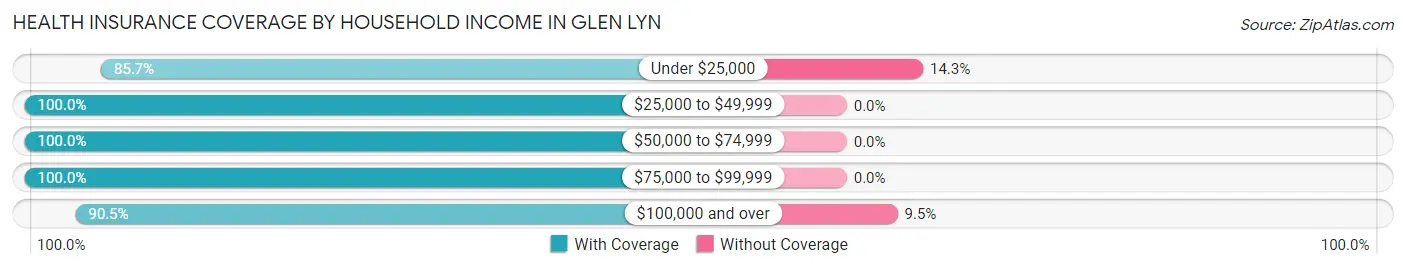
| Household Income | With Coverage | Without Coverage |
| Under $25,000 | 18 (85.7%) | 3 (14.3%) |
| $25,000 to $49,999 | 11 (100.0%) | 0 (0.0%) |
| $50,000 to $74,999 | 14 (100.0%) | 0 (0.0%) |
| $75,000 to $99,999 | 11 (100.0%) | 0 (0.0%) |
| $100,000 and over | 19 (90.5%) | 2 (9.5%) |
Public vs Private Health Insurance Coverage by Age in Glen Lyn
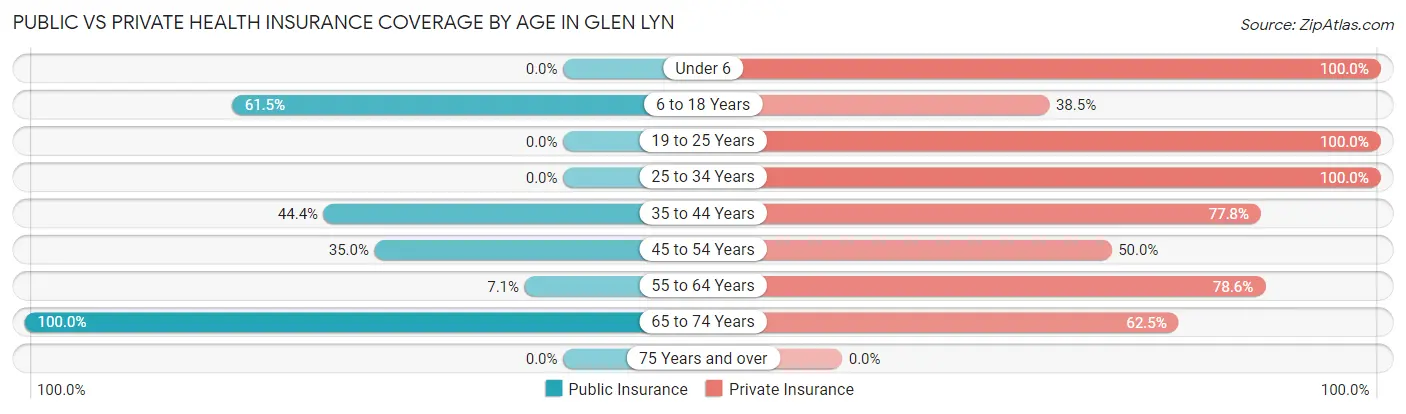
| Age Bracket | Public Insurance | Private Insurance |
| Under 6 | 0 (0.0%) | 7 (100.0%) |
| 6 to 18 Years | 8 (61.5%) | 5 (38.5%) |
| 19 to 25 Years | 0 (0.0%) | 5 (100.0%) |
| 25 to 34 Years | 0 (0.0%) | 2 (100.0%) |
| 35 to 44 Years | 4 (44.4%) | 7 (77.8%) |
| 45 to 54 Years | 7 (35.0%) | 10 (50.0%) |
| 55 to 64 Years | 1 (7.1%) | 11 (78.6%) |
| 65 to 74 Years | 8 (100.0%) | 5 (62.5%) |
| 75 Years and over | 0 (0.0%) | 0 (0.0%) |
| Total | 28 (35.9%) | 52 (66.7%) |
Disability Status by Sex by Age in Glen Lyn
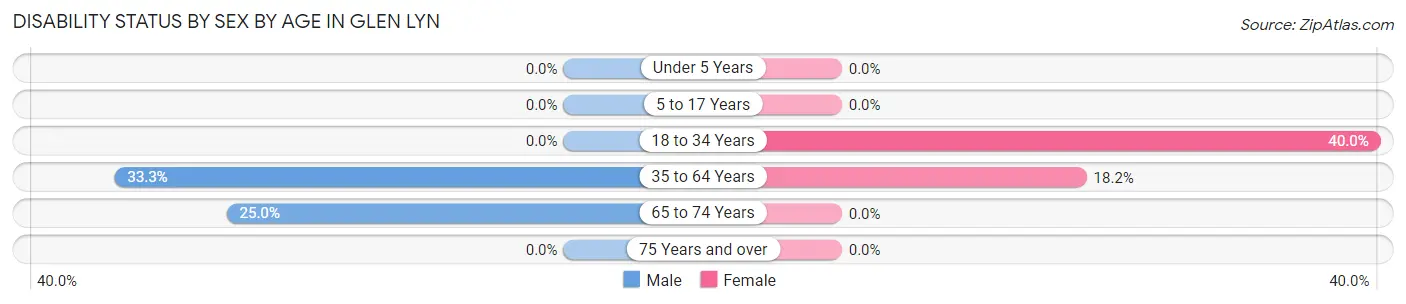
| Age Bracket | Male | Female |
| Under 5 Years | 0 (0.0%) | 0 (0.0%) |
| 5 to 17 Years | 0 (0.0%) | 0 (0.0%) |
| 18 to 34 Years | 0 (0.0%) | 2 (40.0%) |
| 35 to 64 Years | 7 (33.3%) | 4 (18.2%) |
| 65 to 74 Years | 2 (25.0%) | 0 (0.0%) |
| 75 Years and over | 0 (0.0%) | 0 (0.0%) |
Disability Class by Sex by Age in Glen Lyn
Disability Class: Hearing Difficulty
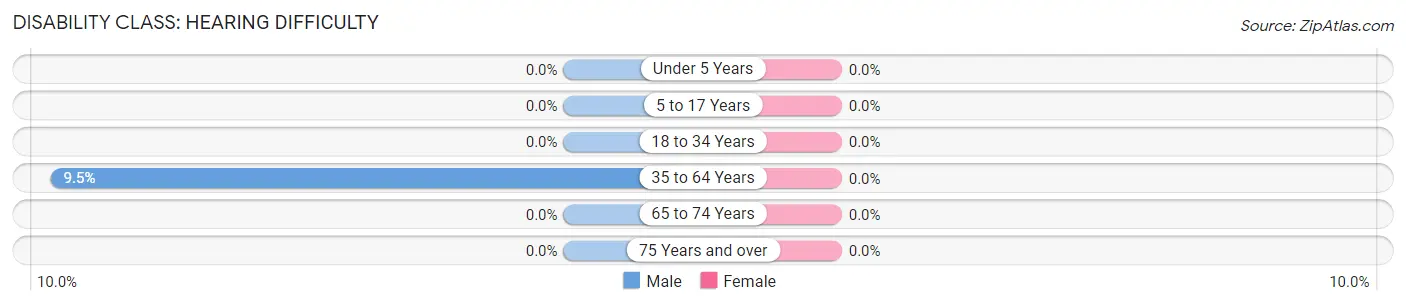
| Age Bracket | Male | Female |
| Under 5 Years | 0 (0.0%) | 0 (0.0%) |
| 5 to 17 Years | 0 (0.0%) | 0 (0.0%) |
| 18 to 34 Years | 0 (0.0%) | 0 (0.0%) |
| 35 to 64 Years | 2 (9.5%) | 0 (0.0%) |
| 65 to 74 Years | 0 (0.0%) | 0 (0.0%) |
| 75 Years and over | 0 (0.0%) | 0 (0.0%) |
Disability Class: Vision Difficulty
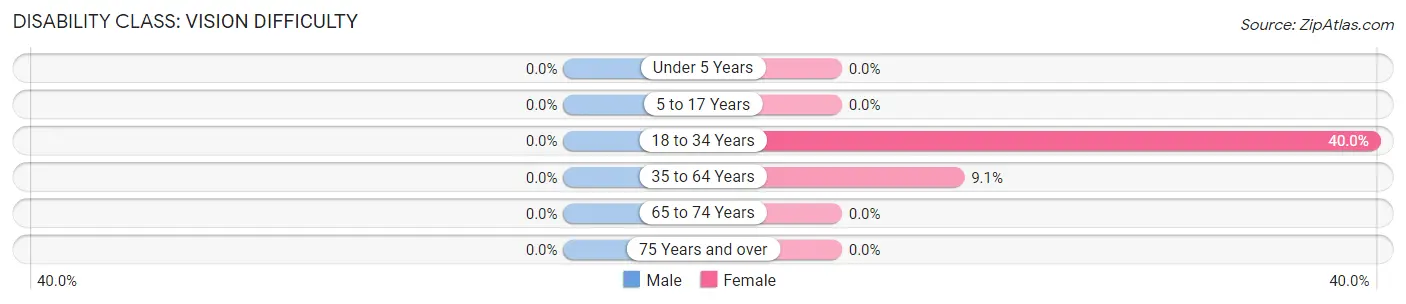
| Age Bracket | Male | Female |
| Under 5 Years | 0 (0.0%) | 0 (0.0%) |
| 5 to 17 Years | 0 (0.0%) | 0 (0.0%) |
| 18 to 34 Years | 0 (0.0%) | 2 (40.0%) |
| 35 to 64 Years | 0 (0.0%) | 2 (9.1%) |
| 65 to 74 Years | 0 (0.0%) | 0 (0.0%) |
| 75 Years and over | 0 (0.0%) | 0 (0.0%) |
Disability Class: Cognitive Difficulty
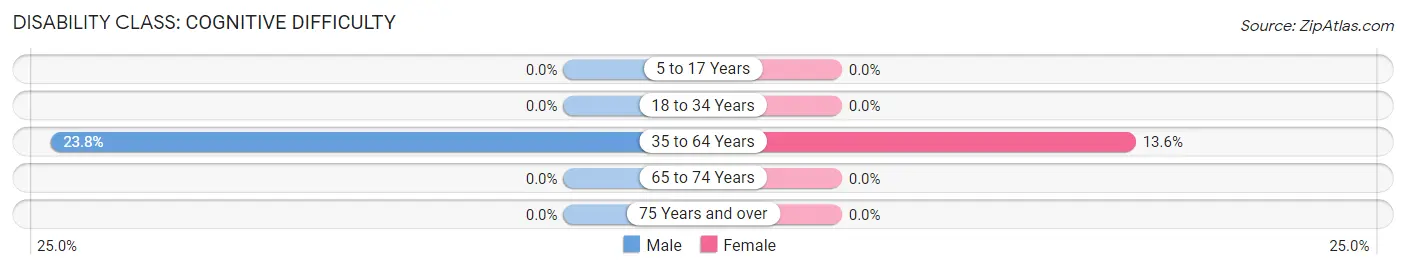
| Age Bracket | Male | Female |
| 5 to 17 Years | 0 (0.0%) | 0 (0.0%) |
| 18 to 34 Years | 0 (0.0%) | 0 (0.0%) |
| 35 to 64 Years | 5 (23.8%) | 3 (13.6%) |
| 65 to 74 Years | 0 (0.0%) | 0 (0.0%) |
| 75 Years and over | 0 (0.0%) | 0 (0.0%) |
Disability Class: Ambulatory Difficulty
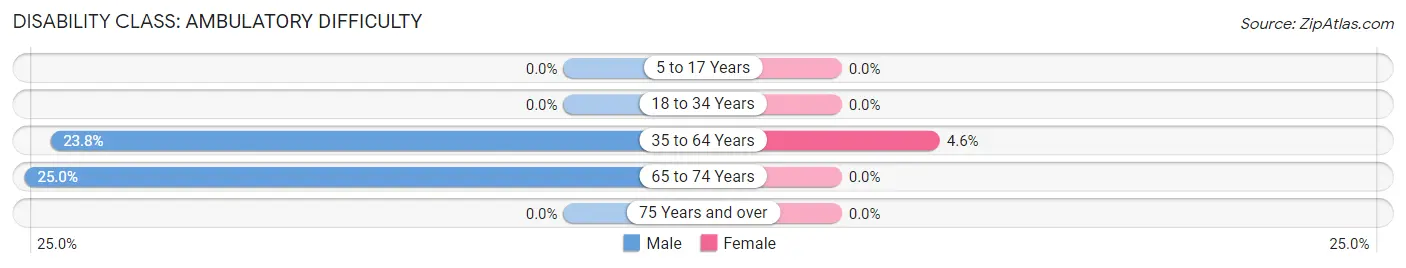
| Age Bracket | Male | Female |
| 5 to 17 Years | 0 (0.0%) | 0 (0.0%) |
| 18 to 34 Years | 0 (0.0%) | 0 (0.0%) |
| 35 to 64 Years | 5 (23.8%) | 1 (4.5%) |
| 65 to 74 Years | 2 (25.0%) | 0 (0.0%) |
| 75 Years and over | 0 (0.0%) | 0 (0.0%) |
Disability Class: Self-Care Difficulty
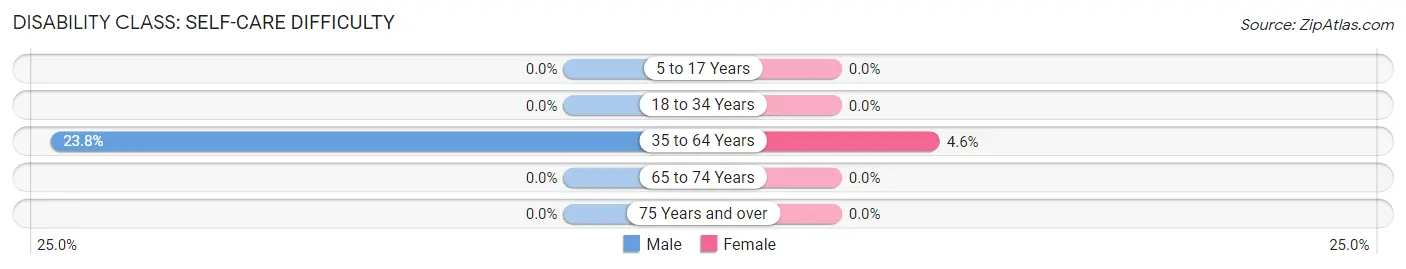
| Age Bracket | Male | Female |
| 5 to 17 Years | 0 (0.0%) | 0 (0.0%) |
| 18 to 34 Years | 0 (0.0%) | 0 (0.0%) |
| 35 to 64 Years | 5 (23.8%) | 1 (4.5%) |
| 65 to 74 Years | 0 (0.0%) | 0 (0.0%) |
| 75 Years and over | 0 (0.0%) | 0 (0.0%) |
Technology Access in Glen Lyn
Computing Device Access in Glen Lyn
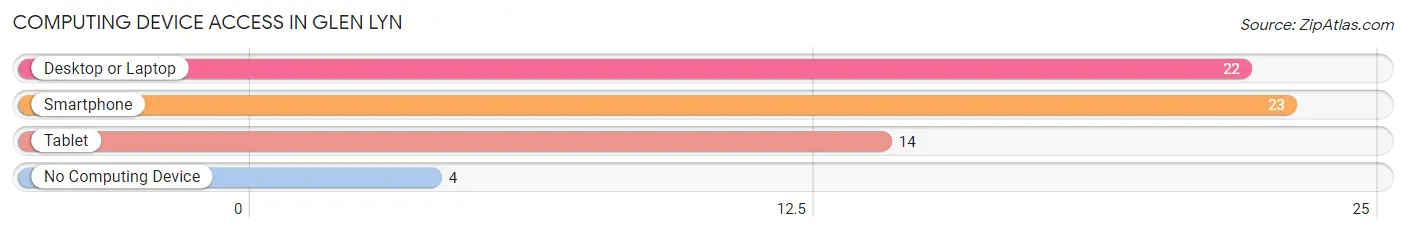
| Device Type | # Households | % Households |
| Desktop or Laptop | 22 | 75.9% |
| Smartphone | 23 | 79.3% |
| Tablet | 14 | 48.3% |
| No Computing Device | 4 | 13.8% |
| Total | 29 | 100.0% |
Internet Access in Glen Lyn
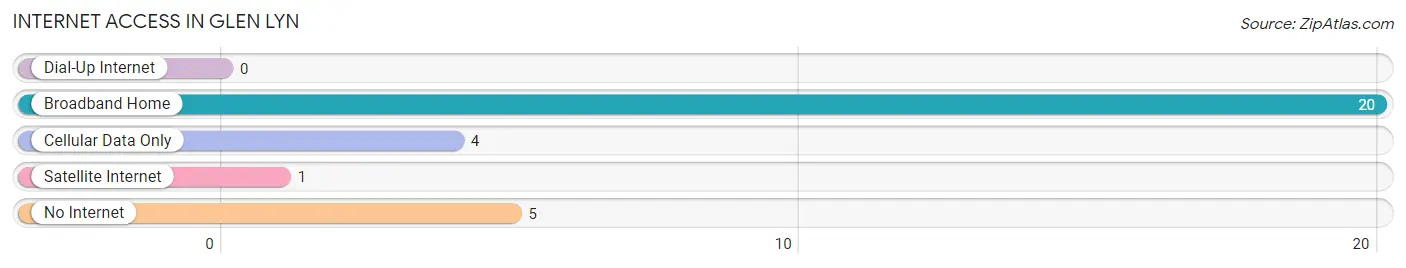
| Internet Type | # Households | % Households |
| Dial-Up Internet | 0 | 0.0% |
| Broadband Home | 20 | 69.0% |
| Cellular Data Only | 4 | 13.8% |
| Satellite Internet | 1 | 3.5% |
| No Internet | 5 | 17.2% |
| Total | 29 | 100.0% |
Glen Lyn Summary
Glen Lyn is a small town located in Giles County, Virginia. It is situated along the New River, which is a tributary of the Ohio River. The town is located in the Appalachian Mountains and is part of the Appalachian Plateau. The town has a population of approximately 500 people and is part of the Blacksburg-Christiansburg-Radford Metropolitan Statistical Area.
History
Glen Lyn was founded in 1883 by the Norfolk and Western Railway. The town was named after the nearby Glen Lyn Gorge, which was named after a local settler, John Lynch. The town was originally a coal mining town and was home to several coal mines. The town was also home to a large sawmill and a gristmill. The town was incorporated in 1891 and was home to a variety of businesses, including a hotel, a general store, a post office, and a bank.
Geography
Glen Lyn is located in the Appalachian Mountains and is part of the Appalachian Plateau. The town is situated along the New River, which is a tributary of the Ohio River. The town is located in Giles County, Virginia and is part of the Blacksburg-Christiansburg-Radford Metropolitan Statistical Area. The town is located at an elevation of 1,845 feet and has a total area of 0.6 square miles.
Economy
The economy of Glen Lyn is largely based on tourism and agriculture. The town is home to several tourist attractions, including the Glen Lyn Gorge, the New River Trail State Park, and the Glen Lyn Historic District. The town is also home to several farms, which produce a variety of crops, including corn, soybeans, and hay. The town is also home to several small businesses, including a general store, a post office, and a bank.
Demographics
As of the 2010 census, the population of Glen Lyn was 498 people. The racial makeup of the town was 97.2% White, 0.6% African American, 0.2% Native American, 0.2% Asian, 0.2% from other races, and 1.8% from two or more races. The median household income was $30,000 and the median family income was $35,000. The per capita income was $14,000. The town had a poverty rate of 22.2%.
Conclusion
Glen Lyn is a small town located in Giles County, Virginia. It is situated along the New River and is part of the Appalachian Plateau. The town has a population of approximately 500 people and is part of the Blacksburg-Christiansburg-Radford Metropolitan Statistical Area. The economy of Glen Lyn is largely based on tourism and agriculture. The town is home to several tourist attractions, including the Glen Lyn Gorge, the New River Trail State Park, and the Glen Lyn Historic District. The racial makeup of the town is 97.2% White, 0.6% African American, 0.2% Native American, 0.2% Asian, 0.2% from other races, and 1.8% from two or more races. The median household income was $30,000 and the median family income was $35,000. The per capita income was $14,000. The town had a poverty rate of 22.2%.
Common Questions
What is Per Capita Income in Glen Lyn?
Per Capita income in Glen Lyn is $30,699.
What is the Median Family Income in Glen Lyn?
Median Family Income in Glen Lyn is $81,250.
What is the Median Household income in Glen Lyn?
Median Household Income in Glen Lyn is $73,750.
What is Income or Wage Gap in Glen Lyn?
Income or Wage Gap in Glen Lyn is 36.6%.
Women in Glen Lyn earn 63.4 cents for every dollar earned by a man.
What is Inequality or Gini Index in Glen Lyn?
Inequality or Gini Index in Glen Lyn is 0.44.
What is the Total Population of Glen Lyn?
Total Population of Glen Lyn is 78.
What is the Total Male Population of Glen Lyn?
Total Male Population of Glen Lyn is 45.
What is the Total Female Population of Glen Lyn?
Total Female Population of Glen Lyn is 33.
What is the Ratio of Males per 100 Females in Glen Lyn?
There are 136.36 Males per 100 Females in Glen Lyn.
What is the Ratio of Females per 100 Males in Glen Lyn?
There are 73.33 Females per 100 Males in Glen Lyn.
What is the Median Population Age in Glen Lyn?
Median Population Age in Glen Lyn is 46.3 Years.
What is the Average Family Size in Glen Lyn
Average Family Size in Glen Lyn is 3.1 People.
What is the Average Household Size in Glen Lyn
Average Household Size in Glen Lyn is 2.7 People.
How Large is the Labor Force in Glen Lyn?
There are 30 People in the Labor Forcein in Glen Lyn.
What is the Percentage of People in the Labor Force in Glen Lyn?
48.4% of People are in the Labor Force in Glen Lyn.