Gate City, VA Map & Demographics
Gate City Map
Gate City Overview
$31,324
PER CAPITA INCOME
$90,233
AVG FAMILY INCOME
$37,543
AVG HOUSEHOLD INCOME
45.2%
WAGE / INCOME GAP [ % ]
54.8¢/ $1
WAGE / INCOME GAP [ $ ]
0.53
INEQUALITY / GINI INDEX
1,910
TOTAL POPULATION
897
MALE POPULATION
1,013
FEMALE POPULATION
88.55
MALES / 100 FEMALES
112.93
FEMALES / 100 MALES
42.6
MEDIAN AGE
2.9
AVG FAMILY SIZE
2.1
AVG HOUSEHOLD SIZE
789
LABOR FORCE [ PEOPLE ]
49.7%
PERCENT IN LABOR FORCE
2.2%
UNEMPLOYMENT RATE
Gate City Zip Codes
Gate City Area Codes
Income in Gate City
Income Overview in Gate City
Per Capita Income in Gate City is $31,324, while median incomes of families and households are $90,233 and $37,543 respectively.
| Characteristic | Number | Measure |
| Per Capita Income | 1,910 | $31,324 |
| Median Family Income | 520 | $90,233 |
| Mean Family Income | 520 | $94,192 |
| Median Household Income | 891 | $37,543 |
| Mean Household Income | 891 | $65,441 |
| Income Deficit | 520 | $0 |
| Wage / Income Gap (%) | 1,910 | 45.20% |
| Wage / Income Gap ($) | 1,910 | 54.80¢ per $1 |
| Gini / Inequality Index | 1,910 | 0.53 |
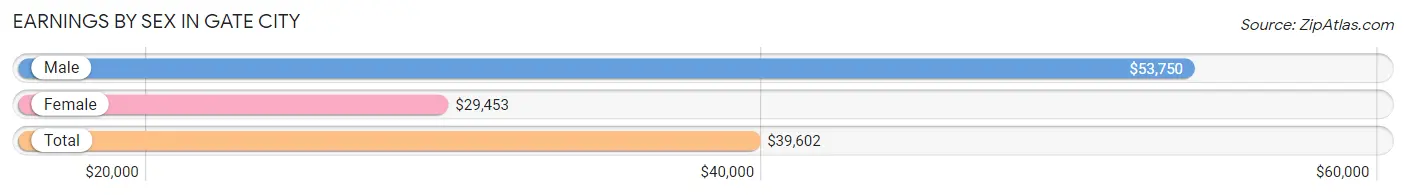
Earnings by Sex in Gate City
Average Earnings in Gate City are $39,602, $53,750 for men and $29,453 for women, a difference of 45.2%.
| Sex | Number | Average Earnings |
| Male | 421 (50.8%) | $53,750 |
| Female | 408 (49.2%) | $29,453 |
| Total | 829 (100.0%) | $39,602 |
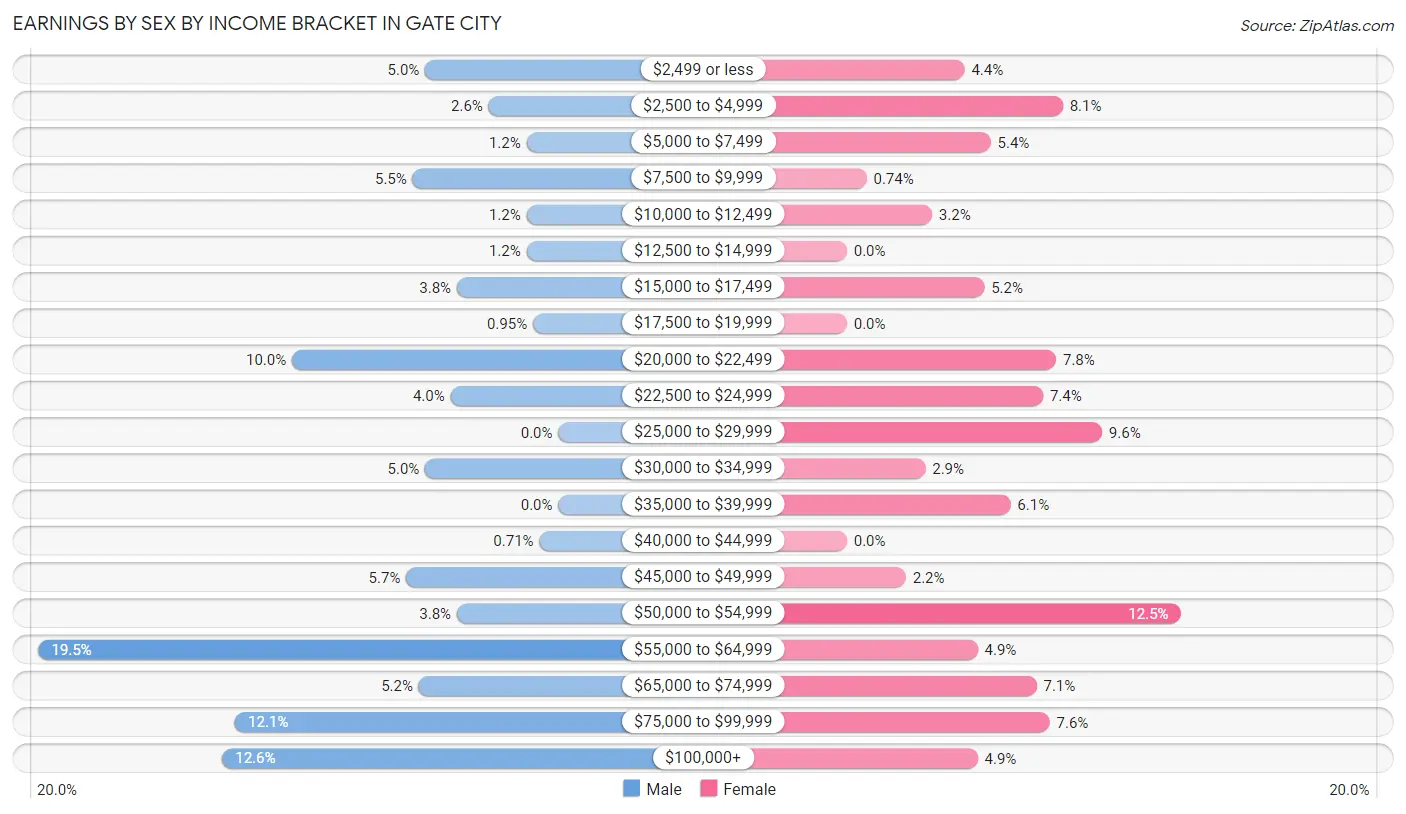
Earnings by Sex by Income Bracket in Gate City
The most common earnings brackets in Gate City are $55,000 to $64,999 for men (82 | 19.5%) and $50,000 to $54,999 for women (51 | 12.5%).
| Income | Male | Female |
| $2,499 or less | 21 (5.0%) | 18 (4.4%) |
| $2,500 to $4,999 | 11 (2.6%) | 33 (8.1%) |
| $5,000 to $7,499 | 5 (1.2%) | 22 (5.4%) |
| $7,500 to $9,999 | 23 (5.5%) | 3 (0.7%) |
| $10,000 to $12,499 | 5 (1.2%) | 13 (3.2%) |
| $12,500 to $14,999 | 5 (1.2%) | 0 (0.0%) |
| $15,000 to $17,499 | 16 (3.8%) | 21 (5.1%) |
| $17,500 to $19,999 | 4 (0.9%) | 0 (0.0%) |
| $20,000 to $22,499 | 42 (10.0%) | 32 (7.8%) |
| $22,500 to $24,999 | 17 (4.0%) | 30 (7.3%) |
| $25,000 to $29,999 | 0 (0.0%) | 39 (9.6%) |
| $30,000 to $34,999 | 21 (5.0%) | 12 (2.9%) |
| $35,000 to $39,999 | 0 (0.0%) | 25 (6.1%) |
| $40,000 to $44,999 | 3 (0.7%) | 0 (0.0%) |
| $45,000 to $49,999 | 24 (5.7%) | 9 (2.2%) |
| $50,000 to $54,999 | 16 (3.8%) | 51 (12.5%) |
| $55,000 to $64,999 | 82 (19.5%) | 20 (4.9%) |
| $65,000 to $74,999 | 22 (5.2%) | 29 (7.1%) |
| $75,000 to $99,999 | 51 (12.1%) | 31 (7.6%) |
| $100,000+ | 53 (12.6%) | 20 (4.9%) |
| Total | 421 (100.0%) | 408 (100.0%) |
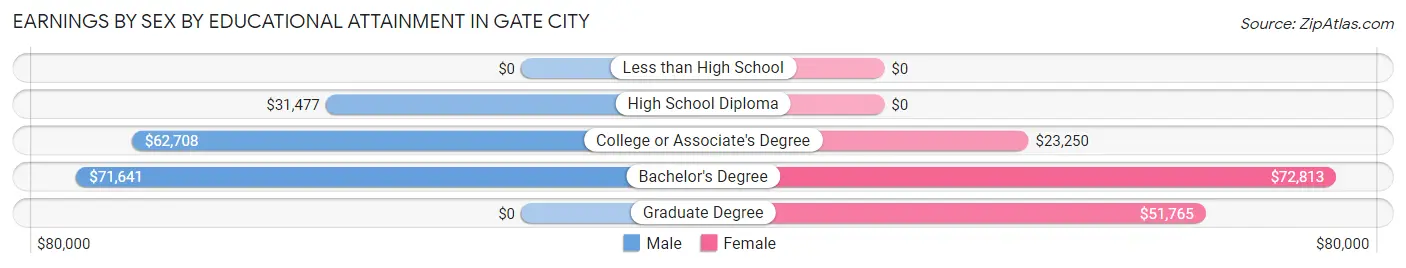
Earnings by Sex by Educational Attainment in Gate City
Average earnings in Gate City are $59,750 for men and $32,250 for women, a difference of 46.0%. Men with an educational attainment of bachelor's degree enjoy the highest average annual earnings of $71,641, while those with high school diploma education earn the least with $31,477. Women with an educational attainment of bachelor's degree earn the most with the average annual earnings of $72,813, while those with college or associate's degree education have the smallest earnings of $23,250.
| Educational Attainment | Male Income | Female Income |
| Less than High School | - | - |
| High School Diploma | $31,477 | $0 |
| College or Associate's Degree | $62,708 | $23,250 |
| Bachelor's Degree | $71,641 | $72,813 |
| Graduate Degree | - | - |
| Total | $59,750 | $32,250 |
Family Income in Gate City
Family Income Brackets in Gate City
According to the Gate City family income data, there are 121 families falling into the $75,000 to $99,999 income range, which is the most common income bracket and makes up 23.3% of all families. Conversely, the less than $10,000 income bracket is the least frequent group with only 9 families (1.7%) belonging to this category.
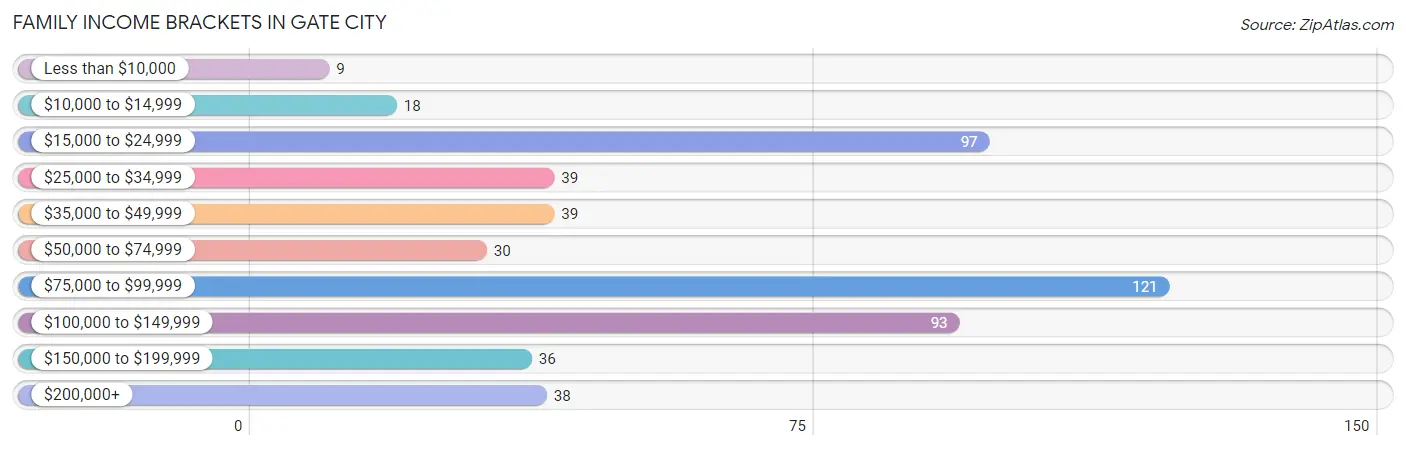
| Income Bracket | # Families | % Families |
| Less than $10,000 | 9 | 1.7% |
| $10,000 to $14,999 | 18 | 3.5% |
| $15,000 to $24,999 | 97 | 18.7% |
| $25,000 to $34,999 | 39 | 7.5% |
| $35,000 to $49,999 | 39 | 7.5% |
| $50,000 to $74,999 | 30 | 5.8% |
| $75,000 to $99,999 | 121 | 23.3% |
| $100,000 to $149,999 | 93 | 17.9% |
| $150,000 to $199,999 | 36 | 6.9% |
| $200,000+ | 38 | 7.3% |
Family Income by Famaliy Size in Gate City
3-person families (126 | 24.2%) account for the highest median family income in Gate City with $90,441 per family, while 2-person families (288 | 55.4%) have the highest median income of $38,928 per family member.
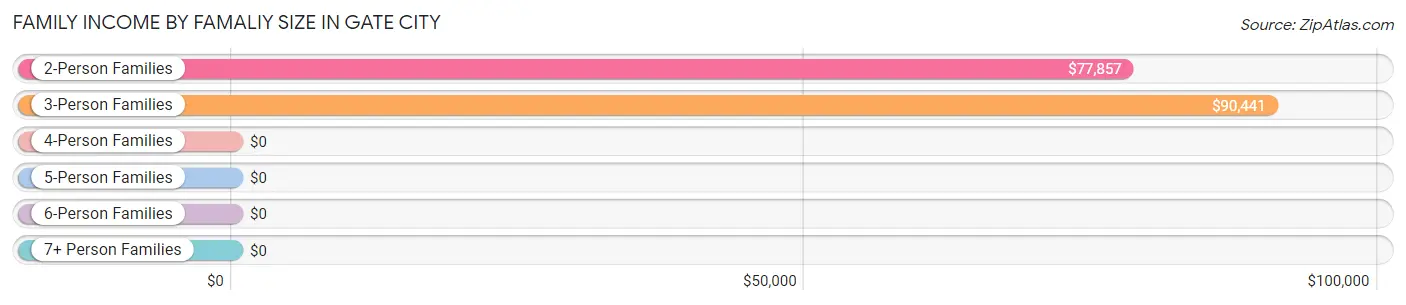
| Income Bracket | # Families | Median Income |
| 2-Person Families | 288 (55.4%) | $77,857 |
| 3-Person Families | 126 (24.2%) | $90,441 |
| 4-Person Families | 83 (16.0%) | $0 |
| 5-Person Families | 7 (1.3%) | $0 |
| 6-Person Families | 0 (0.0%) | $0 |
| 7+ Person Families | 16 (3.1%) | $0 |
| Total | 520 (100.0%) | $90,233 |
Family Income by Number of Earners in Gate City
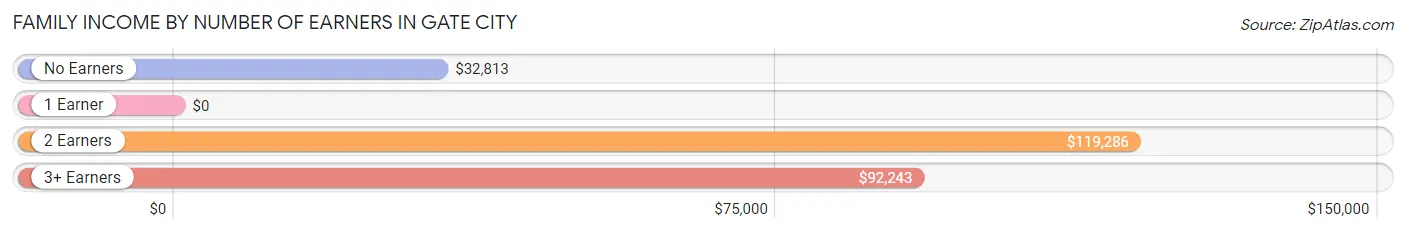
| Number of Earners | # Families | Median Income |
| No Earners | 116 (22.3%) | $32,813 |
| 1 Earner | 151 (29.0%) | $0 |
| 2 Earners | 192 (36.9%) | $119,286 |
| 3+ Earners | 61 (11.7%) | $92,243 |
| Total | 520 (100.0%) | $90,233 |
Household Income in Gate City
Household Income Brackets in Gate City
With 189 households falling in the category, the $15,000 to $24,999 income range is the most frequent in Gate City, accounting for 21.2% of all households. In contrast, only 36 households (4.0%) fall into the $150,000 to $199,999 income bracket, making it the least populous group.
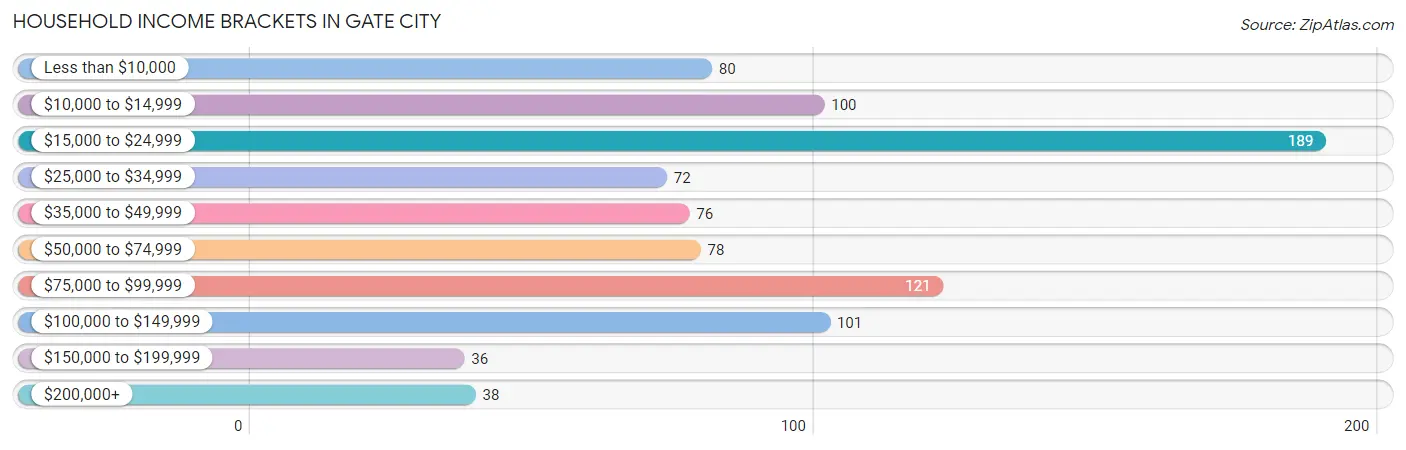
| Income Bracket | # Households | % Households |
| Less than $10,000 | 80 | 9.0% |
| $10,000 to $14,999 | 100 | 11.2% |
| $15,000 to $24,999 | 189 | 21.2% |
| $25,000 to $34,999 | 72 | 8.1% |
| $35,000 to $49,999 | 76 | 8.5% |
| $50,000 to $74,999 | 78 | 8.8% |
| $75,000 to $99,999 | 121 | 13.6% |
| $100,000 to $149,999 | 101 | 11.3% |
| $150,000 to $199,999 | 36 | 4.0% |
| $200,000+ | 38 | 4.3% |
Household Income by Householder Age in Gate City
The median household income in Gate City is $37,543, with the highest median household income of $39,946 found in the 45 to 64 years age bracket for the primary householder. A total of 263 households (29.5%) fall into this category. Meanwhile, the 15 to 24 years age bracket for the primary householder has the lowest median household income of $0, with 32 households (3.6%) in this group.
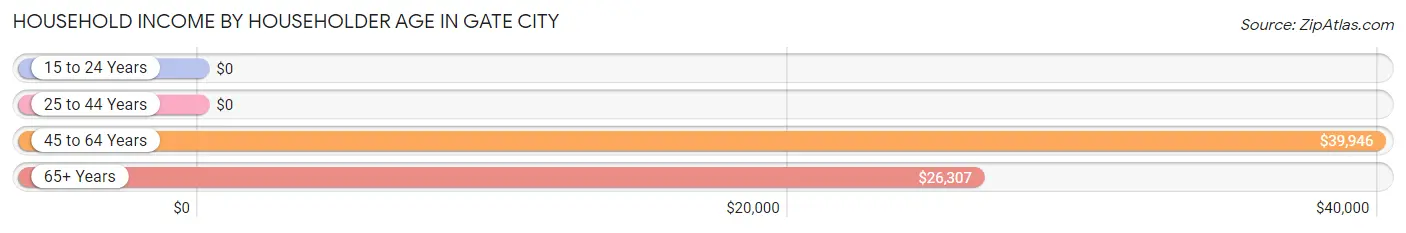
| Income Bracket | # Households | Median Income |
| 15 to 24 Years | 32 (3.6%) | $0 |
| 25 to 44 Years | 245 (27.5%) | $0 |
| 45 to 64 Years | 263 (29.5%) | $39,946 |
| 65+ Years | 351 (39.4%) | $26,307 |
| Total | 891 (100.0%) | $37,543 |
Poverty in Gate City
Income Below Poverty by Sex and Age in Gate City
With 10.5% poverty level for males and 26.5% for females among the residents of Gate City, 5 year old males and 15 year old females are the most vulnerable to poverty, with 10 males (100.0%) and 19 females (55.9%) in their respective age groups living below the poverty level.
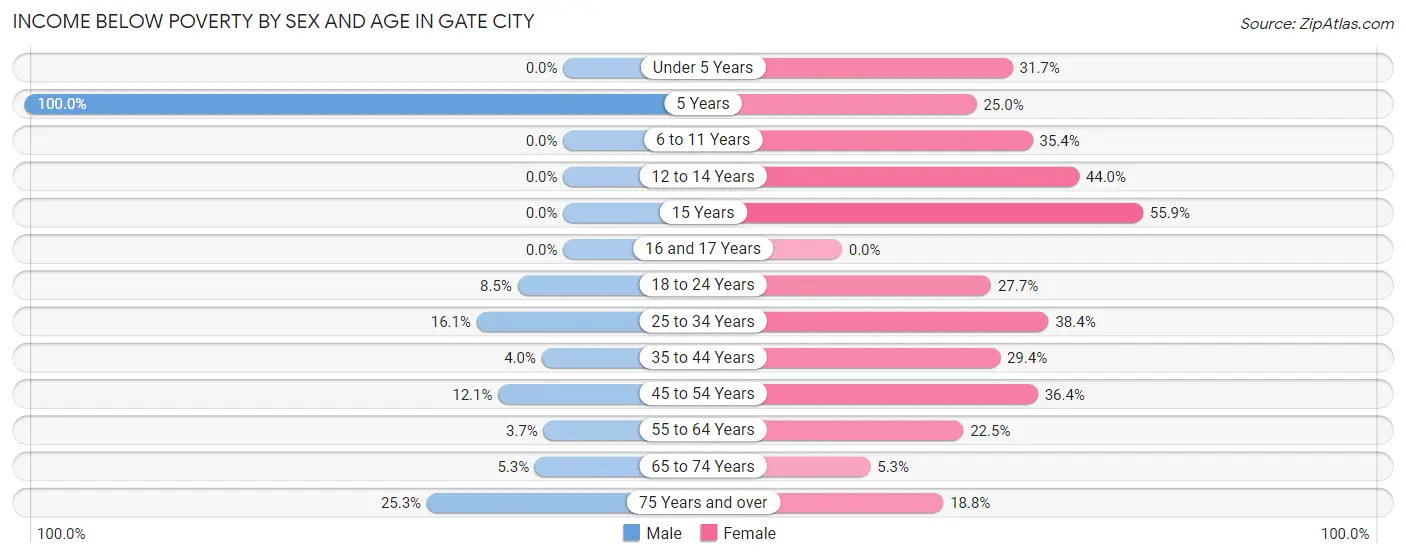
| Age Bracket | Male | Female |
| Under 5 Years | 0 (0.0%) | 13 (31.7%) |
| 5 Years | 10 (100.0%) | 5 (25.0%) |
| 6 to 11 Years | 0 (0.0%) | 34 (35.4%) |
| 12 to 14 Years | 0 (0.0%) | 22 (44.0%) |
| 15 Years | 0 (0.0%) | 19 (55.9%) |
| 16 and 17 Years | 0 (0.0%) | 0 (0.0%) |
| 18 to 24 Years | 5 (8.5%) | 18 (27.7%) |
| 25 to 34 Years | 36 (16.1%) | 28 (38.4%) |
| 35 to 44 Years | 4 (4.0%) | 32 (29.4%) |
| 45 to 54 Years | 7 (12.1%) | 40 (36.4%) |
| 55 to 64 Years | 5 (3.6%) | 32 (22.5%) |
| 65 to 74 Years | 7 (5.3%) | 9 (5.3%) |
| 75 Years and over | 20 (25.3%) | 16 (18.8%) |
| Total | 94 (10.5%) | 268 (26.5%) |
Income Above Poverty by Sex and Age in Gate City
According to the poverty statistics in Gate City, males aged under 5 years and females aged 16 and 17 years are the age groups that are most secure financially, with 100.0% of males and 100.0% of females in these age groups living above the poverty line.
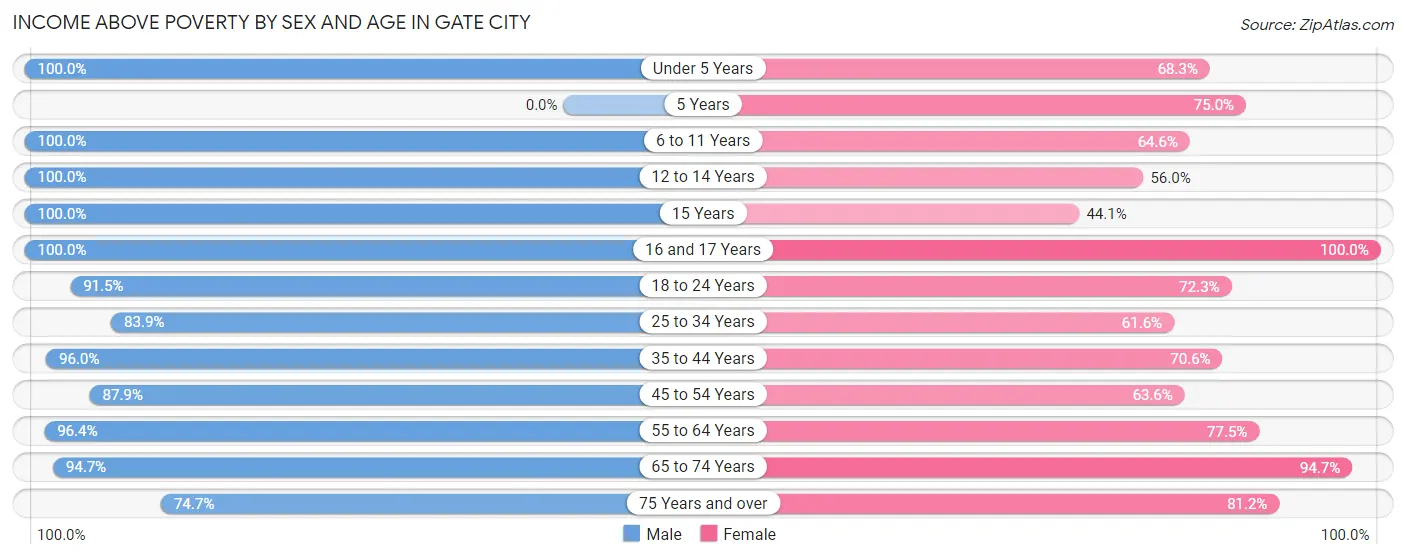
| Age Bracket | Male | Female |
| Under 5 Years | 28 (100.0%) | 28 (68.3%) |
| 5 Years | 0 (0.0%) | 15 (75.0%) |
| 6 to 11 Years | 18 (100.0%) | 62 (64.6%) |
| 12 to 14 Years | 7 (100.0%) | 28 (56.0%) |
| 15 Years | 19 (100.0%) | 15 (44.1%) |
| 16 and 17 Years | 25 (100.0%) | 18 (100.0%) |
| 18 to 24 Years | 54 (91.5%) | 47 (72.3%) |
| 25 to 34 Years | 188 (83.9%) | 45 (61.6%) |
| 35 to 44 Years | 96 (96.0%) | 77 (70.6%) |
| 45 to 54 Years | 51 (87.9%) | 70 (63.6%) |
| 55 to 64 Years | 132 (96.4%) | 110 (77.5%) |
| 65 to 74 Years | 126 (94.7%) | 161 (94.7%) |
| 75 Years and over | 59 (74.7%) | 69 (81.2%) |
| Total | 803 (89.5%) | 745 (73.5%) |
Income Below Poverty Among Married-Couple Families in Gate City
The poverty statistics for married-couple families in Gate City show that 6.8% or 26 of the total 382 families live below the poverty line. Families with 1 or 2 children have the highest poverty rate of 8.1%, comprising of 11 families. On the other hand, families with 3 or 4 children have the lowest poverty rate of 0.0%, which includes 0 families.
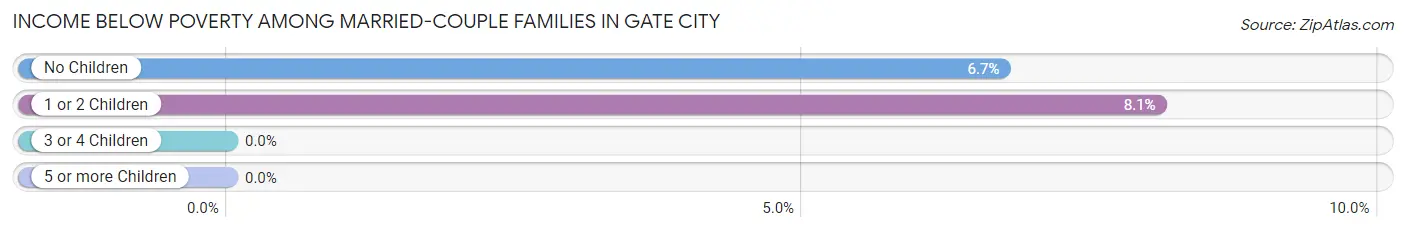
| Children | Above Poverty | Below Poverty |
| No Children | 208 (93.3%) | 15 (6.7%) |
| 1 or 2 Children | 125 (91.9%) | 11 (8.1%) |
| 3 or 4 Children | 23 (100.0%) | 0 (0.0%) |
| 5 or more Children | 0 (0.0%) | 0 (0.0%) |
| Total | 356 (93.2%) | 26 (6.8%) |
Income Below Poverty Among Single-Parent Households in Gate City
According to the poverty data in Gate City, 26.7% or 4 single-father households and 30.1% or 37 single-mother households are living below the poverty line. Among single-father households, those with 3 or 4 children have the highest poverty rate, with 4 households (100.0%) experiencing poverty. Likewise, among single-mother households, those with 3 or 4 children have the highest poverty rate, with 20 households (76.9%) falling below the poverty line.
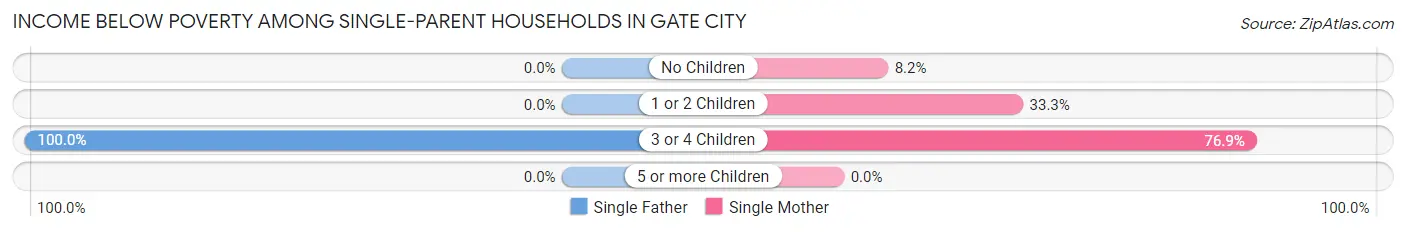
| Children | Single Father | Single Mother |
| No Children | 0 (0.0%) | 5 (8.2%) |
| 1 or 2 Children | 0 (0.0%) | 12 (33.3%) |
| 3 or 4 Children | 4 (100.0%) | 20 (76.9%) |
| 5 or more Children | 0 (0.0%) | 0 (0.0%) |
| Total | 4 (26.7%) | 37 (30.1%) |
Income Below Poverty Among Married-Couple vs Single-Parent Households in Gate City
The poverty data for Gate City shows that 26 of the married-couple family households (6.8%) and 41 of the single-parent households (29.7%) are living below the poverty level. Within the married-couple family households, those with 1 or 2 children have the highest poverty rate, with 11 households (8.1%) falling below the poverty line. Among the single-parent households, those with 3 or 4 children have the highest poverty rate, with 24 household (80.0%) living below poverty.
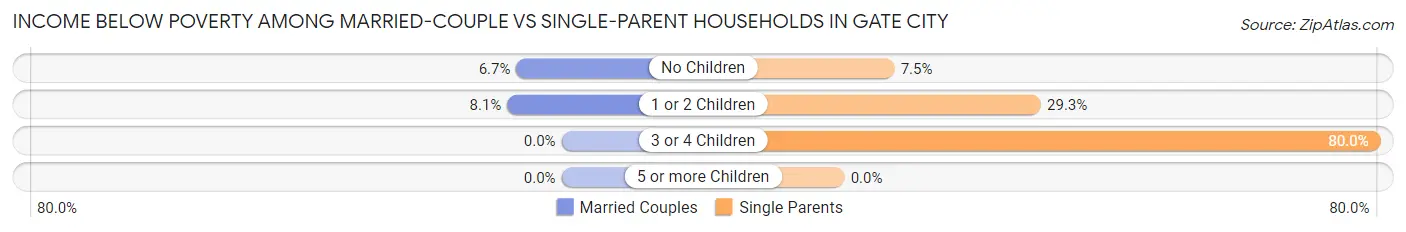
| Children | Married-Couple Families | Single-Parent Households |
| No Children | 15 (6.7%) | 5 (7.5%) |
| 1 or 2 Children | 11 (8.1%) | 12 (29.3%) |
| 3 or 4 Children | 0 (0.0%) | 24 (80.0%) |
| 5 or more Children | 0 (0.0%) | 0 (0.0%) |
| Total | 26 (6.8%) | 41 (29.7%) |
Race in Gate City
The most populous races in Gate City are White / Caucasian (1,829 | 95.8%), Black / African American (39 | 2.0%), and Two or more Races (28 | 1.5%).
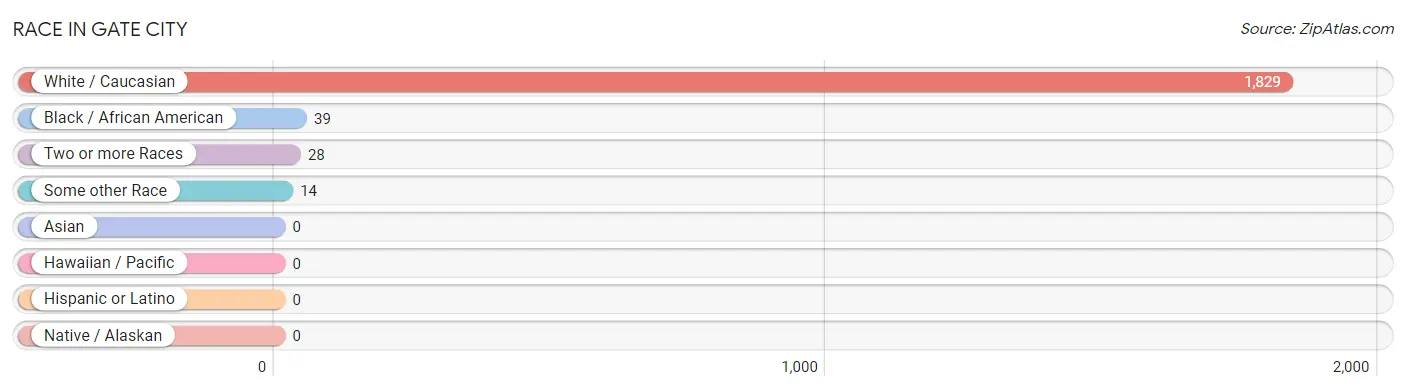
| Race | # Population | % Population |
| Asian | 0 | 0.0% |
| Black / African American | 39 | 2.0% |
| Hawaiian / Pacific | 0 | 0.0% |
| Hispanic or Latino | 0 | 0.0% |
| Native / Alaskan | 0 | 0.0% |
| White / Caucasian | 1,829 | 95.8% |
| Two or more Races | 28 | 1.5% |
| Some other Race | 14 | 0.7% |
| Total | 1,910 | 100.0% |
Ancestry in Gate City
The most populous ancestries reported in Gate City are American (338 | 17.7%), English (257 | 13.5%), Irish (217 | 11.4%), German (203 | 10.6%), and Scotch-Irish (66 | 3.5%), together accounting for 56.6% of all Gate City residents.
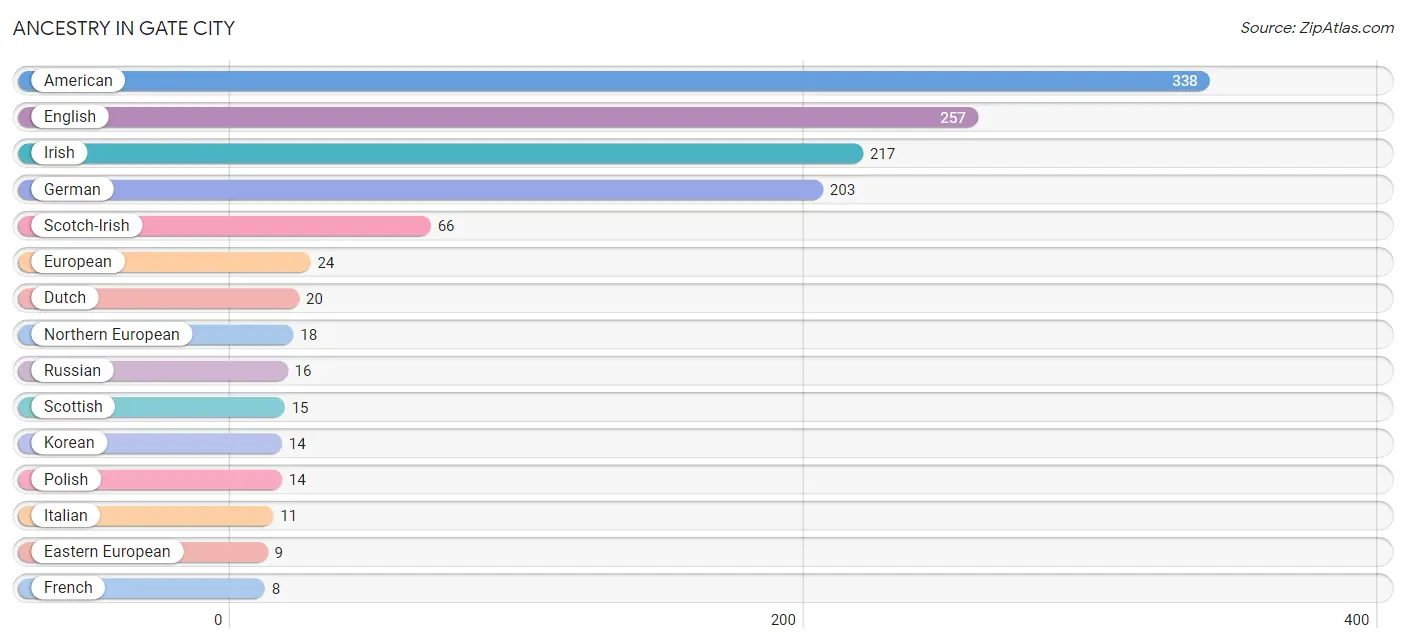
| Ancestry | # Population | % Population |
| American | 338 | 17.7% |
| Dutch | 20 | 1.1% |
| Eastern European | 9 | 0.5% |
| English | 257 | 13.5% |
| European | 24 | 1.3% |
| French | 8 | 0.4% |
| German | 203 | 10.6% |
| Irish | 217 | 11.4% |
| Italian | 11 | 0.6% |
| Korean | 14 | 0.7% |
| Northern European | 18 | 0.9% |
| Polish | 14 | 0.7% |
| Russian | 16 | 0.8% |
| Scotch-Irish | 66 | 3.5% |
| Scottish | 15 | 0.8% | View All 15 Rows |
Immigrants in Gate City
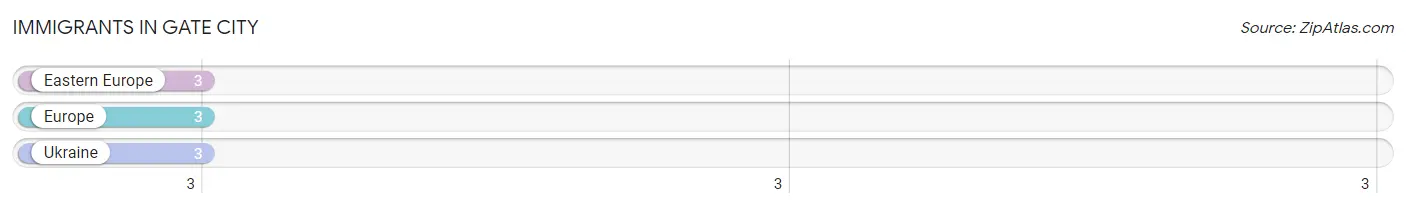
The most numerous immigrant groups reported in Gate City came from Eastern Europe (3 | 0.2%), Europe (3 | 0.2%), and Ukraine (3 | 0.2%), together accounting for 0.5% of all Gate City residents.
| Immigration Origin | # Population | % Population |
| Eastern Europe | 3 | 0.2% |
| Europe | 3 | 0.2% |
| Ukraine | 3 | 0.2% | View All 3 Rows |
Sex and Age in Gate City
Sex and Age in Gate City
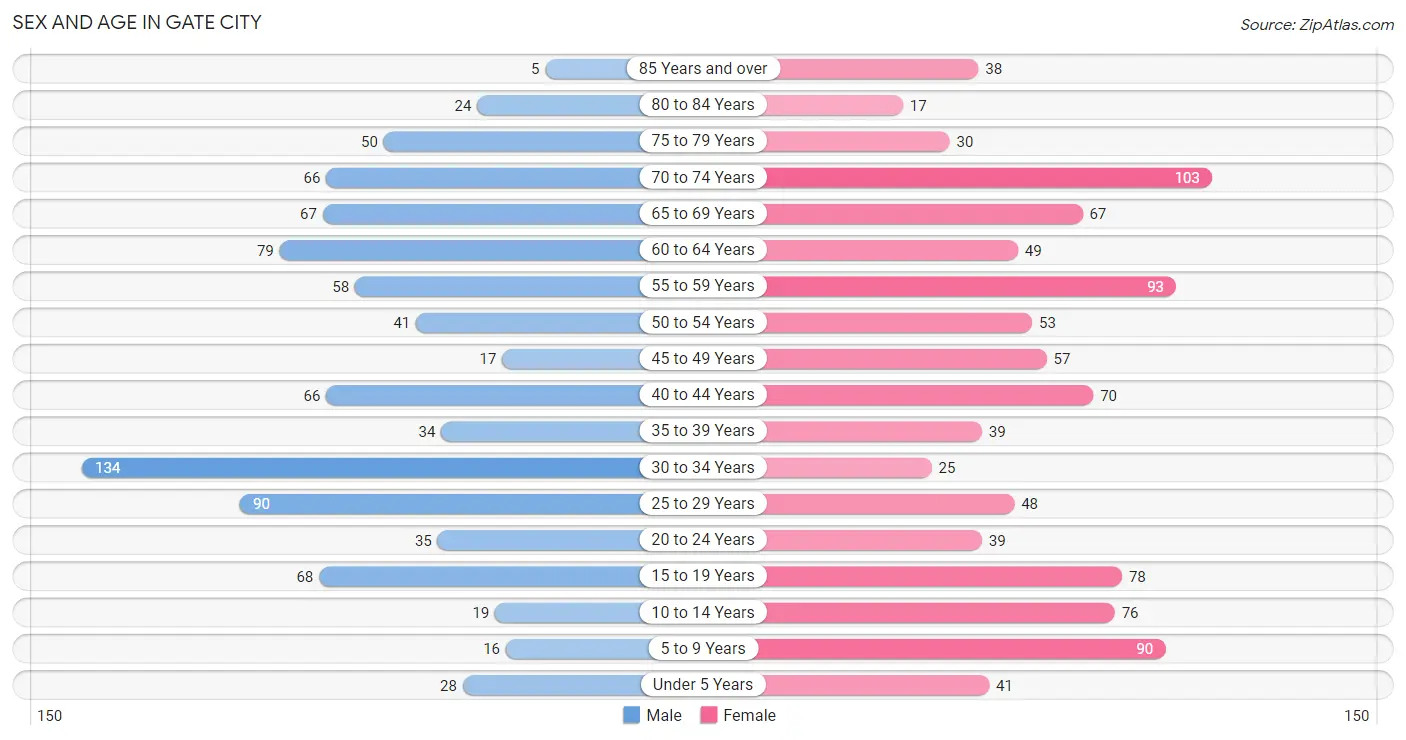
The most populous age groups in Gate City are 30 to 34 Years (134 | 14.9%) for men and 70 to 74 Years (103 | 10.2%) for women.
| Age Bracket | Male | Female |
| Under 5 Years | 28 (3.1%) | 41 (4.1%) |
| 5 to 9 Years | 16 (1.8%) | 90 (8.9%) |
| 10 to 14 Years | 19 (2.1%) | 76 (7.5%) |
| 15 to 19 Years | 68 (7.6%) | 78 (7.7%) |
| 20 to 24 Years | 35 (3.9%) | 39 (3.8%) |
| 25 to 29 Years | 90 (10.0%) | 48 (4.7%) |
| 30 to 34 Years | 134 (14.9%) | 25 (2.5%) |
| 35 to 39 Years | 34 (3.8%) | 39 (3.8%) |
| 40 to 44 Years | 66 (7.4%) | 70 (6.9%) |
| 45 to 49 Years | 17 (1.9%) | 57 (5.6%) |
| 50 to 54 Years | 41 (4.6%) | 53 (5.2%) |
| 55 to 59 Years | 58 (6.5%) | 93 (9.2%) |
| 60 to 64 Years | 79 (8.8%) | 49 (4.8%) |
| 65 to 69 Years | 67 (7.5%) | 67 (6.6%) |
| 70 to 74 Years | 66 (7.4%) | 103 (10.2%) |
| 75 to 79 Years | 50 (5.6%) | 30 (3.0%) |
| 80 to 84 Years | 24 (2.7%) | 17 (1.7%) |
| 85 Years and over | 5 (0.6%) | 38 (3.7%) |
| Total | 897 (100.0%) | 1,013 (100.0%) |
Families and Households in Gate City
Median Family Size in Gate City
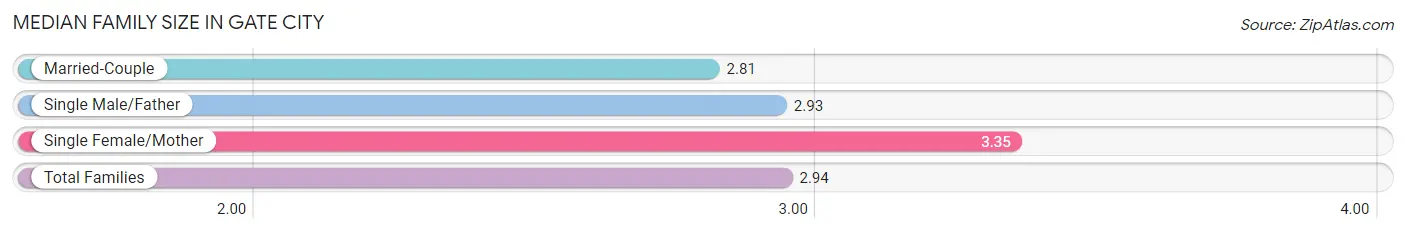
The median family size in Gate City is 2.94 persons per family, with single female/mother families (123 | 23.6%) accounting for the largest median family size of 3.35 persons per family. On the other hand, married-couple families (382 | 73.5%) represent the smallest median family size with 2.81 persons per family.
| Family Type | # Families | Family Size |
| Married-Couple | 382 (73.5%) | 2.81 |
| Single Male/Father | 15 (2.9%) | 2.93 |
| Single Female/Mother | 123 (23.6%) | 3.35 |
| Total Families | 520 (100.0%) | 2.94 |
Median Household Size in Gate City
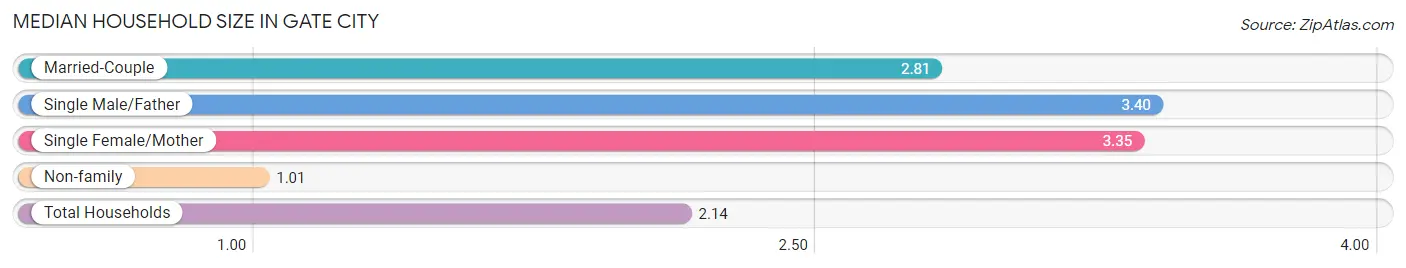
The median household size in Gate City is 2.14 persons per household, with single male/father households (15 | 1.7%) accounting for the largest median household size of 3.4 persons per household. non-family households (371 | 41.6%) represent the smallest median household size with 1.01 persons per household.
| Household Type | # Households | Household Size |
| Married-Couple | 382 (42.9%) | 2.81 |
| Single Male/Father | 15 (1.7%) | 3.40 |
| Single Female/Mother | 123 (13.8%) | 3.35 |
| Non-family | 371 (41.6%) | 1.01 |
| Total Households | 891 (100.0%) | 2.14 |
Household Size by Marriage Status in Gate City
Out of a total of 891 households in Gate City, 520 (58.4%) are family households, while 371 (41.6%) are nonfamily households. The most numerous type of family households are 2-person households, comprising 283, and the most common type of nonfamily households are 1-person households, comprising 366.
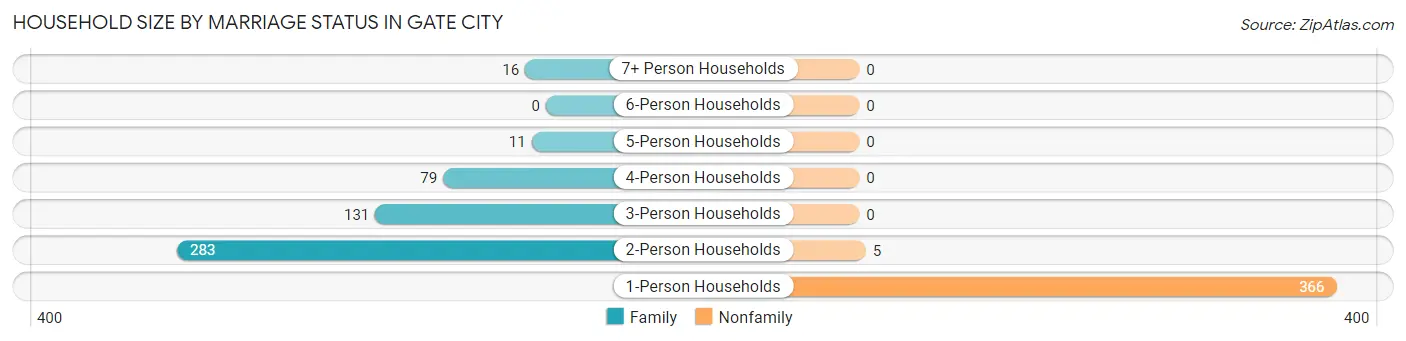
| Household Size | Family Households | Nonfamily Households |
| 1-Person Households | - | 366 (41.1%) |
| 2-Person Households | 283 (31.8%) | 5 (0.6%) |
| 3-Person Households | 131 (14.7%) | 0 (0.0%) |
| 4-Person Households | 79 (8.9%) | 0 (0.0%) |
| 5-Person Households | 11 (1.2%) | 0 (0.0%) |
| 6-Person Households | 0 (0.0%) | 0 (0.0%) |
| 7+ Person Households | 16 (1.8%) | 0 (0.0%) |
| Total | 520 (58.4%) | 371 (41.6%) |
Female Fertility in Gate City
Fertility by Age in Gate City
Average fertility rate in Gate City is 102.0 births per 1,000 women. Women in the age bracket of 20 to 34 years have the highest fertility rate with 295.0 births per 1,000 women. Women in the age bracket of 20 to 34 years acount for 89.2% of all women with births.
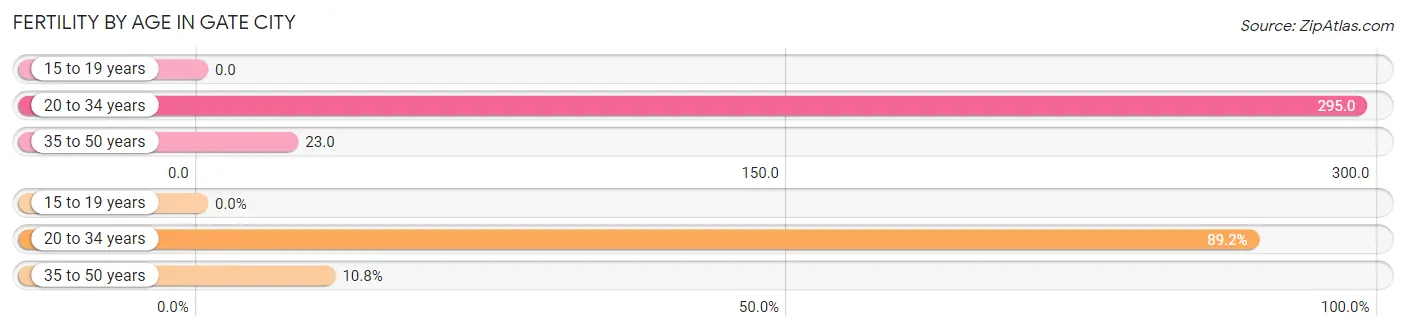
| Age Bracket | Women with Births | Births / 1,000 Women |
| 15 to 19 years | 0 (0.0%) | 0.0 |
| 20 to 34 years | 33 (89.2%) | 295.0 |
| 35 to 50 years | 4 (10.8%) | 23.0 |
| Total | 37 (100.0%) | 102.0 |
Fertility by Age by Marriage Status in Gate City
73.0% of women with births (37) in Gate City are married. The highest percentage of unmarried women with births falls into 20 to 34 years age bracket with 30.3% of them unmarried at the time of birth, while the lowest percentage of unmarried women with births belong to 35 to 50 years age bracket with 0.0% of them unmarried.
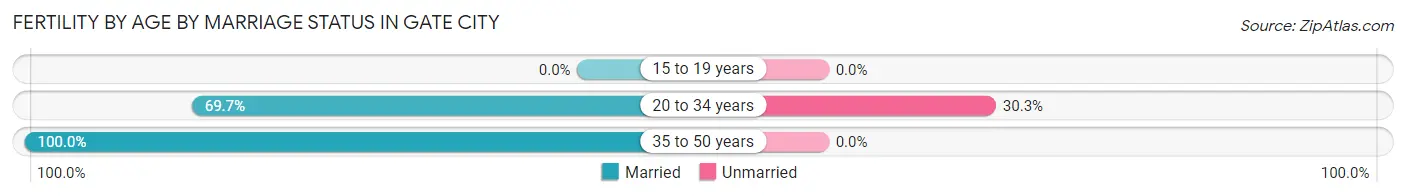
| Age Bracket | Married | Unmarried |
| 15 to 19 years | 0 (0.0%) | 0 (0.0%) |
| 20 to 34 years | 23 (69.7%) | 10 (30.3%) |
| 35 to 50 years | 4 (100.0%) | 0 (0.0%) |
| Total | 27 (73.0%) | 10 (27.0%) |
Fertility by Education in Gate City
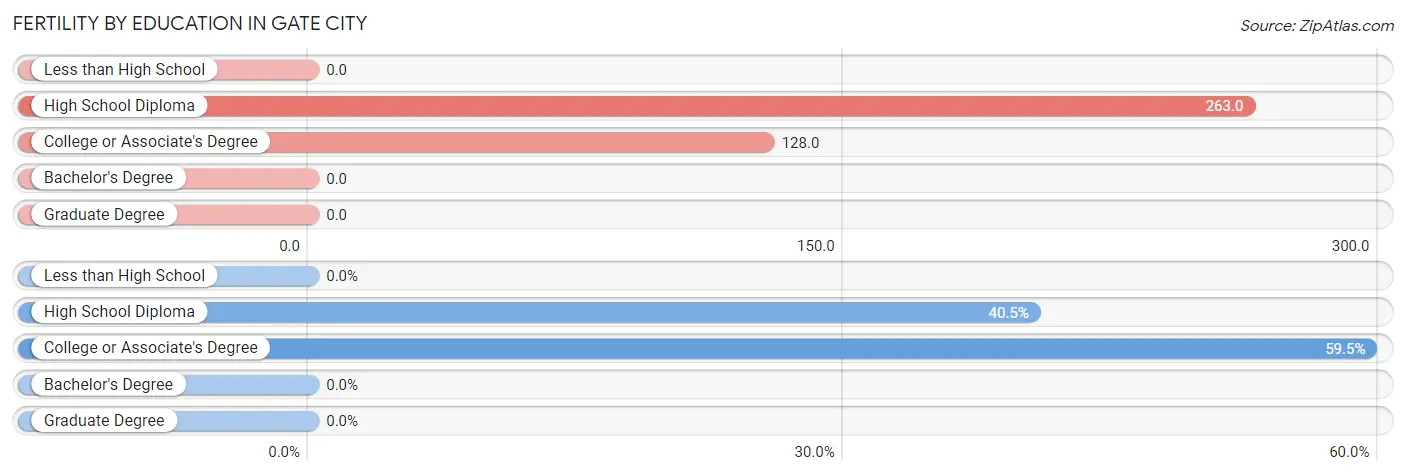
| Educational Attainment | Women with Births | Births / 1,000 Women |
| Less than High School | 0 (0.0%) | 0.0 |
| High School Diploma | 15 (40.5%) | 263.0 |
| College or Associate's Degree | 22 (59.5%) | 128.0 |
| Bachelor's Degree | 0 (0.0%) | 0.0 |
| Graduate Degree | 0 (0.0%) | 0.0 |
| Total | 37 (100.0%) | 102.0 |
Fertility by Education by Marriage Status in Gate City
27.0% of women with births in Gate City are unmarried. Women with the educational attainment of high school diploma are most likely to be married with 100.0% of them married at childbirth, while women with the educational attainment of college or associate's degree are least likely to be married with 45.5% of them unmarried at childbirth.
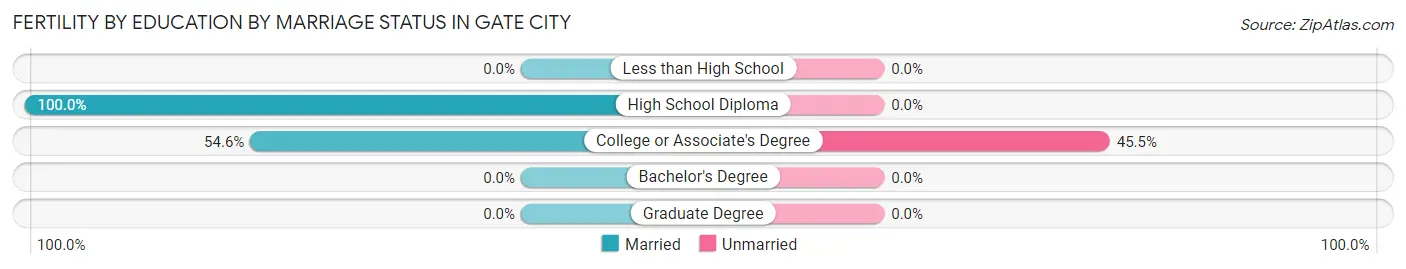
| Educational Attainment | Married | Unmarried |
| Less than High School | 0 (0.0%) | 0 (0.0%) |
| High School Diploma | 15 (100.0%) | 0 (0.0%) |
| College or Associate's Degree | 12 (54.5%) | 10 (45.5%) |
| Bachelor's Degree | 0 (0.0%) | 0 (0.0%) |
| Graduate Degree | 0 (0.0%) | 0 (0.0%) |
| Total | 27 (73.0%) | 10 (27.0%) |
Employment Characteristics in Gate City
Employment by Class of Employer in Gate City
Among the 753 employed individuals in Gate City, private company employees (472 | 62.7%), not-for-profit organizations (100 | 13.3%), and local government employees (67 | 8.9%) make up the most common classes of employment.
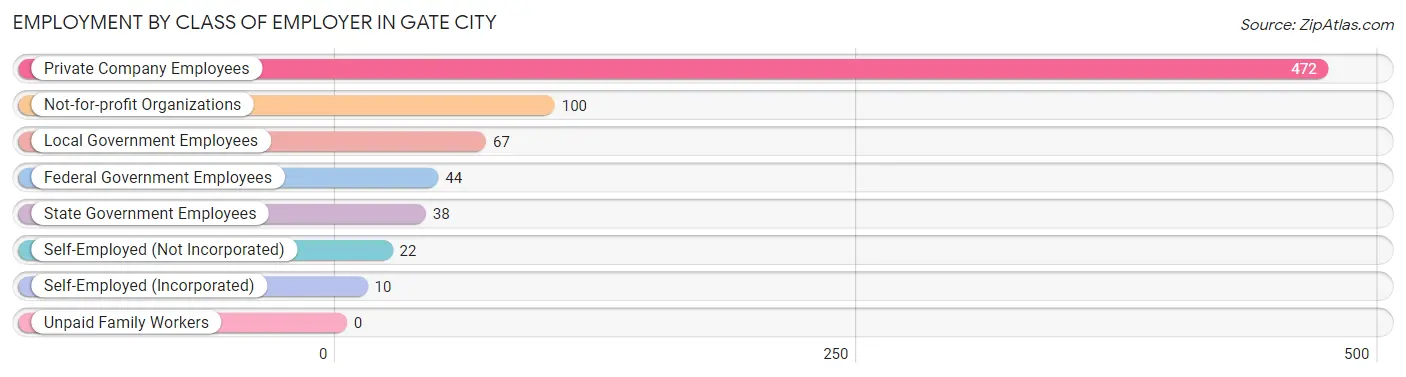
| Employer Class | # Employees | % Employees |
| Private Company Employees | 472 | 62.7% |
| Self-Employed (Incorporated) | 10 | 1.3% |
| Self-Employed (Not Incorporated) | 22 | 2.9% |
| Not-for-profit Organizations | 100 | 13.3% |
| Local Government Employees | 67 | 8.9% |
| State Government Employees | 38 | 5.1% |
| Federal Government Employees | 44 | 5.8% |
| Unpaid Family Workers | 0 | 0.0% |
| Total | 753 | 100.0% |
Employment Status by Age in Gate City
According to the labor force statistics for Gate City, out of the total population over 16 years of age (1,587), 49.7% or 789 individuals are in the labor force, with 2.2% or 17 of them unemployed. The age group with the highest labor force participation rate is 35 to 44 years, with 84.7% or 177 individuals in the labor force. Within the labor force, the 30 to 34 years age range has the highest percentage of unemployed individuals, with 13.0% or 9 of them being unemployed.
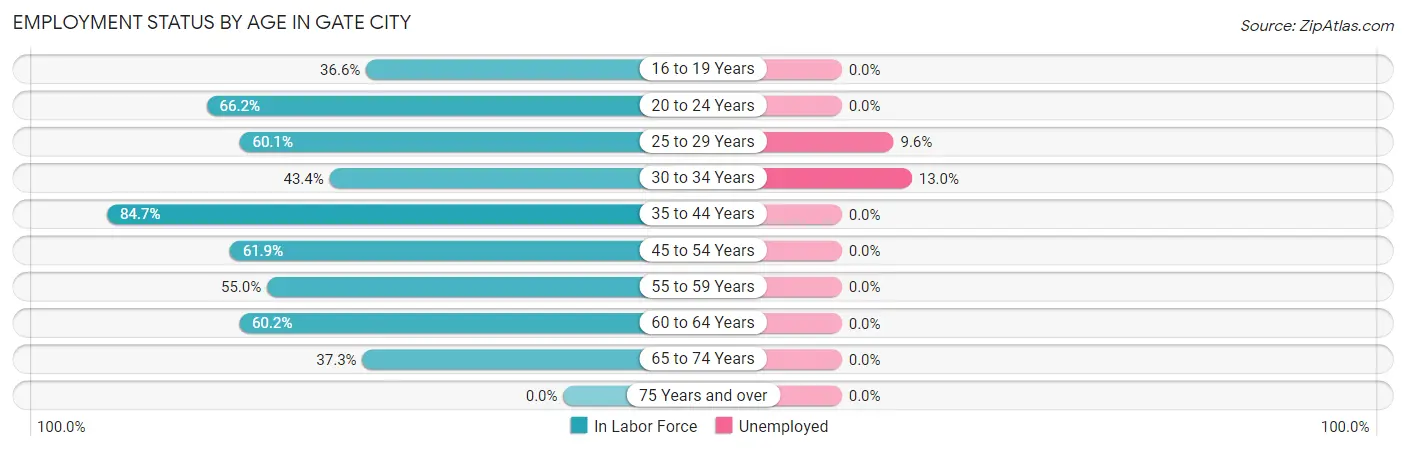
| Age Bracket | In Labor Force | Unemployed |
| 16 to 19 Years | 34 (36.6%) | 0 (0.0%) |
| 20 to 24 Years | 49 (66.2%) | 0 (0.0%) |
| 25 to 29 Years | 83 (60.1%) | 8 (9.6%) |
| 30 to 34 Years | 69 (43.4%) | 9 (13.0%) |
| 35 to 44 Years | 177 (84.7%) | 0 (0.0%) |
| 45 to 54 Years | 104 (61.9%) | 0 (0.0%) |
| 55 to 59 Years | 83 (55.0%) | 0 (0.0%) |
| 60 to 64 Years | 77 (60.2%) | 0 (0.0%) |
| 65 to 74 Years | 113 (37.3%) | 0 (0.0%) |
| 75 Years and over | 0 (0.0%) | 0 (0.0%) |
| Total | 789 (49.7%) | 17 (2.2%) |
Employment Status by Educational Attainment in Gate City
According to labor force statistics for Gate City, 62.2% of individuals (593) out of the total population between 25 and 64 years of age (953) are in the labor force, with 3.0% or 18 of them being unemployed. The group with the highest labor force participation rate are those with the educational attainment of college / associate degree, with 73.5% or 322 individuals in the labor force. Within the labor force, individuals with college / associate degree education have the highest percentage of unemployment, with 5.3% or 17 of them being unemployed.
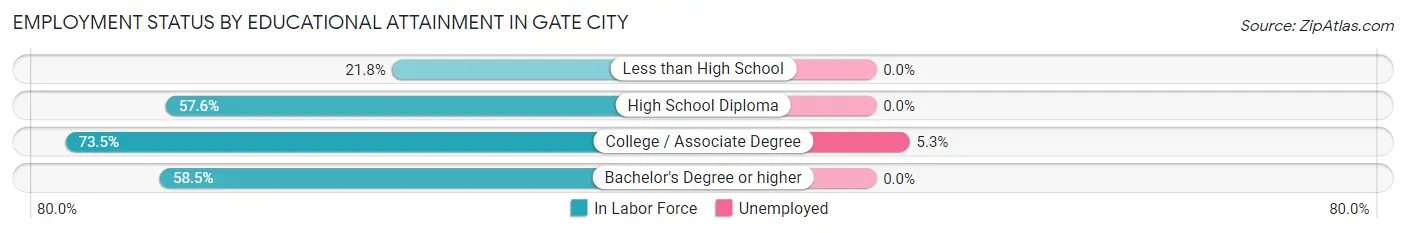
| Educational Attainment | In Labor Force | Unemployed |
| Less than High School | 17 (21.8%) | 0 (0.0%) |
| High School Diploma | 106 (57.6%) | 0 (0.0%) |
| College / Associate Degree | 322 (73.5%) | 23 (5.3%) |
| Bachelor's Degree or higher | 148 (58.5%) | 0 (0.0%) |
| Total | 593 (62.2%) | 29 (3.0%) |
Employment Occupations by Sex in Gate City
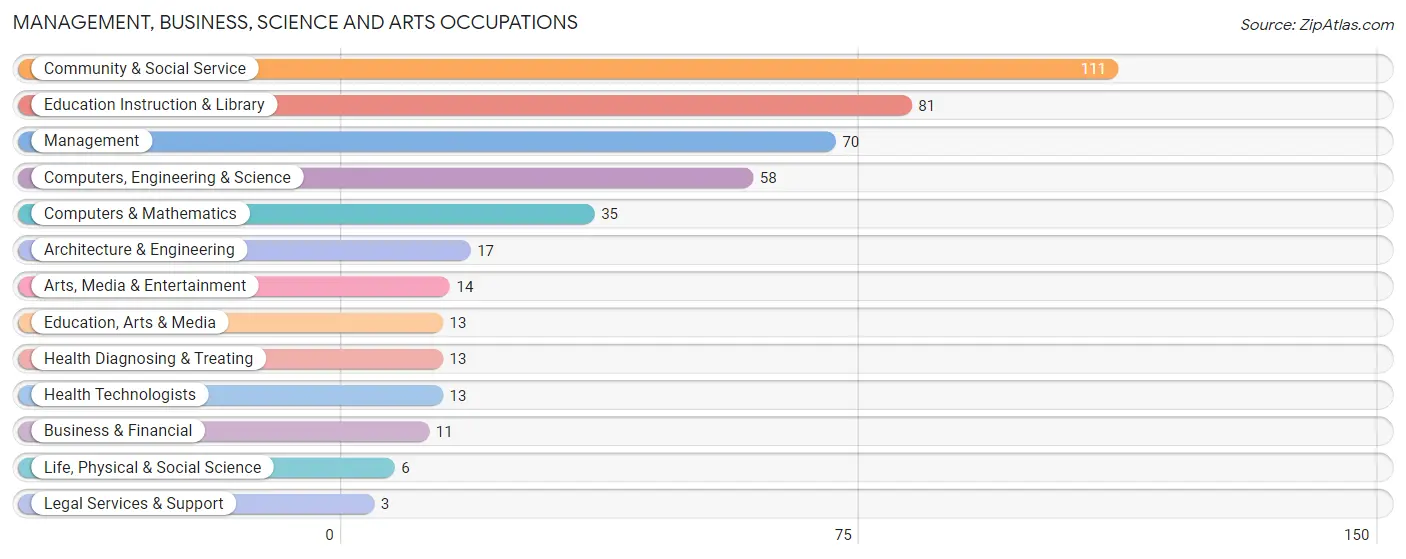
Management, Business, Science and Arts Occupations
The most common Management, Business, Science and Arts occupations in Gate City are Community & Social Service (111 | 15.0%), Education Instruction & Library (81 | 10.9%), Management (70 | 9.5%), Computers, Engineering & Science (58 | 7.8%), and Computers & Mathematics (35 | 4.7%).
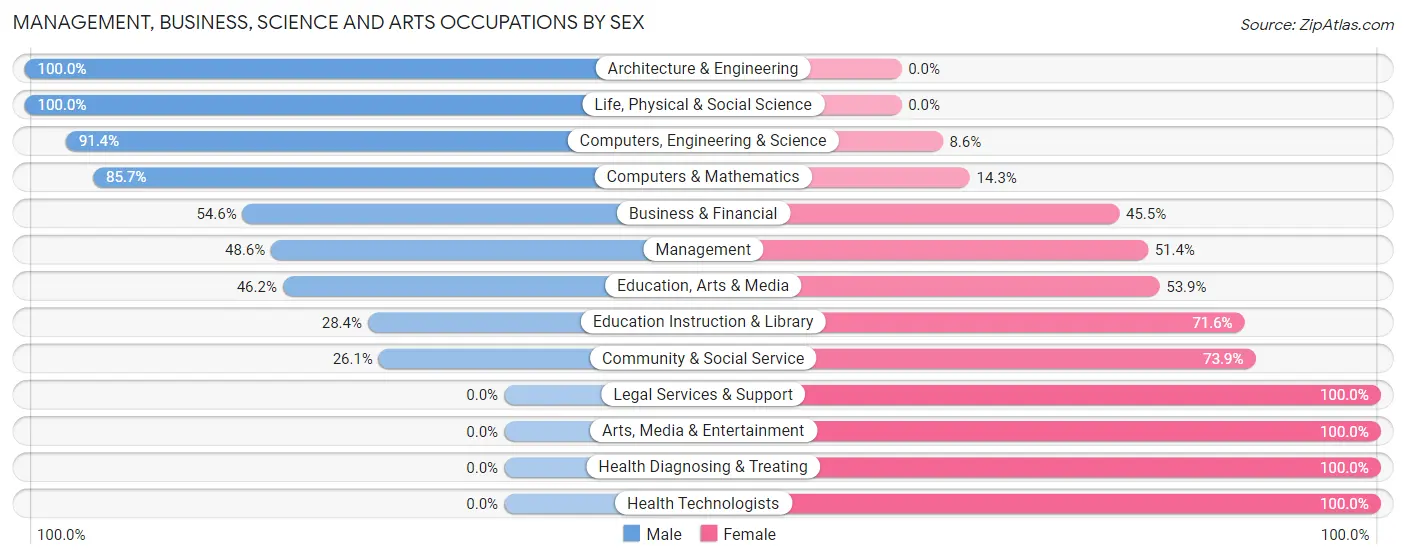
Management, Business, Science and Arts Occupations by Sex
Within the Management, Business, Science and Arts occupations in Gate City, the most male-oriented occupations are Architecture & Engineering (100.0%), Life, Physical & Social Science (100.0%), and Computers, Engineering & Science (91.4%), while the most female-oriented occupations are Legal Services & Support (100.0%), Arts, Media & Entertainment (100.0%), and Health Diagnosing & Treating (100.0%).
| Occupation | Male | Female |
| Management | 34 (48.6%) | 36 (51.4%) |
| Business & Financial | 6 (54.5%) | 5 (45.5%) |
| Computers, Engineering & Science | 53 (91.4%) | 5 (8.6%) |
| Computers & Mathematics | 30 (85.7%) | 5 (14.3%) |
| Architecture & Engineering | 17 (100.0%) | 0 (0.0%) |
| Life, Physical & Social Science | 6 (100.0%) | 0 (0.0%) |
| Community & Social Service | 29 (26.1%) | 82 (73.9%) |
| Education, Arts & Media | 6 (46.2%) | 7 (53.8%) |
| Legal Services & Support | 0 (0.0%) | 3 (100.0%) |
| Education Instruction & Library | 23 (28.4%) | 58 (71.6%) |
| Arts, Media & Entertainment | 0 (0.0%) | 14 (100.0%) |
| Health Diagnosing & Treating | 0 (0.0%) | 13 (100.0%) |
| Health Technologists | 0 (0.0%) | 13 (100.0%) |
| Total (Category) | 122 (46.4%) | 141 (53.6%) |
| Total (Overall) | 365 (49.3%) | 376 (50.7%) |
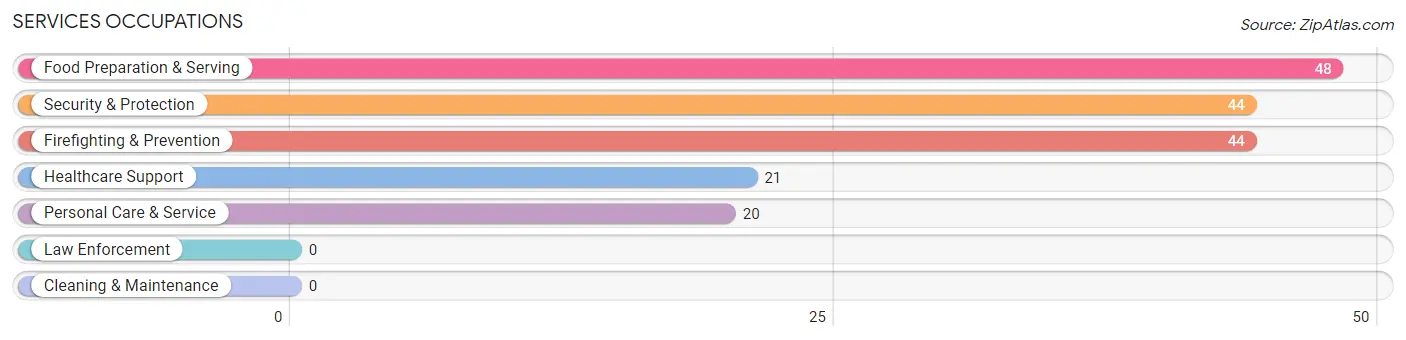
Services Occupations
The most common Services occupations in Gate City are Food Preparation & Serving (48 | 6.5%), Security & Protection (44 | 5.9%), Firefighting & Prevention (44 | 5.9%), Healthcare Support (21 | 2.8%), and Personal Care & Service (20 | 2.7%).
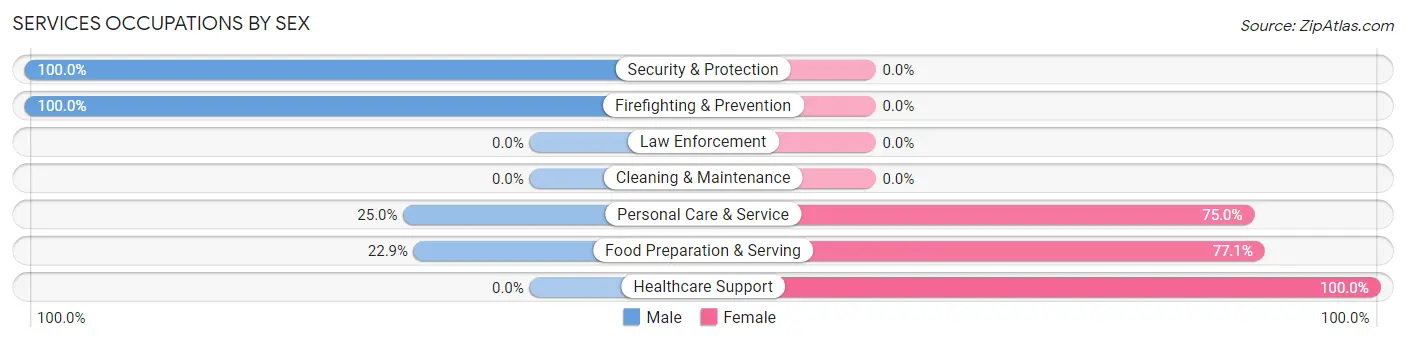
Services Occupations by Sex
Within the Services occupations in Gate City, the most male-oriented occupations are Security & Protection (100.0%), Firefighting & Prevention (100.0%), and Personal Care & Service (25.0%), while the most female-oriented occupations are Healthcare Support (100.0%), Food Preparation & Serving (77.1%), and Personal Care & Service (75.0%).
| Occupation | Male | Female |
| Healthcare Support | 0 (0.0%) | 21 (100.0%) |
| Security & Protection | 44 (100.0%) | 0 (0.0%) |
| Firefighting & Prevention | 44 (100.0%) | 0 (0.0%) |
| Law Enforcement | 0 (0.0%) | 0 (0.0%) |
| Food Preparation & Serving | 11 (22.9%) | 37 (77.1%) |
| Cleaning & Maintenance | 0 (0.0%) | 0 (0.0%) |
| Personal Care & Service | 5 (25.0%) | 15 (75.0%) |
| Total (Category) | 60 (45.1%) | 73 (54.9%) |
| Total (Overall) | 365 (49.3%) | 376 (50.7%) |
Sales and Office Occupations
The most common Sales and Office occupations in Gate City are Office & Administration (115 | 15.5%), and Sales & Related (65 | 8.8%).
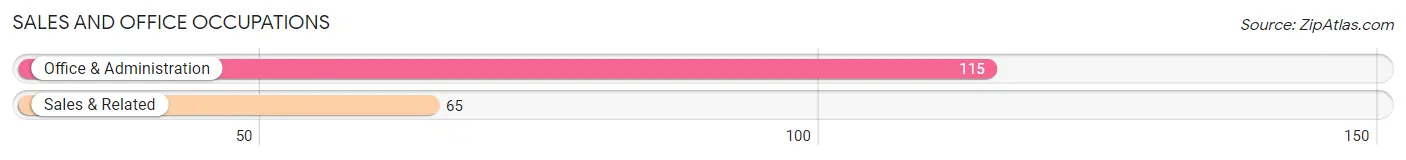
Sales and Office Occupations by Sex

| Occupation | Male | Female |
| Sales & Related | 8 (12.3%) | 57 (87.7%) |
| Office & Administration | 27 (23.5%) | 88 (76.5%) |
| Total (Category) | 35 (19.4%) | 145 (80.6%) |
| Total (Overall) | 365 (49.3%) | 376 (50.7%) |
Natural Resources, Construction and Maintenance Occupations
The most common Natural Resources, Construction and Maintenance occupations in Gate City are Installation, Maintenance & Repair (44 | 5.9%), and Construction & Extraction (34 | 4.6%).
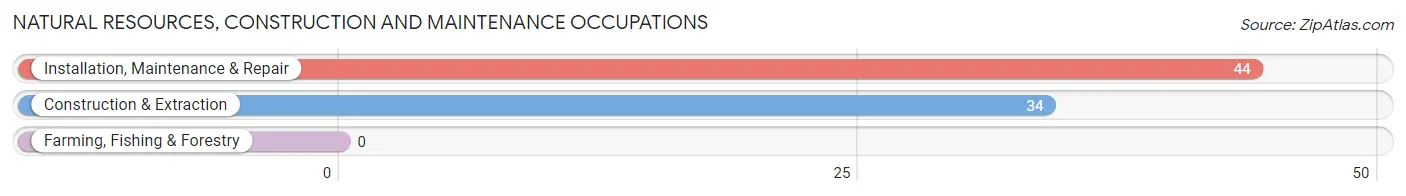
Natural Resources, Construction and Maintenance Occupations by Sex
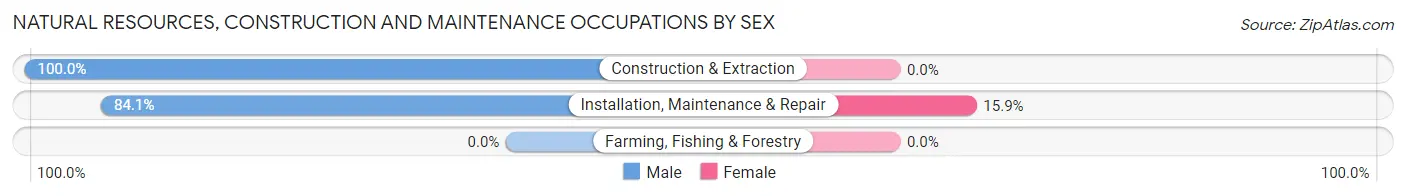
| Occupation | Male | Female |
| Farming, Fishing & Forestry | 0 (0.0%) | 0 (0.0%) |
| Construction & Extraction | 34 (100.0%) | 0 (0.0%) |
| Installation, Maintenance & Repair | 37 (84.1%) | 7 (15.9%) |
| Total (Category) | 71 (91.0%) | 7 (9.0%) |
| Total (Overall) | 365 (49.3%) | 376 (50.7%) |
Production, Transportation and Moving Occupations
The most common Production, Transportation and Moving occupations in Gate City are Production (75 | 10.1%), Material Moving (8 | 1.1%), and Transportation (4 | 0.5%).
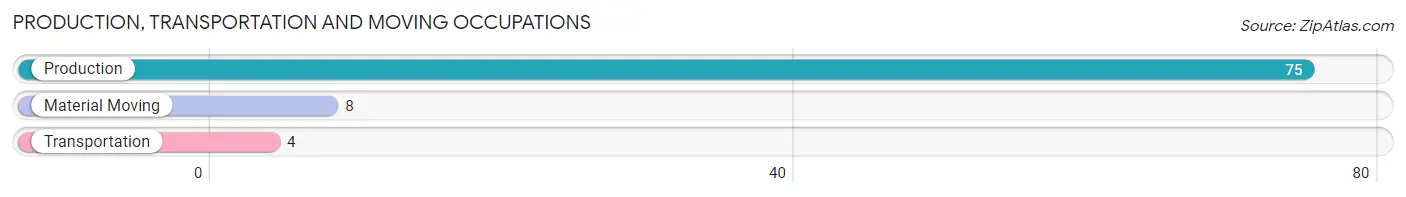
Production, Transportation and Moving Occupations by Sex
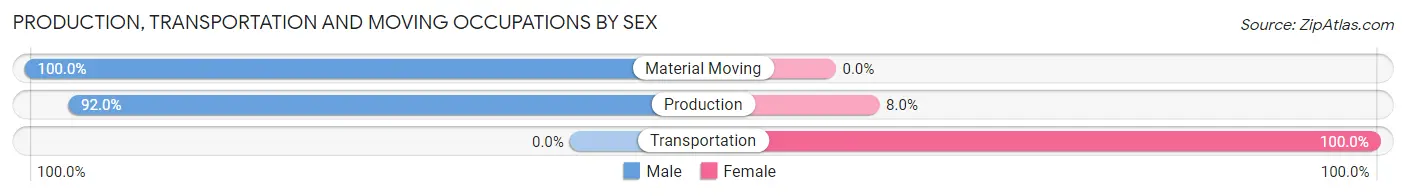
| Occupation | Male | Female |
| Production | 69 (92.0%) | 6 (8.0%) |
| Transportation | 0 (0.0%) | 4 (100.0%) |
| Material Moving | 8 (100.0%) | 0 (0.0%) |
| Total (Category) | 77 (88.5%) | 10 (11.5%) |
| Total (Overall) | 365 (49.3%) | 376 (50.7%) |
Employment Industries by Sex in Gate City
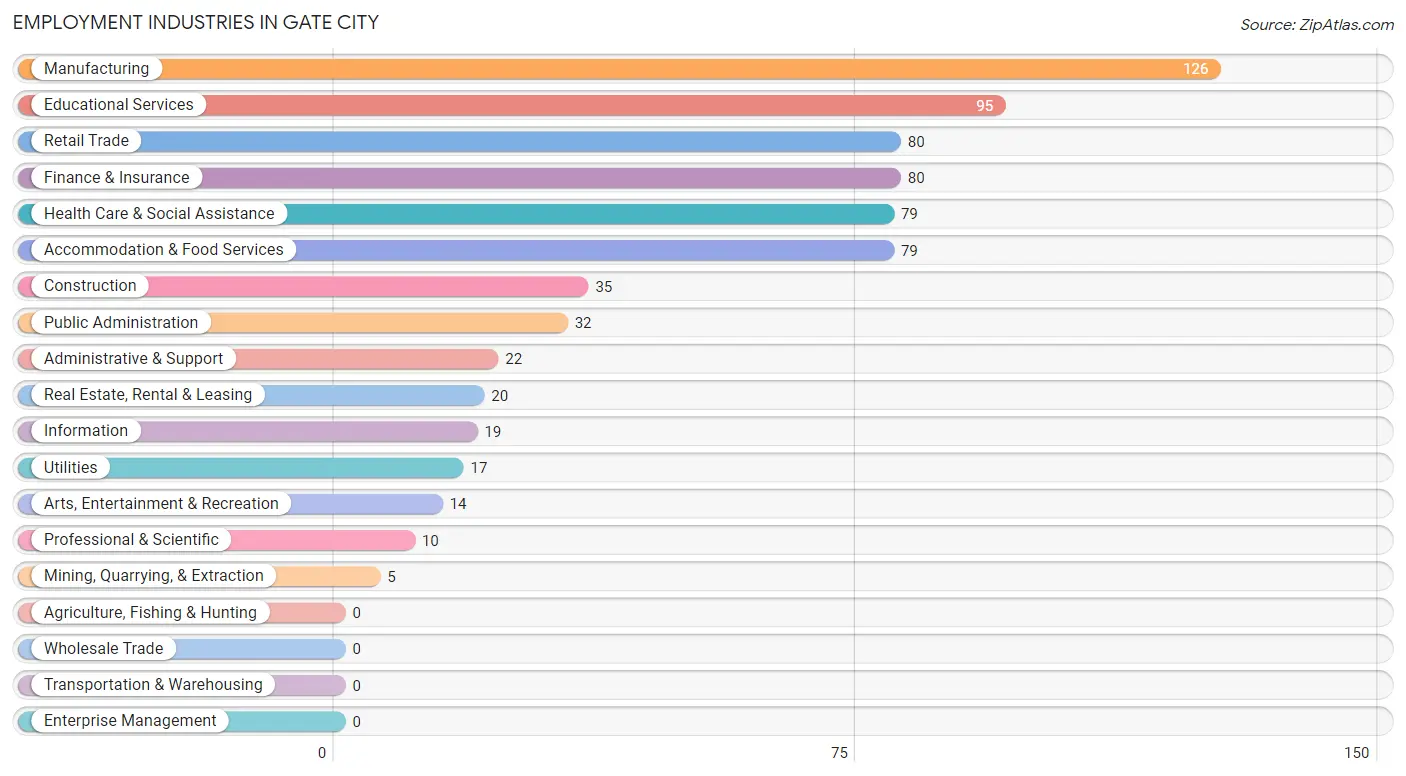
Employment Industries in Gate City
The major employment industries in Gate City include Manufacturing (126 | 17.0%), Educational Services (95 | 12.8%), Retail Trade (80 | 10.8%), Finance & Insurance (80 | 10.8%), and Health Care & Social Assistance (79 | 10.7%).
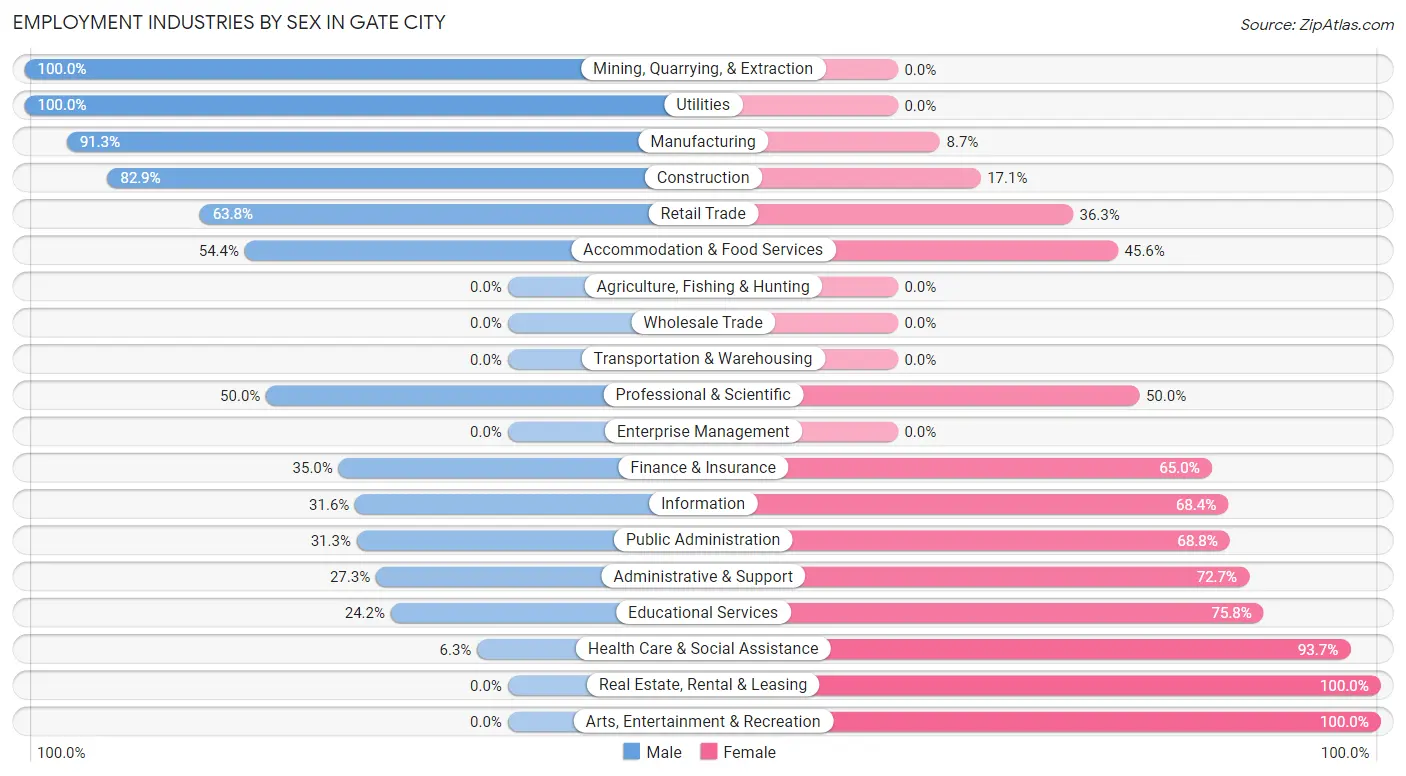
Employment Industries by Sex in Gate City
The Gate City industries that see more men than women are Mining, Quarrying, & Extraction (100.0%), Utilities (100.0%), and Manufacturing (91.3%), whereas the industries that tend to have a higher number of women are Real Estate, Rental & Leasing (100.0%), Arts, Entertainment & Recreation (100.0%), and Health Care & Social Assistance (93.7%).
| Industry | Male | Female |
| Agriculture, Fishing & Hunting | 0 (0.0%) | 0 (0.0%) |
| Mining, Quarrying, & Extraction | 5 (100.0%) | 0 (0.0%) |
| Construction | 29 (82.9%) | 6 (17.1%) |
| Manufacturing | 115 (91.3%) | 11 (8.7%) |
| Wholesale Trade | 0 (0.0%) | 0 (0.0%) |
| Retail Trade | 51 (63.7%) | 29 (36.2%) |
| Transportation & Warehousing | 0 (0.0%) | 0 (0.0%) |
| Utilities | 17 (100.0%) | 0 (0.0%) |
| Information | 6 (31.6%) | 13 (68.4%) |
| Finance & Insurance | 28 (35.0%) | 52 (65.0%) |
| Real Estate, Rental & Leasing | 0 (0.0%) | 20 (100.0%) |
| Professional & Scientific | 5 (50.0%) | 5 (50.0%) |
| Enterprise Management | 0 (0.0%) | 0 (0.0%) |
| Administrative & Support | 6 (27.3%) | 16 (72.7%) |
| Educational Services | 23 (24.2%) | 72 (75.8%) |
| Health Care & Social Assistance | 5 (6.3%) | 74 (93.7%) |
| Arts, Entertainment & Recreation | 0 (0.0%) | 14 (100.0%) |
| Accommodation & Food Services | 43 (54.4%) | 36 (45.6%) |
| Public Administration | 10 (31.2%) | 22 (68.8%) |
| Total | 365 (49.3%) | 376 (50.7%) |
Education in Gate City
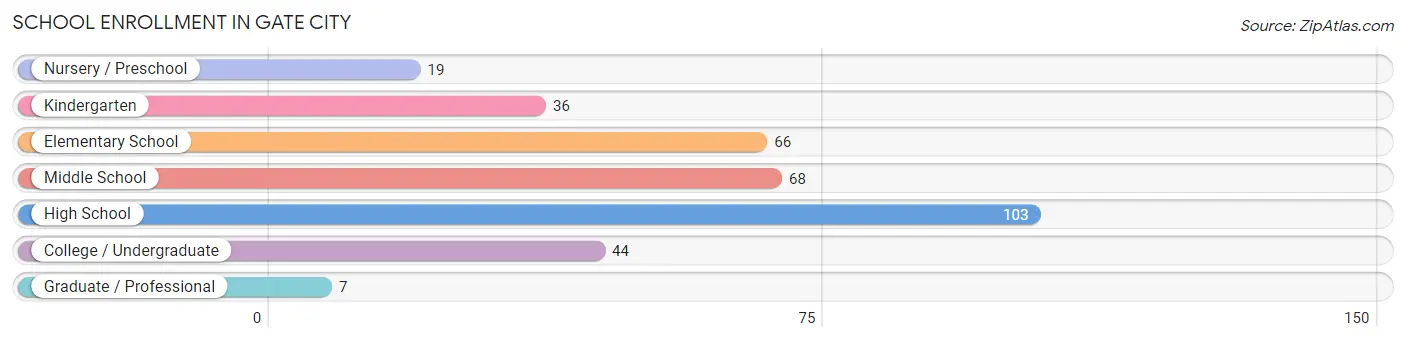
School Enrollment in Gate City
The most common levels of schooling among the 343 students in Gate City are high school (103 | 30.0%), middle school (68 | 19.8%), and elementary school (66 | 19.2%).
| School Level | # Students | % Students |
| Nursery / Preschool | 19 | 5.5% |
| Kindergarten | 36 | 10.5% |
| Elementary School | 66 | 19.2% |
| Middle School | 68 | 19.8% |
| High School | 103 | 30.0% |
| College / Undergraduate | 44 | 12.8% |
| Graduate / Professional | 7 | 2.0% |
| Total | 343 | 100.0% |
School Enrollment by Age by Funding Source in Gate City
Out of a total of 343 students who are enrolled in schools in Gate City, 66 (19.2%) attend a private institution, while the remaining 277 (80.8%) are enrolled in public schools. The age group of 3 to 4 year olds has the highest likelihood of being enrolled in private schools, with 9 (64.3% in the age bracket) enrolled. Conversely, the age group of 10 to 14 year olds has the lowest likelihood of being enrolled in a private school, with 77 (100.0% in the age bracket) attending a public institution.
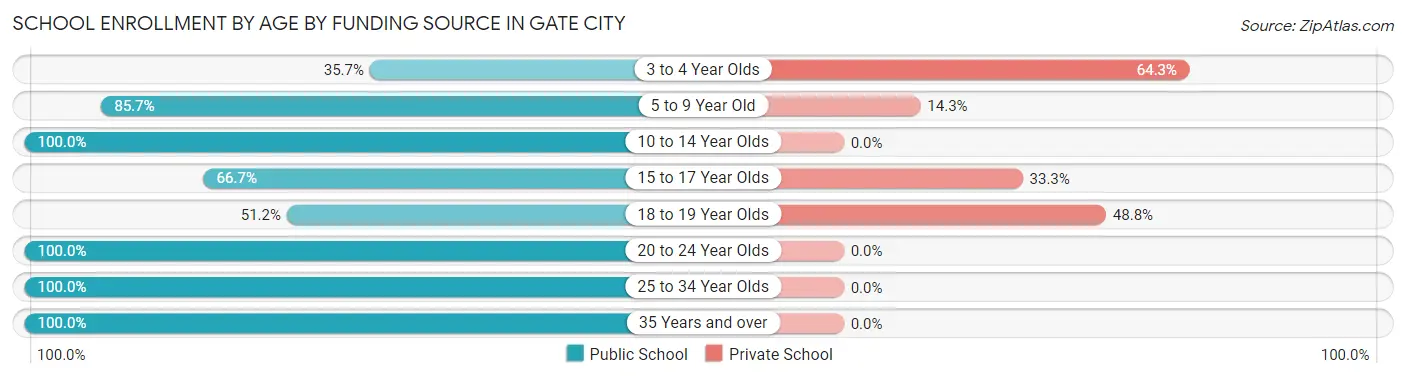
| Age Bracket | Public School | Private School |
| 3 to 4 Year Olds | 5 (35.7%) | 9 (64.3%) |
| 5 to 9 Year Old | 84 (85.7%) | 14 (14.3%) |
| 10 to 14 Year Olds | 77 (100.0%) | 0 (0.0%) |
| 15 to 17 Year Olds | 44 (66.7%) | 22 (33.3%) |
| 18 to 19 Year Olds | 22 (51.2%) | 21 (48.8%) |
| 20 to 24 Year Olds | 23 (100.0%) | 0 (0.0%) |
| 25 to 34 Year Olds | 8 (100.0%) | 0 (0.0%) |
| 35 Years and over | 14 (100.0%) | 0 (0.0%) |
| Total | 277 (80.8%) | 66 (19.2%) |
Educational Attainment by Field of Study in Gate City
Business (99 | 22.2%), social sciences (88 | 19.7%), education (80 | 17.9%), psychology (51 | 11.4%), and science & technology (23 | 5.2%) are the most common fields of study among 446 individuals in Gate City who have obtained a bachelor's degree or higher.
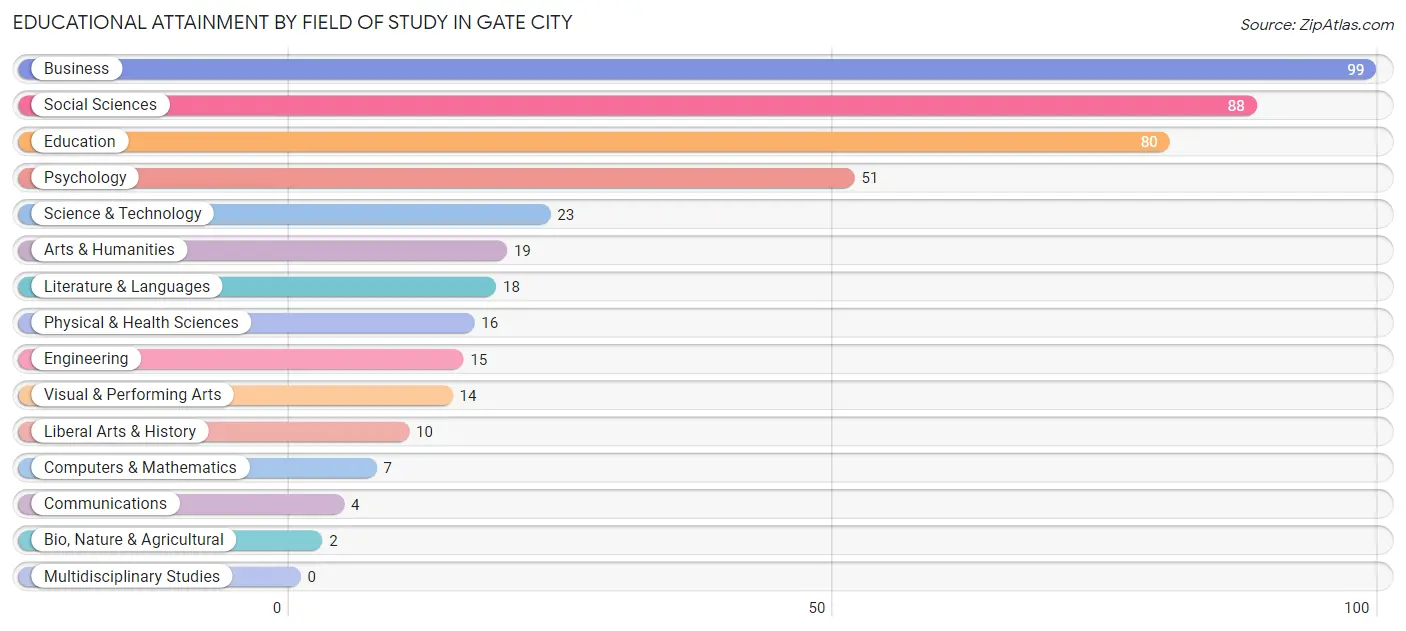
| Field of Study | # Graduates | % Graduates |
| Computers & Mathematics | 7 | 1.6% |
| Bio, Nature & Agricultural | 2 | 0.4% |
| Physical & Health Sciences | 16 | 3.6% |
| Psychology | 51 | 11.4% |
| Social Sciences | 88 | 19.7% |
| Engineering | 15 | 3.4% |
| Multidisciplinary Studies | 0 | 0.0% |
| Science & Technology | 23 | 5.2% |
| Business | 99 | 22.2% |
| Education | 80 | 17.9% |
| Literature & Languages | 18 | 4.0% |
| Liberal Arts & History | 10 | 2.2% |
| Visual & Performing Arts | 14 | 3.1% |
| Communications | 4 | 0.9% |
| Arts & Humanities | 19 | 4.3% |
| Total | 446 | 100.0% |
Transportation & Commute in Gate City
Vehicle Availability by Sex in Gate City
The most prevalent vehicle ownership categories in Gate City are males with 2 vehicles (161, accounting for 41.1%) and females with 2 vehicles (140, making up 44.6%).
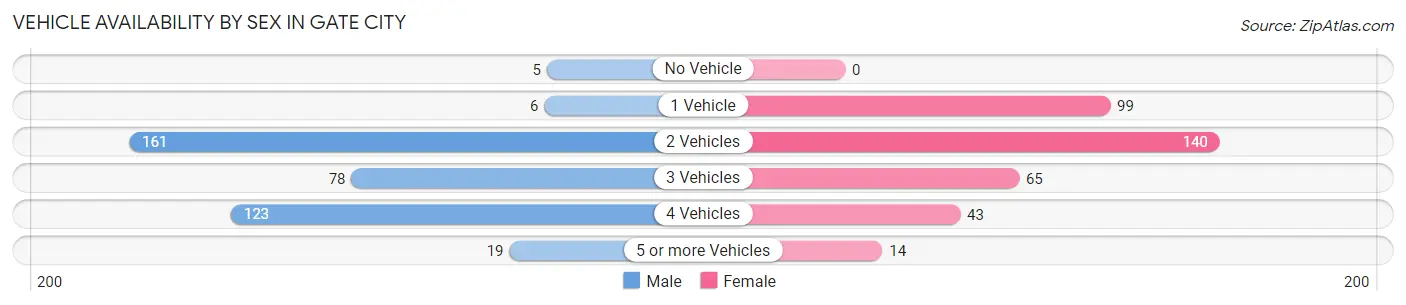
| Vehicles Available | Male | Female |
| No Vehicle | 5 (1.3%) | 0 (0.0%) |
| 1 Vehicle | 6 (1.5%) | 99 (27.4%) |
| 2 Vehicles | 161 (41.1%) | 140 (38.8%) |
| 3 Vehicles | 78 (19.9%) | 65 (18.0%) |
| 4 Vehicles | 123 (31.4%) | 43 (11.9%) |
| 5 or more Vehicles | 19 (4.9%) | 14 (3.9%) |
| Total | 392 (100.0%) | 361 (100.0%) |
Commute Time in Gate City
The most frequently occuring commute durations in Gate City are 20 to 24 minutes (173 commuters, 24.0%), 30 to 34 minutes (134 commuters, 18.6%), and 5 to 9 minutes (104 commuters, 14.4%).
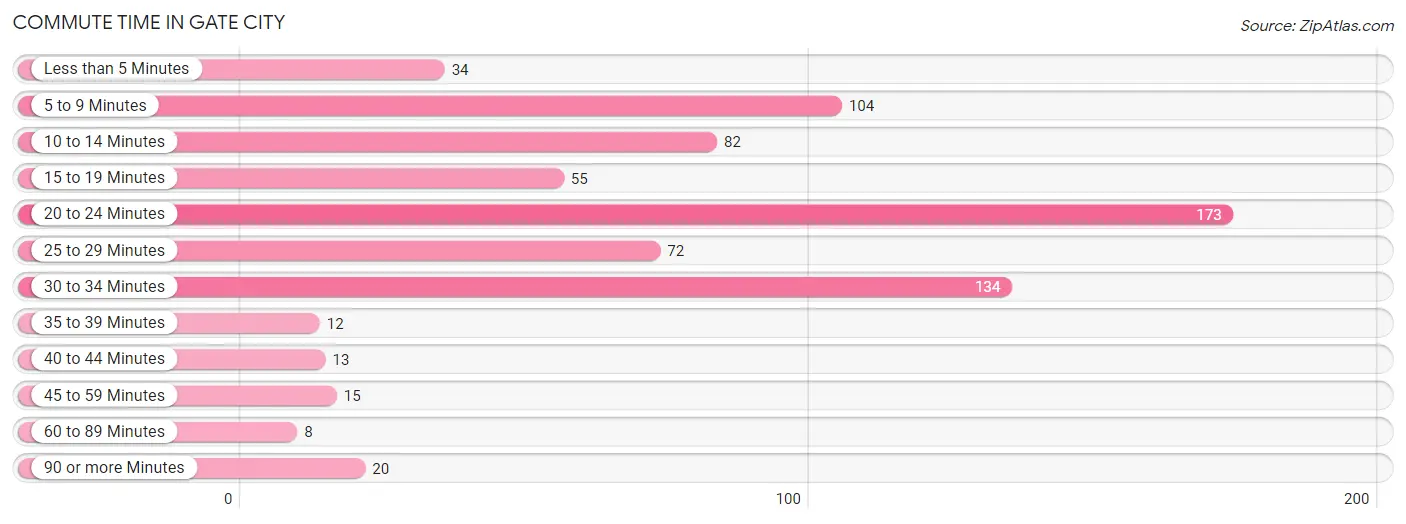
| Commute Time | # Commuters | % Commuters |
| Less than 5 Minutes | 34 | 4.7% |
| 5 to 9 Minutes | 104 | 14.4% |
| 10 to 14 Minutes | 82 | 11.4% |
| 15 to 19 Minutes | 55 | 7.6% |
| 20 to 24 Minutes | 173 | 24.0% |
| 25 to 29 Minutes | 72 | 10.0% |
| 30 to 34 Minutes | 134 | 18.6% |
| 35 to 39 Minutes | 12 | 1.7% |
| 40 to 44 Minutes | 13 | 1.8% |
| 45 to 59 Minutes | 15 | 2.1% |
| 60 to 89 Minutes | 8 | 1.1% |
| 90 or more Minutes | 20 | 2.8% |
Commute Time by Sex in Gate City
The most common commute times in Gate City are 30 to 34 minutes (120 commuters, 31.1%) for males and 20 to 24 minutes (91 commuters, 27.1%) for females.
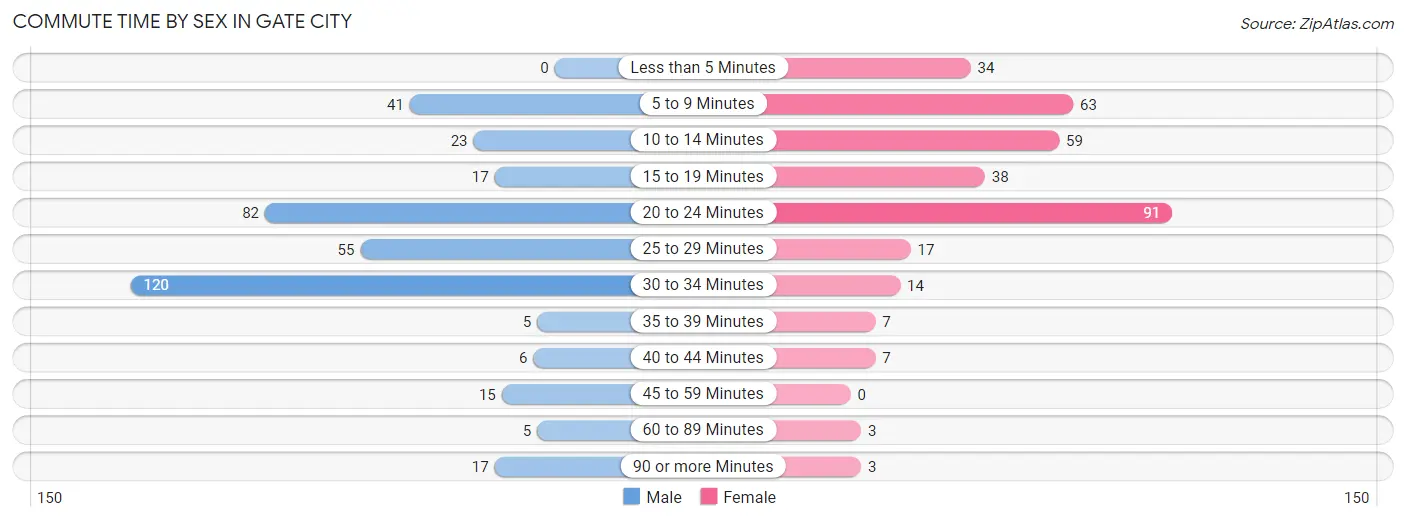
| Commute Time | Male | Female |
| Less than 5 Minutes | 0 (0.0%) | 34 (10.1%) |
| 5 to 9 Minutes | 41 (10.6%) | 63 (18.8%) |
| 10 to 14 Minutes | 23 (6.0%) | 59 (17.6%) |
| 15 to 19 Minutes | 17 (4.4%) | 38 (11.3%) |
| 20 to 24 Minutes | 82 (21.2%) | 91 (27.1%) |
| 25 to 29 Minutes | 55 (14.2%) | 17 (5.1%) |
| 30 to 34 Minutes | 120 (31.1%) | 14 (4.2%) |
| 35 to 39 Minutes | 5 (1.3%) | 7 (2.1%) |
| 40 to 44 Minutes | 6 (1.5%) | 7 (2.1%) |
| 45 to 59 Minutes | 15 (3.9%) | 0 (0.0%) |
| 60 to 89 Minutes | 5 (1.3%) | 3 (0.9%) |
| 90 or more Minutes | 17 (4.4%) | 3 (0.9%) |
Time of Departure to Work by Sex in Gate City
The most frequent times of departure to work in Gate City are 10:00 AM to 10:59 AM (74, 19.2%) for males and 7:30 AM to 7:59 AM (122, 36.3%) for females.
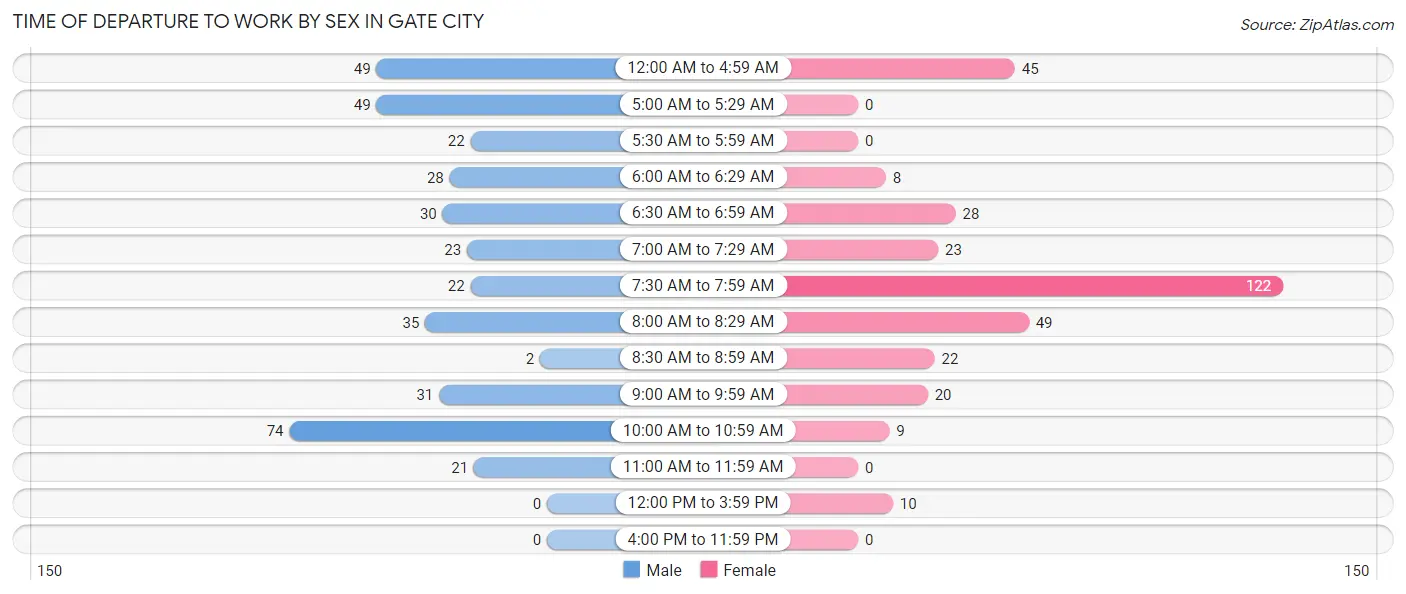
| Time of Departure | Male | Female |
| 12:00 AM to 4:59 AM | 49 (12.7%) | 45 (13.4%) |
| 5:00 AM to 5:29 AM | 49 (12.7%) | 0 (0.0%) |
| 5:30 AM to 5:59 AM | 22 (5.7%) | 0 (0.0%) |
| 6:00 AM to 6:29 AM | 28 (7.2%) | 8 (2.4%) |
| 6:30 AM to 6:59 AM | 30 (7.8%) | 28 (8.3%) |
| 7:00 AM to 7:29 AM | 23 (6.0%) | 23 (6.9%) |
| 7:30 AM to 7:59 AM | 22 (5.7%) | 122 (36.3%) |
| 8:00 AM to 8:29 AM | 35 (9.1%) | 49 (14.6%) |
| 8:30 AM to 8:59 AM | 2 (0.5%) | 22 (6.6%) |
| 9:00 AM to 9:59 AM | 31 (8.0%) | 20 (5.9%) |
| 10:00 AM to 10:59 AM | 74 (19.2%) | 9 (2.7%) |
| 11:00 AM to 11:59 AM | 21 (5.4%) | 0 (0.0%) |
| 12:00 PM to 3:59 PM | 0 (0.0%) | 10 (3.0%) |
| 4:00 PM to 11:59 PM | 0 (0.0%) | 0 (0.0%) |
| Total | 386 (100.0%) | 336 (100.0%) |
Housing Occupancy in Gate City
Occupancy by Ownership in Gate City
Of the total 891 dwellings in Gate City, owner-occupied units account for 599 (67.2%), while renter-occupied units make up 292 (32.8%).
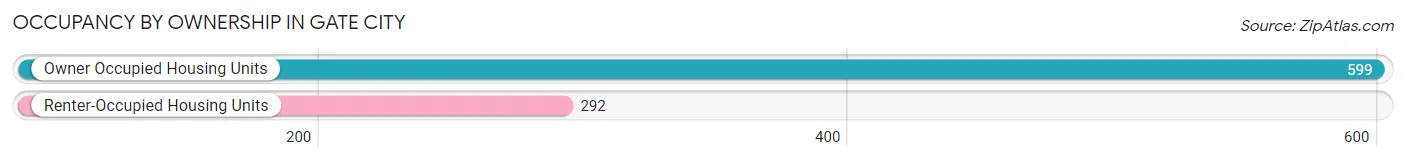
| Occupancy | # Housing Units | % Housing Units |
| Owner Occupied Housing Units | 599 | 67.2% |
| Renter-Occupied Housing Units | 292 | 32.8% |
| Total Occupied Housing Units | 891 | 100.0% |
Occupancy by Household Size in Gate City
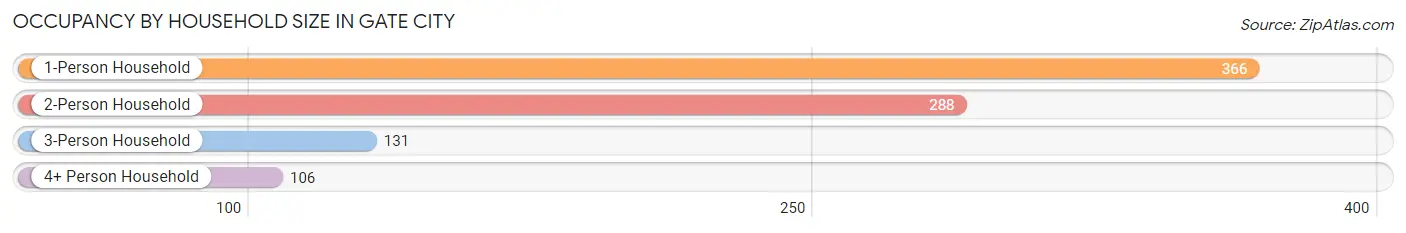
| Household Size | # Housing Units | % Housing Units |
| 1-Person Household | 366 | 41.1% |
| 2-Person Household | 288 | 32.3% |
| 3-Person Household | 131 | 14.7% |
| 4+ Person Household | 106 | 11.9% |
| Total Housing Units | 891 | 100.0% |
Occupancy by Ownership by Household Size in Gate City
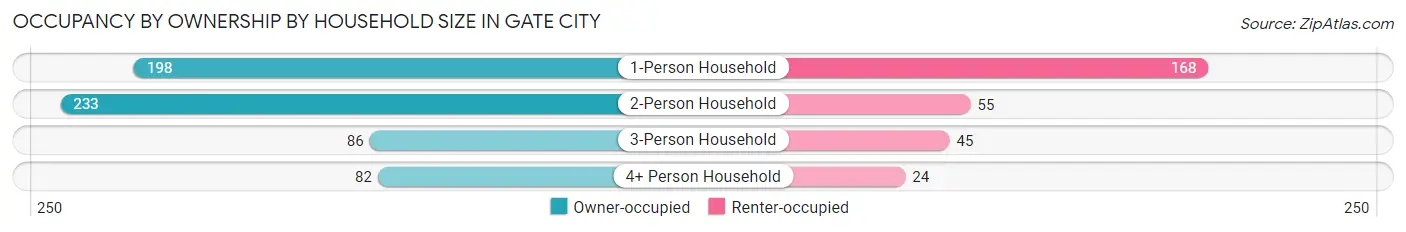
| Household Size | Owner-occupied | Renter-occupied |
| 1-Person Household | 198 (54.1%) | 168 (45.9%) |
| 2-Person Household | 233 (80.9%) | 55 (19.1%) |
| 3-Person Household | 86 (65.6%) | 45 (34.4%) |
| 4+ Person Household | 82 (77.4%) | 24 (22.6%) |
| Total Housing Units | 599 (67.2%) | 292 (32.8%) |
Occupancy by Educational Attainment in Gate City
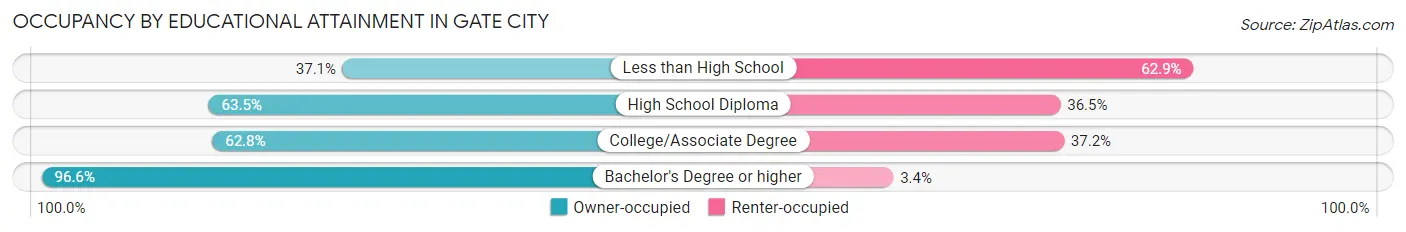
| Household Size | Owner-occupied | Renter-occupied |
| Less than High School | 46 (37.1%) | 78 (62.9%) |
| High School Diploma | 127 (63.5%) | 73 (36.5%) |
| College/Associate Degree | 226 (62.8%) | 134 (37.2%) |
| Bachelor's Degree or higher | 200 (96.6%) | 7 (3.4%) |
Occupancy by Age of Householder in Gate City
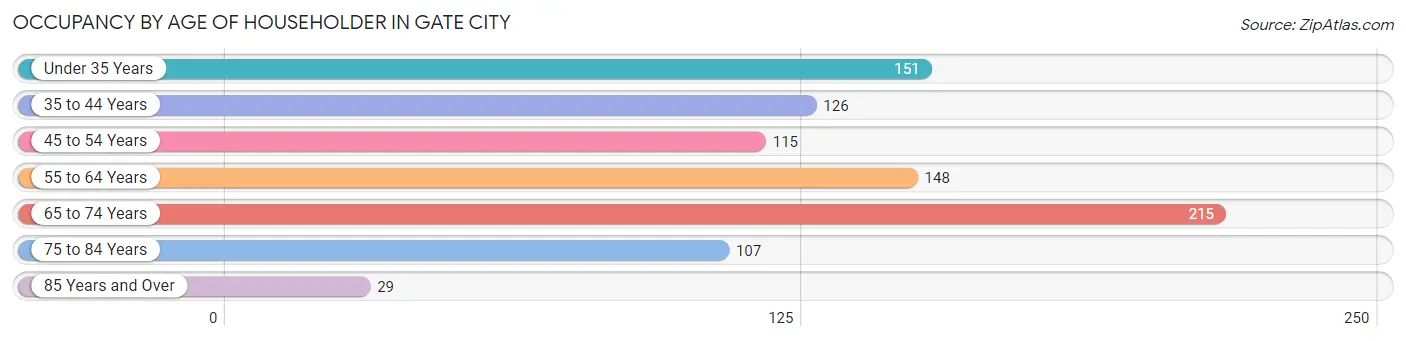
| Age Bracket | # Households | % Households |
| Under 35 Years | 151 | 17.0% |
| 35 to 44 Years | 126 | 14.1% |
| 45 to 54 Years | 115 | 12.9% |
| 55 to 64 Years | 148 | 16.6% |
| 65 to 74 Years | 215 | 24.1% |
| 75 to 84 Years | 107 | 12.0% |
| 85 Years and Over | 29 | 3.3% |
| Total | 891 | 100.0% |
Housing Finances in Gate City
Median Income by Occupancy in Gate City
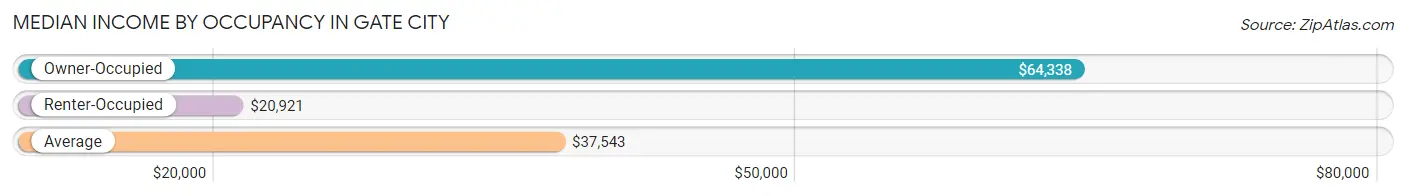
| Occupancy Type | # Households | Median Income |
| Owner-Occupied | 599 (67.2%) | $64,338 |
| Renter-Occupied | 292 (32.8%) | $20,921 |
| Average | 891 (100.0%) | $37,543 |
Occupancy by Householder Income Bracket in Gate City
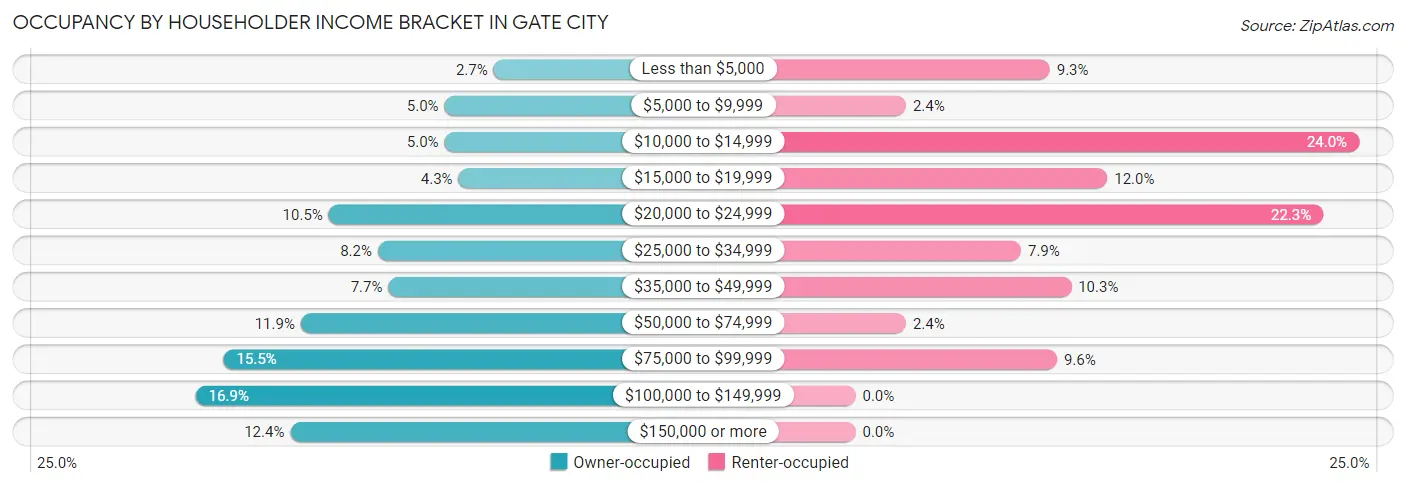
| Income Bracket | Owner-occupied | Renter-occupied |
| Less than $5,000 | 16 (2.7%) | 27 (9.2%) |
| $5,000 to $9,999 | 30 (5.0%) | 7 (2.4%) |
| $10,000 to $14,999 | 30 (5.0%) | 70 (24.0%) |
| $15,000 to $19,999 | 26 (4.3%) | 35 (12.0%) |
| $20,000 to $24,999 | 63 (10.5%) | 65 (22.3%) |
| $25,000 to $34,999 | 49 (8.2%) | 23 (7.9%) |
| $35,000 to $49,999 | 46 (7.7%) | 30 (10.3%) |
| $50,000 to $74,999 | 71 (11.8%) | 7 (2.4%) |
| $75,000 to $99,999 | 93 (15.5%) | 28 (9.6%) |
| $100,000 to $149,999 | 101 (16.9%) | 0 (0.0%) |
| $150,000 or more | 74 (12.3%) | 0 (0.0%) |
| Total | 599 (100.0%) | 292 (100.0%) |
Monthly Housing Cost Tiers in Gate City
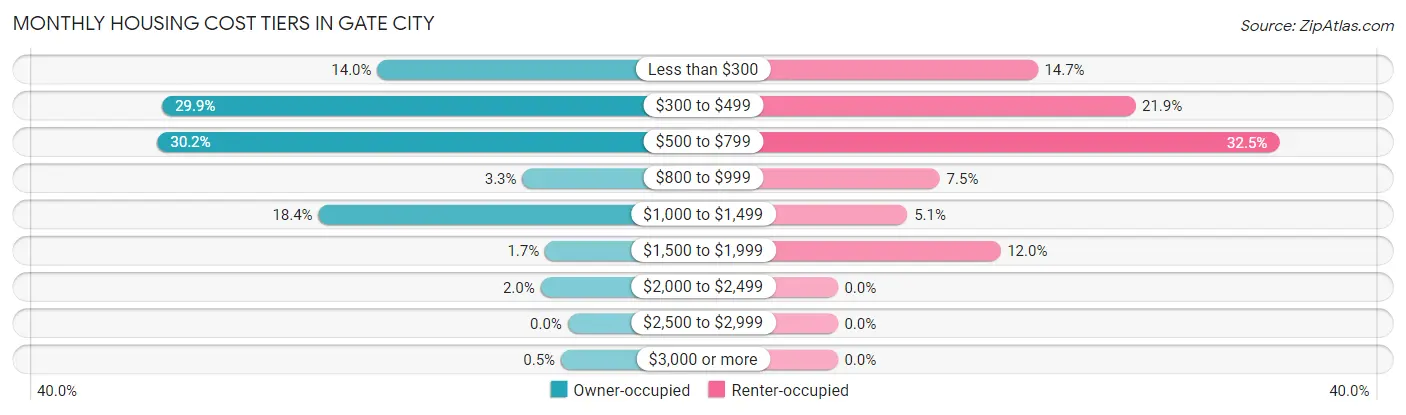
| Monthly Cost | Owner-occupied | Renter-occupied |
| Less than $300 | 84 (14.0%) | 43 (14.7%) |
| $300 to $499 | 179 (29.9%) | 64 (21.9%) |
| $500 to $799 | 181 (30.2%) | 95 (32.5%) |
| $800 to $999 | 20 (3.3%) | 22 (7.5%) |
| $1,000 to $1,499 | 110 (18.4%) | 15 (5.1%) |
| $1,500 to $1,999 | 10 (1.7%) | 35 (12.0%) |
| $2,000 to $2,499 | 12 (2.0%) | 0 (0.0%) |
| $2,500 to $2,999 | 0 (0.0%) | 0 (0.0%) |
| $3,000 or more | 3 (0.5%) | 0 (0.0%) |
| Total | 599 (100.0%) | 292 (100.0%) |
Physical Housing Characteristics in Gate City
Housing Structures in Gate City
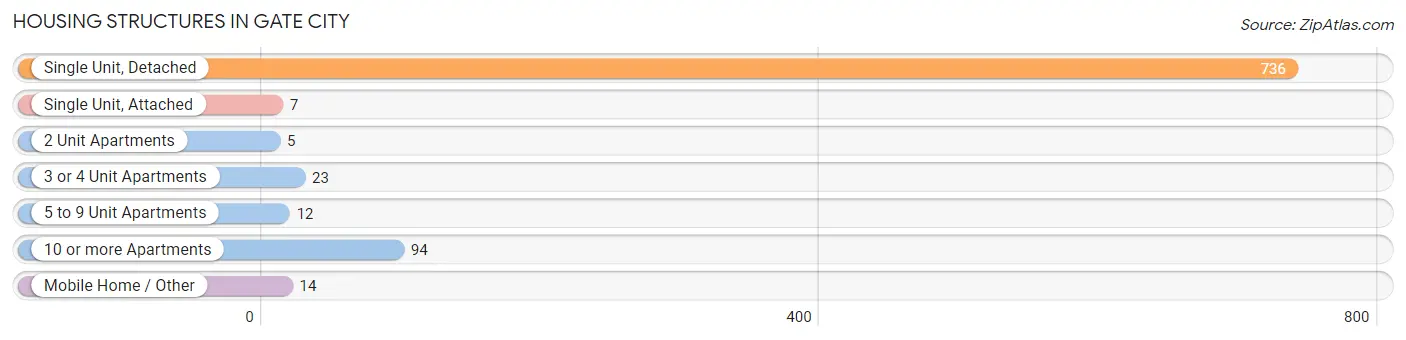
| Structure Type | # Housing Units | % Housing Units |
| Single Unit, Detached | 736 | 82.6% |
| Single Unit, Attached | 7 | 0.8% |
| 2 Unit Apartments | 5 | 0.6% |
| 3 or 4 Unit Apartments | 23 | 2.6% |
| 5 to 9 Unit Apartments | 12 | 1.3% |
| 10 or more Apartments | 94 | 10.5% |
| Mobile Home / Other | 14 | 1.6% |
| Total | 891 | 100.0% |
Housing Structures by Occupancy in Gate City
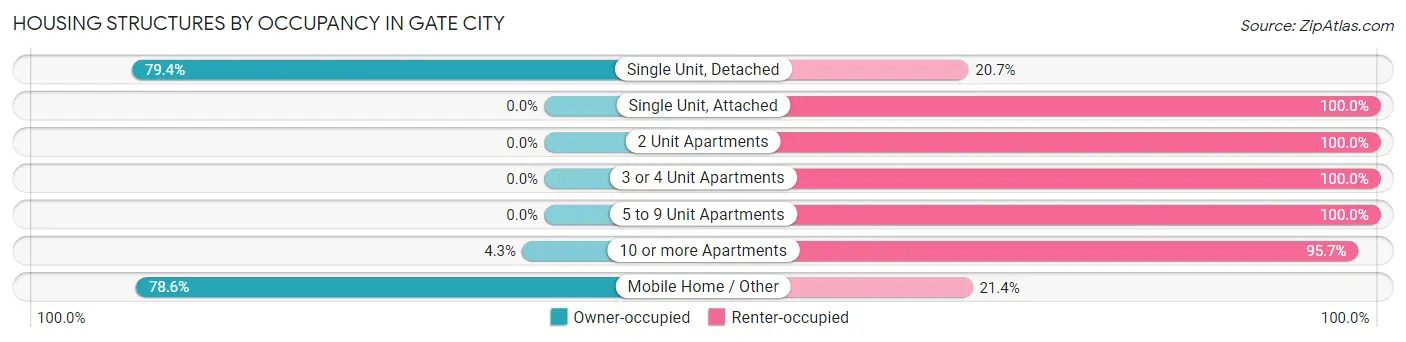
| Structure Type | Owner-occupied | Renter-occupied |
| Single Unit, Detached | 584 (79.3%) | 152 (20.6%) |
| Single Unit, Attached | 0 (0.0%) | 7 (100.0%) |
| 2 Unit Apartments | 0 (0.0%) | 5 (100.0%) |
| 3 or 4 Unit Apartments | 0 (0.0%) | 23 (100.0%) |
| 5 to 9 Unit Apartments | 0 (0.0%) | 12 (100.0%) |
| 10 or more Apartments | 4 (4.3%) | 90 (95.7%) |
| Mobile Home / Other | 11 (78.6%) | 3 (21.4%) |
| Total | 599 (67.2%) | 292 (32.8%) |
Housing Structures by Number of Rooms in Gate City
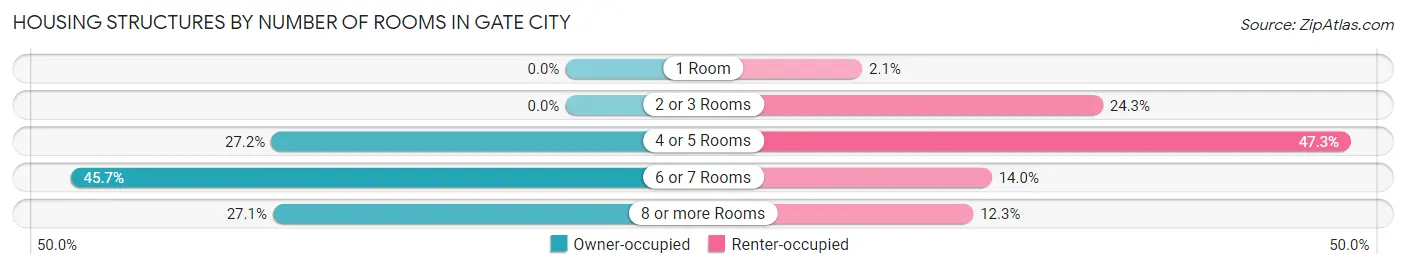
| Number of Rooms | Owner-occupied | Renter-occupied |
| 1 Room | 0 (0.0%) | 6 (2.1%) |
| 2 or 3 Rooms | 0 (0.0%) | 71 (24.3%) |
| 4 or 5 Rooms | 163 (27.2%) | 138 (47.3%) |
| 6 or 7 Rooms | 274 (45.7%) | 41 (14.0%) |
| 8 or more Rooms | 162 (27.1%) | 36 (12.3%) |
| Total | 599 (100.0%) | 292 (100.0%) |
Housing Structure by Heating Type in Gate City
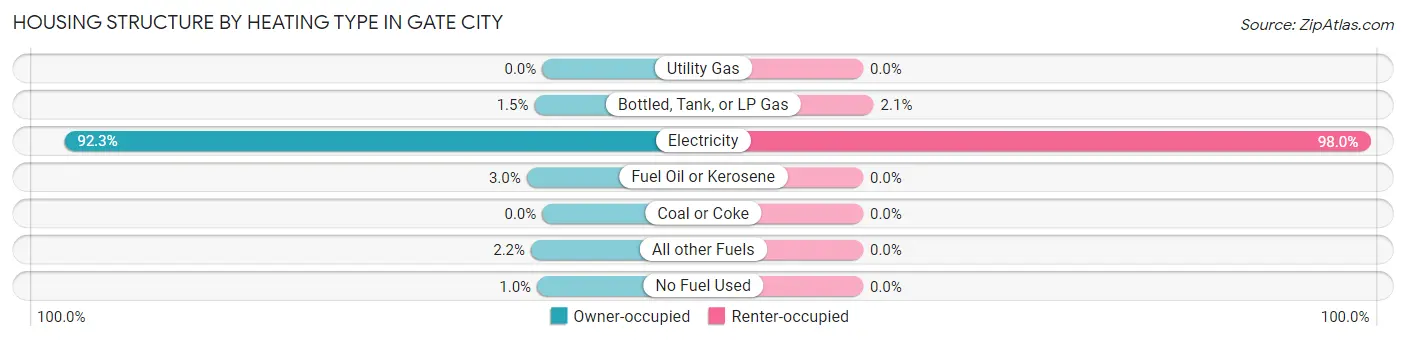
| Heating Type | Owner-occupied | Renter-occupied |
| Utility Gas | 0 (0.0%) | 0 (0.0%) |
| Bottled, Tank, or LP Gas | 9 (1.5%) | 6 (2.1%) |
| Electricity | 553 (92.3%) | 286 (98.0%) |
| Fuel Oil or Kerosene | 18 (3.0%) | 0 (0.0%) |
| Coal or Coke | 0 (0.0%) | 0 (0.0%) |
| All other Fuels | 13 (2.2%) | 0 (0.0%) |
| No Fuel Used | 6 (1.0%) | 0 (0.0%) |
| Total | 599 (100.0%) | 292 (100.0%) |
Household Vehicle Usage in Gate City
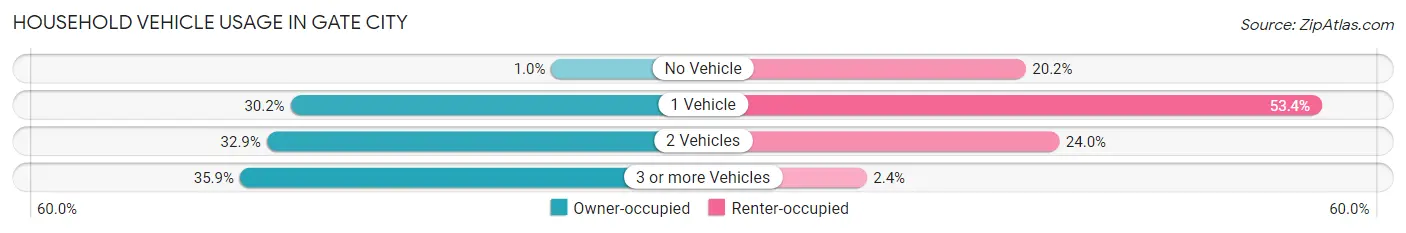
| Vehicles per Household | Owner-occupied | Renter-occupied |
| No Vehicle | 6 (1.0%) | 59 (20.2%) |
| 1 Vehicle | 181 (30.2%) | 156 (53.4%) |
| 2 Vehicles | 197 (32.9%) | 70 (24.0%) |
| 3 or more Vehicles | 215 (35.9%) | 7 (2.4%) |
| Total | 599 (100.0%) | 292 (100.0%) |
Real Estate & Mortgages in Gate City
Real Estate and Mortgage Overview in Gate City
| Characteristic | Without Mortgage | With Mortgage |
| Housing Units | 395 | 204 |
| Median Property Value | $155,700 | $162,300 |
| Median Household Income | $43,036 | $19 |
| Monthly Housing Costs | $388 | $3 |
| Real Estate Taxes | $965 | $0 |
Property Value by Mortgage Status in Gate City
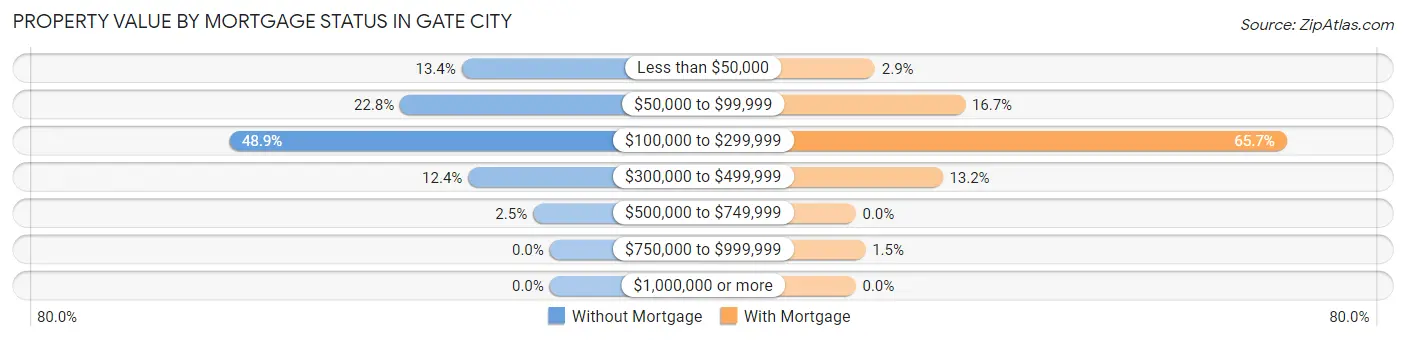
| Property Value | Without Mortgage | With Mortgage |
| Less than $50,000 | 53 (13.4%) | 6 (2.9%) |
| $50,000 to $99,999 | 90 (22.8%) | 34 (16.7%) |
| $100,000 to $299,999 | 193 (48.9%) | 134 (65.7%) |
| $300,000 to $499,999 | 49 (12.4%) | 27 (13.2%) |
| $500,000 to $749,999 | 10 (2.5%) | 0 (0.0%) |
| $750,000 to $999,999 | 0 (0.0%) | 3 (1.5%) |
| $1,000,000 or more | 0 (0.0%) | 0 (0.0%) |
| Total | 395 (100.0%) | 204 (100.0%) |
Household Income by Mortgage Status in Gate City
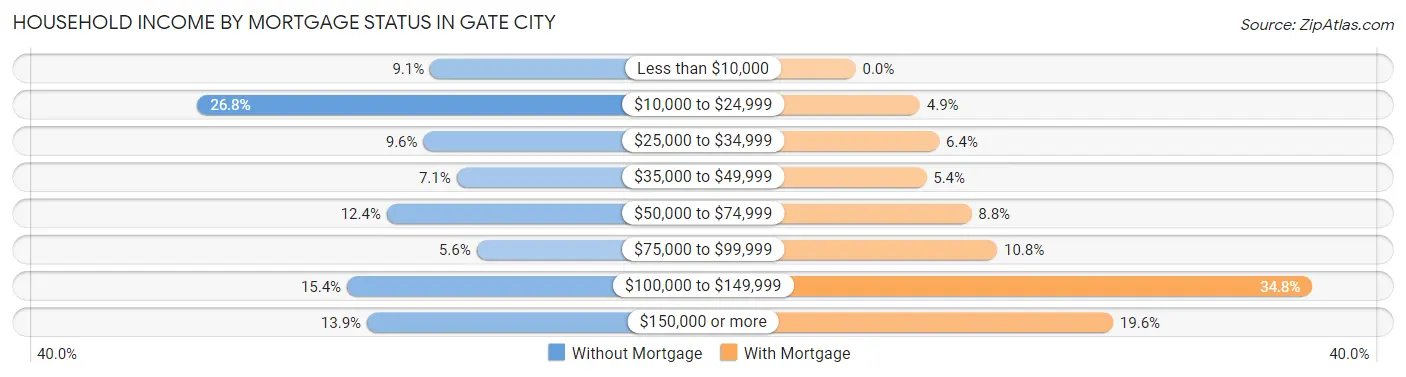
| Household Income | Without Mortgage | With Mortgage |
| Less than $10,000 | 36 (9.1%) | 0 (0.0%) |
| $10,000 to $24,999 | 106 (26.8%) | 10 (4.9%) |
| $25,000 to $34,999 | 38 (9.6%) | 13 (6.4%) |
| $35,000 to $49,999 | 28 (7.1%) | 11 (5.4%) |
| $50,000 to $74,999 | 49 (12.4%) | 18 (8.8%) |
| $75,000 to $99,999 | 22 (5.6%) | 22 (10.8%) |
| $100,000 to $149,999 | 61 (15.4%) | 71 (34.8%) |
| $150,000 or more | 55 (13.9%) | 40 (19.6%) |
| Total | 395 (100.0%) | 204 (100.0%) |
Property Value to Household Income Ratio in Gate City
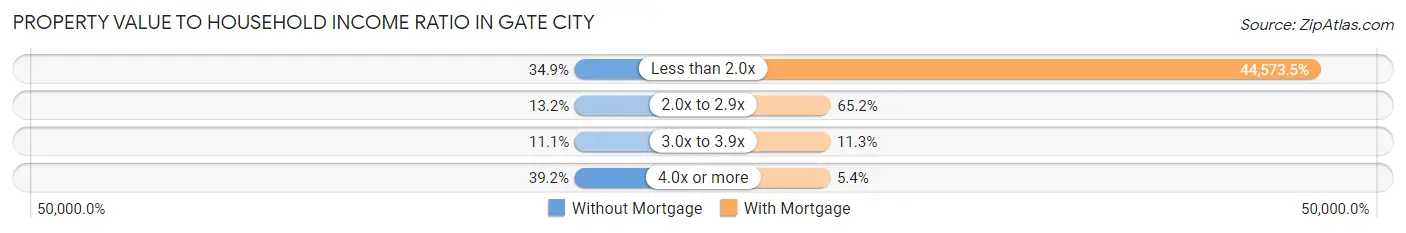
| Value-to-Income Ratio | Without Mortgage | With Mortgage |
| Less than 2.0x | 138 (34.9%) | 90,930 (44,573.5%) |
| 2.0x to 2.9x | 52 (13.2%) | 133 (65.2%) |
| 3.0x to 3.9x | 44 (11.1%) | 23 (11.3%) |
| 4.0x or more | 155 (39.2%) | 11 (5.4%) |
| Total | 395 (100.0%) | 204 (100.0%) |
Real Estate Taxes by Mortgage Status in Gate City
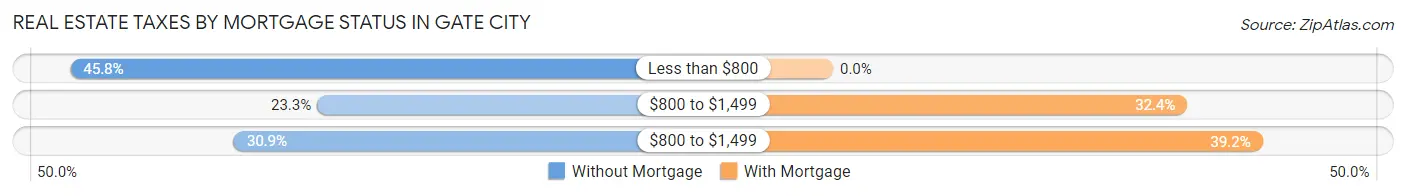
| Property Taxes | Without Mortgage | With Mortgage |
| Less than $800 | 181 (45.8%) | 0 (0.0%) |
| $800 to $1,499 | 92 (23.3%) | 66 (32.4%) |
| $800 to $1,499 | 122 (30.9%) | 80 (39.2%) |
| Total | 395 (100.0%) | 204 (100.0%) |
Health & Disability in Gate City
Health Insurance Coverage by Age in Gate City
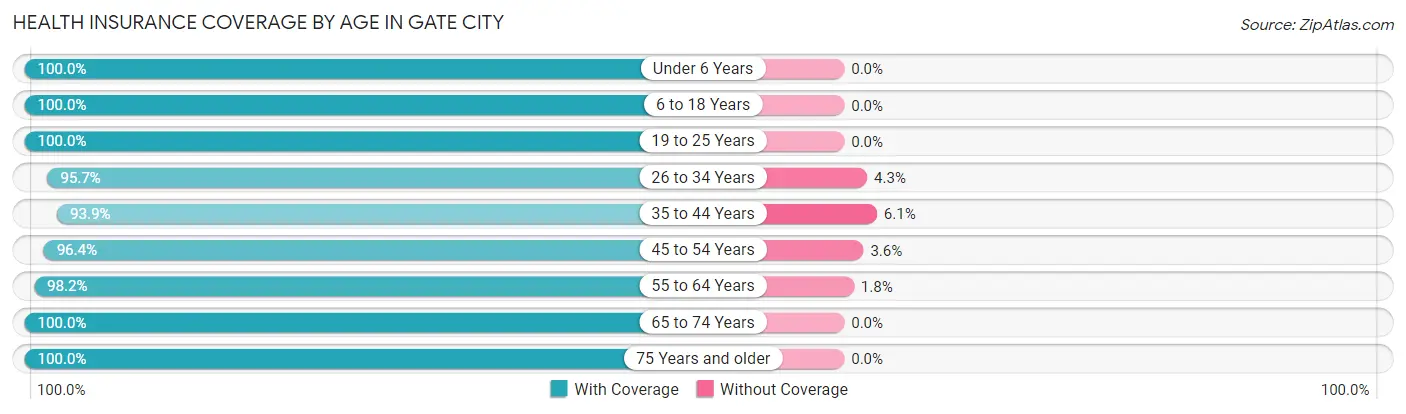
| Age Bracket | With Coverage | Without Coverage |
| Under 6 Years | 99 (100.0%) | 0 (0.0%) |
| 6 to 18 Years | 311 (100.0%) | 0 (0.0%) |
| 19 to 25 Years | 92 (100.0%) | 0 (0.0%) |
| 26 to 34 Years | 270 (95.7%) | 12 (4.3%) |
| 35 to 44 Years | 170 (93.9%) | 11 (6.1%) |
| 45 to 54 Years | 162 (96.4%) | 6 (3.6%) |
| 55 to 64 Years | 274 (98.2%) | 5 (1.8%) |
| 65 to 74 Years | 303 (100.0%) | 0 (0.0%) |
| 75 Years and older | 164 (100.0%) | 0 (0.0%) |
| Total | 1,845 (98.2%) | 34 (1.8%) |
Health Insurance Coverage by Citizenship Status in Gate City
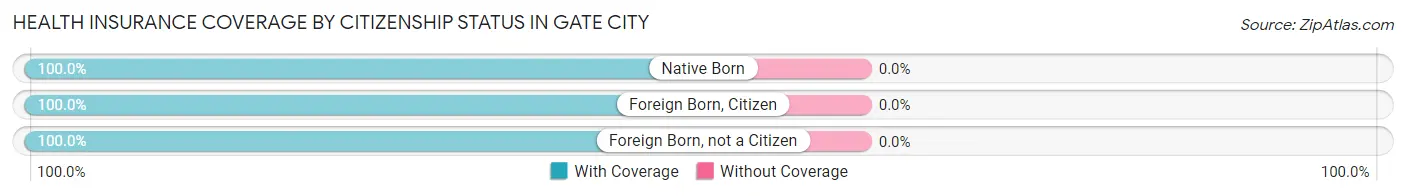
| Citizenship Status | With Coverage | Without Coverage |
| Native Born | 99 (100.0%) | 0 (0.0%) |
| Foreign Born, Citizen | 311 (100.0%) | 0 (0.0%) |
| Foreign Born, not a Citizen | 92 (100.0%) | 0 (0.0%) |
Health Insurance Coverage by Household Income in Gate City
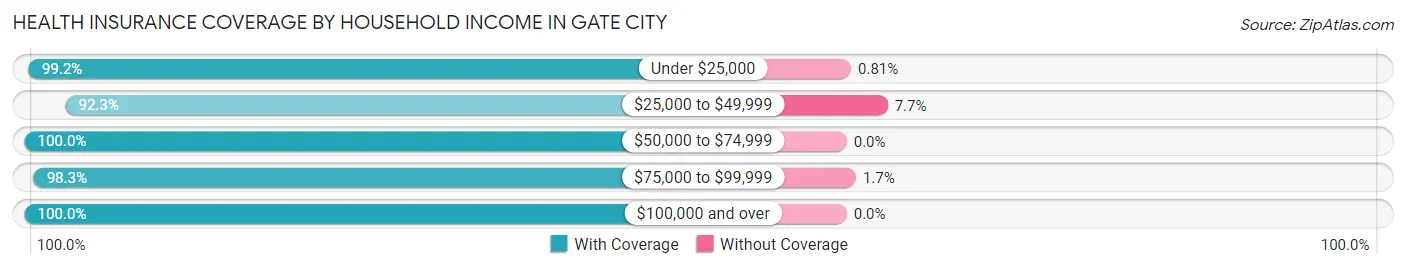
| Household Income | With Coverage | Without Coverage |
| Under $25,000 | 615 (99.2%) | 5 (0.8%) |
| $25,000 to $49,999 | 289 (92.3%) | 24 (7.7%) |
| $50,000 to $74,999 | 113 (100.0%) | 0 (0.0%) |
| $75,000 to $99,999 | 286 (98.3%) | 5 (1.7%) |
| $100,000 and over | 542 (100.0%) | 0 (0.0%) |
Public vs Private Health Insurance Coverage by Age in Gate City
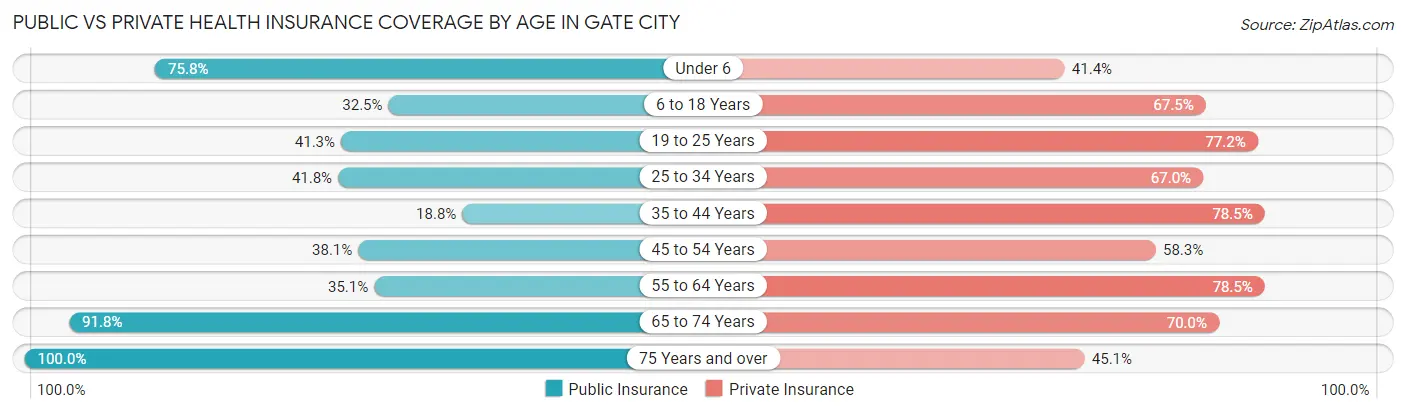
| Age Bracket | Public Insurance | Private Insurance |
| Under 6 | 75 (75.8%) | 41 (41.4%) |
| 6 to 18 Years | 101 (32.5%) | 210 (67.5%) |
| 19 to 25 Years | 38 (41.3%) | 71 (77.2%) |
| 25 to 34 Years | 118 (41.8%) | 189 (67.0%) |
| 35 to 44 Years | 34 (18.8%) | 142 (78.4%) |
| 45 to 54 Years | 64 (38.1%) | 98 (58.3%) |
| 55 to 64 Years | 98 (35.1%) | 219 (78.5%) |
| 65 to 74 Years | 278 (91.7%) | 212 (70.0%) |
| 75 Years and over | 164 (100.0%) | 74 (45.1%) |
| Total | 970 (51.6%) | 1,256 (66.8%) |
Disability Status by Sex by Age in Gate City
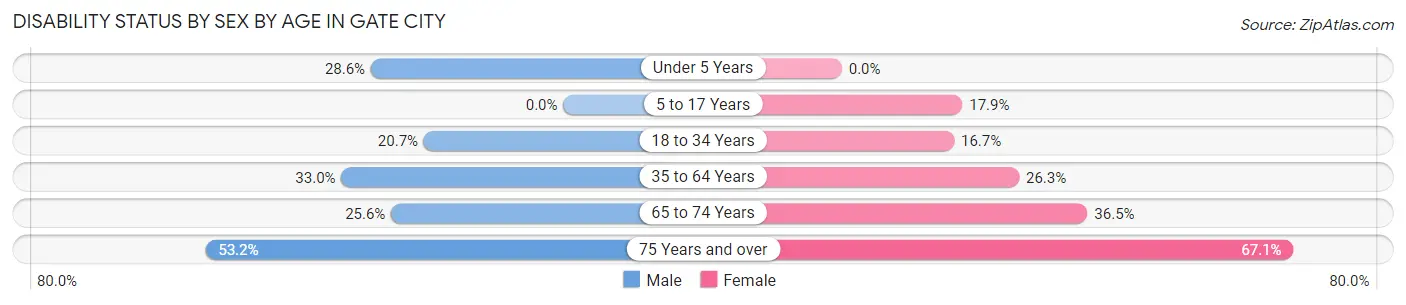
| Age Bracket | Male | Female |
| Under 5 Years | 8 (28.6%) | 0 (0.0%) |
| 5 to 17 Years | 0 (0.0%) | 39 (17.9%) |
| 18 to 34 Years | 58 (20.7%) | 23 (16.7%) |
| 35 to 64 Years | 88 (33.0%) | 95 (26.3%) |
| 65 to 74 Years | 34 (25.6%) | 62 (36.5%) |
| 75 Years and over | 42 (53.2%) | 57 (67.1%) |
Disability Class by Sex by Age in Gate City
Disability Class: Hearing Difficulty
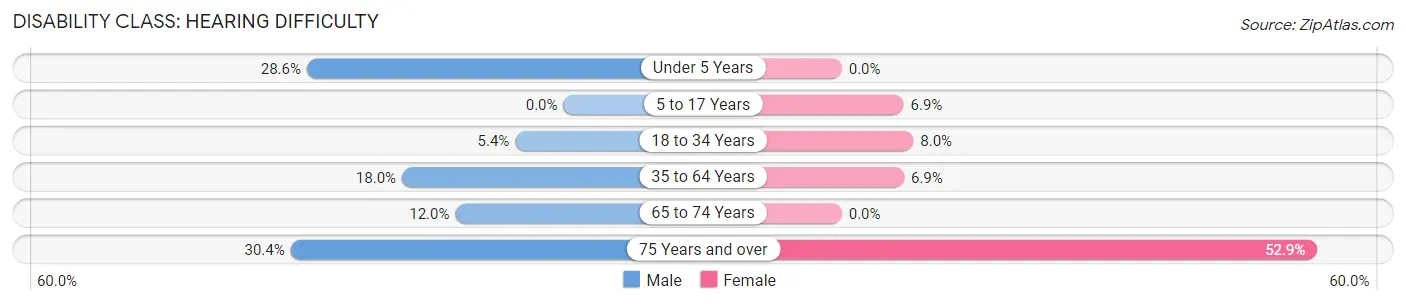
| Age Bracket | Male | Female |
| Under 5 Years | 8 (28.6%) | 0 (0.0%) |
| 5 to 17 Years | 0 (0.0%) | 15 (6.9%) |
| 18 to 34 Years | 15 (5.4%) | 11 (8.0%) |
| 35 to 64 Years | 48 (18.0%) | 25 (6.9%) |
| 65 to 74 Years | 16 (12.0%) | 0 (0.0%) |
| 75 Years and over | 24 (30.4%) | 45 (52.9%) |
Disability Class: Vision Difficulty
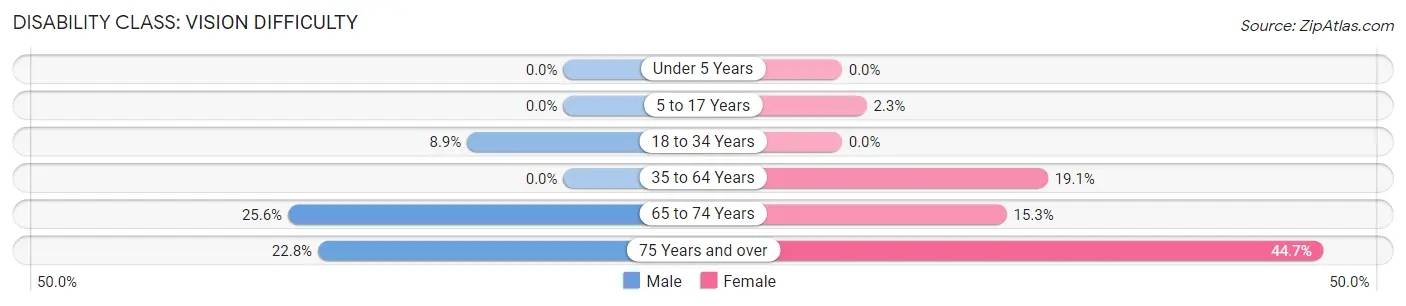
| Age Bracket | Male | Female |
| Under 5 Years | 0 (0.0%) | 0 (0.0%) |
| 5 to 17 Years | 0 (0.0%) | 5 (2.3%) |
| 18 to 34 Years | 25 (8.9%) | 0 (0.0%) |
| 35 to 64 Years | 0 (0.0%) | 69 (19.1%) |
| 65 to 74 Years | 34 (25.6%) | 26 (15.3%) |
| 75 Years and over | 18 (22.8%) | 38 (44.7%) |
Disability Class: Cognitive Difficulty
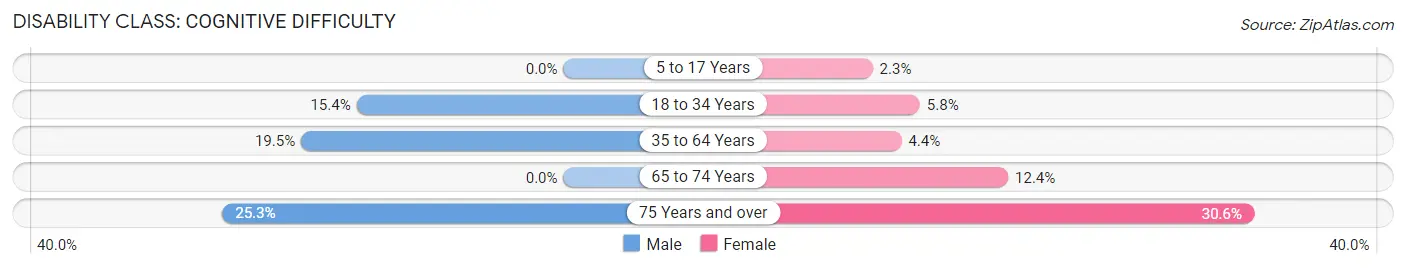
| Age Bracket | Male | Female |
| 5 to 17 Years | 0 (0.0%) | 5 (2.3%) |
| 18 to 34 Years | 43 (15.4%) | 8 (5.8%) |
| 35 to 64 Years | 52 (19.5%) | 16 (4.4%) |
| 65 to 74 Years | 0 (0.0%) | 21 (12.3%) |
| 75 Years and over | 20 (25.3%) | 26 (30.6%) |
Disability Class: Ambulatory Difficulty
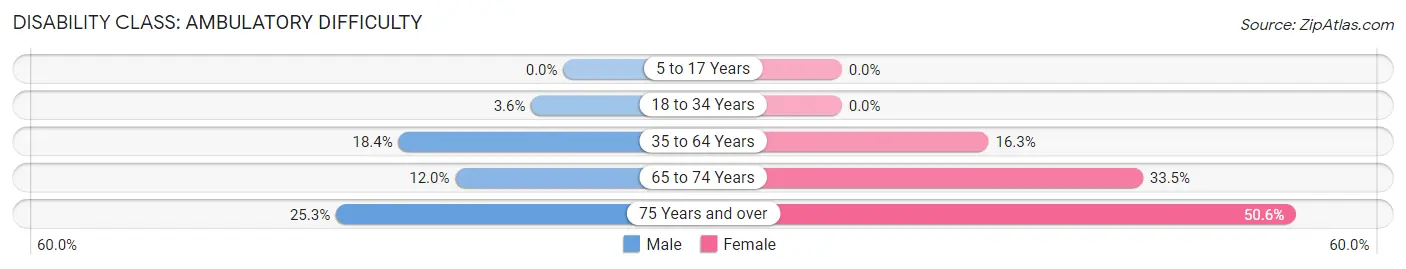
| Age Bracket | Male | Female |
| 5 to 17 Years | 0 (0.0%) | 0 (0.0%) |
| 18 to 34 Years | 10 (3.6%) | 0 (0.0%) |
| 35 to 64 Years | 49 (18.3%) | 59 (16.3%) |
| 65 to 74 Years | 16 (12.0%) | 57 (33.5%) |
| 75 Years and over | 20 (25.3%) | 43 (50.6%) |
Disability Class: Self-Care Difficulty
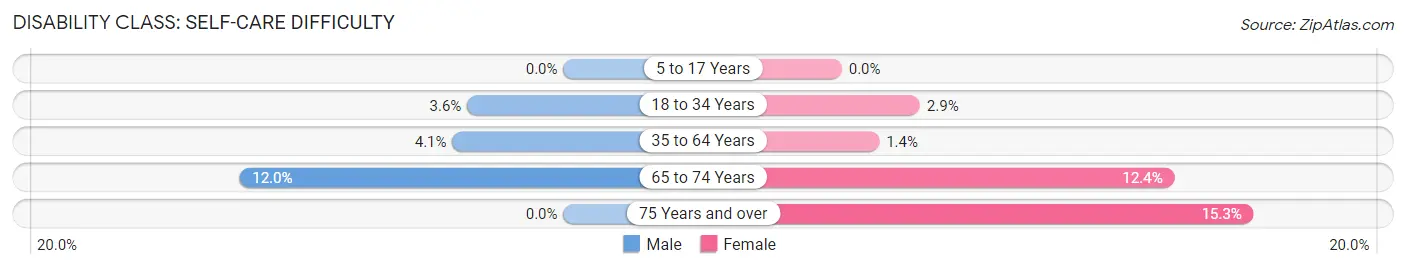
| Age Bracket | Male | Female |
| 5 to 17 Years | 0 (0.0%) | 0 (0.0%) |
| 18 to 34 Years | 10 (3.6%) | 4 (2.9%) |
| 35 to 64 Years | 11 (4.1%) | 5 (1.4%) |
| 65 to 74 Years | 16 (12.0%) | 21 (12.3%) |
| 75 Years and over | 0 (0.0%) | 13 (15.3%) |
Technology Access in Gate City
Computing Device Access in Gate City
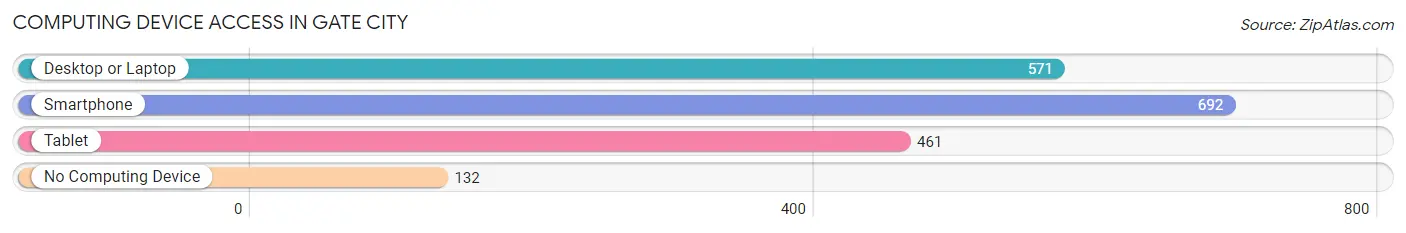
| Device Type | # Households | % Households |
| Desktop or Laptop | 571 | 64.1% |
| Smartphone | 692 | 77.7% |
| Tablet | 461 | 51.7% |
| No Computing Device | 132 | 14.8% |
| Total | 891 | 100.0% |
Internet Access in Gate City
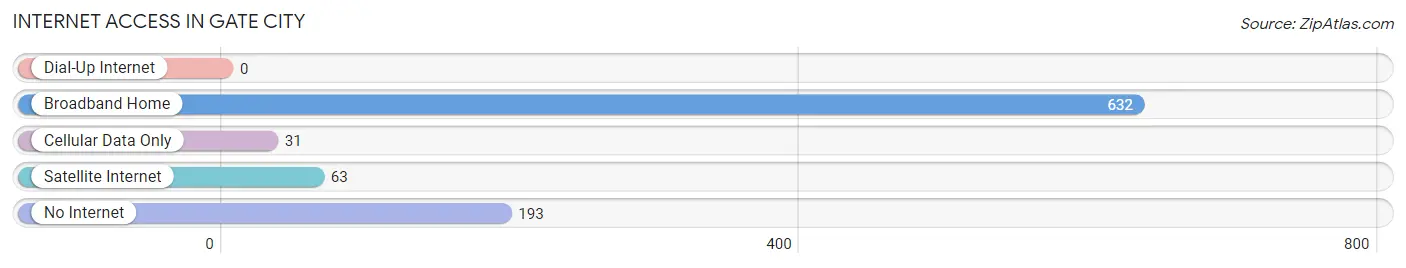
| Internet Type | # Households | % Households |
| Dial-Up Internet | 0 | 0.0% |
| Broadband Home | 632 | 70.9% |
| Cellular Data Only | 31 | 3.5% |
| Satellite Internet | 63 | 7.1% |
| No Internet | 193 | 21.7% |
| Total | 891 | 100.0% |
Gate City Summary
City of Gate City Virginia
Gate City is a town in Scott County, Virginia, United States. The population was 2,034 at the 2010 census. It is the county seat of Scott County.
History
Gate City was founded in 1854 and named for its location at the entrance to the Clinch Valley. The town was incorporated in 1872. The town was originally known as Clinchport, but the name was changed to Gate City in 1876.
The town was the site of a Civil War battle in 1864, when Confederate forces under General John C. Breckinridge attempted to break the Union blockade of the Clinch River. The Union forces were victorious, and the town was occupied by Union troops for the remainder of the war.
Gate City was also the site of a major railroad junction in the late 19th century. The Norfolk and Western Railway and the Clinchfield Railroad both had lines running through the town, and the junction was a major hub for freight and passenger traffic.
Geography
Gate City is located at 36 41 25 North 82 37 17 West 36 690278 82 621389
According to the United States Census Bureau, the town has a total area of 1.2 square miles (3.1 km2), all of it land.
Economy
Gate City is the county seat of Scott County, and as such is home to many county government offices. The town is also home to several small businesses, including a grocery store, a hardware store, and a few restaurants.
The town is also home to a number of manufacturing companies, including a furniture factory, a plastics factory, and a paper mill.
Demographics
As of the census of 2000, there were 2,034 people, 845 households, and 545 families residing in the town. The population density was 1,717.2 people per square mile (662.3/km2). There were 917 housing units at an average density of 772.2 per square mile (297.7/km2). The racial makeup of the town was 97.45% White, 0.99% African American, 0.20% Native American, 0.20% Asian, 0.10% Pacific Islander, 0.20% from other races, and 0.95% from two or more races. Hispanic or Latino of any race were 0.59% of the population.
There were 845 households, out of which 28.2% had children under the age of 18 living with them, 48.2% were married couples living together, 13.2% had a female householder with no husband present, and 34.7% were non-families. 30.7% of all households were made up of individuals, and 15.2% had someone living alone who was 65 years of age or older. The average household size was 2.30 and the average family size was 2.86.
In the town, the population was spread out, with 22.2% under the age of 18, 8.2% from 18 to 24, 27.2% from 25 to 44, 24.2% from 45 to 64, and 18.2% who were 65 years of age or older. The median age was 40 years. For every 100 females, there were 87.2 males. For every 100 females age 18 and over, there were 82.2 males.
The median income for a household in the town was $27,917, and the median income for a family was $35,000. Males had a median income of $27,500 versus $20,000 for females. The per capita income for the town was $15,845. About 11.2% of families and 14.2% of the population were below the poverty line, including 17.2% of those under age 18 and 16.2% of those age 65 or over.
Common Questions
What is Per Capita Income in Gate City?
Per Capita income in Gate City is $31,324.
What is the Median Family Income in Gate City?
Median Family Income in Gate City is $90,233.
What is the Median Household income in Gate City?
Median Household Income in Gate City is $37,543.
What is Income or Wage Gap in Gate City?
Income or Wage Gap in Gate City is 45.2%.
Women in Gate City earn 54.8 cents for every dollar earned by a man.
What is Inequality or Gini Index in Gate City?
Inequality or Gini Index in Gate City is 0.53.
What is the Total Population of Gate City?
Total Population of Gate City is 1,910.
What is the Total Male Population of Gate City?
Total Male Population of Gate City is 897.
What is the Total Female Population of Gate City?
Total Female Population of Gate City is 1,013.
What is the Ratio of Males per 100 Females in Gate City?
There are 88.55 Males per 100 Females in Gate City.
What is the Ratio of Females per 100 Males in Gate City?
There are 112.93 Females per 100 Males in Gate City.
What is the Median Population Age in Gate City?
Median Population Age in Gate City is 42.6 Years.
What is the Average Family Size in Gate City
Average Family Size in Gate City is 2.9 People.
What is the Average Household Size in Gate City
Average Household Size in Gate City is 2.1 People.
How Large is the Labor Force in Gate City?
There are 789 People in the Labor Forcein in Gate City.
What is the Percentage of People in the Labor Force in Gate City?
49.7% of People are in the Labor Force in Gate City.
What is the Unemployment Rate in Gate City?
Unemployment Rate in Gate City is 2.2%.