Galax, VA Map & Demographics
Galax Map
Galax Overview
$29,802
PER CAPITA INCOME
$63,052
AVG FAMILY INCOME
$44,612
AVG HOUSEHOLD INCOME
46.1%
WAGE / INCOME GAP [ % ]
53.9¢/ $1
WAGE / INCOME GAP [ $ ]
$6,494
FAMILY INCOME DEFICIT
0.52
INEQUALITY / GINI INDEX
6,687
TOTAL POPULATION
2,976
MALE POPULATION
3,711
FEMALE POPULATION
80.19
MALES / 100 FEMALES
124.70
FEMALES / 100 MALES
42.6
MEDIAN AGE
3.2
AVG FAMILY SIZE
2.4
AVG HOUSEHOLD SIZE
2,924
LABOR FORCE [ PEOPLE ]
55.9%
PERCENT IN LABOR FORCE
4.4%
UNEMPLOYMENT RATE
Galax Zip Codes
Galax Area Codes
Income in Galax
Income Overview in Galax
Per Capita Income in Galax is $29,802, while median incomes of families and households are $63,052 and $44,612 respectively.
| Characteristic | Number | Measure |
| Per Capita Income | 6,687 | $29,802 |
| Median Family Income | 1,604 | $63,052 |
| Mean Family Income | 1,604 | $94,583 |
| Median Household Income | 2,618 | $44,612 |
| Mean Household Income | 2,618 | $73,068 |
| Income Deficit | 1,604 | $6,494 |
| Wage / Income Gap (%) | 6,687 | 46.10% |
| Wage / Income Gap ($) | 6,687 | 53.90¢ per $1 |
| Gini / Inequality Index | 6,687 | 0.52 |
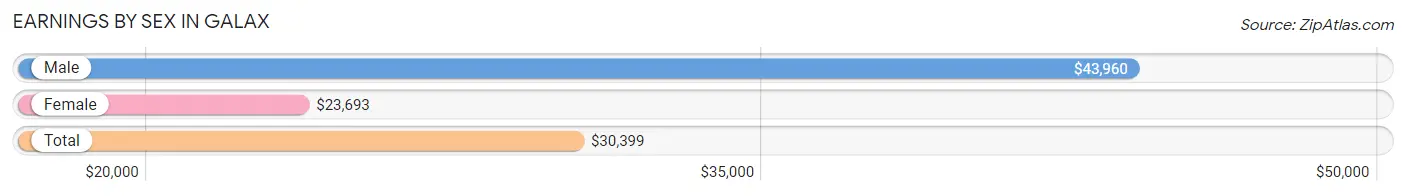
Earnings by Sex in Galax
Average Earnings in Galax are $30,399, $43,960 for men and $23,693 for women, a difference of 46.1%.
| Sex | Number | Average Earnings |
| Male | 1,458 (47.3%) | $43,960 |
| Female | 1,622 (52.7%) | $23,693 |
| Total | 3,080 (100.0%) | $30,399 |
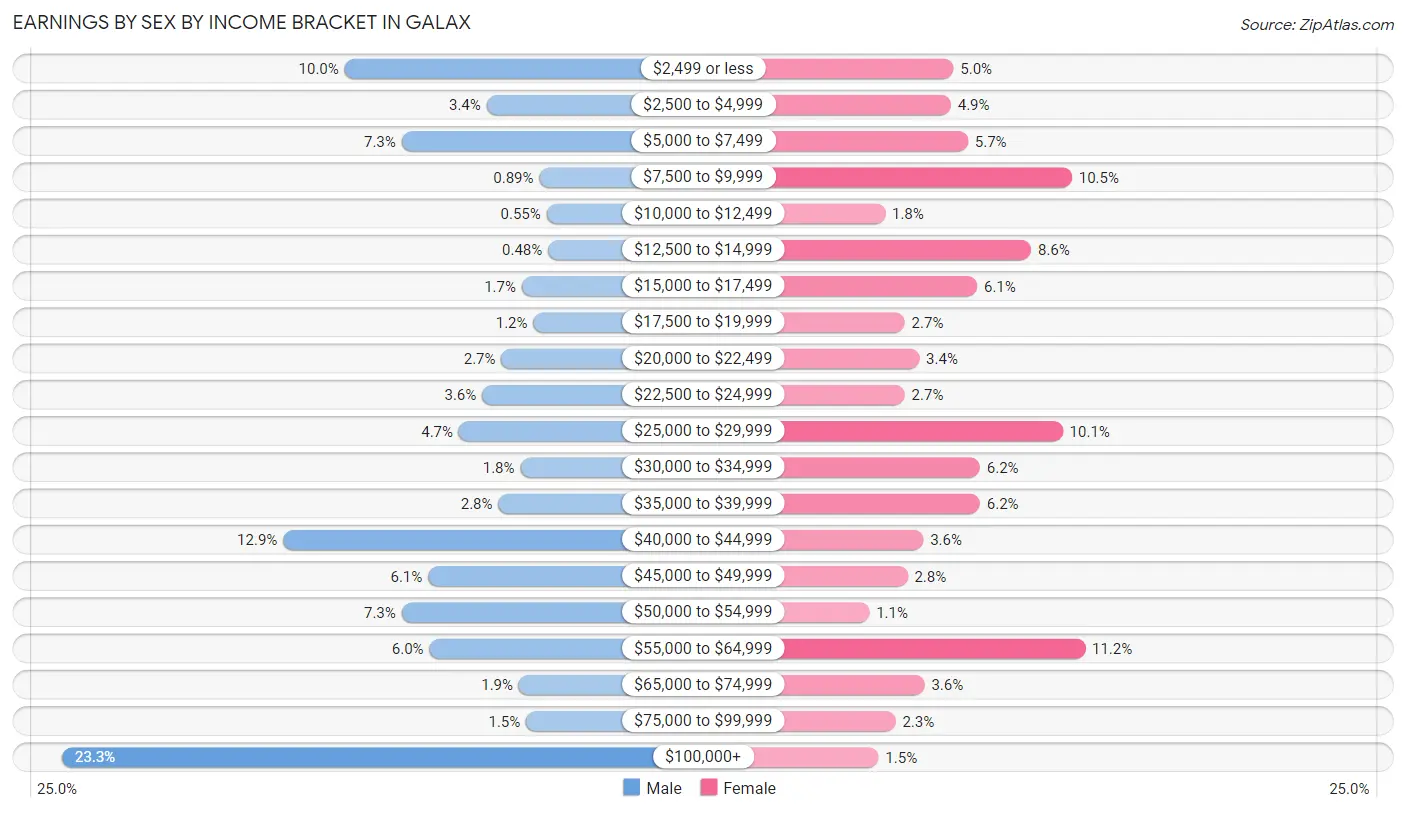
Earnings by Sex by Income Bracket in Galax
The most common earnings brackets in Galax are $100,000+ for men (339 | 23.3%) and $55,000 to $64,999 for women (181 | 11.2%).
| Income | Male | Female |
| $2,499 or less | 146 (10.0%) | 81 (5.0%) |
| $2,500 to $4,999 | 49 (3.4%) | 79 (4.9%) |
| $5,000 to $7,499 | 107 (7.3%) | 92 (5.7%) |
| $7,500 to $9,999 | 13 (0.9%) | 171 (10.5%) |
| $10,000 to $12,499 | 8 (0.5%) | 29 (1.8%) |
| $12,500 to $14,999 | 7 (0.5%) | 140 (8.6%) |
| $15,000 to $17,499 | 25 (1.7%) | 99 (6.1%) |
| $17,500 to $19,999 | 17 (1.2%) | 44 (2.7%) |
| $20,000 to $22,499 | 39 (2.7%) | 55 (3.4%) |
| $22,500 to $24,999 | 52 (3.6%) | 44 (2.7%) |
| $25,000 to $29,999 | 68 (4.7%) | 164 (10.1%) |
| $30,000 to $34,999 | 26 (1.8%) | 101 (6.2%) |
| $35,000 to $39,999 | 41 (2.8%) | 101 (6.2%) |
| $40,000 to $44,999 | 188 (12.9%) | 58 (3.6%) |
| $45,000 to $49,999 | 89 (6.1%) | 46 (2.8%) |
| $50,000 to $54,999 | 107 (7.3%) | 17 (1.1%) |
| $55,000 to $64,999 | 88 (6.0%) | 181 (11.2%) |
| $65,000 to $74,999 | 27 (1.8%) | 59 (3.6%) |
| $75,000 to $99,999 | 22 (1.5%) | 37 (2.3%) |
| $100,000+ | 339 (23.3%) | 24 (1.5%) |
| Total | 1,458 (100.0%) | 1,622 (100.0%) |
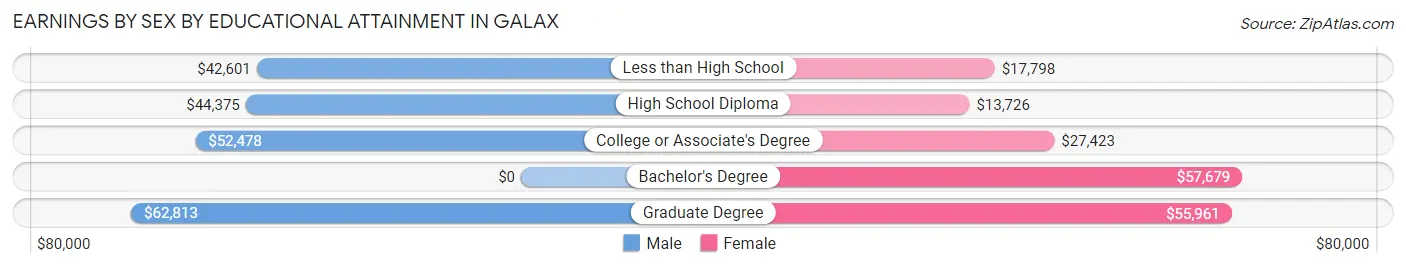
Earnings by Sex by Educational Attainment in Galax
Average earnings in Galax are $47,917 for men and $28,241 for women, a difference of 41.1%. Men with an educational attainment of graduate degree enjoy the highest average annual earnings of $62,813, while those with less than high school education earn the least with $42,601. Women with an educational attainment of bachelor's degree earn the most with the average annual earnings of $57,679, while those with high school diploma education have the smallest earnings of $13,726.
| Educational Attainment | Male Income | Female Income |
| Less than High School | $42,601 | $17,798 |
| High School Diploma | $44,375 | $13,726 |
| College or Associate's Degree | $52,478 | $27,423 |
| Bachelor's Degree | - | - |
| Graduate Degree | $62,813 | $55,961 |
| Total | $47,917 | $28,241 |
Family Income in Galax
Family Income Brackets in Galax
According to the Galax family income data, there are 330 families falling into the $50,000 to $74,999 income range, which is the most common income bracket and makes up 20.6% of all families. Conversely, the less than $10,000 income bracket is the least frequent group with only 10 families (0.6%) belonging to this category.
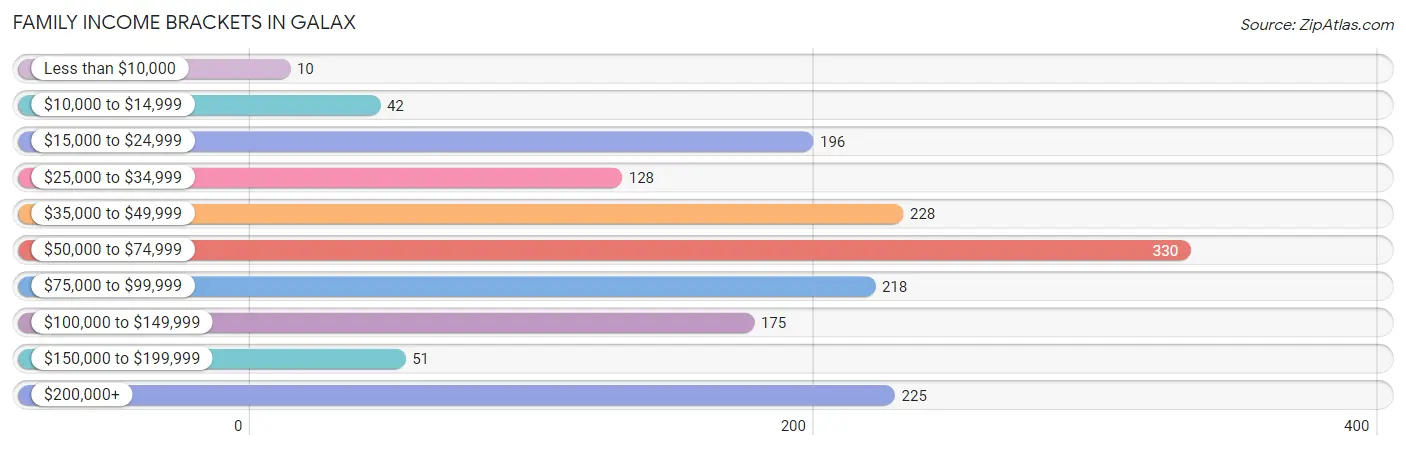
| Income Bracket | # Families | % Families |
| Less than $10,000 | 10 | 0.6% |
| $10,000 to $14,999 | 42 | 2.6% |
| $15,000 to $24,999 | 196 | 12.2% |
| $25,000 to $34,999 | 128 | 8.0% |
| $35,000 to $49,999 | 228 | 14.2% |
| $50,000 to $74,999 | 330 | 20.6% |
| $75,000 to $99,999 | 218 | 13.6% |
| $100,000 to $149,999 | 175 | 10.9% |
| $150,000 to $199,999 | 51 | 3.2% |
| $200,000+ | 225 | 14.0% |
Family Income by Famaliy Size in Galax
2-person families (843 | 52.6%) account for the highest median family income in Galax with $75,052 per family, while 2-person families (843 | 52.6%) have the highest median income of $37,526 per family member.
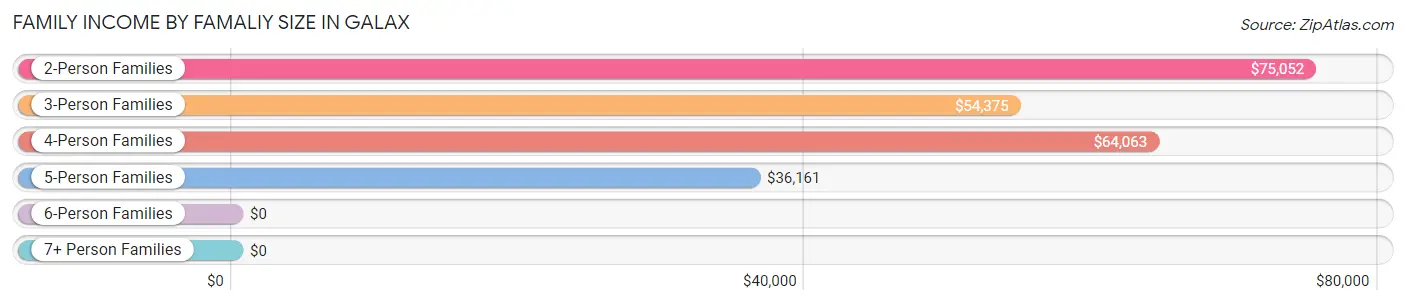
| Income Bracket | # Families | Median Income |
| 2-Person Families | 843 (52.6%) | $75,052 |
| 3-Person Families | 263 (16.4%) | $54,375 |
| 4-Person Families | 303 (18.9%) | $64,063 |
| 5-Person Families | 153 (9.5%) | $36,161 |
| 6-Person Families | 29 (1.8%) | $0 |
| 7+ Person Families | 13 (0.8%) | $0 |
| Total | 1,604 (100.0%) | $63,052 |
Family Income by Number of Earners in Galax
The median family income in Galax is $63,052, with families comprising 2 earners (685) having the highest median family income of $86,932, while families with no earners (147) have the lowest median family income of $26,898, accounting for 42.7% and 9.2% of families, respectively.
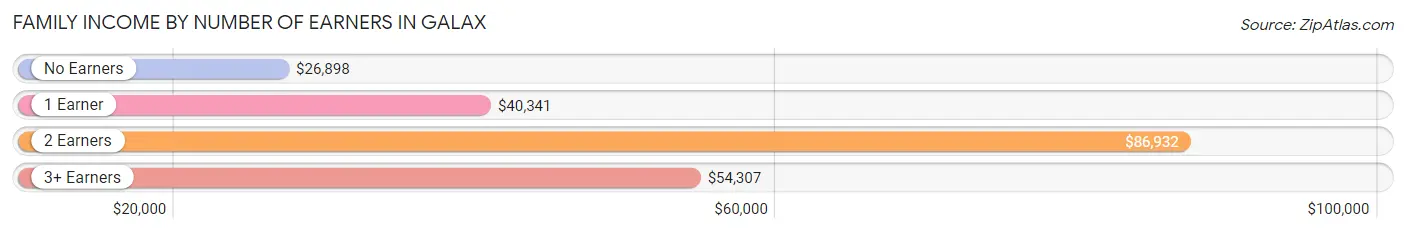
| Number of Earners | # Families | Median Income |
| No Earners | 147 (9.2%) | $26,898 |
| 1 Earner | 617 (38.5%) | $40,341 |
| 2 Earners | 685 (42.7%) | $86,932 |
| 3+ Earners | 155 (9.7%) | $54,307 |
| Total | 1,604 (100.0%) | $63,052 |
Household Income in Galax
Household Income Brackets in Galax
With 437 households falling in the category, the $15,000 to $24,999 income range is the most frequent in Galax, accounting for 16.7% of all households. In contrast, only 99 households (3.8%) fall into the $150,000 to $199,999 income bracket, making it the least populous group.
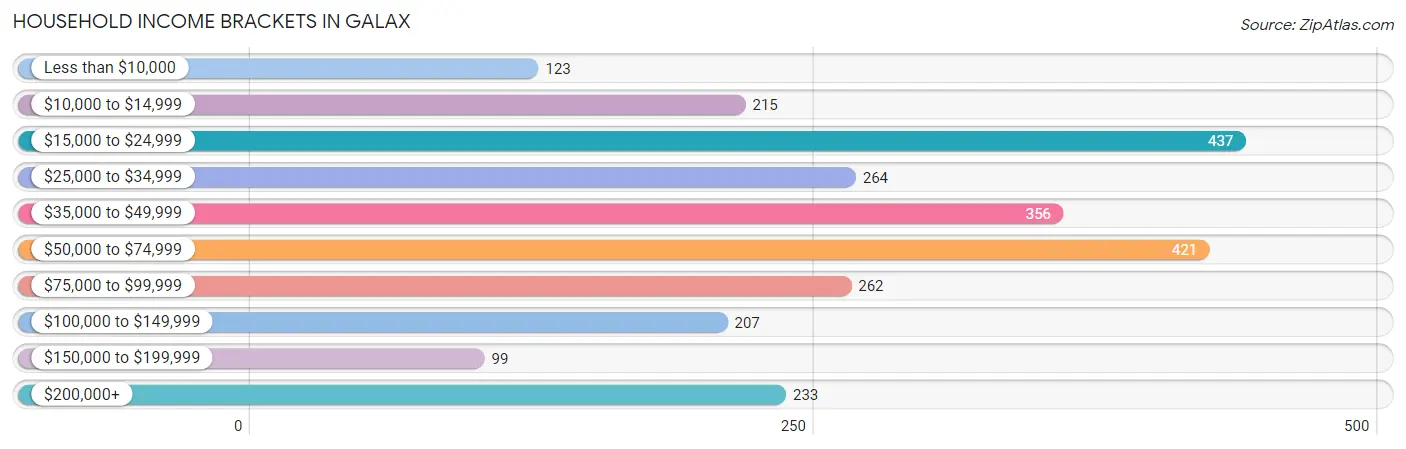
| Income Bracket | # Households | % Households |
| Less than $10,000 | 123 | 4.7% |
| $10,000 to $14,999 | 215 | 8.2% |
| $15,000 to $24,999 | 437 | 16.7% |
| $25,000 to $34,999 | 264 | 10.1% |
| $35,000 to $49,999 | 356 | 13.6% |
| $50,000 to $74,999 | 421 | 16.1% |
| $75,000 to $99,999 | 262 | 10.0% |
| $100,000 to $149,999 | 207 | 7.9% |
| $150,000 to $199,999 | 99 | 3.8% |
| $200,000+ | 233 | 8.9% |
Household Income by Householder Age in Galax
The median household income in Galax is $44,612, with the highest median household income of $69,784 found in the 45 to 64 years age bracket for the primary householder. A total of 1,079 households (41.2%) fall into this category. Meanwhile, the 65+ years age bracket for the primary householder has the lowest median household income of $30,335, with 771 households (29.4%) in this group.
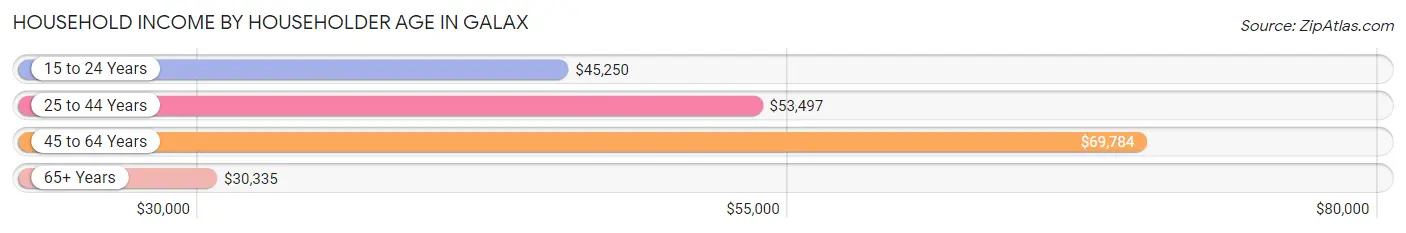
| Income Bracket | # Households | Median Income |
| 15 to 24 Years | 111 (4.2%) | $45,250 |
| 25 to 44 Years | 657 (25.1%) | $53,497 |
| 45 to 64 Years | 1,079 (41.2%) | $69,784 |
| 65+ Years | 771 (29.4%) | $30,335 |
| Total | 2,618 (100.0%) | $44,612 |
Poverty in Galax
Income Below Poverty by Sex and Age in Galax
With 16.6% poverty level for males and 27.2% for females among the residents of Galax, under 5 year old males and 5 year old females are the most vulnerable to poverty, with 102 males (47.4%) and 13 females (54.2%) in their respective age groups living below the poverty level.
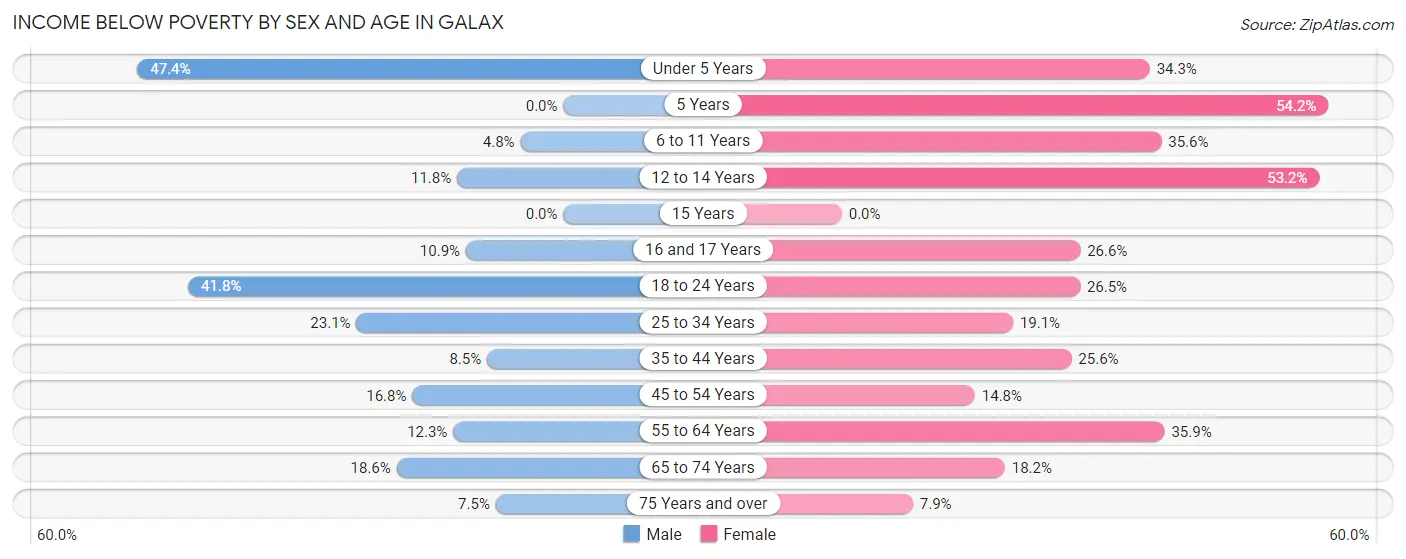
| Age Bracket | Male | Female |
| Under 5 Years | 102 (47.4%) | 84 (34.3%) |
| 5 Years | 0 (0.0%) | 13 (54.2%) |
| 6 to 11 Years | 13 (4.8%) | 58 (35.6%) |
| 12 to 14 Years | 9 (11.8%) | 151 (53.2%) |
| 15 Years | 0 (0.0%) | 0 (0.0%) |
| 16 and 17 Years | 14 (10.8%) | 30 (26.6%) |
| 18 to 24 Years | 61 (41.8%) | 109 (26.5%) |
| 25 to 34 Years | 56 (23.1%) | 53 (19.1%) |
| 35 to 44 Years | 30 (8.5%) | 112 (25.6%) |
| 45 to 54 Years | 71 (16.8%) | 59 (14.8%) |
| 55 to 64 Years | 53 (12.3%) | 207 (35.9%) |
| 65 to 74 Years | 57 (18.6%) | 61 (18.1%) |
| 75 Years and over | 14 (7.5%) | 17 (7.9%) |
| Total | 480 (16.6%) | 954 (27.2%) |
Income Above Poverty by Sex and Age in Galax
According to the poverty statistics in Galax, males aged 5 years and females aged 15 years are the age groups that are most secure financially, with 100.0% of males and 100.0% of females in these age groups living above the poverty line.
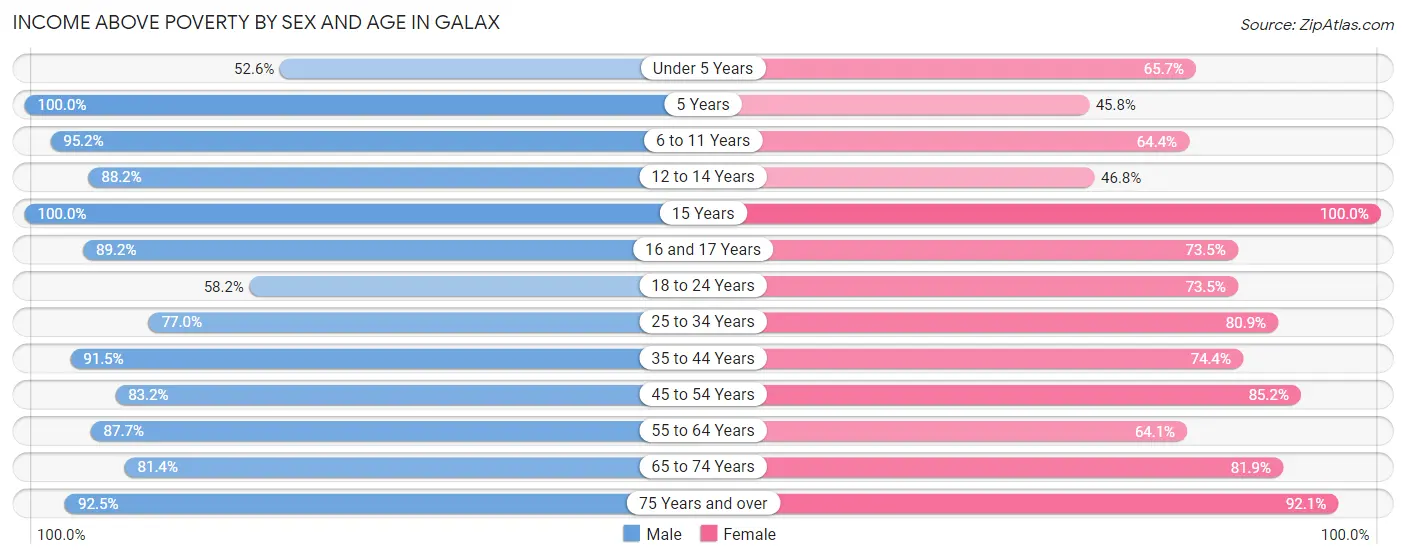
| Age Bracket | Male | Female |
| Under 5 Years | 113 (52.6%) | 161 (65.7%) |
| 5 Years | 51 (100.0%) | 11 (45.8%) |
| 6 to 11 Years | 259 (95.2%) | 105 (64.4%) |
| 12 to 14 Years | 67 (88.2%) | 133 (46.8%) |
| 15 Years | 57 (100.0%) | 27 (100.0%) |
| 16 and 17 Years | 115 (89.1%) | 83 (73.5%) |
| 18 to 24 Years | 85 (58.2%) | 302 (73.5%) |
| 25 to 34 Years | 187 (76.9%) | 225 (80.9%) |
| 35 to 44 Years | 323 (91.5%) | 326 (74.4%) |
| 45 to 54 Years | 351 (83.2%) | 339 (85.2%) |
| 55 to 64 Years | 379 (87.7%) | 369 (64.1%) |
| 65 to 74 Years | 250 (81.4%) | 275 (81.9%) |
| 75 Years and over | 172 (92.5%) | 198 (92.1%) |
| Total | 2,409 (83.4%) | 2,554 (72.8%) |
Income Below Poverty Among Married-Couple Families in Galax
The poverty statistics for married-couple families in Galax show that 10.5% or 127 of the total 1,209 families live below the poverty line. Families with 3 or 4 children have the highest poverty rate of 43.9%, comprising of 50 families. On the other hand, families with 5 or more children have the lowest poverty rate of 0.0%, which includes 0 families.
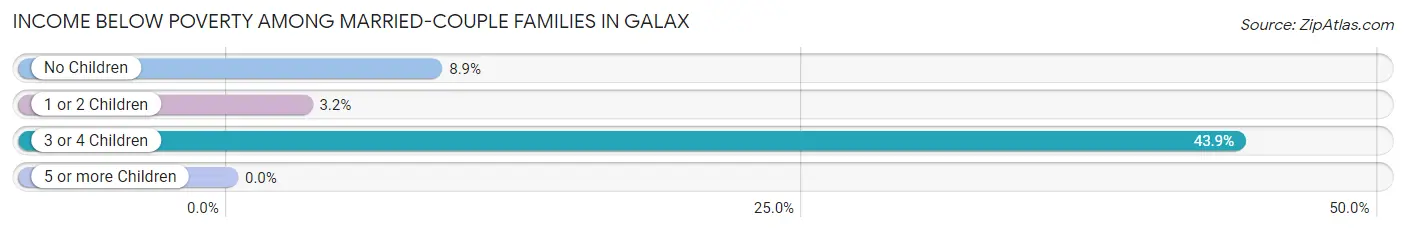
| Children | Above Poverty | Below Poverty |
| No Children | 676 (91.1%) | 66 (8.9%) |
| 1 or 2 Children | 329 (96.8%) | 11 (3.2%) |
| 3 or 4 Children | 64 (56.1%) | 50 (43.9%) |
| 5 or more Children | 13 (100.0%) | 0 (0.0%) |
| Total | 1,082 (89.5%) | 127 (10.5%) |
Income Below Poverty Among Single-Parent Households in Galax
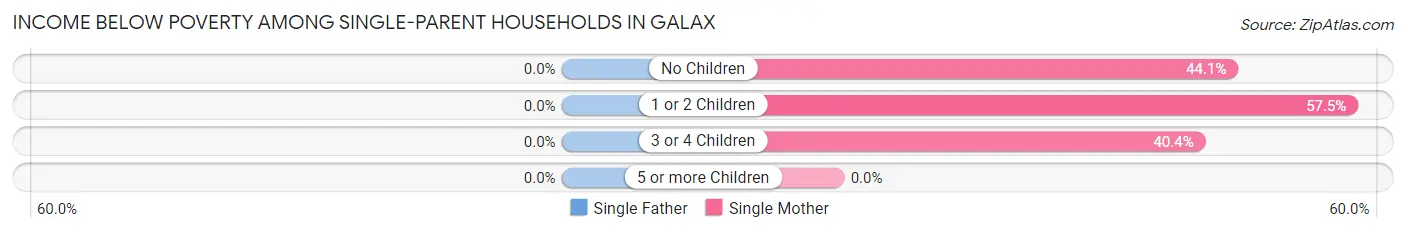
| Children | Single Father | Single Mother |
| No Children | 0 (0.0%) | 41 (44.1%) |
| 1 or 2 Children | 0 (0.0%) | 69 (57.5%) |
| 3 or 4 Children | 0 (0.0%) | 19 (40.4%) |
| 5 or more Children | 0 (0.0%) | 0 (0.0%) |
| Total | 0 (0.0%) | 129 (49.6%) |
Income Below Poverty Among Married-Couple vs Single-Parent Households in Galax
The poverty data for Galax shows that 127 of the married-couple family households (10.5%) and 129 of the single-parent households (32.7%) are living below the poverty level. Within the married-couple family households, those with 3 or 4 children have the highest poverty rate, with 50 households (43.9%) falling below the poverty line. Among the single-parent households, those with 3 or 4 children have the highest poverty rate, with 19 household (40.4%) living below poverty.
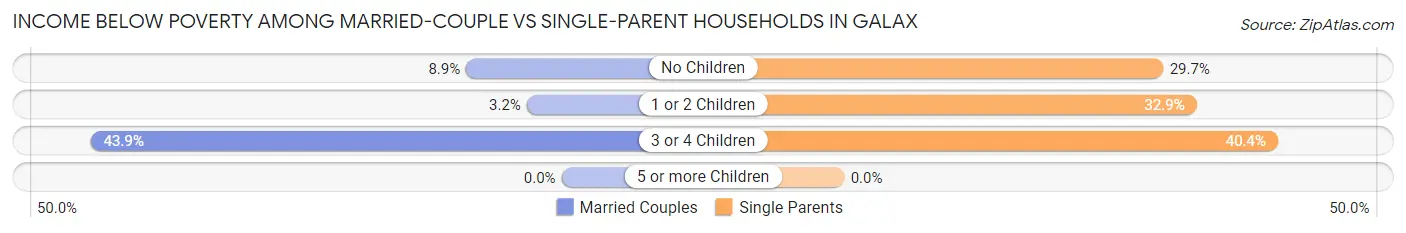
| Children | Married-Couple Families | Single-Parent Households |
| No Children | 66 (8.9%) | 41 (29.7%) |
| 1 or 2 Children | 11 (3.2%) | 69 (32.9%) |
| 3 or 4 Children | 50 (43.9%) | 19 (40.4%) |
| 5 or more Children | 0 (0.0%) | 0 (0.0%) |
| Total | 127 (10.5%) | 129 (32.7%) |
Race in Galax
The most populous races in Galax are White / Caucasian (5,153 | 77.1%), Hispanic or Latino (1,379 | 20.6%), and Two or more Races (667 | 10.0%).
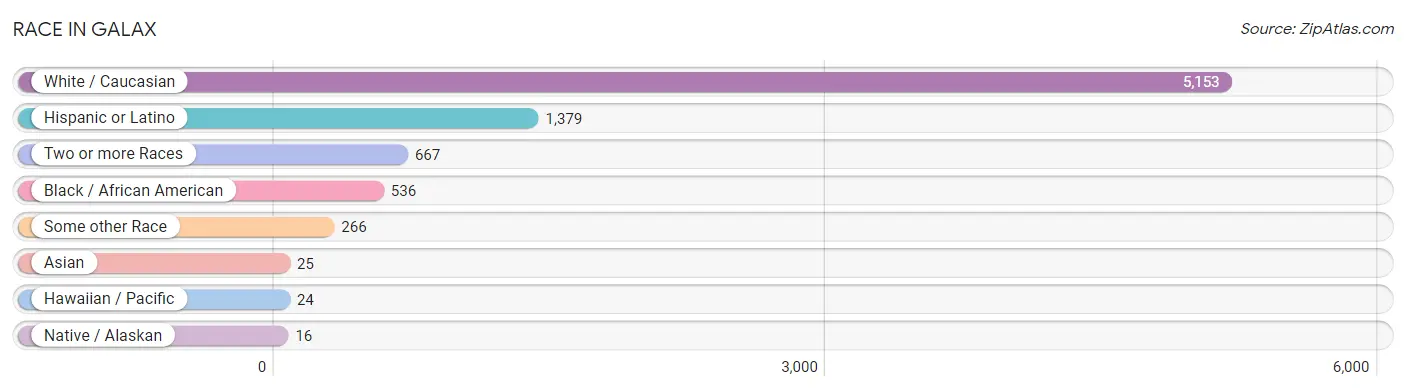
| Race | # Population | % Population |
| Asian | 25 | 0.4% |
| Black / African American | 536 | 8.0% |
| Hawaiian / Pacific | 24 | 0.4% |
| Hispanic or Latino | 1,379 | 20.6% |
| Native / Alaskan | 16 | 0.2% |
| White / Caucasian | 5,153 | 77.1% |
| Two or more Races | 667 | 10.0% |
| Some other Race | 266 | 4.0% |
| Total | 6,687 | 100.0% |
Ancestry in Galax
The most populous ancestries reported in Galax are American (1,563 | 23.4%), English (976 | 14.6%), Mexican (961 | 14.4%), German (617 | 9.2%), and Irish (440 | 6.6%), together accounting for 68.1% of all Galax residents.
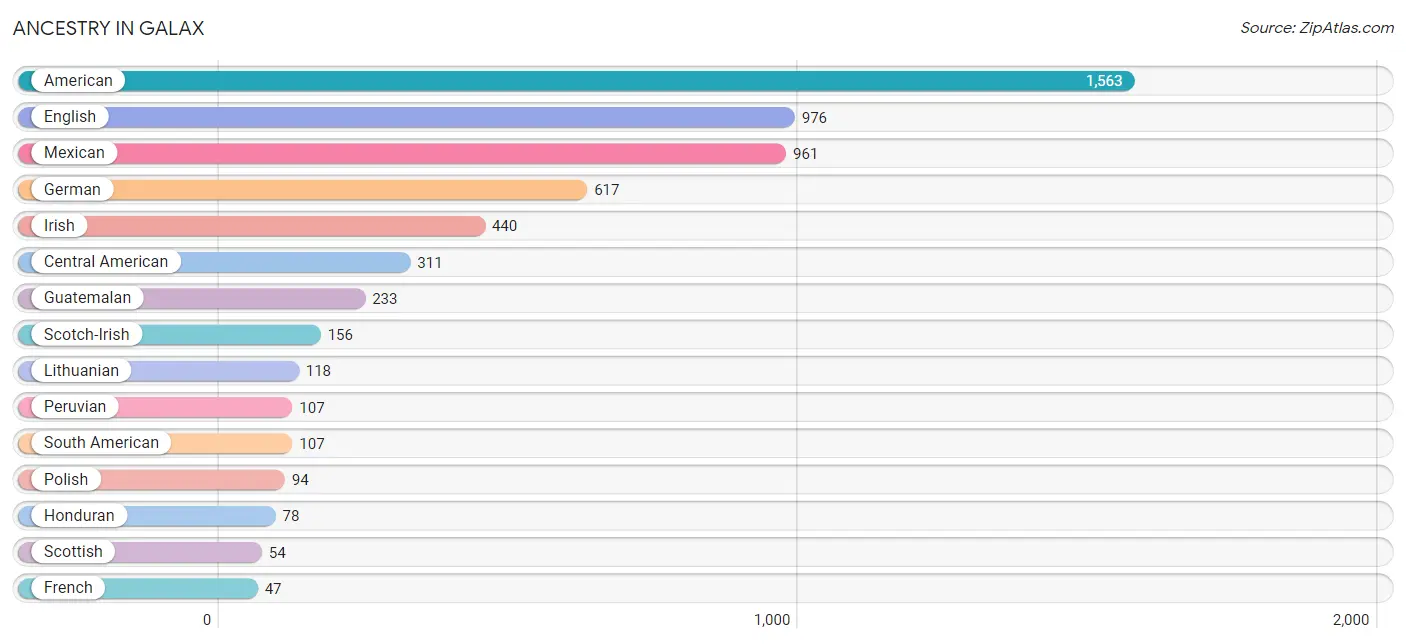
| Ancestry | # Population | % Population |
| American | 1,563 | 23.4% |
| Apache | 16 | 0.2% |
| Bhutanese | 7 | 0.1% |
| British | 31 | 0.5% |
| Central American | 311 | 4.6% |
| Cherokee | 6 | 0.1% |
| Danish | 9 | 0.1% |
| Dutch | 6 | 0.1% |
| English | 976 | 14.6% |
| European | 31 | 0.5% |
| French | 47 | 0.7% |
| French American Indian | 7 | 0.1% |
| German | 617 | 9.2% |
| Guatemalan | 233 | 3.5% |
| Honduran | 78 | 1.2% |
| Hungarian | 8 | 0.1% |
| Irish | 440 | 6.6% |
| Italian | 47 | 0.7% |
| Korean | 46 | 0.7% |
| Lithuanian | 118 | 1.8% |
| Mexican | 961 | 14.4% |
| Native Hawaiian | 24 | 0.4% |
| Norwegian | 7 | 0.1% |
| Peruvian | 107 | 1.6% |
| Polish | 94 | 1.4% |
| Portuguese | 10 | 0.2% |
| Scandinavian | 11 | 0.2% |
| Scotch-Irish | 156 | 2.3% |
| Scottish | 54 | 0.8% |
| South American | 107 | 1.6% |
| Swedish | 14 | 0.2% |
| Thai | 12 | 0.2% |
| Welsh | 25 | 0.4% | View All 33 Rows |
Immigrants in Galax
The most numerous immigrant groups reported in Galax came from Latin America (442 | 6.6%), Central America (389 | 5.8%), Mexico (288 | 4.3%), Guatemala (82 | 1.2%), and Peru (53 | 0.8%), together accounting for 18.8% of all Galax residents.
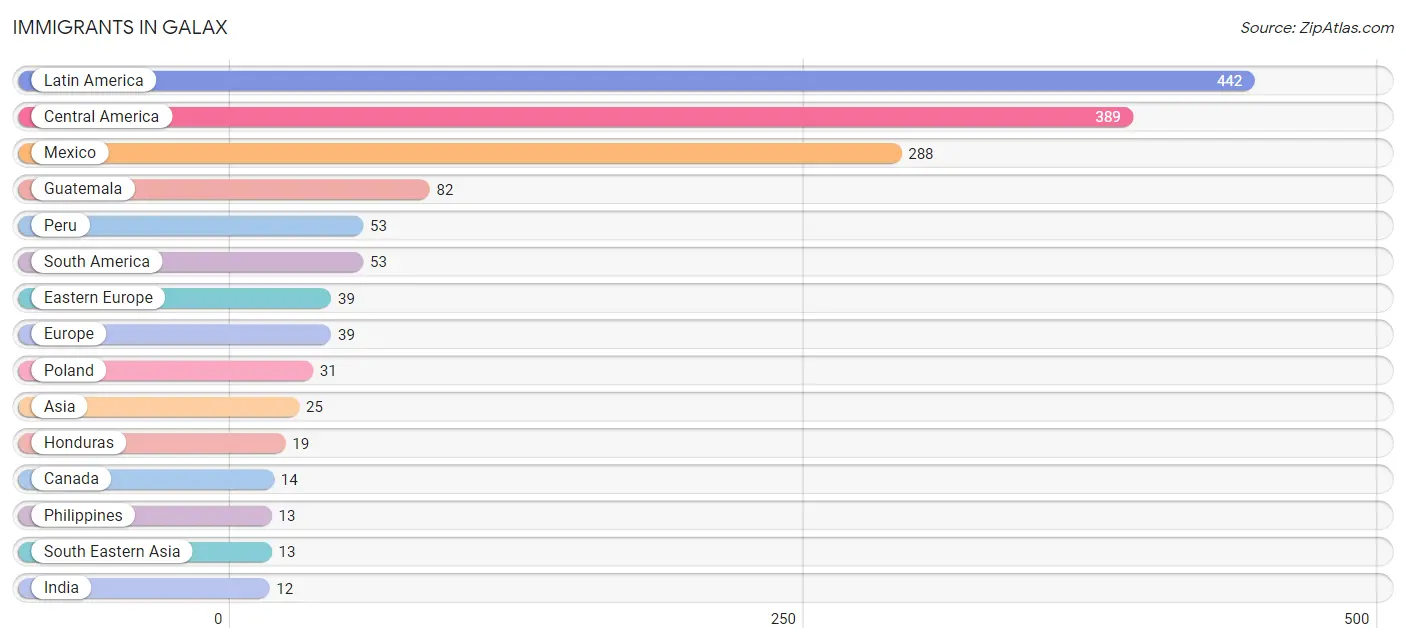
| Immigration Origin | # Population | % Population |
| Asia | 25 | 0.4% |
| Canada | 14 | 0.2% |
| Central America | 389 | 5.8% |
| Eastern Europe | 39 | 0.6% |
| Europe | 39 | 0.6% |
| Guatemala | 82 | 1.2% |
| Honduras | 19 | 0.3% |
| Hungary | 8 | 0.1% |
| India | 12 | 0.2% |
| Latin America | 442 | 6.6% |
| Mexico | 288 | 4.3% |
| Peru | 53 | 0.8% |
| Philippines | 13 | 0.2% |
| Poland | 31 | 0.5% |
| South America | 53 | 0.8% |
| South Central Asia | 12 | 0.2% |
| South Eastern Asia | 13 | 0.2% | View All 17 Rows |
Sex and Age in Galax
Sex and Age in Galax
The most populous age groups in Galax are 5 to 9 Years (333 | 11.2%) for men and 10 to 14 Years (319 | 8.6%) for women.
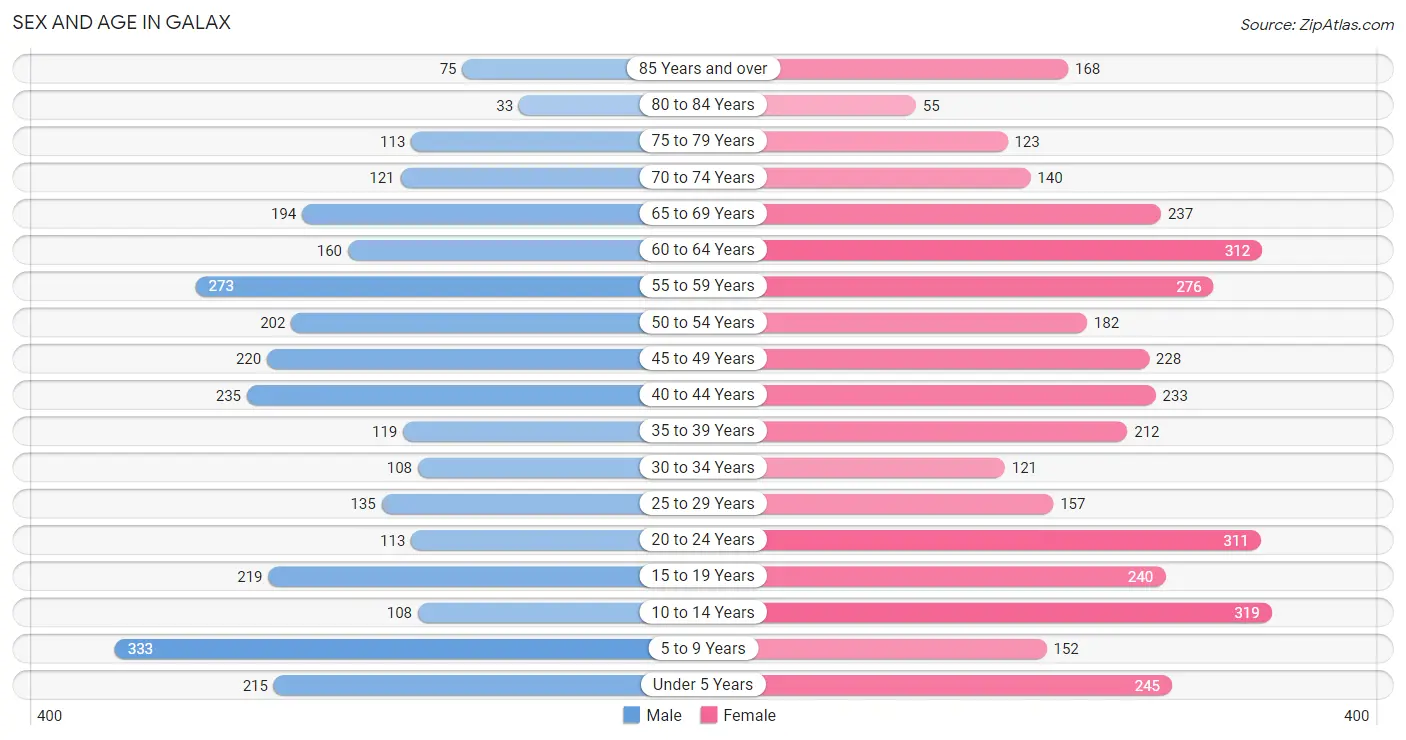
| Age Bracket | Male | Female |
| Under 5 Years | 215 (7.2%) | 245 (6.6%) |
| 5 to 9 Years | 333 (11.2%) | 152 (4.1%) |
| 10 to 14 Years | 108 (3.6%) | 319 (8.6%) |
| 15 to 19 Years | 219 (7.4%) | 240 (6.5%) |
| 20 to 24 Years | 113 (3.8%) | 311 (8.4%) |
| 25 to 29 Years | 135 (4.5%) | 157 (4.2%) |
| 30 to 34 Years | 108 (3.6%) | 121 (3.3%) |
| 35 to 39 Years | 119 (4.0%) | 212 (5.7%) |
| 40 to 44 Years | 235 (7.9%) | 233 (6.3%) |
| 45 to 49 Years | 220 (7.4%) | 228 (6.1%) |
| 50 to 54 Years | 202 (6.8%) | 182 (4.9%) |
| 55 to 59 Years | 273 (9.2%) | 276 (7.4%) |
| 60 to 64 Years | 160 (5.4%) | 312 (8.4%) |
| 65 to 69 Years | 194 (6.5%) | 237 (6.4%) |
| 70 to 74 Years | 121 (4.1%) | 140 (3.8%) |
| 75 to 79 Years | 113 (3.8%) | 123 (3.3%) |
| 80 to 84 Years | 33 (1.1%) | 55 (1.5%) |
| 85 Years and over | 75 (2.5%) | 168 (4.5%) |
| Total | 2,976 (100.0%) | 3,711 (100.0%) |
Families and Households in Galax
Median Family Size in Galax
The median family size in Galax is 3.23 persons per family, with single female/mother families (260 | 16.2%) accounting for the largest median family size of 3.28 persons per family. On the other hand, married-couple families (1,209 | 75.4%) represent the smallest median family size with 3.22 persons per family.
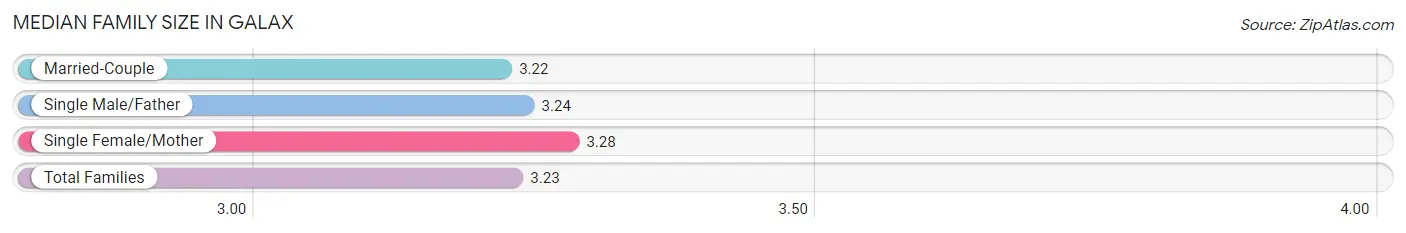
| Family Type | # Families | Family Size |
| Married-Couple | 1,209 (75.4%) | 3.22 |
| Single Male/Father | 135 (8.4%) | 3.24 |
| Single Female/Mother | 260 (16.2%) | 3.28 |
| Total Families | 1,604 (100.0%) | 3.23 |
Median Household Size in Galax
The median household size in Galax is 2.42 persons per household, with single male/father households (135 | 5.2%) accounting for the largest median household size of 3.41 persons per household. non-family households (1,014 | 38.7%) represent the smallest median household size with 1.08 persons per household.
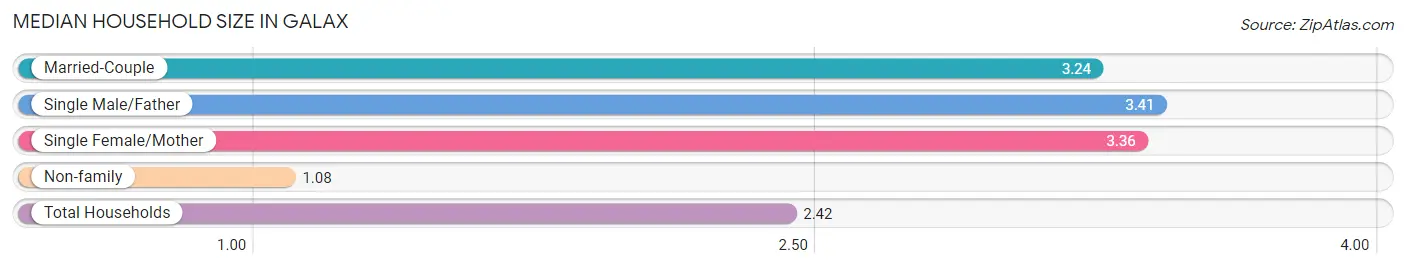
| Household Type | # Households | Household Size |
| Married-Couple | 1,209 (46.2%) | 3.24 |
| Single Male/Father | 135 (5.2%) | 3.41 |
| Single Female/Mother | 260 (9.9%) | 3.36 |
| Non-family | 1,014 (38.7%) | 1.08 |
| Total Households | 2,618 (100.0%) | 2.42 |
Household Size by Marriage Status in Galax
Out of a total of 2,618 households in Galax, 1,604 (61.3%) are family households, while 1,014 (38.7%) are nonfamily households. The most numerous type of family households are 2-person households, comprising 806, and the most common type of nonfamily households are 1-person households, comprising 930.
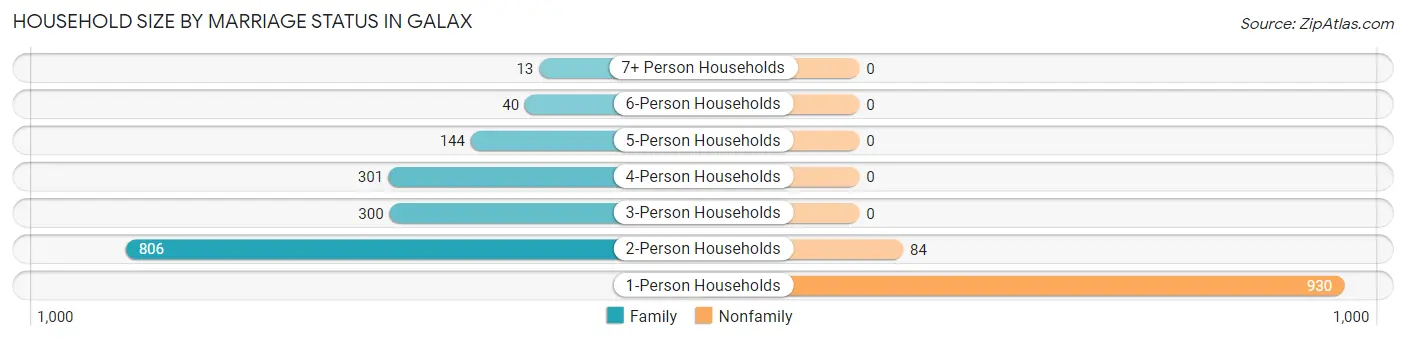
| Household Size | Family Households | Nonfamily Households |
| 1-Person Households | - | 930 (35.5%) |
| 2-Person Households | 806 (30.8%) | 84 (3.2%) |
| 3-Person Households | 300 (11.5%) | 0 (0.0%) |
| 4-Person Households | 301 (11.5%) | 0 (0.0%) |
| 5-Person Households | 144 (5.5%) | 0 (0.0%) |
| 6-Person Households | 40 (1.5%) | 0 (0.0%) |
| 7+ Person Households | 13 (0.5%) | 0 (0.0%) |
| Total | 1,604 (61.3%) | 1,014 (38.7%) |
Female Fertility in Galax
Fertility by Age in Galax
Average fertility rate in Galax is 84.0 births per 1,000 women. Women in the age bracket of 20 to 34 years have the highest fertility rate with 131.0 births per 1,000 women. Women in the age bracket of 20 to 34 years acount for 58.8% of all women with births.
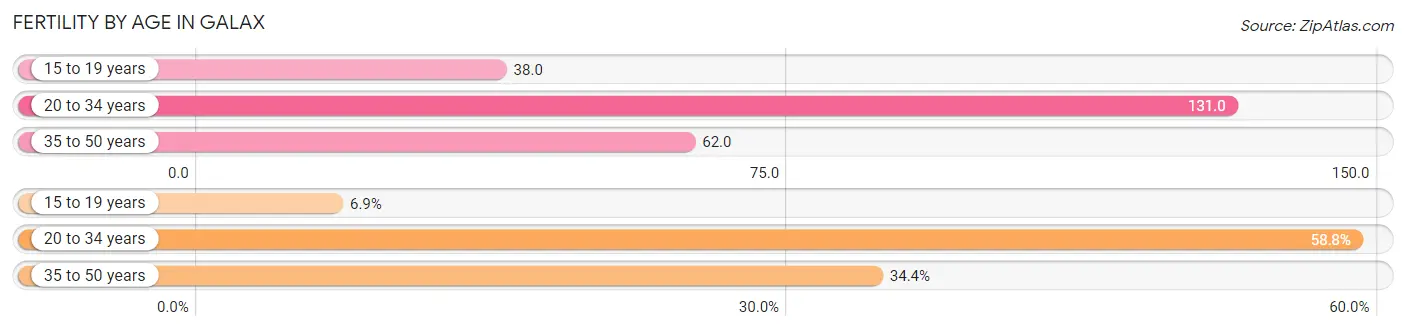
| Age Bracket | Women with Births | Births / 1,000 Women |
| 15 to 19 years | 9 (6.9%) | 38.0 |
| 20 to 34 years | 77 (58.8%) | 131.0 |
| 35 to 50 years | 45 (34.4%) | 62.0 |
| Total | 131 (100.0%) | 84.0 |
Fertility by Age by Marriage Status in Galax
55.7% of women with births (131) in Galax are married. The highest percentage of unmarried women with births falls into 15 to 19 years age bracket with 100.0% of them unmarried at the time of birth, while the lowest percentage of unmarried women with births belong to 35 to 50 years age bracket with 28.9% of them unmarried.
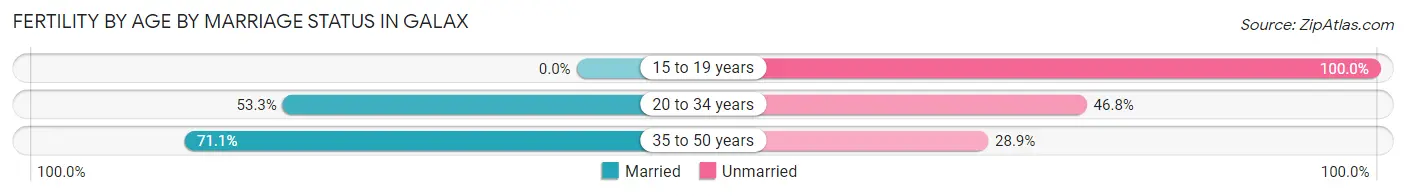
| Age Bracket | Married | Unmarried |
| 15 to 19 years | 0 (0.0%) | 9 (100.0%) |
| 20 to 34 years | 41 (53.2%) | 36 (46.8%) |
| 35 to 50 years | 32 (71.1%) | 13 (28.9%) |
| Total | 73 (55.7%) | 58 (44.3%) |
Fertility by Education in Galax
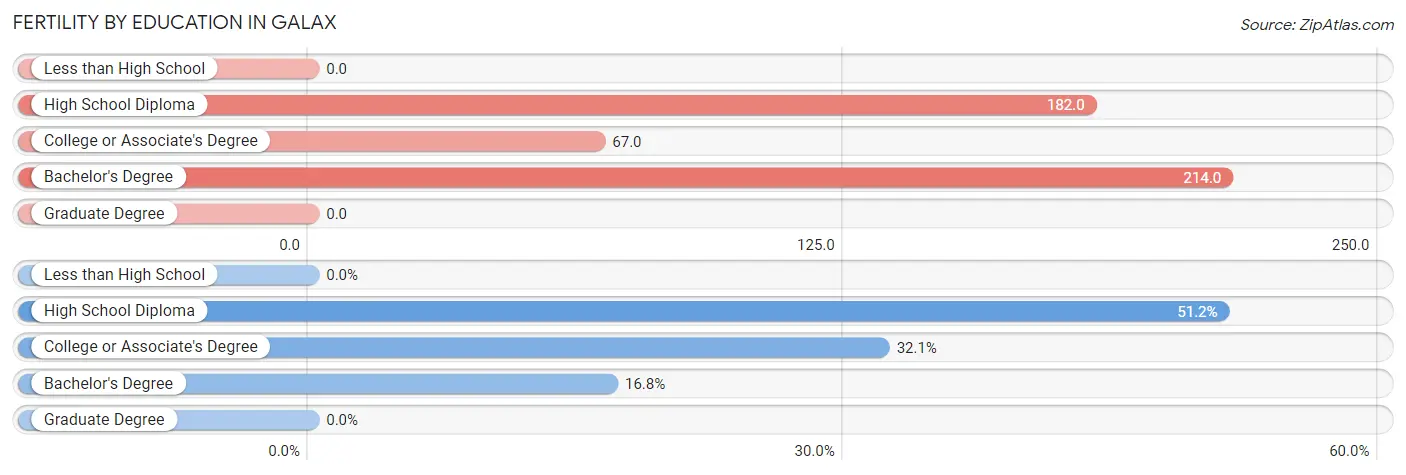
| Educational Attainment | Women with Births | Births / 1,000 Women |
| Less than High School | 0 (0.0%) | 0.0 |
| High School Diploma | 67 (51.1%) | 182.0 |
| College or Associate's Degree | 42 (32.1%) | 67.0 |
| Bachelor's Degree | 22 (16.8%) | 214.0 |
| Graduate Degree | 0 (0.0%) | 0.0 |
| Total | 131 (100.0%) | 84.0 |
Fertility by Education by Marriage Status in Galax
44.3% of women with births in Galax are unmarried. Women with the educational attainment of bachelor's degree are most likely to be married with 100.0% of them married at childbirth, while women with the educational attainment of high school diploma are least likely to be married with 67.2% of them unmarried at childbirth.
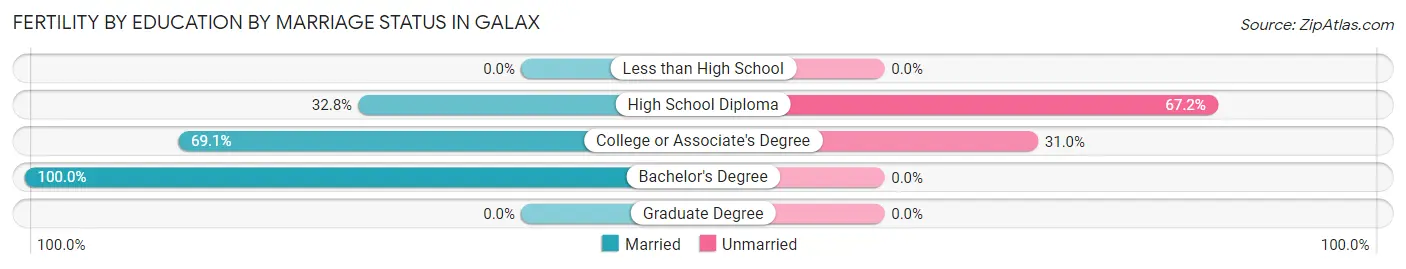
| Educational Attainment | Married | Unmarried |
| Less than High School | 0 (0.0%) | 0 (0.0%) |
| High School Diploma | 22 (32.8%) | 45 (67.2%) |
| College or Associate's Degree | 29 (69.1%) | 13 (30.9%) |
| Bachelor's Degree | 22 (100.0%) | 0 (0.0%) |
| Graduate Degree | 0 (0.0%) | 0 (0.0%) |
| Total | 73 (55.7%) | 58 (44.3%) |
Employment Characteristics in Galax
Employment by Class of Employer in Galax
Among the 2,796 employed individuals in Galax, private company employees (1,841 | 65.8%), not-for-profit organizations (204 | 7.3%), and state government employees (201 | 7.2%) make up the most common classes of employment.
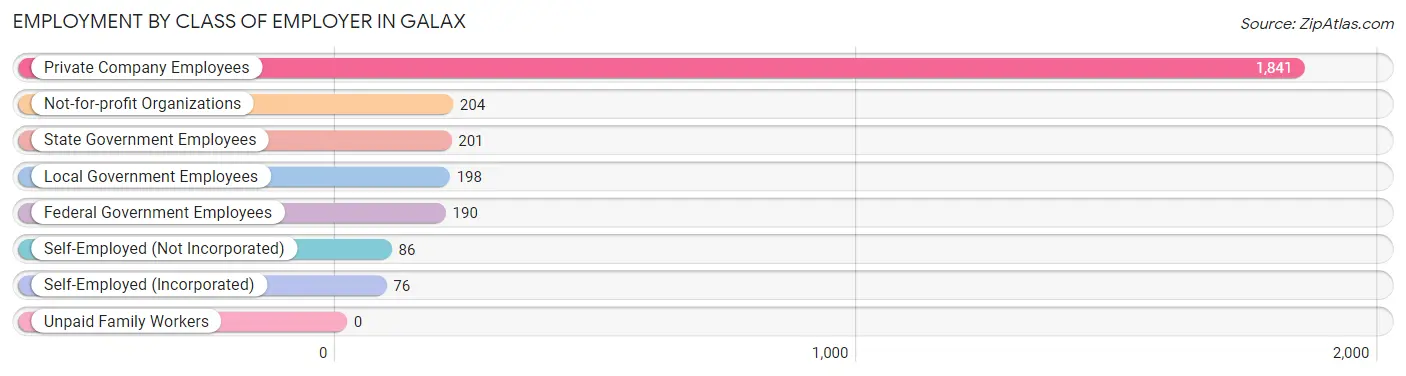
| Employer Class | # Employees | % Employees |
| Private Company Employees | 1,841 | 65.8% |
| Self-Employed (Incorporated) | 76 | 2.7% |
| Self-Employed (Not Incorporated) | 86 | 3.1% |
| Not-for-profit Organizations | 204 | 7.3% |
| Local Government Employees | 198 | 7.1% |
| State Government Employees | 201 | 7.2% |
| Federal Government Employees | 190 | 6.8% |
| Unpaid Family Workers | 0 | 0.0% |
| Total | 2,796 | 100.0% |
Employment Status by Age in Galax
According to the labor force statistics for Galax, out of the total population over 16 years of age (5,231), 55.9% or 2,924 individuals are in the labor force, with 4.4% or 129 of them unemployed. The age group with the highest labor force participation rate is 20 to 24 years, with 90.6% or 384 individuals in the labor force. Within the labor force, the 16 to 19 years age range has the highest percentage of unemployed individuals, with 21.2% or 33 of them being unemployed.
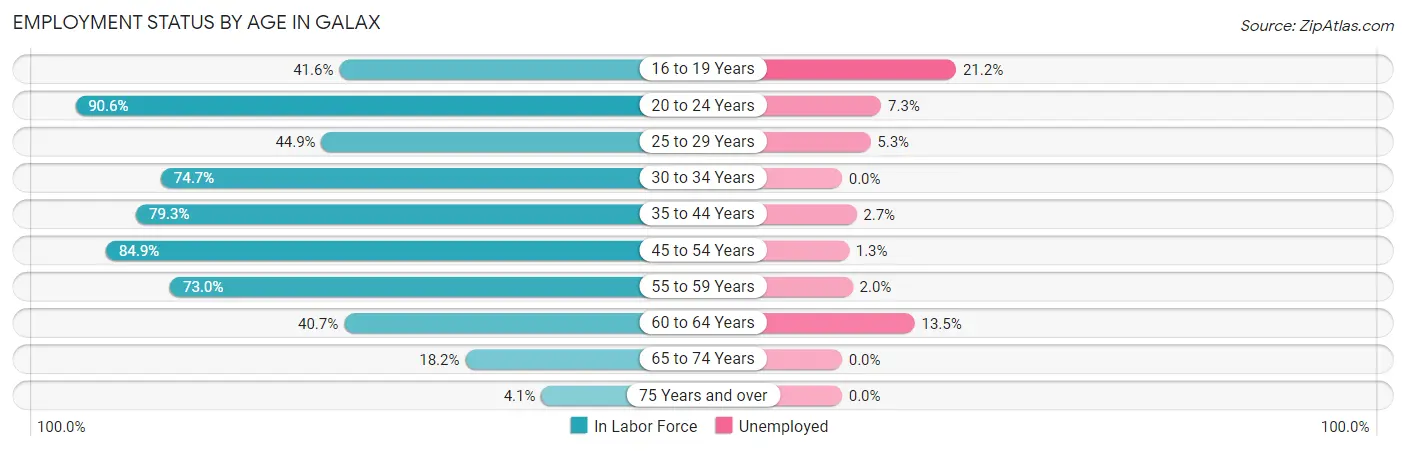
| Age Bracket | In Labor Force | Unemployed |
| 16 to 19 Years | 156 (41.6%) | 33 (21.2%) |
| 20 to 24 Years | 384 (90.6%) | 28 (7.3%) |
| 25 to 29 Years | 131 (44.9%) | 7 (5.3%) |
| 30 to 34 Years | 171 (74.7%) | 0 (0.0%) |
| 35 to 44 Years | 634 (79.3%) | 17 (2.7%) |
| 45 to 54 Years | 706 (84.9%) | 9 (1.3%) |
| 55 to 59 Years | 401 (73.0%) | 8 (2.0%) |
| 60 to 64 Years | 192 (40.7%) | 26 (13.5%) |
| 65 to 74 Years | 126 (18.2%) | 0 (0.0%) |
| 75 Years and over | 23 (4.1%) | 0 (0.0%) |
| Total | 2,924 (55.9%) | 129 (4.4%) |
Employment Status by Educational Attainment in Galax
According to labor force statistics for Galax, 70.4% of individuals (2,234) out of the total population between 25 and 64 years of age (3,173) are in the labor force, with 3.0% or 67 of them being unemployed. The group with the highest labor force participation rate are those with the educational attainment of bachelor's degree or higher, with 89.8% or 518 individuals in the labor force. Within the labor force, individuals with bachelor's degree or higher education have the highest percentage of unemployment, with 5.0% or 26 of them being unemployed.
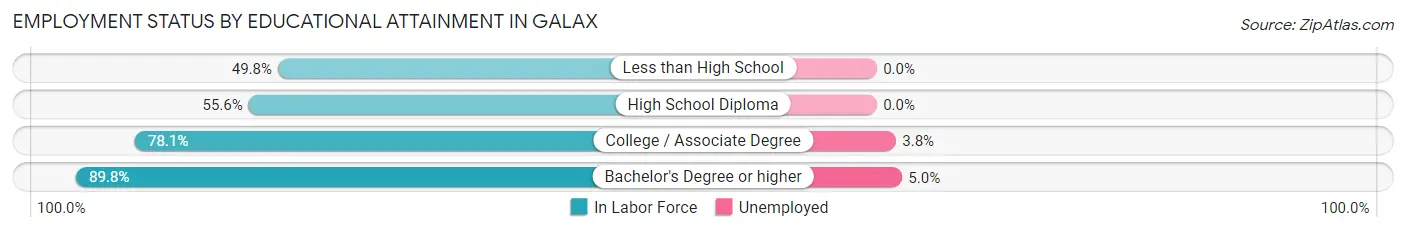
| Educational Attainment | In Labor Force | Unemployed |
| Less than High School | 318 (49.8%) | 0 (0.0%) |
| High School Diploma | 321 (55.6%) | 0 (0.0%) |
| College / Associate Degree | 1,078 (78.1%) | 52 (3.8%) |
| Bachelor's Degree or higher | 518 (89.8%) | 29 (5.0%) |
| Total | 2,234 (70.4%) | 95 (3.0%) |
Employment Occupations by Sex in Galax
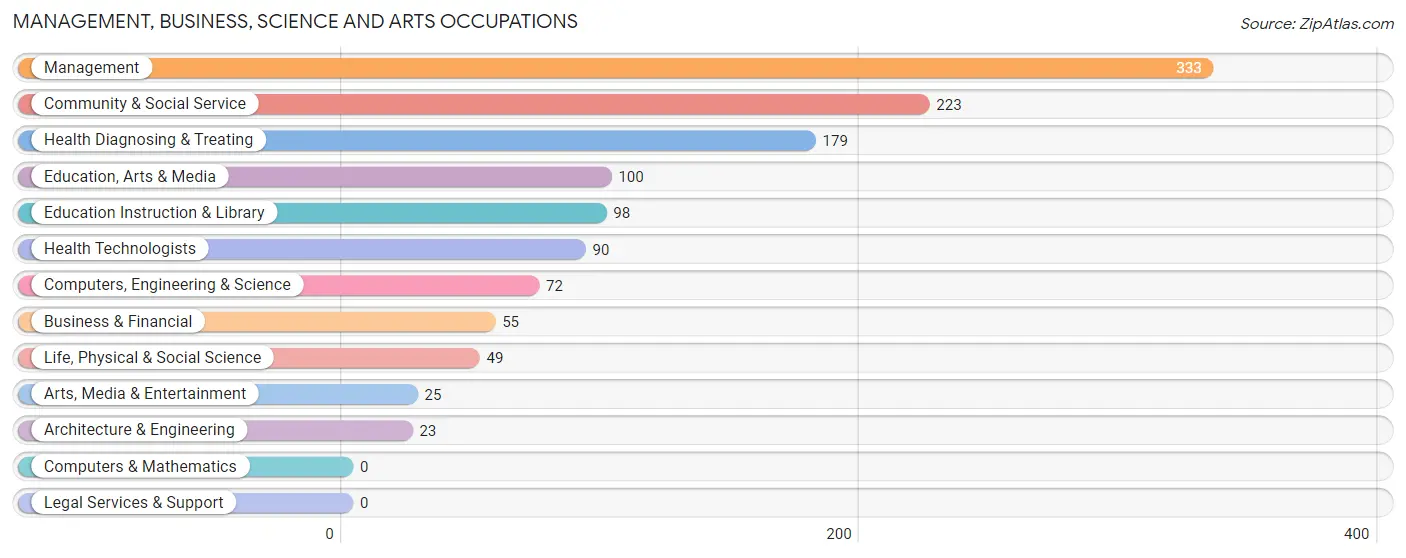
Management, Business, Science and Arts Occupations
The most common Management, Business, Science and Arts occupations in Galax are Management (333 | 11.9%), Community & Social Service (223 | 8.0%), Health Diagnosing & Treating (179 | 6.4%), Education, Arts & Media (100 | 3.6%), and Education Instruction & Library (98 | 3.5%).
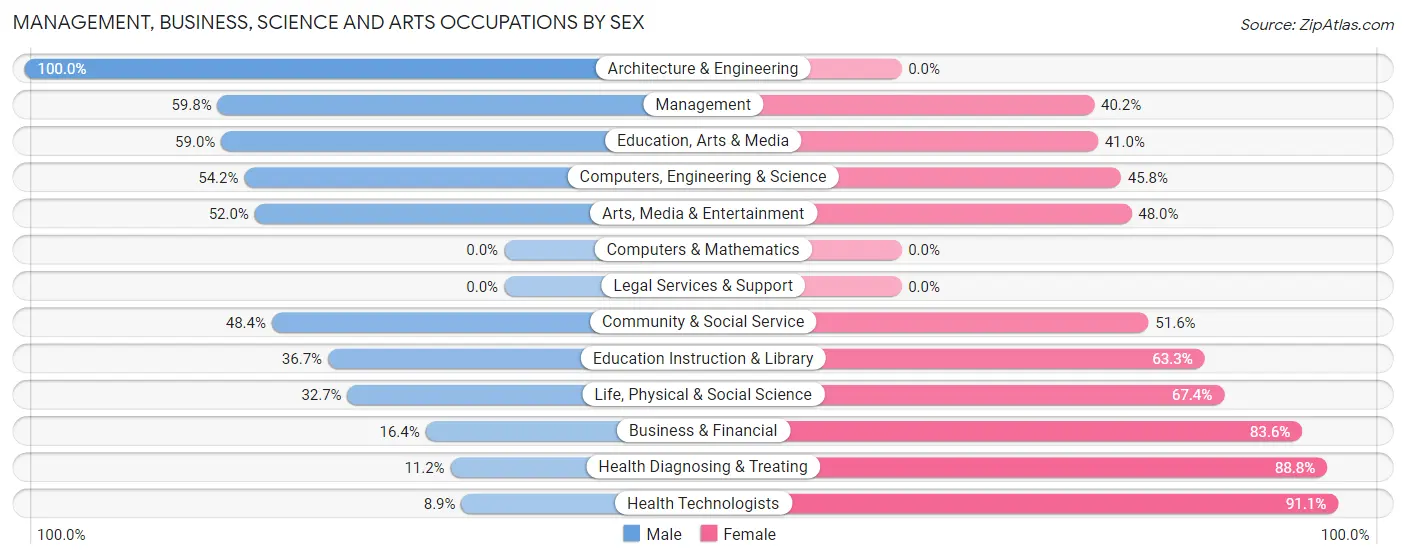
Management, Business, Science and Arts Occupations by Sex
Within the Management, Business, Science and Arts occupations in Galax, the most male-oriented occupations are Architecture & Engineering (100.0%), Management (59.8%), and Education, Arts & Media (59.0%), while the most female-oriented occupations are Health Technologists (91.1%), Health Diagnosing & Treating (88.8%), and Business & Financial (83.6%).
| Occupation | Male | Female |
| Management | 199 (59.8%) | 134 (40.2%) |
| Business & Financial | 9 (16.4%) | 46 (83.6%) |
| Computers, Engineering & Science | 39 (54.2%) | 33 (45.8%) |
| Computers & Mathematics | 0 (0.0%) | 0 (0.0%) |
| Architecture & Engineering | 23 (100.0%) | 0 (0.0%) |
| Life, Physical & Social Science | 16 (32.7%) | 33 (67.3%) |
| Community & Social Service | 108 (48.4%) | 115 (51.6%) |
| Education, Arts & Media | 59 (59.0%) | 41 (41.0%) |
| Legal Services & Support | 0 (0.0%) | 0 (0.0%) |
| Education Instruction & Library | 36 (36.7%) | 62 (63.3%) |
| Arts, Media & Entertainment | 13 (52.0%) | 12 (48.0%) |
| Health Diagnosing & Treating | 20 (11.2%) | 159 (88.8%) |
| Health Technologists | 8 (8.9%) | 82 (91.1%) |
| Total (Category) | 375 (43.5%) | 487 (56.5%) |
| Total (Overall) | 1,299 (46.5%) | 1,497 (53.5%) |
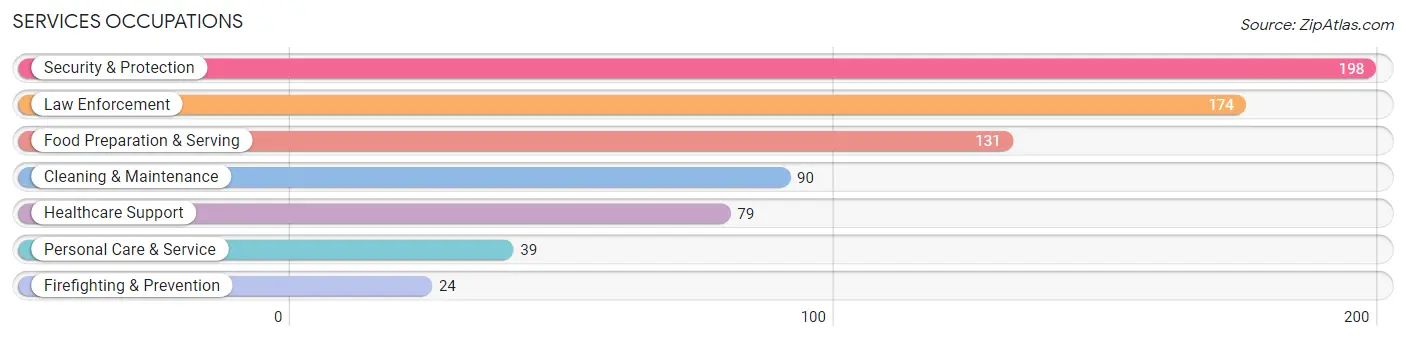
Services Occupations
The most common Services occupations in Galax are Security & Protection (198 | 7.1%), Law Enforcement (174 | 6.2%), Food Preparation & Serving (131 | 4.7%), Cleaning & Maintenance (90 | 3.2%), and Healthcare Support (79 | 2.8%).
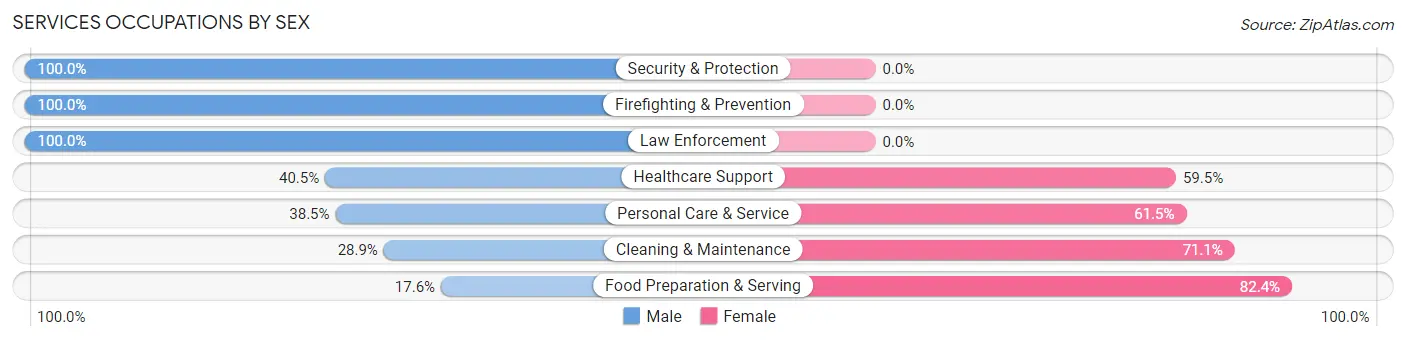
Services Occupations by Sex
Within the Services occupations in Galax, the most male-oriented occupations are Security & Protection (100.0%), Firefighting & Prevention (100.0%), and Law Enforcement (100.0%), while the most female-oriented occupations are Food Preparation & Serving (82.4%), Cleaning & Maintenance (71.1%), and Personal Care & Service (61.5%).
| Occupation | Male | Female |
| Healthcare Support | 32 (40.5%) | 47 (59.5%) |
| Security & Protection | 198 (100.0%) | 0 (0.0%) |
| Firefighting & Prevention | 24 (100.0%) | 0 (0.0%) |
| Law Enforcement | 174 (100.0%) | 0 (0.0%) |
| Food Preparation & Serving | 23 (17.6%) | 108 (82.4%) |
| Cleaning & Maintenance | 26 (28.9%) | 64 (71.1%) |
| Personal Care & Service | 15 (38.5%) | 24 (61.5%) |
| Total (Category) | 294 (54.7%) | 243 (45.3%) |
| Total (Overall) | 1,299 (46.5%) | 1,497 (53.5%) |
Sales and Office Occupations
The most common Sales and Office occupations in Galax are Sales & Related (513 | 18.3%), and Office & Administration (225 | 8.1%).
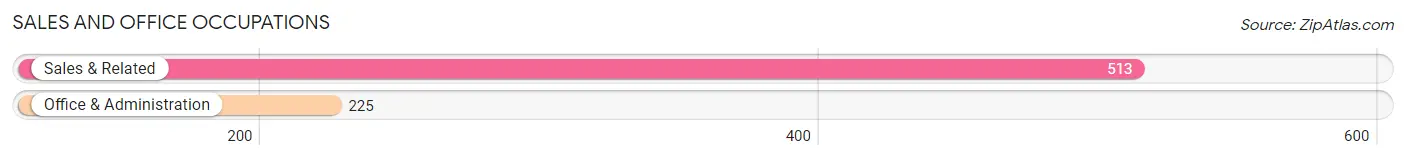
Sales and Office Occupations by Sex

| Occupation | Male | Female |
| Sales & Related | 116 (22.6%) | 397 (77.4%) |
| Office & Administration | 19 (8.4%) | 206 (91.6%) |
| Total (Category) | 135 (18.3%) | 603 (81.7%) |
| Total (Overall) | 1,299 (46.5%) | 1,497 (53.5%) |
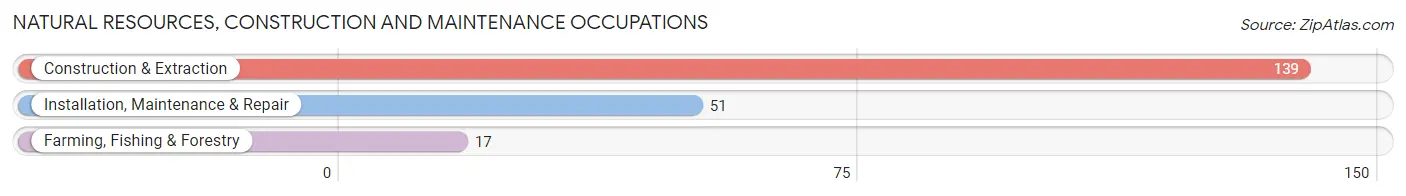
Natural Resources, Construction and Maintenance Occupations
The most common Natural Resources, Construction and Maintenance occupations in Galax are Construction & Extraction (139 | 5.0%), Installation, Maintenance & Repair (51 | 1.8%), and Farming, Fishing & Forestry (17 | 0.6%).
Natural Resources, Construction and Maintenance Occupations by Sex
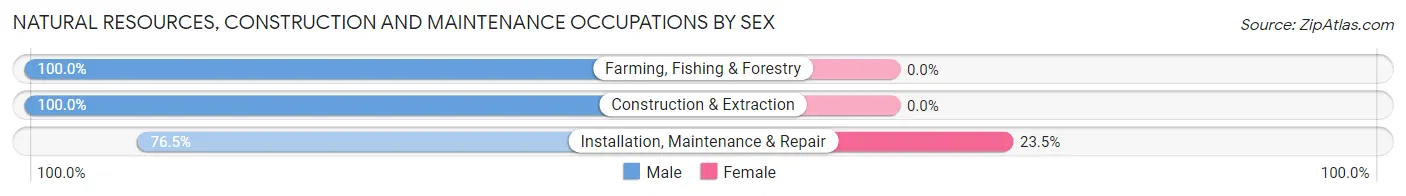
| Occupation | Male | Female |
| Farming, Fishing & Forestry | 17 (100.0%) | 0 (0.0%) |
| Construction & Extraction | 139 (100.0%) | 0 (0.0%) |
| Installation, Maintenance & Repair | 39 (76.5%) | 12 (23.5%) |
| Total (Category) | 195 (94.2%) | 12 (5.8%) |
| Total (Overall) | 1,299 (46.5%) | 1,497 (53.5%) |
Production, Transportation and Moving Occupations
The most common Production, Transportation and Moving occupations in Galax are Production (354 | 12.7%), Material Moving (55 | 2.0%), and Transportation (43 | 1.5%).
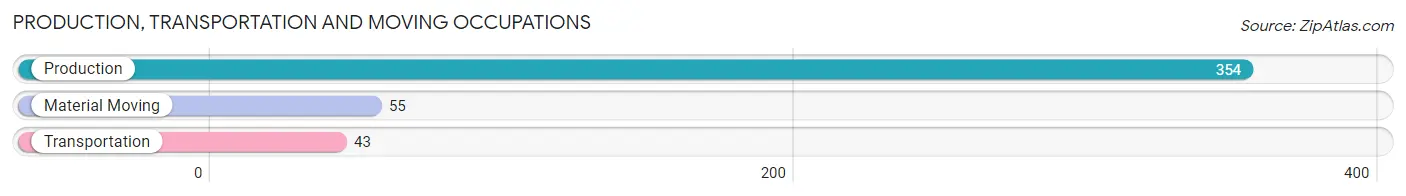
Production, Transportation and Moving Occupations by Sex
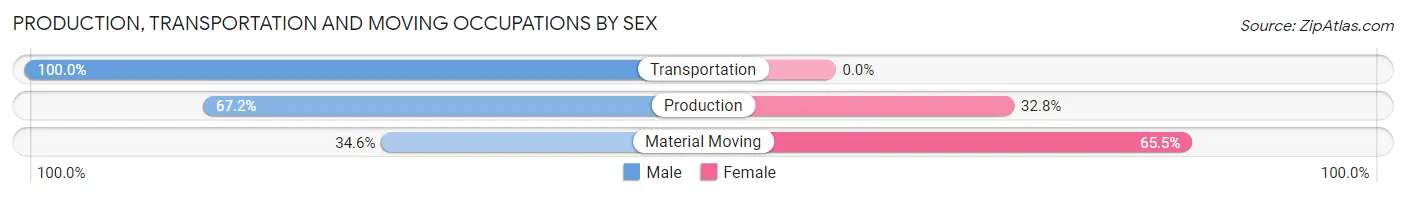
| Occupation | Male | Female |
| Production | 238 (67.2%) | 116 (32.8%) |
| Transportation | 43 (100.0%) | 0 (0.0%) |
| Material Moving | 19 (34.5%) | 36 (65.4%) |
| Total (Category) | 300 (66.4%) | 152 (33.6%) |
| Total (Overall) | 1,299 (46.5%) | 1,497 (53.5%) |
Employment Industries by Sex in Galax
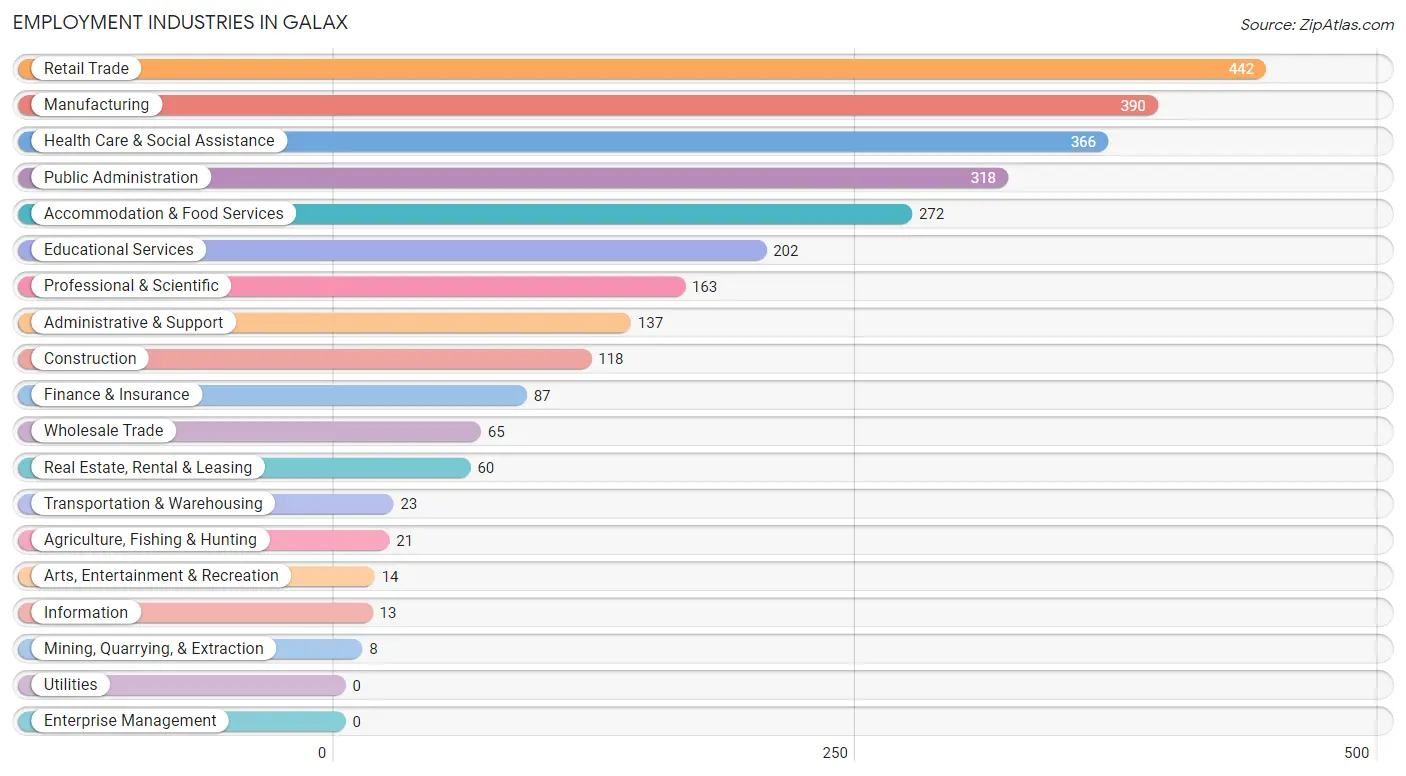
Employment Industries in Galax
The major employment industries in Galax include Retail Trade (442 | 15.8%), Manufacturing (390 | 14.0%), Health Care & Social Assistance (366 | 13.1%), Public Administration (318 | 11.4%), and Accommodation & Food Services (272 | 9.7%).
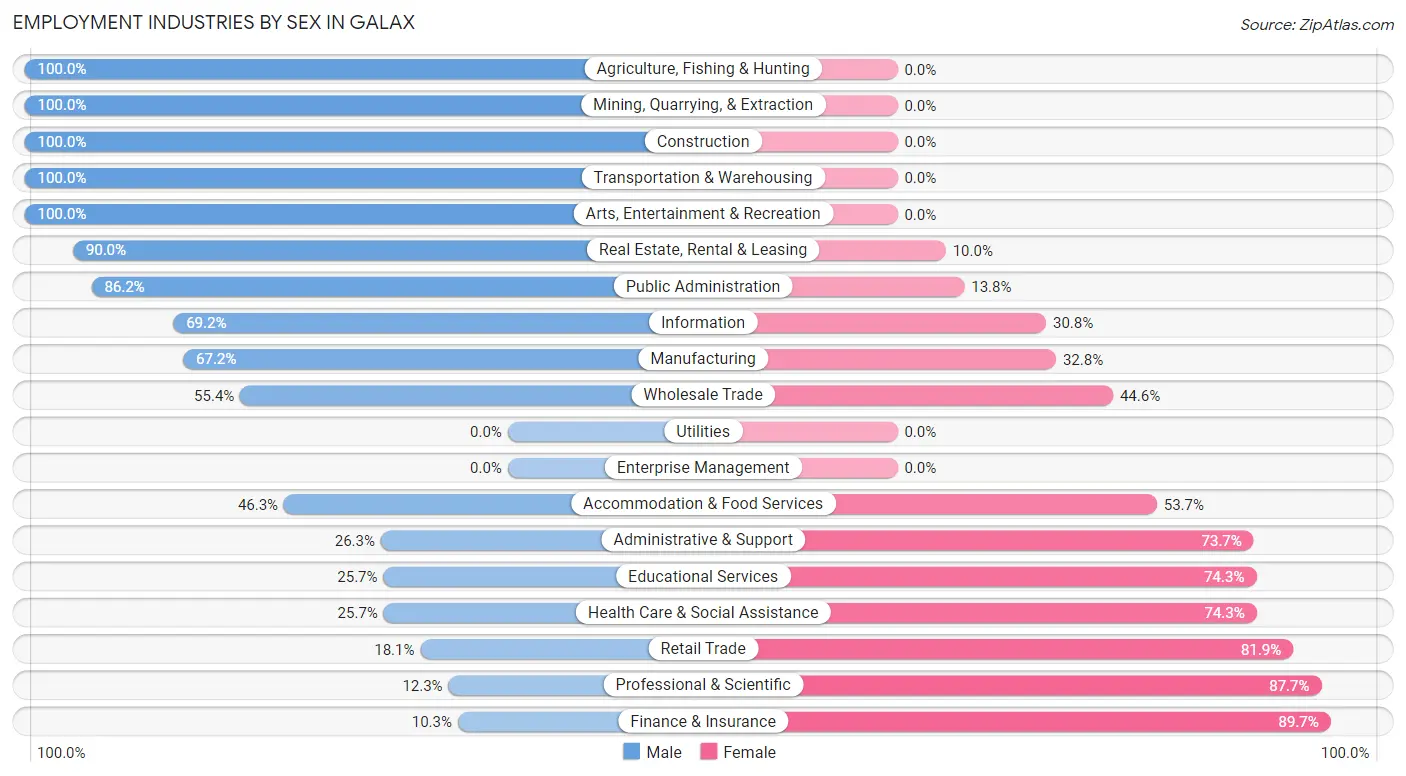
Employment Industries by Sex in Galax
The Galax industries that see more men than women are Agriculture, Fishing & Hunting (100.0%), Mining, Quarrying, & Extraction (100.0%), and Construction (100.0%), whereas the industries that tend to have a higher number of women are Finance & Insurance (89.7%), Professional & Scientific (87.7%), and Retail Trade (81.9%).
| Industry | Male | Female |
| Agriculture, Fishing & Hunting | 21 (100.0%) | 0 (0.0%) |
| Mining, Quarrying, & Extraction | 8 (100.0%) | 0 (0.0%) |
| Construction | 118 (100.0%) | 0 (0.0%) |
| Manufacturing | 262 (67.2%) | 128 (32.8%) |
| Wholesale Trade | 36 (55.4%) | 29 (44.6%) |
| Retail Trade | 80 (18.1%) | 362 (81.9%) |
| Transportation & Warehousing | 23 (100.0%) | 0 (0.0%) |
| Utilities | 0 (0.0%) | 0 (0.0%) |
| Information | 9 (69.2%) | 4 (30.8%) |
| Finance & Insurance | 9 (10.3%) | 78 (89.7%) |
| Real Estate, Rental & Leasing | 54 (90.0%) | 6 (10.0%) |
| Professional & Scientific | 20 (12.3%) | 143 (87.7%) |
| Enterprise Management | 0 (0.0%) | 0 (0.0%) |
| Administrative & Support | 36 (26.3%) | 101 (73.7%) |
| Educational Services | 52 (25.7%) | 150 (74.3%) |
| Health Care & Social Assistance | 94 (25.7%) | 272 (74.3%) |
| Arts, Entertainment & Recreation | 14 (100.0%) | 0 (0.0%) |
| Accommodation & Food Services | 126 (46.3%) | 146 (53.7%) |
| Public Administration | 274 (86.2%) | 44 (13.8%) |
| Total | 1,299 (46.5%) | 1,497 (53.5%) |
Education in Galax
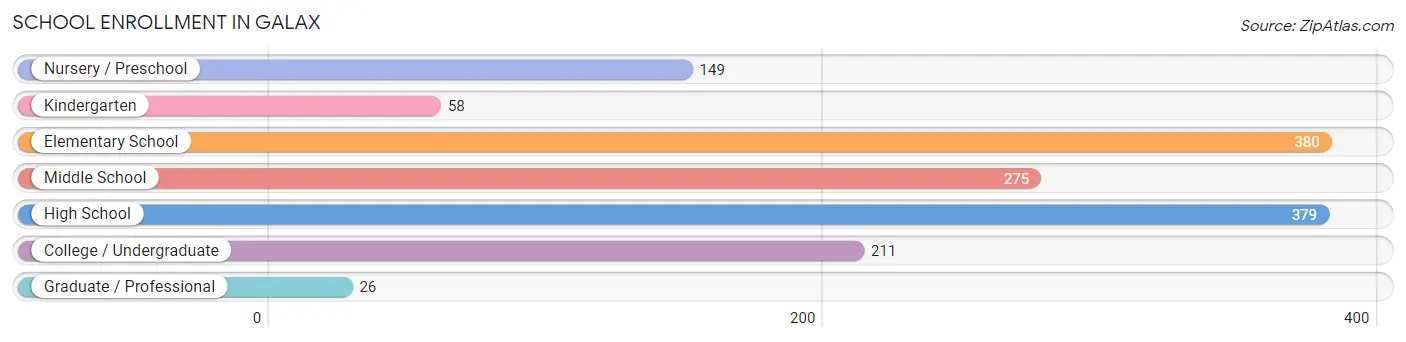
School Enrollment in Galax
The most common levels of schooling among the 1,478 students in Galax are elementary school (380 | 25.7%), high school (379 | 25.6%), and middle school (275 | 18.6%).
| School Level | # Students | % Students |
| Nursery / Preschool | 149 | 10.1% |
| Kindergarten | 58 | 3.9% |
| Elementary School | 380 | 25.7% |
| Middle School | 275 | 18.6% |
| High School | 379 | 25.6% |
| College / Undergraduate | 211 | 14.3% |
| Graduate / Professional | 26 | 1.8% |
| Total | 1,478 | 100.0% |
School Enrollment by Age by Funding Source in Galax
Out of a total of 1,478 students who are enrolled in schools in Galax, 157 (10.6%) attend a private institution, while the remaining 1,321 (89.4%) are enrolled in public schools. The age group of 3 to 4 year olds has the highest likelihood of being enrolled in private schools, with 44 (44.9% in the age bracket) enrolled. Conversely, the age group of 18 to 19 year olds has the lowest likelihood of being enrolled in a private school, with 99 (100.0% in the age bracket) attending a public institution.
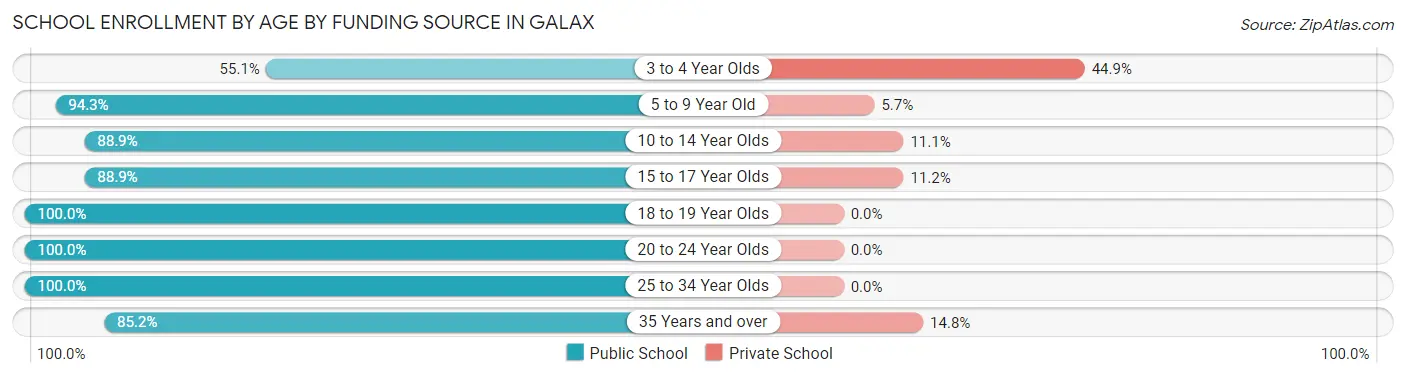
| Age Bracket | Public School | Private School |
| 3 to 4 Year Olds | 54 (55.1%) | 44 (44.9%) |
| 5 to 9 Year Old | 444 (94.3%) | 27 (5.7%) |
| 10 to 14 Year Olds | 327 (88.9%) | 41 (11.1%) |
| 15 to 17 Year Olds | 263 (88.8%) | 33 (11.2%) |
| 18 to 19 Year Olds | 99 (100.0%) | 0 (0.0%) |
| 20 to 24 Year Olds | 52 (100.0%) | 0 (0.0%) |
| 25 to 34 Year Olds | 13 (100.0%) | 0 (0.0%) |
| 35 Years and over | 69 (85.2%) | 12 (14.8%) |
| Total | 1,321 (89.4%) | 157 (10.6%) |
Educational Attainment by Field of Study in Galax
Education (155 | 17.8%), science & technology (108 | 12.4%), engineering (101 | 11.6%), arts & humanities (97 | 11.1%), and psychology (82 | 9.4%) are the most common fields of study among 872 individuals in Galax who have obtained a bachelor's degree or higher.
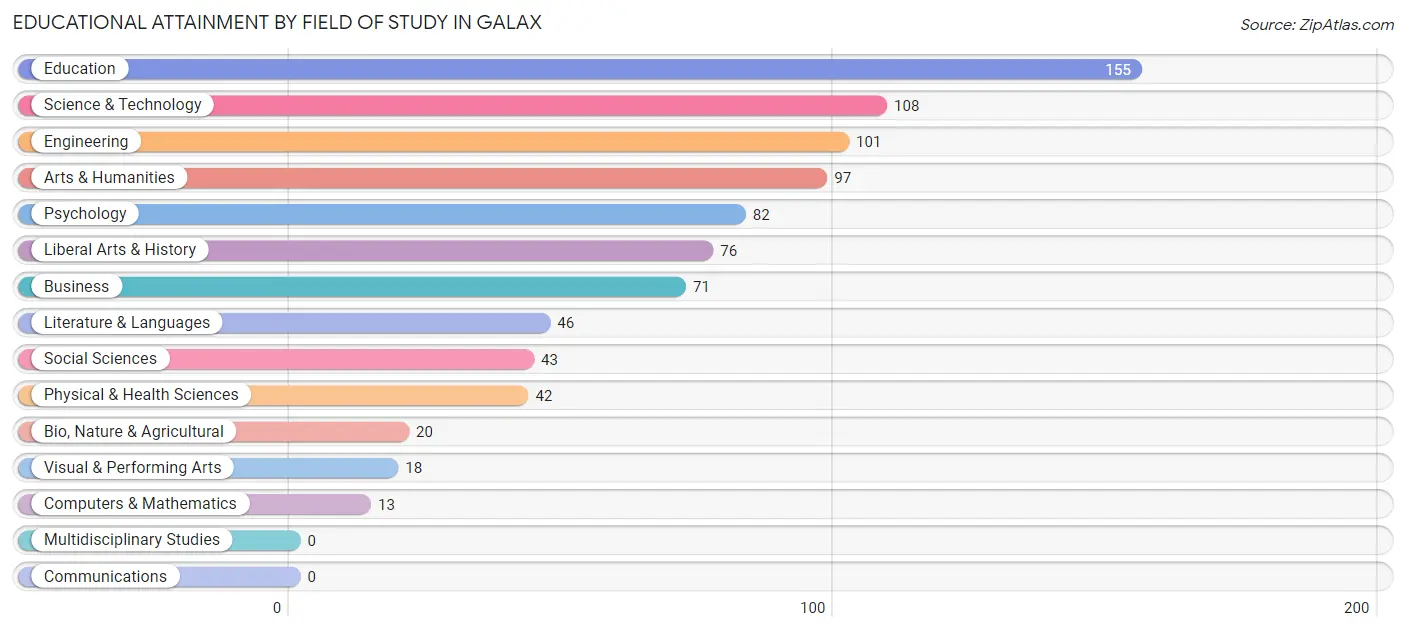
| Field of Study | # Graduates | % Graduates |
| Computers & Mathematics | 13 | 1.5% |
| Bio, Nature & Agricultural | 20 | 2.3% |
| Physical & Health Sciences | 42 | 4.8% |
| Psychology | 82 | 9.4% |
| Social Sciences | 43 | 4.9% |
| Engineering | 101 | 11.6% |
| Multidisciplinary Studies | 0 | 0.0% |
| Science & Technology | 108 | 12.4% |
| Business | 71 | 8.1% |
| Education | 155 | 17.8% |
| Literature & Languages | 46 | 5.3% |
| Liberal Arts & History | 76 | 8.7% |
| Visual & Performing Arts | 18 | 2.1% |
| Communications | 0 | 0.0% |
| Arts & Humanities | 97 | 11.1% |
| Total | 872 | 100.0% |
Transportation & Commute in Galax
Vehicle Availability by Sex in Galax
The most prevalent vehicle ownership categories in Galax are males with 2 vehicles (779, accounting for 60.0%) and females with 2 vehicles (679, making up 52.7%).
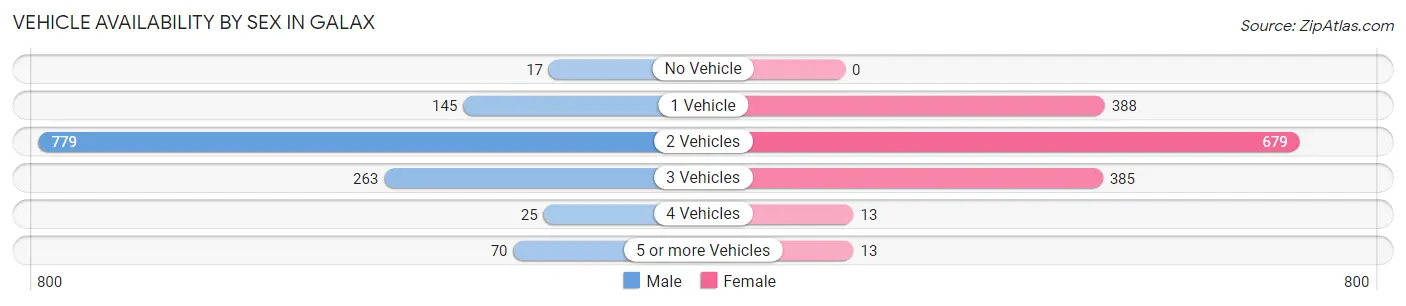
| Vehicles Available | Male | Female |
| No Vehicle | 17 (1.3%) | 0 (0.0%) |
| 1 Vehicle | 145 (11.2%) | 388 (26.3%) |
| 2 Vehicles | 779 (60.0%) | 679 (45.9%) |
| 3 Vehicles | 263 (20.3%) | 385 (26.1%) |
| 4 Vehicles | 25 (1.9%) | 13 (0.9%) |
| 5 or more Vehicles | 70 (5.4%) | 13 (0.9%) |
| Total | 1,299 (100.0%) | 1,478 (100.0%) |
Commute Time in Galax
The most frequently occuring commute durations in Galax are 5 to 9 minutes (879 commuters, 32.9%), 10 to 14 minutes (432 commuters, 16.2%), and 15 to 19 minutes (375 commuters, 14.1%).
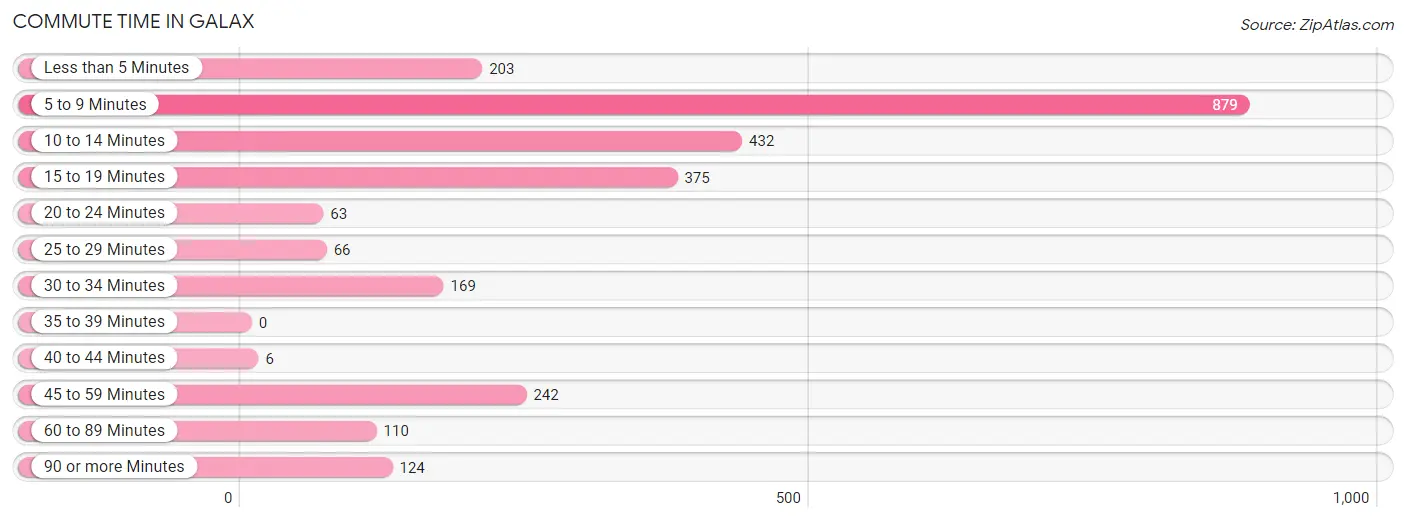
| Commute Time | # Commuters | % Commuters |
| Less than 5 Minutes | 203 | 7.6% |
| 5 to 9 Minutes | 879 | 32.9% |
| 10 to 14 Minutes | 432 | 16.2% |
| 15 to 19 Minutes | 375 | 14.1% |
| 20 to 24 Minutes | 63 | 2.4% |
| 25 to 29 Minutes | 66 | 2.5% |
| 30 to 34 Minutes | 169 | 6.3% |
| 35 to 39 Minutes | 0 | 0.0% |
| 40 to 44 Minutes | 6 | 0.2% |
| 45 to 59 Minutes | 242 | 9.1% |
| 60 to 89 Minutes | 110 | 4.1% |
| 90 or more Minutes | 124 | 4.6% |
Commute Time by Sex in Galax
The most common commute times in Galax are 5 to 9 minutes (454 commuters, 36.5%) for males and 5 to 9 minutes (425 commuters, 29.8%) for females.
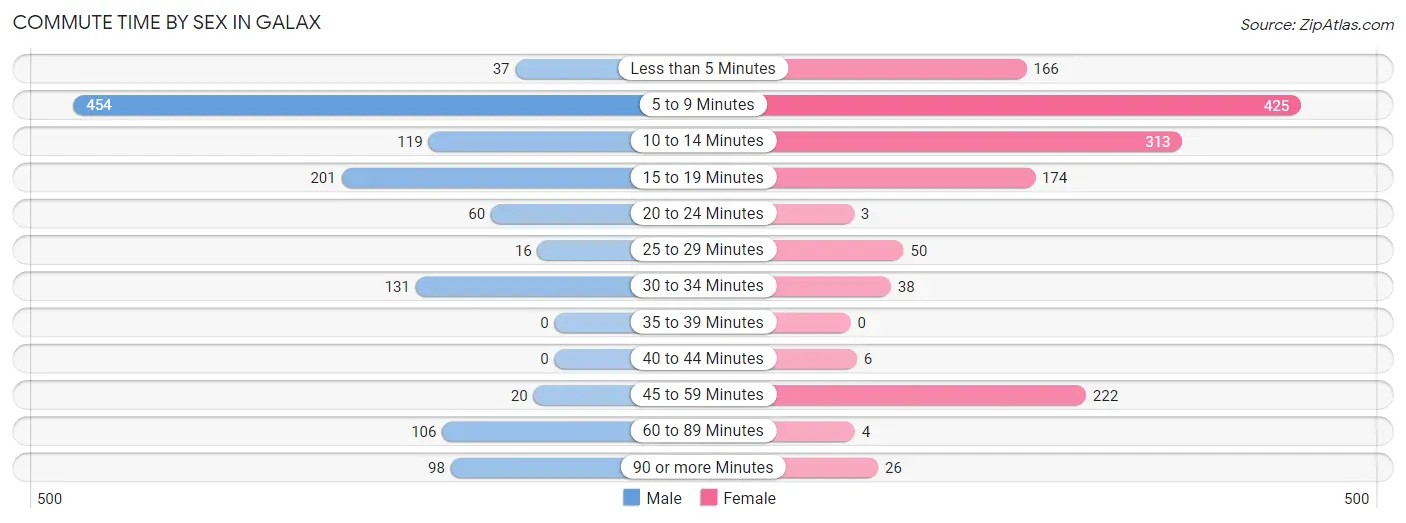
| Commute Time | Male | Female |
| Less than 5 Minutes | 37 (3.0%) | 166 (11.6%) |
| 5 to 9 Minutes | 454 (36.5%) | 425 (29.8%) |
| 10 to 14 Minutes | 119 (9.6%) | 313 (21.9%) |
| 15 to 19 Minutes | 201 (16.2%) | 174 (12.2%) |
| 20 to 24 Minutes | 60 (4.8%) | 3 (0.2%) |
| 25 to 29 Minutes | 16 (1.3%) | 50 (3.5%) |
| 30 to 34 Minutes | 131 (10.5%) | 38 (2.7%) |
| 35 to 39 Minutes | 0 (0.0%) | 0 (0.0%) |
| 40 to 44 Minutes | 0 (0.0%) | 6 (0.4%) |
| 45 to 59 Minutes | 20 (1.6%) | 222 (15.6%) |
| 60 to 89 Minutes | 106 (8.5%) | 4 (0.3%) |
| 90 or more Minutes | 98 (7.9%) | 26 (1.8%) |
Time of Departure to Work by Sex in Galax
The most frequent times of departure to work in Galax are 12:00 AM to 4:59 AM (180, 14.5%) for males and 12:00 PM to 3:59 PM (240, 16.8%) for females.
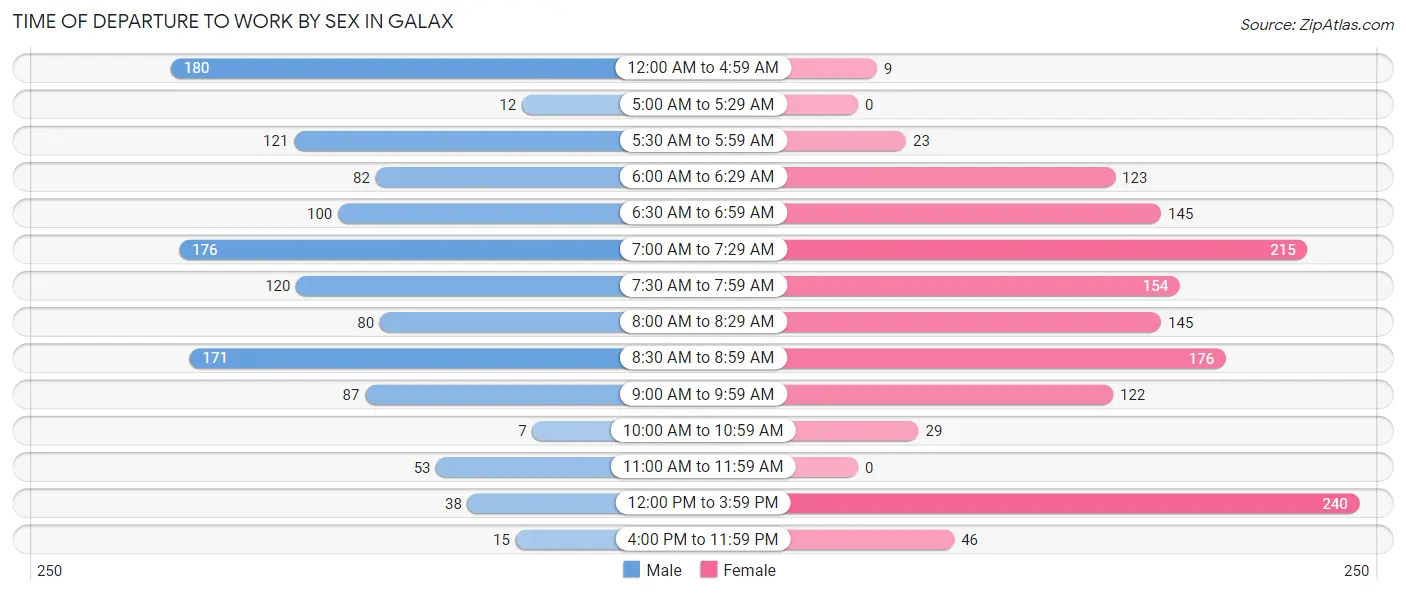
| Time of Departure | Male | Female |
| 12:00 AM to 4:59 AM | 180 (14.5%) | 9 (0.6%) |
| 5:00 AM to 5:29 AM | 12 (1.0%) | 0 (0.0%) |
| 5:30 AM to 5:59 AM | 121 (9.7%) | 23 (1.6%) |
| 6:00 AM to 6:29 AM | 82 (6.6%) | 123 (8.6%) |
| 6:30 AM to 6:59 AM | 100 (8.1%) | 145 (10.2%) |
| 7:00 AM to 7:29 AM | 176 (14.2%) | 215 (15.1%) |
| 7:30 AM to 7:59 AM | 120 (9.7%) | 154 (10.8%) |
| 8:00 AM to 8:29 AM | 80 (6.4%) | 145 (10.2%) |
| 8:30 AM to 8:59 AM | 171 (13.8%) | 176 (12.3%) |
| 9:00 AM to 9:59 AM | 87 (7.0%) | 122 (8.6%) |
| 10:00 AM to 10:59 AM | 7 (0.6%) | 29 (2.0%) |
| 11:00 AM to 11:59 AM | 53 (4.3%) | 0 (0.0%) |
| 12:00 PM to 3:59 PM | 38 (3.1%) | 240 (16.8%) |
| 4:00 PM to 11:59 PM | 15 (1.2%) | 46 (3.2%) |
| Total | 1,242 (100.0%) | 1,427 (100.0%) |
Housing Occupancy in Galax
Occupancy by Ownership in Galax
Of the total 2,618 dwellings in Galax, owner-occupied units account for 1,847 (70.6%), while renter-occupied units make up 771 (29.4%).
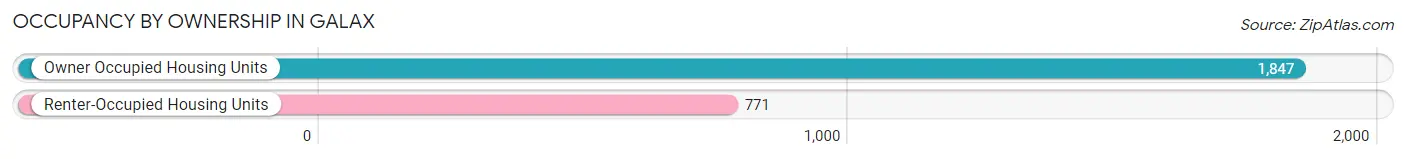
| Occupancy | # Housing Units | % Housing Units |
| Owner Occupied Housing Units | 1,847 | 70.6% |
| Renter-Occupied Housing Units | 771 | 29.4% |
| Total Occupied Housing Units | 2,618 | 100.0% |
Occupancy by Household Size in Galax
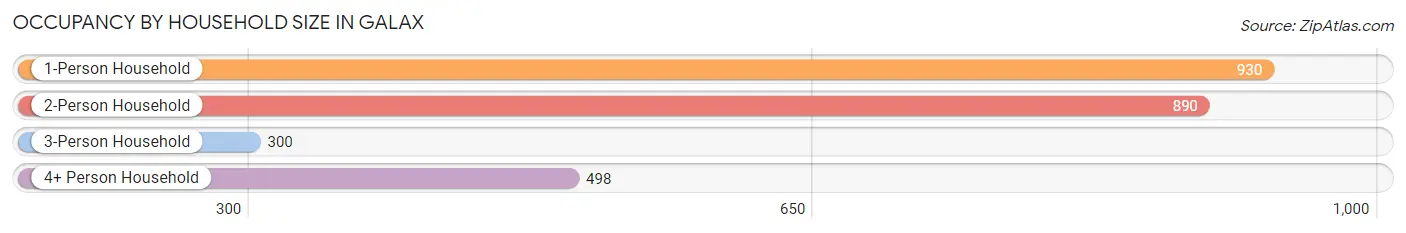
| Household Size | # Housing Units | % Housing Units |
| 1-Person Household | 930 | 35.5% |
| 2-Person Household | 890 | 34.0% |
| 3-Person Household | 300 | 11.5% |
| 4+ Person Household | 498 | 19.0% |
| Total Housing Units | 2,618 | 100.0% |
Occupancy by Ownership by Household Size in Galax
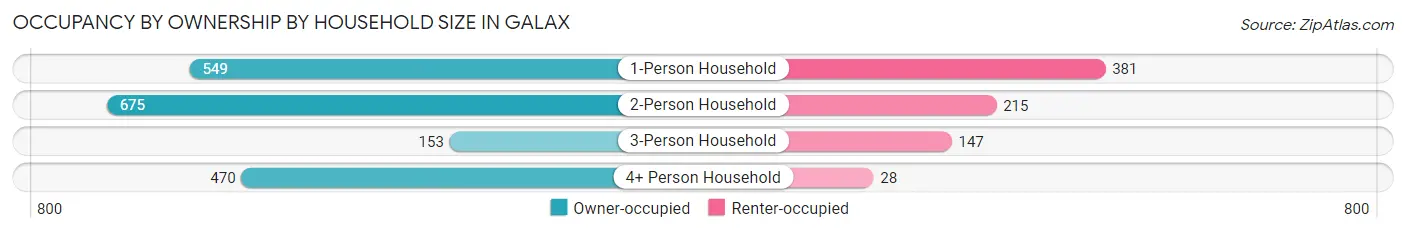
| Household Size | Owner-occupied | Renter-occupied |
| 1-Person Household | 549 (59.0%) | 381 (41.0%) |
| 2-Person Household | 675 (75.8%) | 215 (24.2%) |
| 3-Person Household | 153 (51.0%) | 147 (49.0%) |
| 4+ Person Household | 470 (94.4%) | 28 (5.6%) |
| Total Housing Units | 1,847 (70.6%) | 771 (29.4%) |
Occupancy by Educational Attainment in Galax
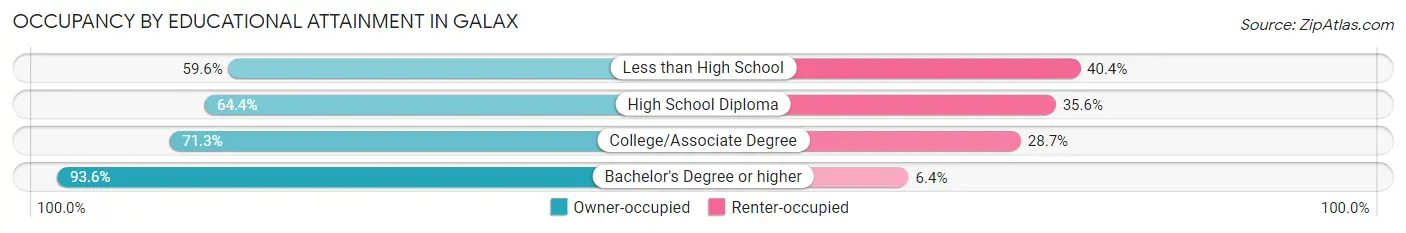
| Household Size | Owner-occupied | Renter-occupied |
| Less than High School | 330 (59.6%) | 224 (40.4%) |
| High School Diploma | 416 (64.4%) | 230 (35.6%) |
| College/Associate Degree | 723 (71.3%) | 291 (28.7%) |
| Bachelor's Degree or higher | 378 (93.6%) | 26 (6.4%) |
Occupancy by Age of Householder in Galax
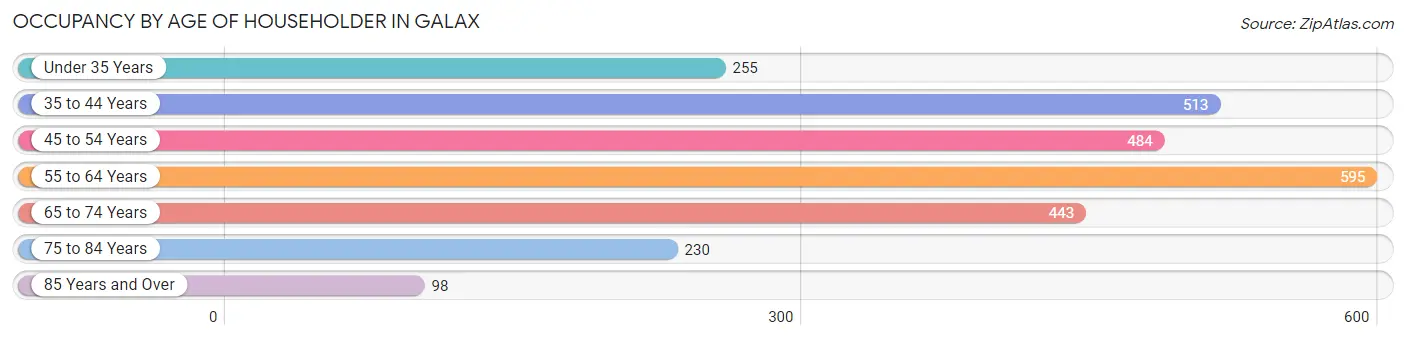
| Age Bracket | # Households | % Households |
| Under 35 Years | 255 | 9.7% |
| 35 to 44 Years | 513 | 19.6% |
| 45 to 54 Years | 484 | 18.5% |
| 55 to 64 Years | 595 | 22.7% |
| 65 to 74 Years | 443 | 16.9% |
| 75 to 84 Years | 230 | 8.8% |
| 85 Years and Over | 98 | 3.7% |
| Total | 2,618 | 100.0% |
Housing Finances in Galax
Median Income by Occupancy in Galax
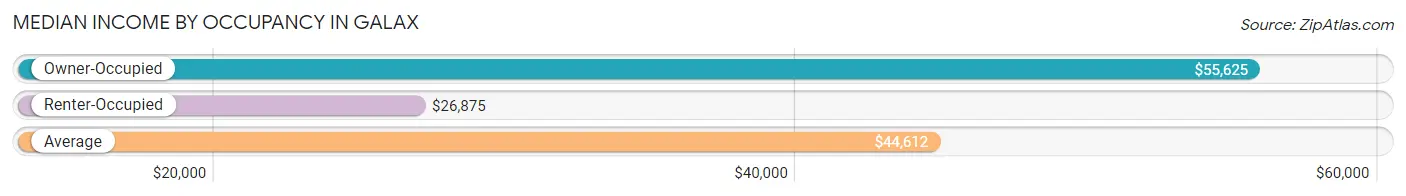
| Occupancy Type | # Households | Median Income |
| Owner-Occupied | 1,847 (70.6%) | $55,625 |
| Renter-Occupied | 771 (29.4%) | $26,875 |
| Average | 2,618 (100.0%) | $44,612 |
Occupancy by Householder Income Bracket in Galax
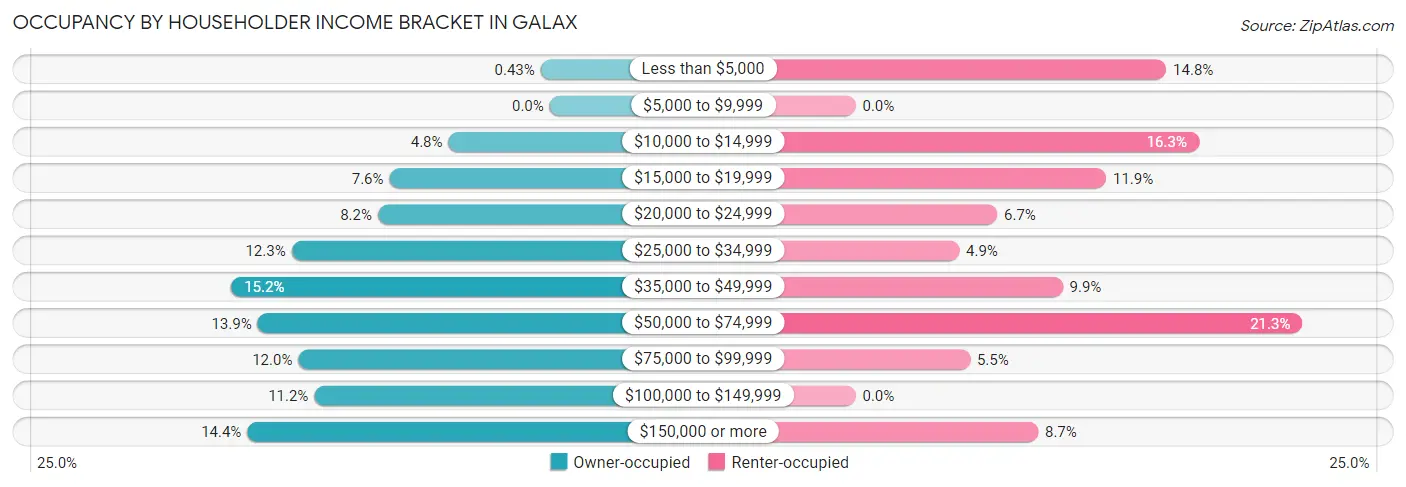
| Income Bracket | Owner-occupied | Renter-occupied |
| Less than $5,000 | 8 (0.4%) | 114 (14.8%) |
| $5,000 to $9,999 | 0 (0.0%) | 0 (0.0%) |
| $10,000 to $14,999 | 89 (4.8%) | 126 (16.3%) |
| $15,000 to $19,999 | 141 (7.6%) | 92 (11.9%) |
| $20,000 to $24,999 | 151 (8.2%) | 52 (6.7%) |
| $25,000 to $34,999 | 227 (12.3%) | 38 (4.9%) |
| $35,000 to $49,999 | 280 (15.2%) | 76 (9.9%) |
| $50,000 to $74,999 | 257 (13.9%) | 164 (21.3%) |
| $75,000 to $99,999 | 221 (12.0%) | 42 (5.4%) |
| $100,000 to $149,999 | 207 (11.2%) | 0 (0.0%) |
| $150,000 or more | 266 (14.4%) | 67 (8.7%) |
| Total | 1,847 (100.0%) | 771 (100.0%) |
Monthly Housing Cost Tiers in Galax
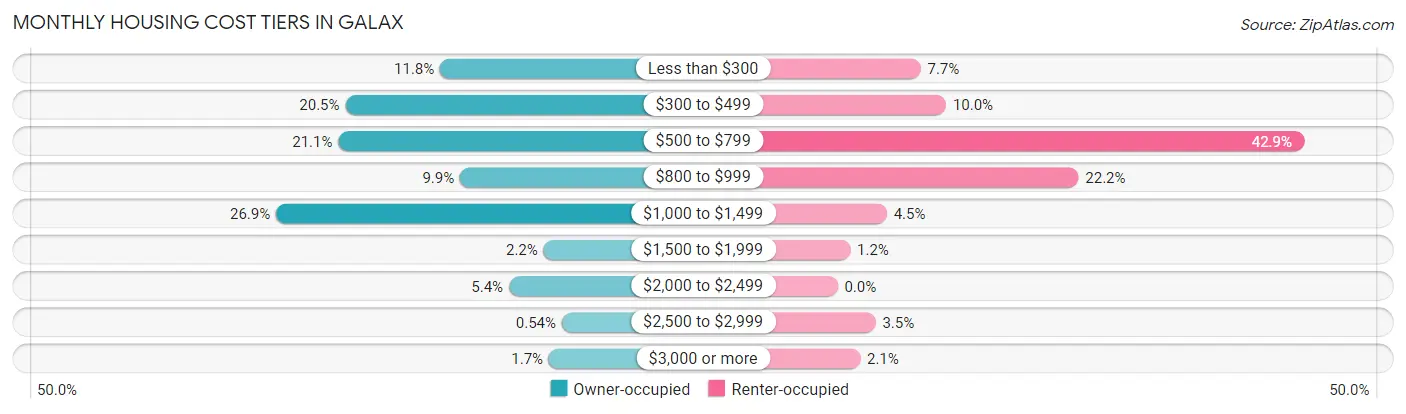
| Monthly Cost | Owner-occupied | Renter-occupied |
| Less than $300 | 217 (11.7%) | 59 (7.6%) |
| $300 to $499 | 378 (20.5%) | 77 (10.0%) |
| $500 to $799 | 390 (21.1%) | 331 (42.9%) |
| $800 to $999 | 183 (9.9%) | 171 (22.2%) |
| $1,000 to $1,499 | 496 (26.9%) | 35 (4.5%) |
| $1,500 to $1,999 | 41 (2.2%) | 9 (1.2%) |
| $2,000 to $2,499 | 100 (5.4%) | 0 (0.0%) |
| $2,500 to $2,999 | 10 (0.5%) | 27 (3.5%) |
| $3,000 or more | 32 (1.7%) | 16 (2.1%) |
| Total | 1,847 (100.0%) | 771 (100.0%) |
Physical Housing Characteristics in Galax
Housing Structures in Galax
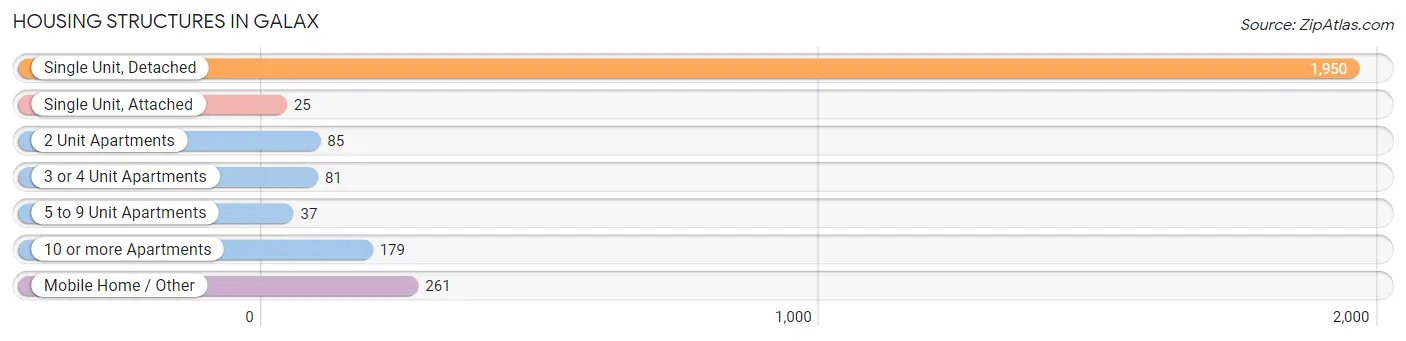
| Structure Type | # Housing Units | % Housing Units |
| Single Unit, Detached | 1,950 | 74.5% |
| Single Unit, Attached | 25 | 0.9% |
| 2 Unit Apartments | 85 | 3.3% |
| 3 or 4 Unit Apartments | 81 | 3.1% |
| 5 to 9 Unit Apartments | 37 | 1.4% |
| 10 or more Apartments | 179 | 6.8% |
| Mobile Home / Other | 261 | 10.0% |
| Total | 2,618 | 100.0% |
Housing Structures by Occupancy in Galax
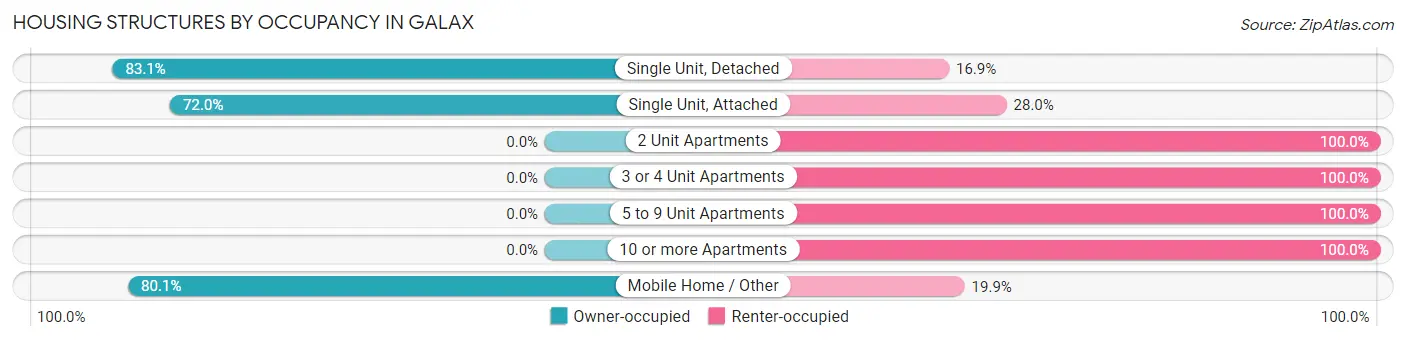
| Structure Type | Owner-occupied | Renter-occupied |
| Single Unit, Detached | 1,620 (83.1%) | 330 (16.9%) |
| Single Unit, Attached | 18 (72.0%) | 7 (28.0%) |
| 2 Unit Apartments | 0 (0.0%) | 85 (100.0%) |
| 3 or 4 Unit Apartments | 0 (0.0%) | 81 (100.0%) |
| 5 to 9 Unit Apartments | 0 (0.0%) | 37 (100.0%) |
| 10 or more Apartments | 0 (0.0%) | 179 (100.0%) |
| Mobile Home / Other | 209 (80.1%) | 52 (19.9%) |
| Total | 1,847 (70.6%) | 771 (29.4%) |
Housing Structures by Number of Rooms in Galax
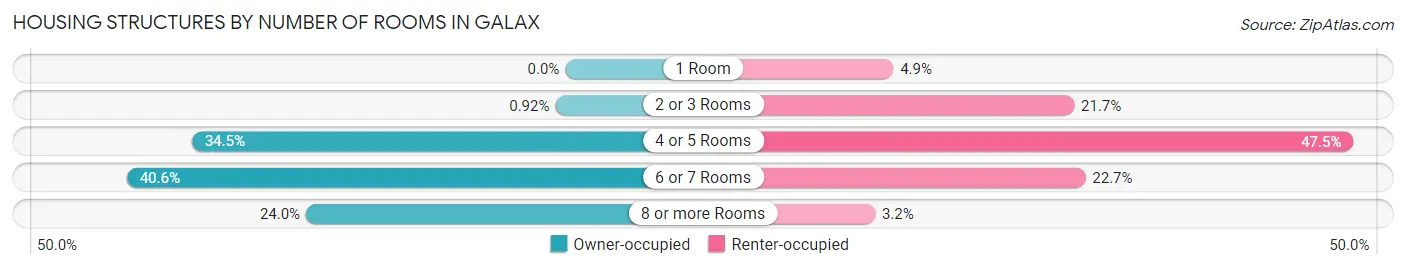
| Number of Rooms | Owner-occupied | Renter-occupied |
| 1 Room | 0 (0.0%) | 38 (4.9%) |
| 2 or 3 Rooms | 17 (0.9%) | 167 (21.7%) |
| 4 or 5 Rooms | 638 (34.5%) | 366 (47.5%) |
| 6 or 7 Rooms | 749 (40.6%) | 175 (22.7%) |
| 8 or more Rooms | 443 (24.0%) | 25 (3.2%) |
| Total | 1,847 (100.0%) | 771 (100.0%) |
Housing Structure by Heating Type in Galax
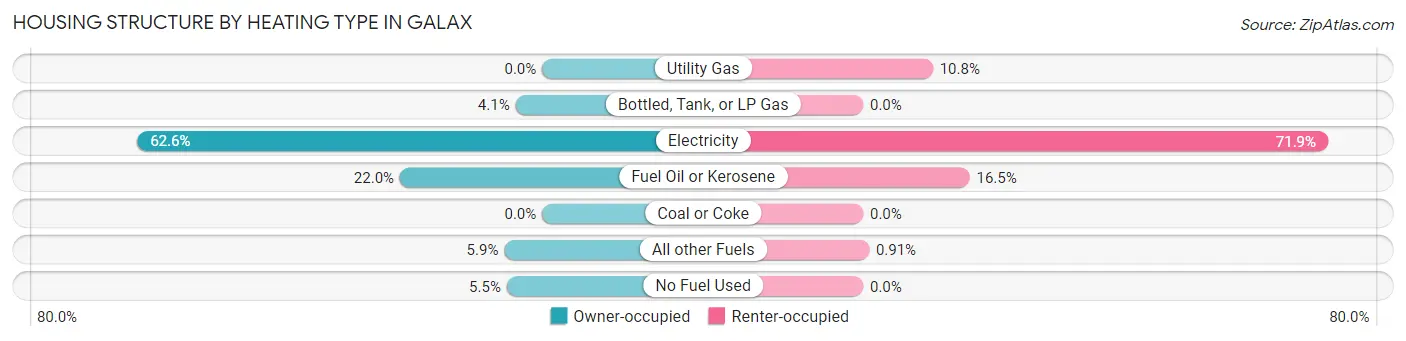
| Heating Type | Owner-occupied | Renter-occupied |
| Utility Gas | 0 (0.0%) | 83 (10.8%) |
| Bottled, Tank, or LP Gas | 76 (4.1%) | 0 (0.0%) |
| Electricity | 1,156 (62.6%) | 554 (71.9%) |
| Fuel Oil or Kerosene | 406 (22.0%) | 127 (16.5%) |
| Coal or Coke | 0 (0.0%) | 0 (0.0%) |
| All other Fuels | 108 (5.9%) | 7 (0.9%) |
| No Fuel Used | 101 (5.5%) | 0 (0.0%) |
| Total | 1,847 (100.0%) | 771 (100.0%) |
Household Vehicle Usage in Galax
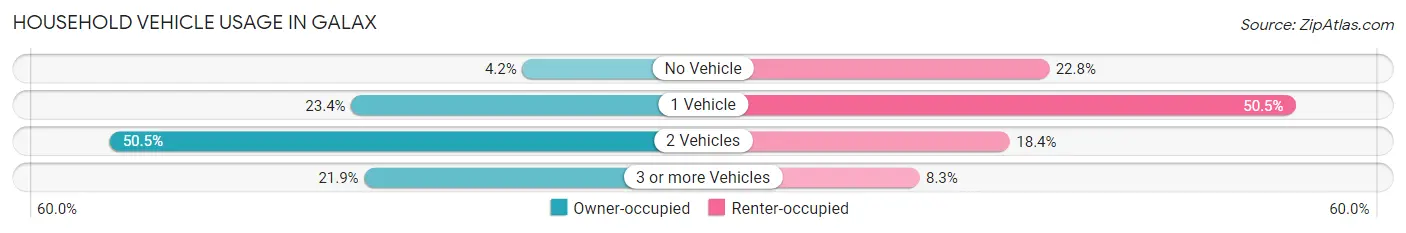
| Vehicles per Household | Owner-occupied | Renter-occupied |
| No Vehicle | 78 (4.2%) | 176 (22.8%) |
| 1 Vehicle | 432 (23.4%) | 389 (50.4%) |
| 2 Vehicles | 932 (50.5%) | 142 (18.4%) |
| 3 or more Vehicles | 405 (21.9%) | 64 (8.3%) |
| Total | 1,847 (100.0%) | 771 (100.0%) |
Real Estate & Mortgages in Galax
Real Estate and Mortgage Overview in Galax
| Characteristic | Without Mortgage | With Mortgage |
| Housing Units | 697 | 1,150 |
| Median Property Value | $90,700 | $118,900 |
| Median Household Income | $33,810 | $231 |
| Monthly Housing Costs | $337 | $32 |
| Real Estate Taxes | $777 | $8 |
Property Value by Mortgage Status in Galax
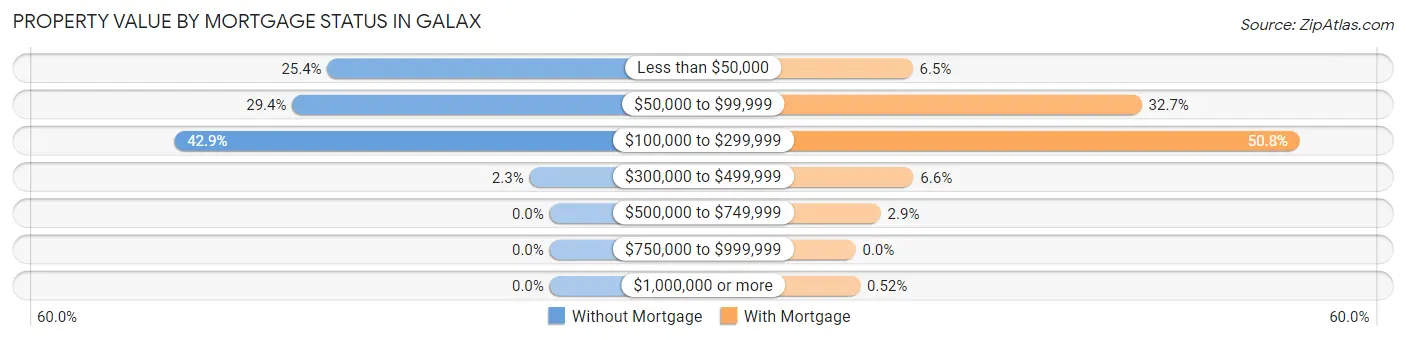
| Property Value | Without Mortgage | With Mortgage |
| Less than $50,000 | 177 (25.4%) | 75 (6.5%) |
| $50,000 to $99,999 | 205 (29.4%) | 376 (32.7%) |
| $100,000 to $299,999 | 299 (42.9%) | 584 (50.8%) |
| $300,000 to $499,999 | 16 (2.3%) | 76 (6.6%) |
| $500,000 to $749,999 | 0 (0.0%) | 33 (2.9%) |
| $750,000 to $999,999 | 0 (0.0%) | 0 (0.0%) |
| $1,000,000 or more | 0 (0.0%) | 6 (0.5%) |
| Total | 697 (100.0%) | 1,150 (100.0%) |
Household Income by Mortgage Status in Galax
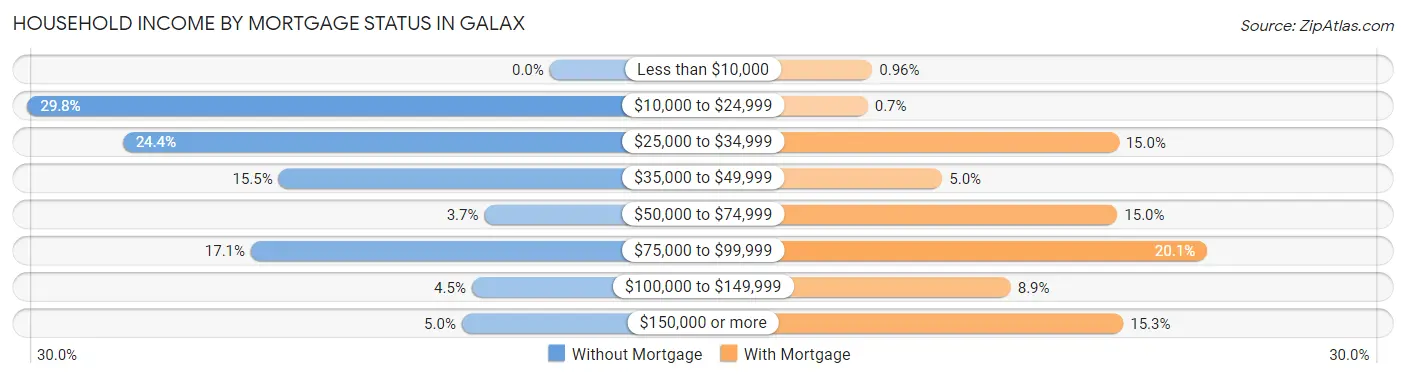
| Household Income | Without Mortgage | With Mortgage |
| Less than $10,000 | 0 (0.0%) | 11 (1.0%) |
| $10,000 to $24,999 | 208 (29.8%) | 8 (0.7%) |
| $25,000 to $34,999 | 170 (24.4%) | 173 (15.0%) |
| $35,000 to $49,999 | 108 (15.5%) | 57 (5.0%) |
| $50,000 to $74,999 | 26 (3.7%) | 172 (15.0%) |
| $75,000 to $99,999 | 119 (17.1%) | 231 (20.1%) |
| $100,000 to $149,999 | 31 (4.4%) | 102 (8.9%) |
| $150,000 or more | 35 (5.0%) | 176 (15.3%) |
| Total | 697 (100.0%) | 1,150 (100.0%) |
Property Value to Household Income Ratio in Galax
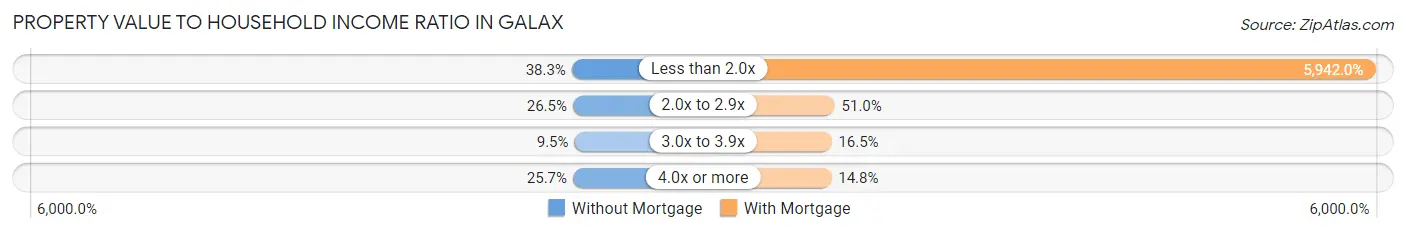
| Value-to-Income Ratio | Without Mortgage | With Mortgage |
| Less than 2.0x | 267 (38.3%) | 68,333 (5,942.0%) |
| 2.0x to 2.9x | 185 (26.5%) | 586 (51.0%) |
| 3.0x to 3.9x | 66 (9.5%) | 190 (16.5%) |
| 4.0x or more | 179 (25.7%) | 170 (14.8%) |
| Total | 697 (100.0%) | 1,150 (100.0%) |
Real Estate Taxes by Mortgage Status in Galax
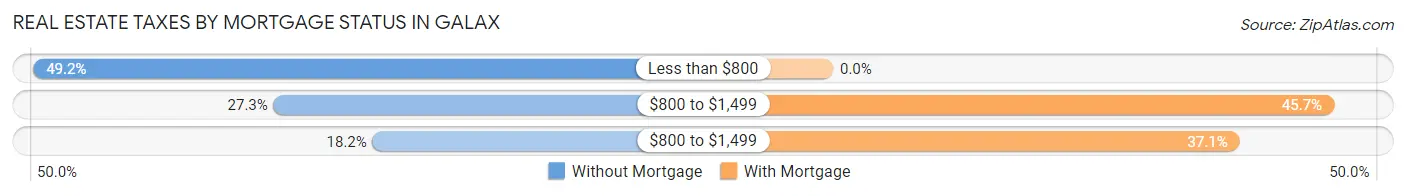
| Property Taxes | Without Mortgage | With Mortgage |
| Less than $800 | 343 (49.2%) | 0 (0.0%) |
| $800 to $1,499 | 190 (27.3%) | 526 (45.7%) |
| $800 to $1,499 | 127 (18.2%) | 427 (37.1%) |
| Total | 697 (100.0%) | 1,150 (100.0%) |
Health & Disability in Galax
Health Insurance Coverage by Age in Galax
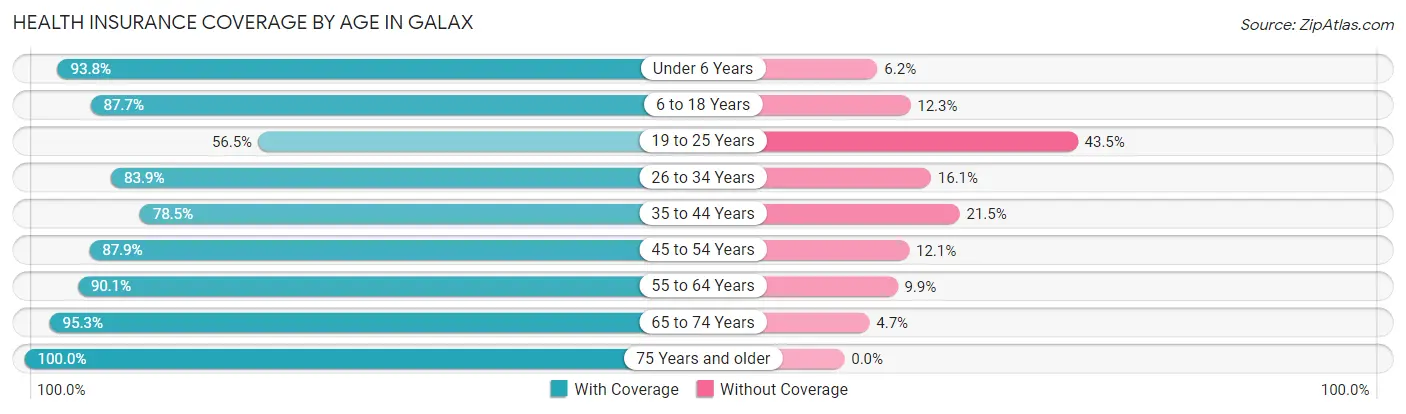
| Age Bracket | With Coverage | Without Coverage |
| Under 6 Years | 502 (93.8%) | 33 (6.2%) |
| 6 to 18 Years | 1,027 (87.7%) | 144 (12.3%) |
| 19 to 25 Years | 370 (56.5%) | 285 (43.5%) |
| 26 to 34 Years | 348 (83.9%) | 67 (16.1%) |
| 35 to 44 Years | 621 (78.5%) | 170 (21.5%) |
| 45 to 54 Years | 721 (87.9%) | 99 (12.1%) |
| 55 to 64 Years | 908 (90.1%) | 100 (9.9%) |
| 65 to 74 Years | 613 (95.3%) | 30 (4.7%) |
| 75 Years and older | 401 (100.0%) | 0 (0.0%) |
| Total | 5,511 (85.6%) | 928 (14.4%) |
Health Insurance Coverage by Citizenship Status in Galax
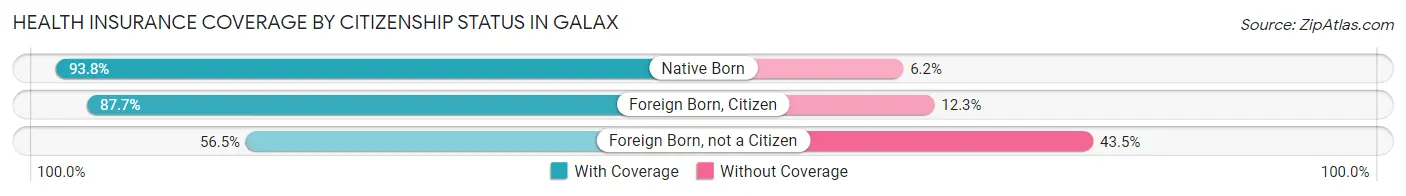
| Citizenship Status | With Coverage | Without Coverage |
| Native Born | 502 (93.8%) | 33 (6.2%) |
| Foreign Born, Citizen | 1,027 (87.7%) | 144 (12.3%) |
| Foreign Born, not a Citizen | 370 (56.5%) | 285 (43.5%) |
Health Insurance Coverage by Household Income in Galax
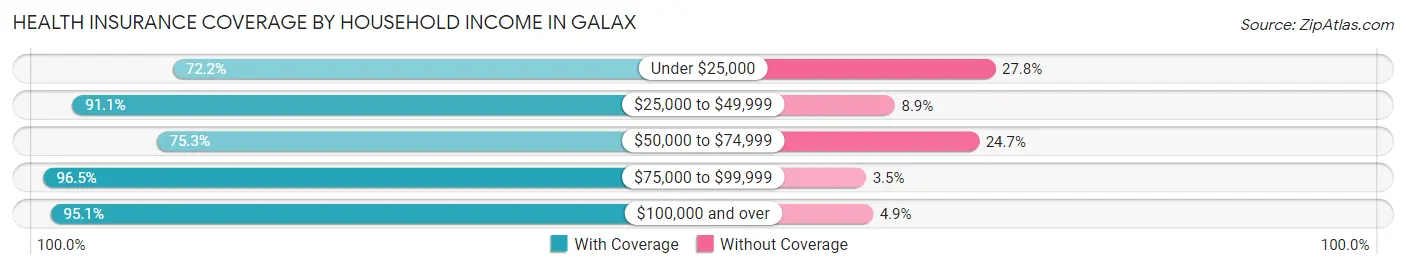
| Household Income | With Coverage | Without Coverage |
| Under $25,000 | 983 (72.2%) | 378 (27.8%) |
| $25,000 to $49,999 | 1,497 (91.1%) | 147 (8.9%) |
| $50,000 to $74,999 | 947 (75.3%) | 311 (24.7%) |
| $75,000 to $99,999 | 681 (96.5%) | 25 (3.5%) |
| $100,000 and over | 1,312 (95.1%) | 67 (4.9%) |
Public vs Private Health Insurance Coverage by Age in Galax
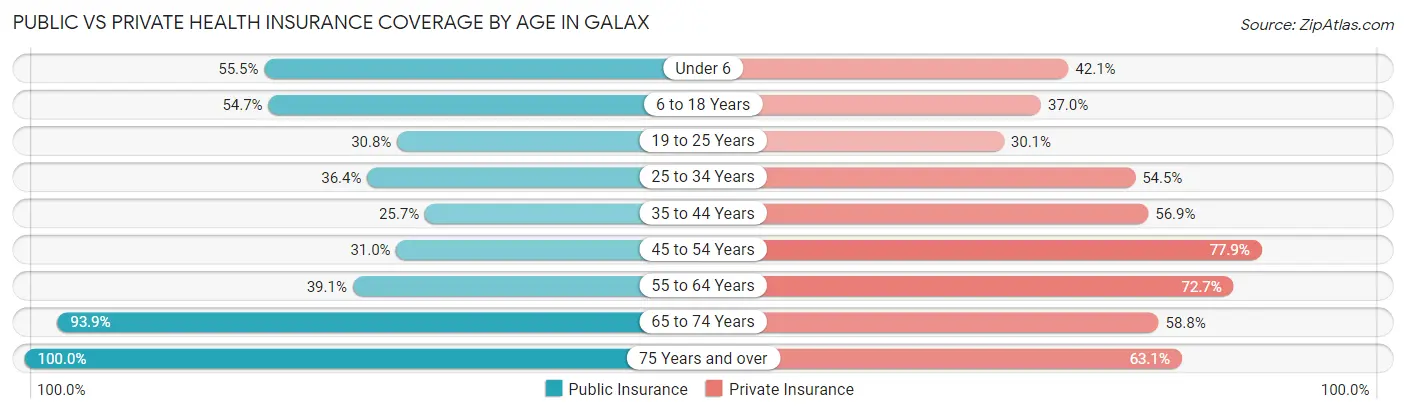
| Age Bracket | Public Insurance | Private Insurance |
| Under 6 | 297 (55.5%) | 225 (42.1%) |
| 6 to 18 Years | 641 (54.7%) | 433 (37.0%) |
| 19 to 25 Years | 202 (30.8%) | 197 (30.1%) |
| 25 to 34 Years | 151 (36.4%) | 226 (54.5%) |
| 35 to 44 Years | 203 (25.7%) | 450 (56.9%) |
| 45 to 54 Years | 254 (31.0%) | 639 (77.9%) |
| 55 to 64 Years | 394 (39.1%) | 733 (72.7%) |
| 65 to 74 Years | 604 (93.9%) | 378 (58.8%) |
| 75 Years and over | 401 (100.0%) | 253 (63.1%) |
| Total | 3,147 (48.9%) | 3,534 (54.9%) |
Disability Status by Sex by Age in Galax
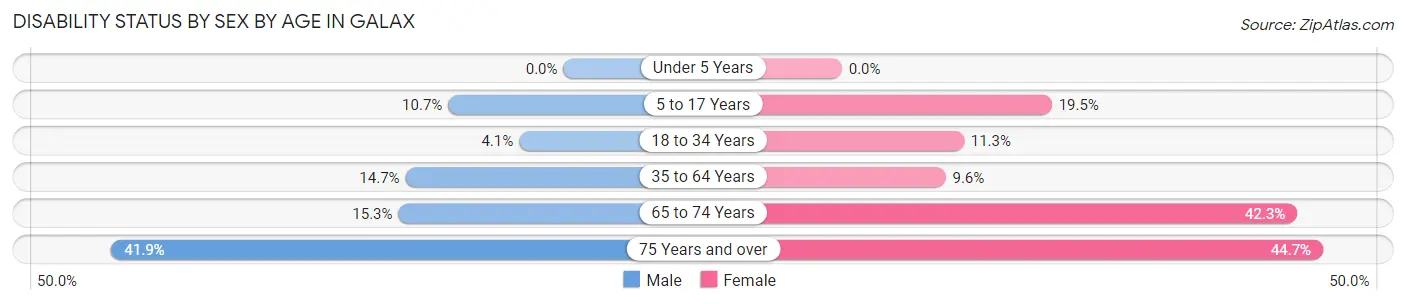
| Age Bracket | Male | Female |
| Under 5 Years | 0 (0.0%) | 0 (0.0%) |
| 5 to 17 Years | 67 (10.7%) | 119 (19.5%) |
| 18 to 34 Years | 16 (4.1%) | 78 (11.3%) |
| 35 to 64 Years | 177 (14.7%) | 136 (9.6%) |
| 65 to 74 Years | 47 (15.3%) | 142 (42.3%) |
| 75 Years and over | 78 (41.9%) | 96 (44.7%) |
Disability Class by Sex by Age in Galax
Disability Class: Hearing Difficulty

| Age Bracket | Male | Female |
| Under 5 Years | 0 (0.0%) | 0 (0.0%) |
| 5 to 17 Years | 0 (0.0%) | 47 (7.7%) |
| 18 to 34 Years | 0 (0.0%) | 0 (0.0%) |
| 35 to 64 Years | 0 (0.0%) | 20 (1.4%) |
| 65 to 74 Years | 32 (10.4%) | 38 (11.3%) |
| 75 Years and over | 29 (15.6%) | 70 (32.6%) |
Disability Class: Vision Difficulty
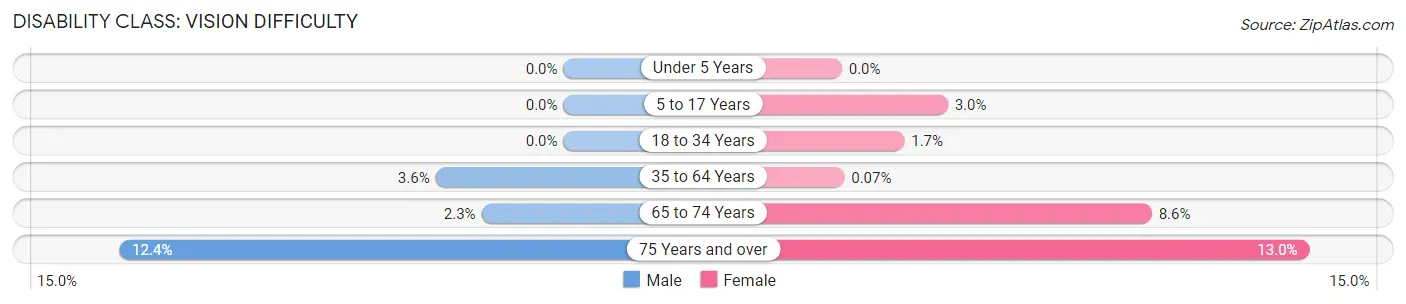
| Age Bracket | Male | Female |
| Under 5 Years | 0 (0.0%) | 0 (0.0%) |
| 5 to 17 Years | 0 (0.0%) | 18 (2.9%) |
| 18 to 34 Years | 0 (0.0%) | 12 (1.7%) |
| 35 to 64 Years | 43 (3.6%) | 1 (0.1%) |
| 65 to 74 Years | 7 (2.3%) | 29 (8.6%) |
| 75 Years and over | 23 (12.4%) | 28 (13.0%) |
Disability Class: Cognitive Difficulty
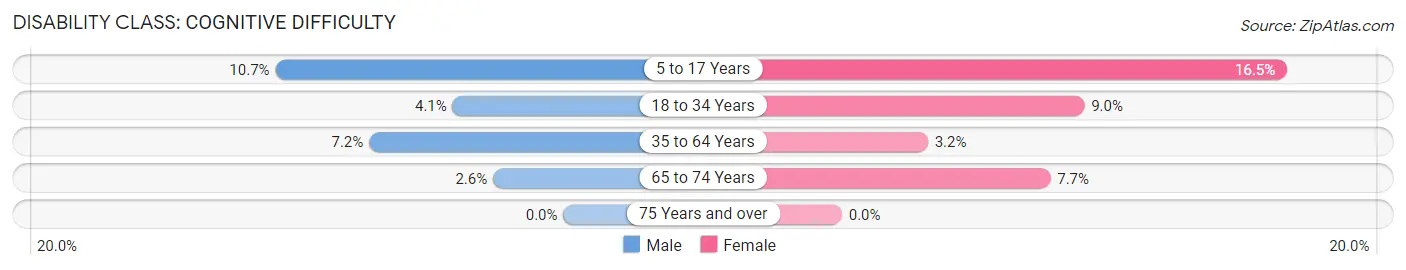
| Age Bracket | Male | Female |
| 5 to 17 Years | 67 (10.7%) | 101 (16.5%) |
| 18 to 34 Years | 16 (4.1%) | 62 (9.0%) |
| 35 to 64 Years | 87 (7.2%) | 45 (3.2%) |
| 65 to 74 Years | 8 (2.6%) | 26 (7.7%) |
| 75 Years and over | 0 (0.0%) | 0 (0.0%) |
Disability Class: Ambulatory Difficulty
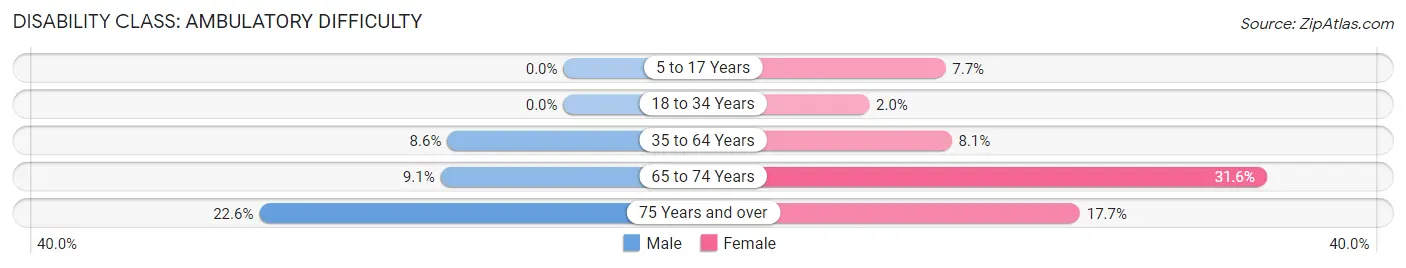
| Age Bracket | Male | Female |
| 5 to 17 Years | 0 (0.0%) | 47 (7.7%) |
| 18 to 34 Years | 0 (0.0%) | 14 (2.0%) |
| 35 to 64 Years | 104 (8.6%) | 115 (8.1%) |
| 65 to 74 Years | 28 (9.1%) | 106 (31.6%) |
| 75 Years and over | 42 (22.6%) | 38 (17.7%) |
Disability Class: Self-Care Difficulty
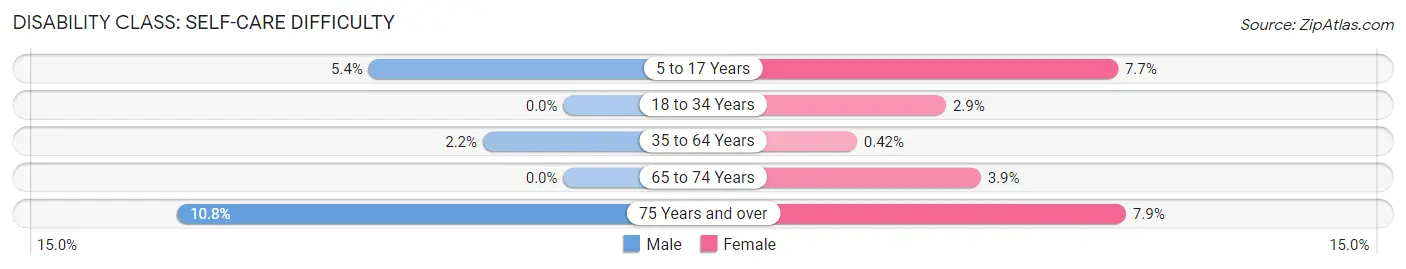
| Age Bracket | Male | Female |
| 5 to 17 Years | 34 (5.4%) | 47 (7.7%) |
| 18 to 34 Years | 0 (0.0%) | 20 (2.9%) |
| 35 to 64 Years | 27 (2.2%) | 6 (0.4%) |
| 65 to 74 Years | 0 (0.0%) | 13 (3.9%) |
| 75 Years and over | 20 (10.7%) | 17 (7.9%) |
Technology Access in Galax
Computing Device Access in Galax
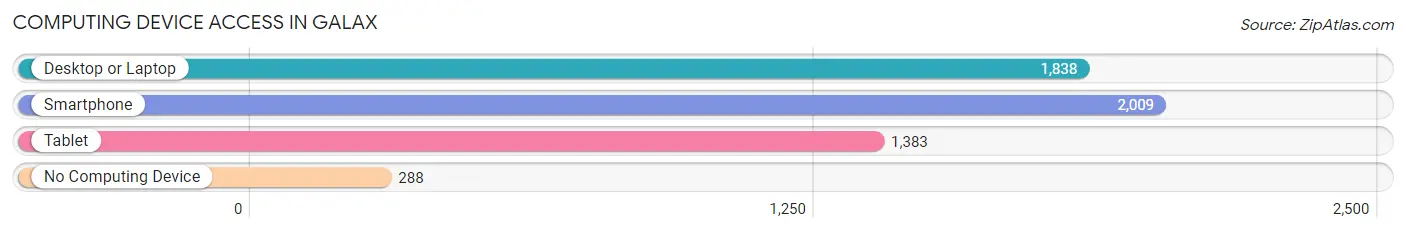
| Device Type | # Households | % Households |
| Desktop or Laptop | 1,838 | 70.2% |
| Smartphone | 2,009 | 76.7% |
| Tablet | 1,383 | 52.8% |
| No Computing Device | 288 | 11.0% |
| Total | 2,618 | 100.0% |
Internet Access in Galax
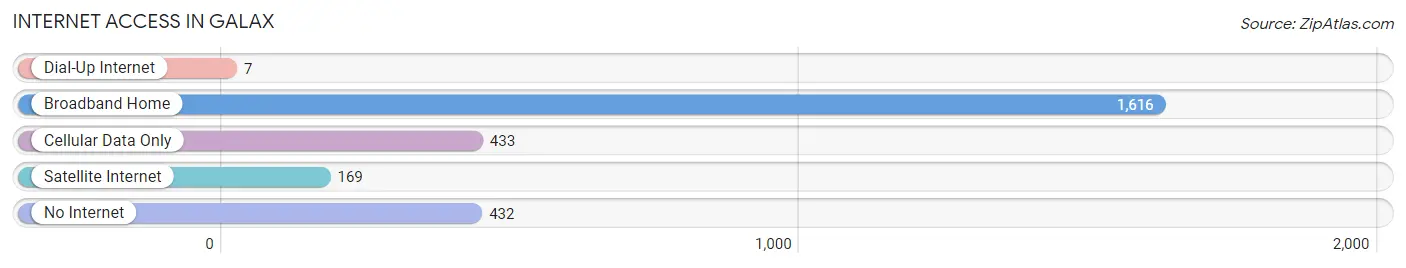
| Internet Type | # Households | % Households |
| Dial-Up Internet | 7 | 0.3% |
| Broadband Home | 1,616 | 61.7% |
| Cellular Data Only | 433 | 16.5% |
| Satellite Internet | 169 | 6.5% |
| No Internet | 432 | 16.5% |
| Total | 2,618 | 100.0% |
Galax Summary
Galax, Virginia is a small city located in the Blue Ridge Mountains of southwestern Virginia. It is the county seat of Grayson County and is part of the larger metropolitan area of Roanoke-Lynchburg. The city has a population of approximately 7,000 people and is known for its rich history, beautiful scenery, and vibrant economy.
History
Galax was first settled in the late 1700s by a group of settlers from North Carolina. The town was originally known as “The Settlement” and was later renamed “Galax” after the nearby Galax Creek. The town was officially incorporated in 1891 and has since grown to become the largest city in Grayson County.
Galax has a long and rich history that is closely tied to the railroad industry. The town was a major stop on the Norfolk and Western Railway, which connected the town to the larger cities of Roanoke and Lynchburg. The railroad was a major source of employment for the town and helped to spur economic growth.
The town was also home to a thriving furniture industry in the early 1900s. The furniture industry was a major source of employment for the town and helped to make Galax a prosperous and vibrant community.
Geography
Galax is located in the Blue Ridge Mountains of southwestern Virginia. The city is situated at the intersection of Interstate 77 and US Highway 58. The city is surrounded by the beautiful Blue Ridge Mountains and is located near the New River and the Appalachian Trail.
The city has a total area of 4.2 square miles and is located at an elevation of 1,890 feet. The climate in Galax is mild and humid with hot summers and cold winters.
Economy
Galax has a vibrant and diverse economy that is driven by a variety of industries. The city is home to a number of manufacturing companies, including furniture, textiles, and automotive parts. The city is also home to a number of retail stores, restaurants, and other businesses.
The city is also home to a number of educational institutions, including a community college and a technical school. The city is also home to a number of healthcare facilities, including a hospital and several medical clinics.
Demographics
As of the 2010 census, the population of Galax was 7,042. The racial makeup of the city was 92.3% White, 4.2% African American, 0.3% Native American, 0.7% Asian, 0.1% Pacific Islander, and 2.4% from other races. The median household income in Galax was $30,945 and the median family income was $37,917.
Galax is a small city with a rich history and a vibrant economy. The city is home to a diverse population and is known for its beautiful scenery and friendly people. The city is a great place to live, work, and raise a family.
Common Questions
What is Per Capita Income in Galax?
Per Capita income in Galax is $29,802.
What is the Median Family Income in Galax?
Median Family Income in Galax is $63,052.
What is the Median Household income in Galax?
Median Household Income in Galax is $44,612.
What is Income or Wage Gap in Galax?
Income or Wage Gap in Galax is 46.1%.
Women in Galax earn 53.9 cents for every dollar earned by a man.
What is Family Income Deficit in Galax?
Family Income Deficit in Galax is $6,494.
Families that are below poverty line in Galax earn $6,494 less on average than the poverty threshold level.
What is Inequality or Gini Index in Galax?
Inequality or Gini Index in Galax is 0.52.
What is the Total Population of Galax?
Total Population of Galax is 6,687.
What is the Total Male Population of Galax?
Total Male Population of Galax is 2,976.
What is the Total Female Population of Galax?
Total Female Population of Galax is 3,711.
What is the Ratio of Males per 100 Females in Galax?
There are 80.19 Males per 100 Females in Galax.
What is the Ratio of Females per 100 Males in Galax?
There are 124.70 Females per 100 Males in Galax.
What is the Median Population Age in Galax?
Median Population Age in Galax is 42.6 Years.
What is the Average Family Size in Galax
Average Family Size in Galax is 3.2 People.
What is the Average Household Size in Galax
Average Household Size in Galax is 2.4 People.
How Large is the Labor Force in Galax?
There are 2,924 People in the Labor Forcein in Galax.
What is the Percentage of People in the Labor Force in Galax?
55.9% of People are in the Labor Force in Galax.
What is the Unemployment Rate in Galax?
Unemployment Rate in Galax is 4.4%.