Franklin, VA Map & Demographics
Franklin Map
Franklin Overview
$29,683
PER CAPITA INCOME
$71,886
AVG FAMILY INCOME
$57,537
AVG HOUSEHOLD INCOME
26.0%
WAGE / INCOME GAP [ % ]
74.0¢/ $1
WAGE / INCOME GAP [ $ ]
$13,154
FAMILY INCOME DEFICIT
0.43
INEQUALITY / GINI INDEX
8,194
TOTAL POPULATION
3,921
MALE POPULATION
4,273
FEMALE POPULATION
91.76
MALES / 100 FEMALES
108.98
FEMALES / 100 MALES
38.8
MEDIAN AGE
3.1
AVG FAMILY SIZE
2.4
AVG HOUSEHOLD SIZE
3,643
LABOR FORCE [ PEOPLE ]
58.1%
PERCENT IN LABOR FORCE
5.3%
UNEMPLOYMENT RATE
Franklin Zip Codes
Franklin Area Codes
Income in Franklin
Income Overview in Franklin
Per Capita Income in Franklin is $29,683, while median incomes of families and households are $71,886 and $57,537 respectively.
| Characteristic | Number | Measure |
| Per Capita Income | 8,194 | $29,683 |
| Median Family Income | 2,139 | $71,886 |
| Mean Family Income | 2,139 | $87,560 |
| Median Household Income | 3,349 | $57,537 |
| Mean Household Income | 3,349 | $70,700 |
| Income Deficit | 2,139 | $13,154 |
| Wage / Income Gap (%) | 8,194 | 25.95% |
| Wage / Income Gap ($) | 8,194 | 74.05¢ per $1 |
| Gini / Inequality Index | 8,194 | 0.43 |
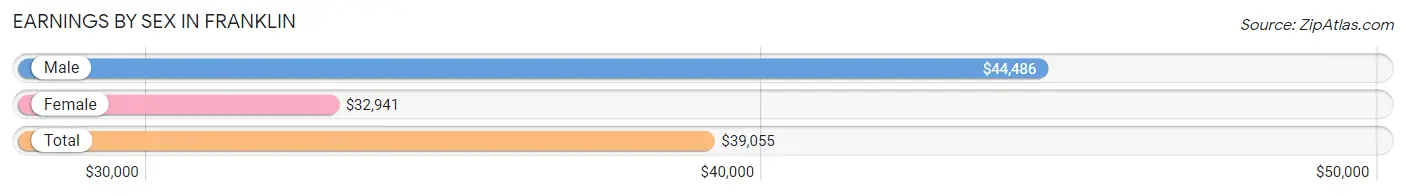
Earnings by Sex in Franklin
Average Earnings in Franklin are $39,055, $44,486 for men and $32,941 for women, a difference of 26.0%.
| Sex | Number | Average Earnings |
| Male | 1,769 (46.4%) | $44,486 |
| Female | 2,048 (53.6%) | $32,941 |
| Total | 3,817 (100.0%) | $39,055 |
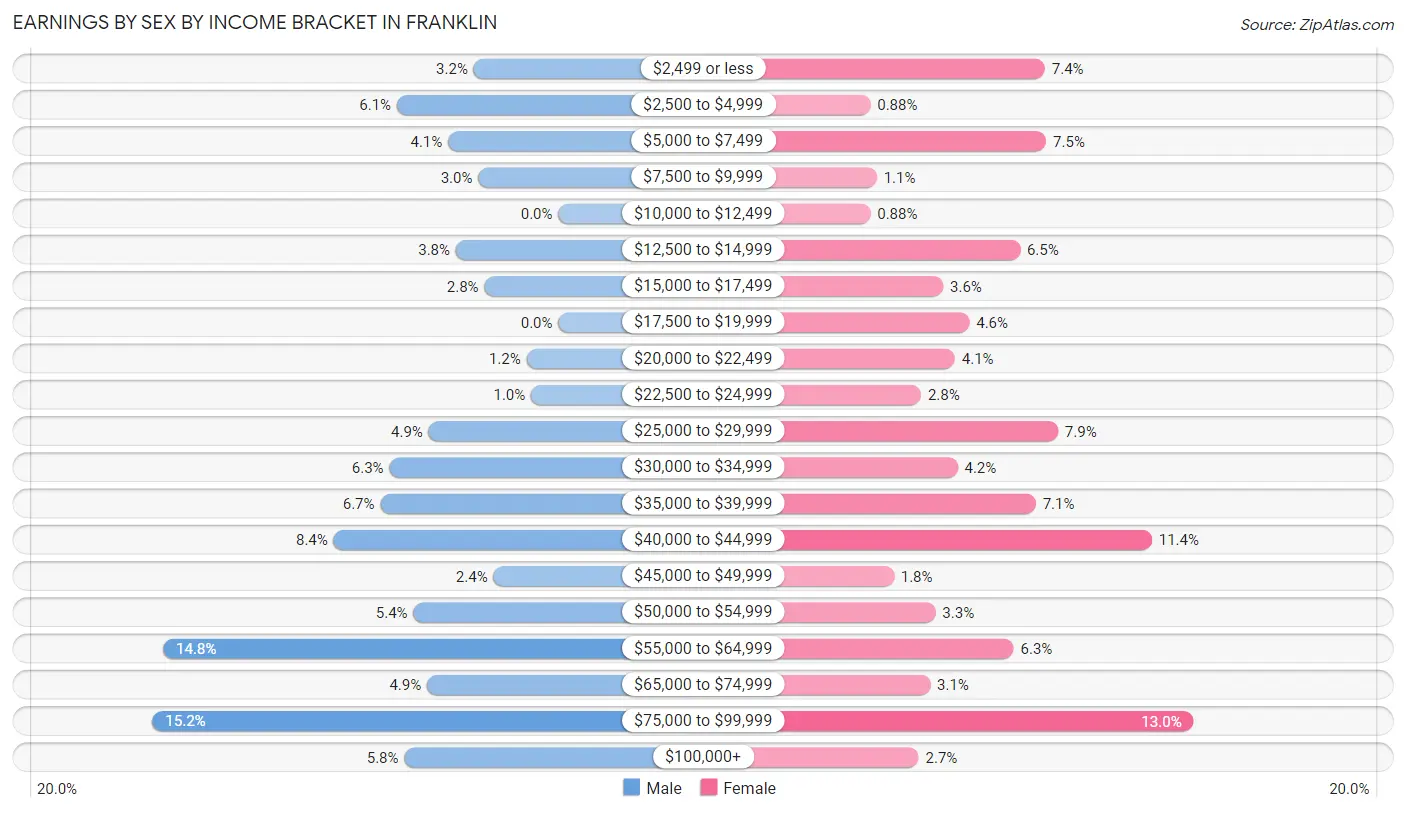
Earnings by Sex by Income Bracket in Franklin
The most common earnings brackets in Franklin are $75,000 to $99,999 for men (269 | 15.2%) and $75,000 to $99,999 for women (266 | 13.0%).
| Income | Male | Female |
| $2,499 or less | 56 (3.2%) | 152 (7.4%) |
| $2,500 to $4,999 | 107 (6.0%) | 18 (0.9%) |
| $5,000 to $7,499 | 73 (4.1%) | 153 (7.5%) |
| $7,500 to $9,999 | 53 (3.0%) | 23 (1.1%) |
| $10,000 to $12,499 | 0 (0.0%) | 18 (0.9%) |
| $12,500 to $14,999 | 68 (3.8%) | 133 (6.5%) |
| $15,000 to $17,499 | 49 (2.8%) | 74 (3.6%) |
| $17,500 to $19,999 | 0 (0.0%) | 94 (4.6%) |
| $20,000 to $22,499 | 21 (1.2%) | 83 (4.1%) |
| $22,500 to $24,999 | 18 (1.0%) | 57 (2.8%) |
| $25,000 to $29,999 | 86 (4.9%) | 162 (7.9%) |
| $30,000 to $34,999 | 112 (6.3%) | 85 (4.2%) |
| $35,000 to $39,999 | 118 (6.7%) | 145 (7.1%) |
| $40,000 to $44,999 | 149 (8.4%) | 234 (11.4%) |
| $45,000 to $49,999 | 43 (2.4%) | 36 (1.8%) |
| $50,000 to $54,999 | 96 (5.4%) | 68 (3.3%) |
| $55,000 to $64,999 | 262 (14.8%) | 128 (6.2%) |
| $65,000 to $74,999 | 87 (4.9%) | 64 (3.1%) |
| $75,000 to $99,999 | 269 (15.2%) | 266 (13.0%) |
| $100,000+ | 102 (5.8%) | 55 (2.7%) |
| Total | 1,769 (100.0%) | 2,048 (100.0%) |
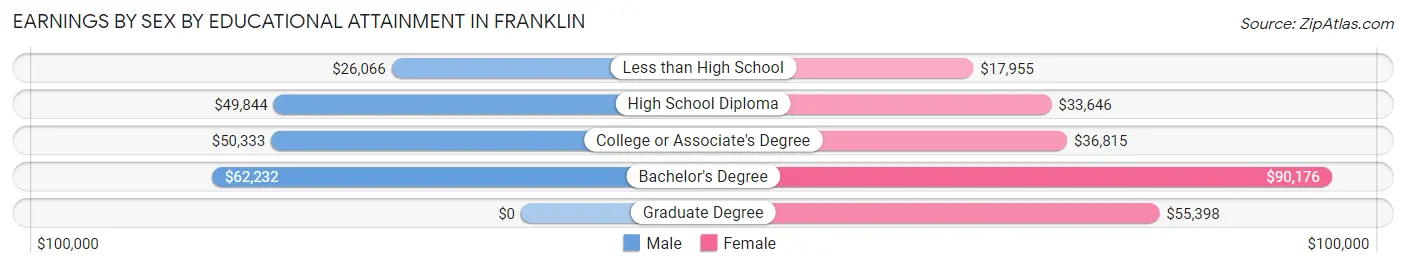
Earnings by Sex by Educational Attainment in Franklin
Average earnings in Franklin are $49,891 for men and $38,338 for women, a difference of 23.2%. Men with an educational attainment of bachelor's degree enjoy the highest average annual earnings of $62,232, while those with less than high school education earn the least with $26,066. Women with an educational attainment of bachelor's degree earn the most with the average annual earnings of $90,176, while those with less than high school education have the smallest earnings of $17,955.
| Educational Attainment | Male Income | Female Income |
| Less than High School | $26,066 | $17,955 |
| High School Diploma | $49,844 | $33,646 |
| College or Associate's Degree | $50,333 | $36,815 |
| Bachelor's Degree | $62,232 | $90,176 |
| Graduate Degree | - | - |
| Total | $49,891 | $38,338 |
Family Income in Franklin
Family Income Brackets in Franklin
According to the Franklin family income data, there are 488 families falling into the $100,000 to $149,999 income range, which is the most common income bracket and makes up 22.8% of all families. Conversely, the $15,000 to $24,999 income bracket is the least frequent group with only 21 families (1.0%) belonging to this category.
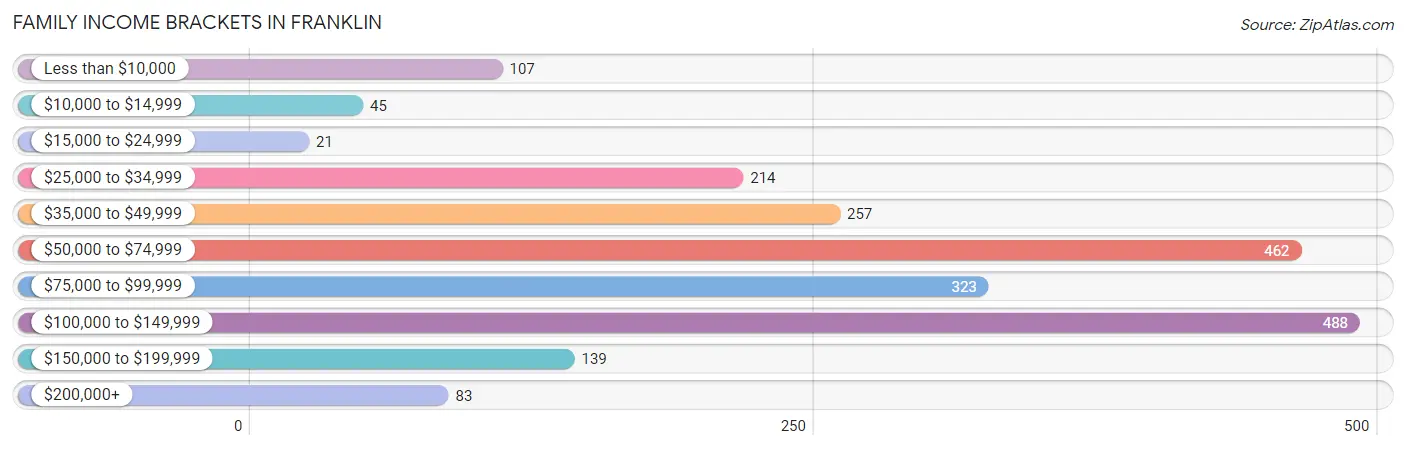
| Income Bracket | # Families | % Families |
| Less than $10,000 | 107 | 5.0% |
| $10,000 to $14,999 | 45 | 2.1% |
| $15,000 to $24,999 | 21 | 1.0% |
| $25,000 to $34,999 | 214 | 10.0% |
| $35,000 to $49,999 | 257 | 12.0% |
| $50,000 to $74,999 | 462 | 21.6% |
| $75,000 to $99,999 | 323 | 15.1% |
| $100,000 to $149,999 | 488 | 22.8% |
| $150,000 to $199,999 | 139 | 6.5% |
| $200,000+ | 83 | 3.9% |
Family Income by Famaliy Size in Franklin
4-person families (334 | 15.6%) account for the highest median family income in Franklin with $116,528 per family, while 2-person families (1,010 | 47.2%) have the highest median income of $35,766 per family member.
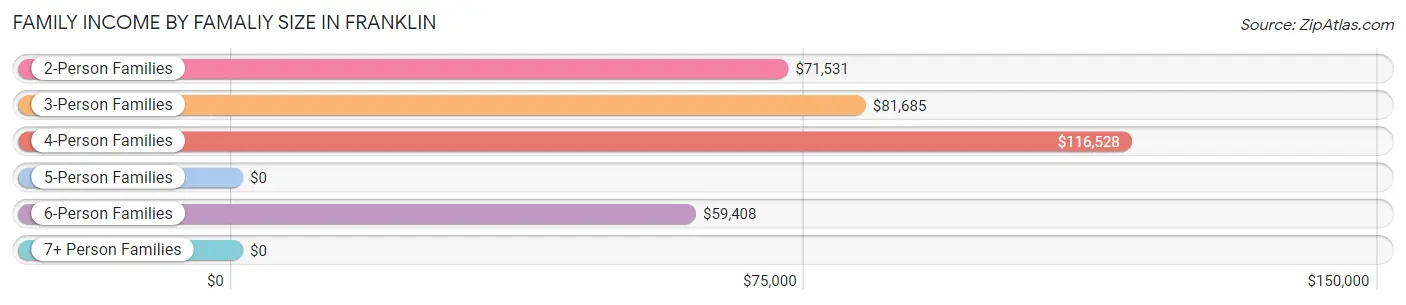
| Income Bracket | # Families | Median Income |
| 2-Person Families | 1,010 (47.2%) | $71,531 |
| 3-Person Families | 369 (17.2%) | $81,685 |
| 4-Person Families | 334 (15.6%) | $116,528 |
| 5-Person Families | 272 (12.7%) | $0 |
| 6-Person Families | 116 (5.4%) | $59,408 |
| 7+ Person Families | 38 (1.8%) | $0 |
| Total | 2,139 (100.0%) | $71,886 |
Family Income by Number of Earners in Franklin
The median family income in Franklin is $71,886, with families comprising 3+ earners (233) having the highest median family income of $139,083, while families with no earners (446) have the lowest median family income of $39,500, accounting for 10.9% and 20.8% of families, respectively.
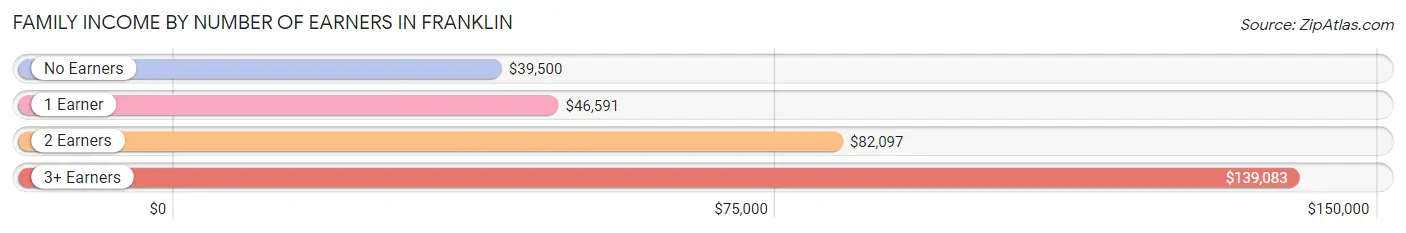
| Number of Earners | # Families | Median Income |
| No Earners | 446 (20.8%) | $39,500 |
| 1 Earner | 604 (28.2%) | $46,591 |
| 2 Earners | 856 (40.0%) | $82,097 |
| 3+ Earners | 233 (10.9%) | $139,083 |
| Total | 2,139 (100.0%) | $71,886 |
Household Income in Franklin
Household Income Brackets in Franklin
With 737 households falling in the category, the $50,000 to $74,999 income range is the most frequent in Franklin, accounting for 22.0% of all households. In contrast, only 84 households (2.5%) fall into the $200,000+ income bracket, making it the least populous group.
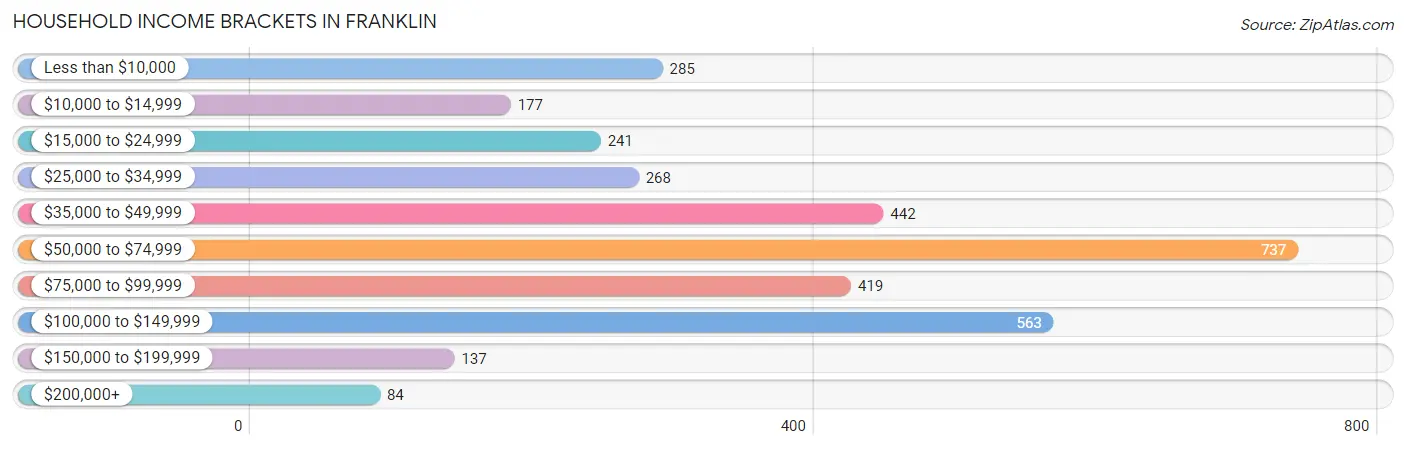
| Income Bracket | # Households | % Households |
| Less than $10,000 | 285 | 8.5% |
| $10,000 to $14,999 | 177 | 5.3% |
| $15,000 to $24,999 | 241 | 7.2% |
| $25,000 to $34,999 | 268 | 8.0% |
| $35,000 to $49,999 | 442 | 13.2% |
| $50,000 to $74,999 | 737 | 22.0% |
| $75,000 to $99,999 | 419 | 12.5% |
| $100,000 to $149,999 | 563 | 16.8% |
| $150,000 to $199,999 | 137 | 4.1% |
| $200,000+ | 84 | 2.5% |
Household Income by Householder Age in Franklin
The median household income in Franklin is $57,537, with the highest median household income of $59,715 found in the 45 to 64 years age bracket for the primary householder. A total of 1,331 households (39.7%) fall into this category. Meanwhile, the 15 to 24 years age bracket for the primary householder has the lowest median household income of $0, with 11 households (0.3%) in this group.
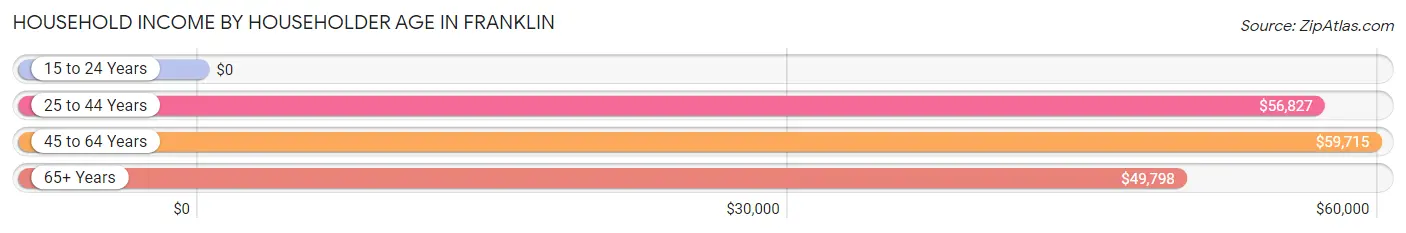
| Income Bracket | # Households | Median Income |
| 15 to 24 Years | 11 (0.3%) | $0 |
| 25 to 44 Years | 1,041 (31.1%) | $56,827 |
| 45 to 64 Years | 1,331 (39.7%) | $59,715 |
| 65+ Years | 966 (28.8%) | $49,798 |
| Total | 3,349 (100.0%) | $57,537 |
Poverty in Franklin
Income Below Poverty by Sex and Age in Franklin
With 17.4% poverty level for males and 20.0% for females among the residents of Franklin, 5 year old males and 5 year old females are the most vulnerable to poverty, with 66 males (63.5%) and 25 females (69.4%) in their respective age groups living below the poverty level.
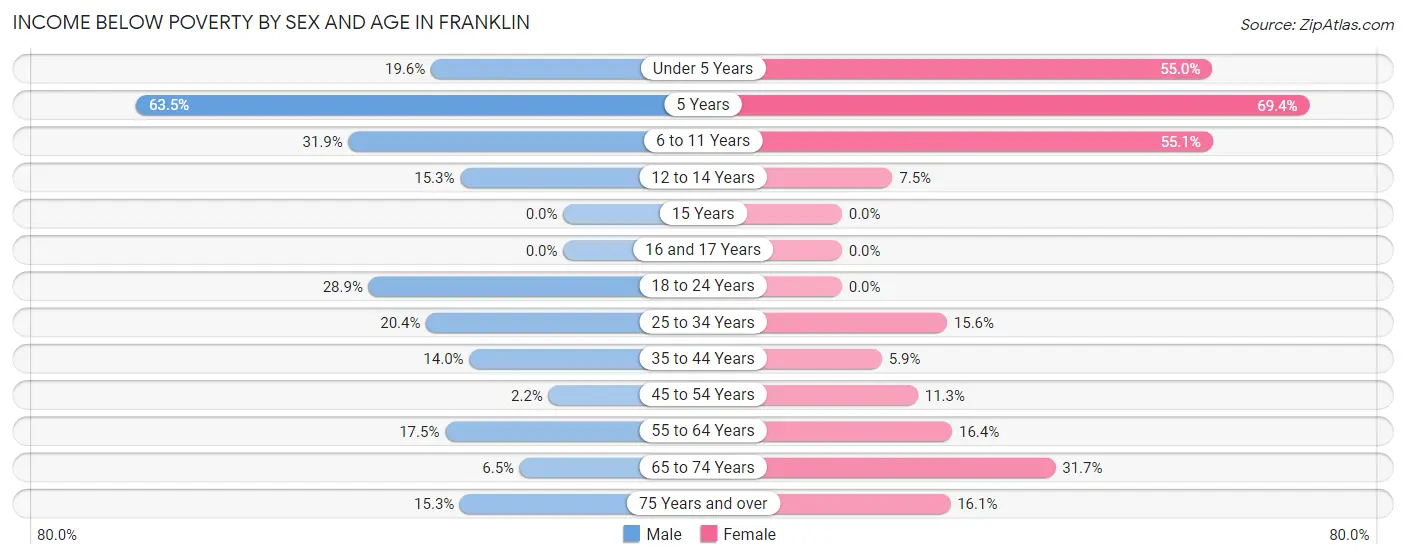
| Age Bracket | Male | Female |
| Under 5 Years | 88 (19.6%) | 88 (55.0%) |
| 5 Years | 66 (63.5%) | 25 (69.4%) |
| 6 to 11 Years | 96 (31.9%) | 190 (55.1%) |
| 12 to 14 Years | 28 (15.3%) | 9 (7.5%) |
| 15 Years | 0 (0.0%) | 0 (0.0%) |
| 16 and 17 Years | 0 (0.0%) | 0 (0.0%) |
| 18 to 24 Years | 76 (28.9%) | 0 (0.0%) |
| 25 to 34 Years | 105 (20.3%) | 115 (15.6%) |
| 35 to 44 Years | 53 (14.0%) | 28 (5.9%) |
| 45 to 54 Years | 8 (2.2%) | 51 (11.3%) |
| 55 to 64 Years | 87 (17.5%) | 112 (16.4%) |
| 65 to 74 Years | 16 (6.5%) | 155 (31.7%) |
| 75 Years and over | 53 (15.3%) | 57 (16.1%) |
| Total | 676 (17.4%) | 830 (20.0%) |
Income Above Poverty by Sex and Age in Franklin
According to the poverty statistics in Franklin, males aged 15 years and females aged 15 years are the age groups that are most secure financially, with 100.0% of males and 100.0% of females in these age groups living above the poverty line.
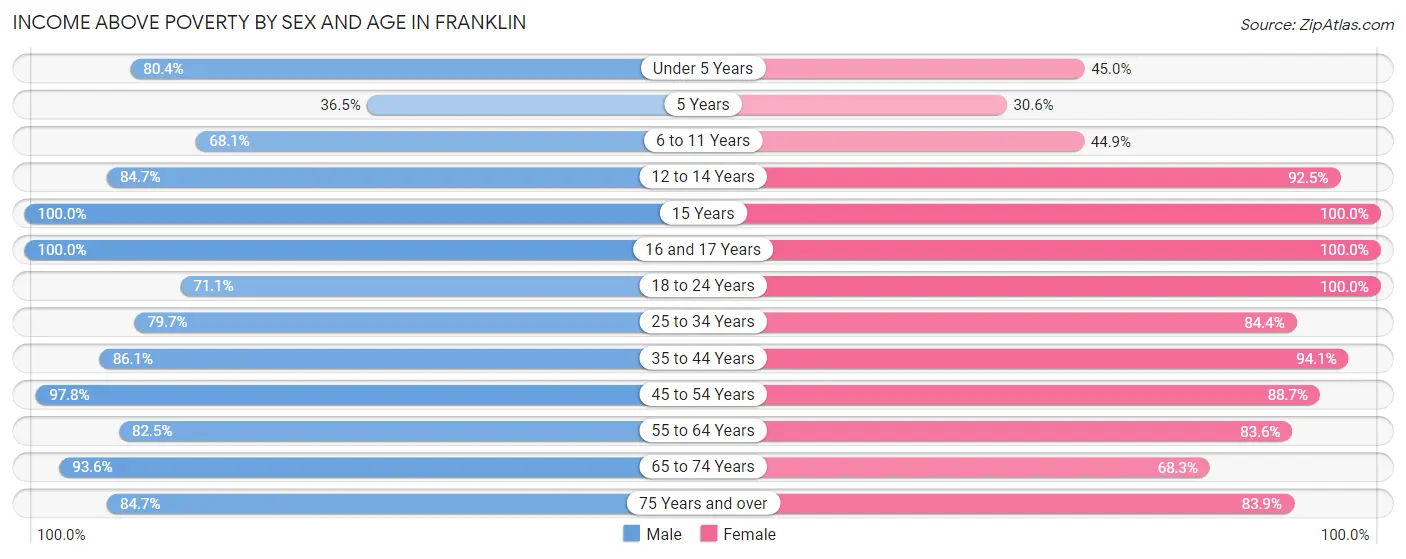
| Age Bracket | Male | Female |
| Under 5 Years | 360 (80.4%) | 72 (45.0%) |
| 5 Years | 38 (36.5%) | 11 (30.6%) |
| 6 to 11 Years | 205 (68.1%) | 155 (44.9%) |
| 12 to 14 Years | 155 (84.7%) | 111 (92.5%) |
| 15 Years | 127 (100.0%) | 59 (100.0%) |
| 16 and 17 Years | 104 (100.0%) | 77 (100.0%) |
| 18 to 24 Years | 187 (71.1%) | 167 (100.0%) |
| 25 to 34 Years | 411 (79.6%) | 622 (84.4%) |
| 35 to 44 Years | 327 (86.1%) | 443 (94.1%) |
| 45 to 54 Years | 359 (97.8%) | 401 (88.7%) |
| 55 to 64 Years | 409 (82.5%) | 572 (83.6%) |
| 65 to 74 Years | 232 (93.5%) | 334 (68.3%) |
| 75 Years and over | 293 (84.7%) | 297 (83.9%) |
| Total | 3,207 (82.6%) | 3,321 (80.0%) |
Income Below Poverty Among Married-Couple Families in Franklin
The poverty statistics for married-couple families in Franklin show that 4.8% or 67 of the total 1,384 families live below the poverty line. Families with 5 or more children have the highest poverty rate of 100.0%, comprising of 21 families. On the other hand, families with 3 or 4 children have the lowest poverty rate of 0.0%, which includes 0 families.
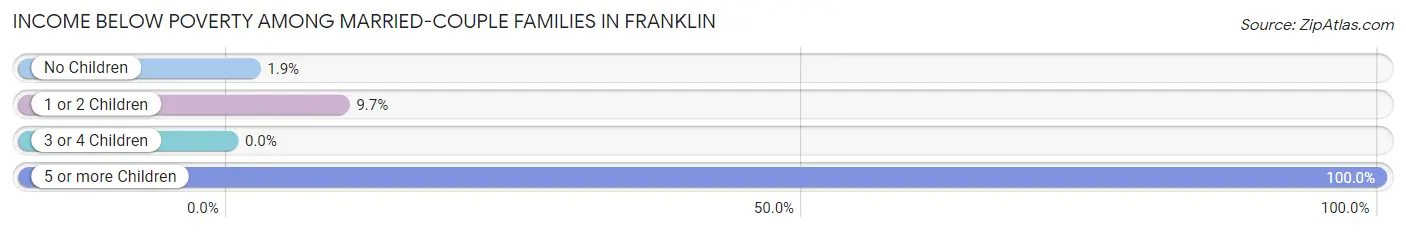
| Children | Above Poverty | Below Poverty |
| No Children | 708 (98.1%) | 14 (1.9%) |
| 1 or 2 Children | 298 (90.3%) | 32 (9.7%) |
| 3 or 4 Children | 311 (100.0%) | 0 (0.0%) |
| 5 or more Children | 0 (0.0%) | 21 (100.0%) |
| Total | 1,317 (95.2%) | 67 (4.8%) |
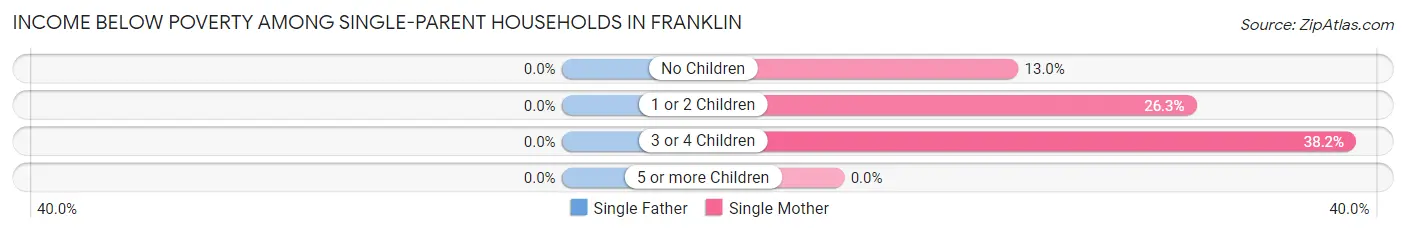
Income Below Poverty Among Single-Parent Households in Franklin
| Children | Single Father | Single Mother |
| No Children | 0 (0.0%) | 42 (13.0%) |
| 1 or 2 Children | 0 (0.0%) | 62 (26.3%) |
| 3 or 4 Children | 0 (0.0%) | 29 (38.2%) |
| 5 or more Children | 0 (0.0%) | 0 (0.0%) |
| Total | 0 (0.0%) | 133 (20.4%) |
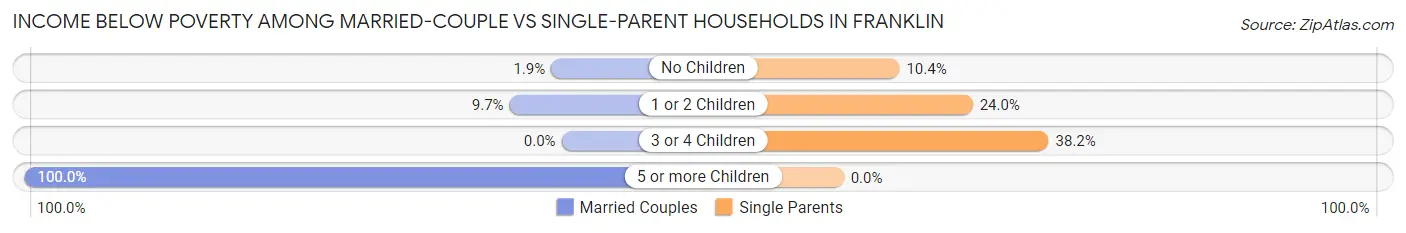
Income Below Poverty Among Married-Couple vs Single-Parent Households in Franklin
The poverty data for Franklin shows that 67 of the married-couple family households (4.8%) and 133 of the single-parent households (17.6%) are living below the poverty level. Within the married-couple family households, those with 5 or more children have the highest poverty rate, with 21 households (100.0%) falling below the poverty line. Among the single-parent households, those with 3 or 4 children have the highest poverty rate, with 29 household (38.2%) living below poverty.
| Children | Married-Couple Families | Single-Parent Households |
| No Children | 14 (1.9%) | 42 (10.4%) |
| 1 or 2 Children | 32 (9.7%) | 62 (24.0%) |
| 3 or 4 Children | 0 (0.0%) | 29 (38.2%) |
| 5 or more Children | 21 (100.0%) | 0 (0.0%) |
| Total | 67 (4.8%) | 133 (17.6%) |
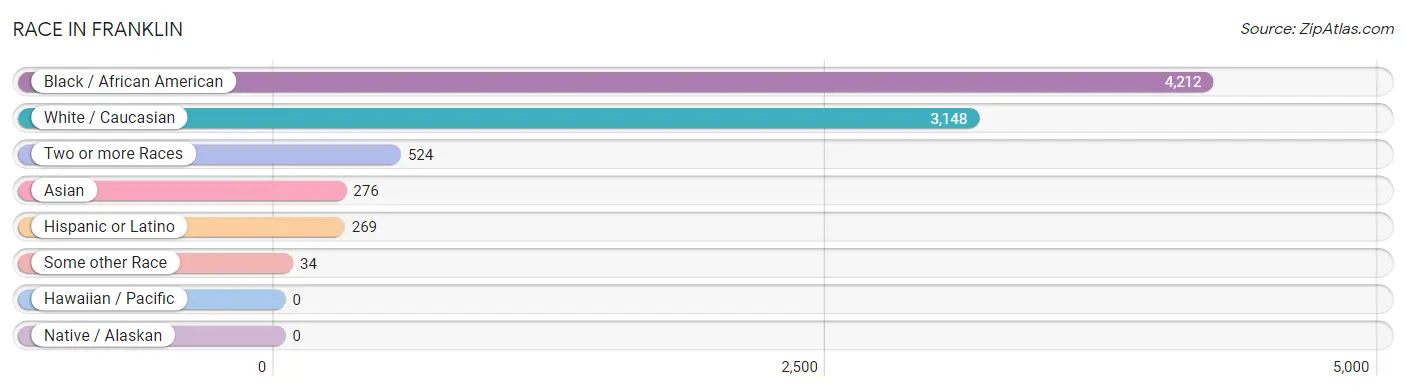
Race in Franklin
The most populous races in Franklin are Black / African American (4,212 | 51.4%), White / Caucasian (3,148 | 38.4%), and Two or more Races (524 | 6.4%).
| Race | # Population | % Population |
| Asian | 276 | 3.4% |
| Black / African American | 4,212 | 51.4% |
| Hawaiian / Pacific | 0 | 0.0% |
| Hispanic or Latino | 269 | 3.3% |
| Native / Alaskan | 0 | 0.0% |
| White / Caucasian | 3,148 | 38.4% |
| Two or more Races | 524 | 6.4% |
| Some other Race | 34 | 0.4% |
| Total | 8,194 | 100.0% |
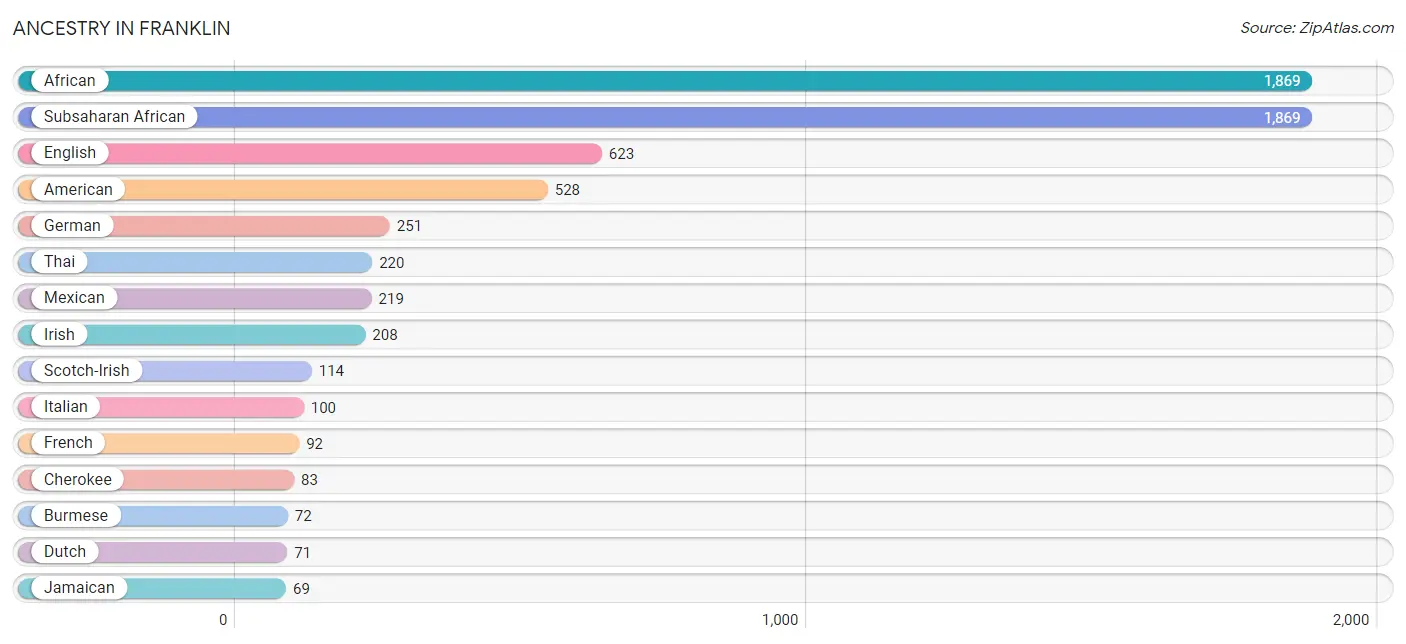
Ancestry in Franklin
The most populous ancestries reported in Franklin are African (1,869 | 22.8%), Subsaharan African (1,869 | 22.8%), English (623 | 7.6%), American (528 | 6.4%), and German (251 | 3.1%), together accounting for 62.7% of all Franklin residents.
| Ancestry | # Population | % Population |
| African | 1,869 | 22.8% |
| American | 528 | 6.4% |
| Armenian | 5 | 0.1% |
| Burmese | 72 | 0.9% |
| Central American | 16 | 0.2% |
| Cherokee | 83 | 1.0% |
| Choctaw | 37 | 0.4% |
| Dutch | 71 | 0.9% |
| English | 623 | 7.6% |
| European | 33 | 0.4% |
| French | 92 | 1.1% |
| German | 251 | 3.1% |
| Irish | 208 | 2.5% |
| Italian | 100 | 1.2% |
| Jamaican | 69 | 0.8% |
| Korean | 18 | 0.2% |
| Lithuanian | 9 | 0.1% |
| Lumbee | 54 | 0.7% |
| Mexican | 219 | 2.7% |
| Salvadoran | 16 | 0.2% |
| Scotch-Irish | 114 | 1.4% |
| Scottish | 54 | 0.7% |
| Spanish | 34 | 0.4% |
| Subsaharan African | 1,869 | 22.8% |
| Swiss | 25 | 0.3% |
| Thai | 220 | 2.7% |
| Ukrainian | 14 | 0.2% |
| Vietnamese | 3 | 0.0% |
| Welsh | 25 | 0.3% | View All 29 Rows |
Immigrants in Franklin
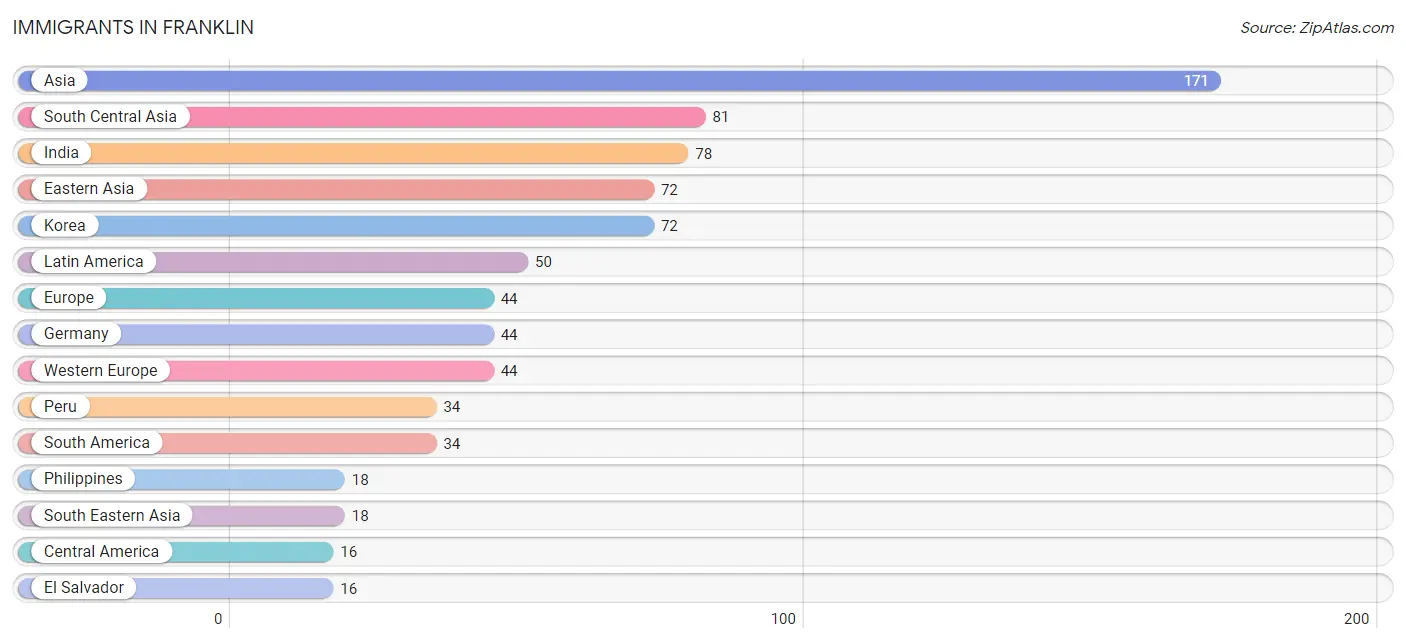
The most numerous immigrant groups reported in Franklin came from Asia (171 | 2.1%), South Central Asia (81 | 1.0%), India (78 | 0.9%), Eastern Asia (72 | 0.9%), and Korea (72 | 0.9%), together accounting for 5.8% of all Franklin residents.
| Immigration Origin | # Population | % Population |
| Asia | 171 | 2.1% |
| Bangladesh | 3 | 0.0% |
| Central America | 16 | 0.2% |
| Eastern Asia | 72 | 0.9% |
| El Salvador | 16 | 0.2% |
| Europe | 44 | 0.5% |
| Germany | 44 | 0.5% |
| India | 78 | 0.9% |
| Korea | 72 | 0.9% |
| Latin America | 50 | 0.6% |
| Peru | 34 | 0.4% |
| Philippines | 18 | 0.2% |
| South America | 34 | 0.4% |
| South Central Asia | 81 | 1.0% |
| South Eastern Asia | 18 | 0.2% |
| Western Europe | 44 | 0.5% | View All 16 Rows |
Sex and Age in Franklin
Sex and Age in Franklin
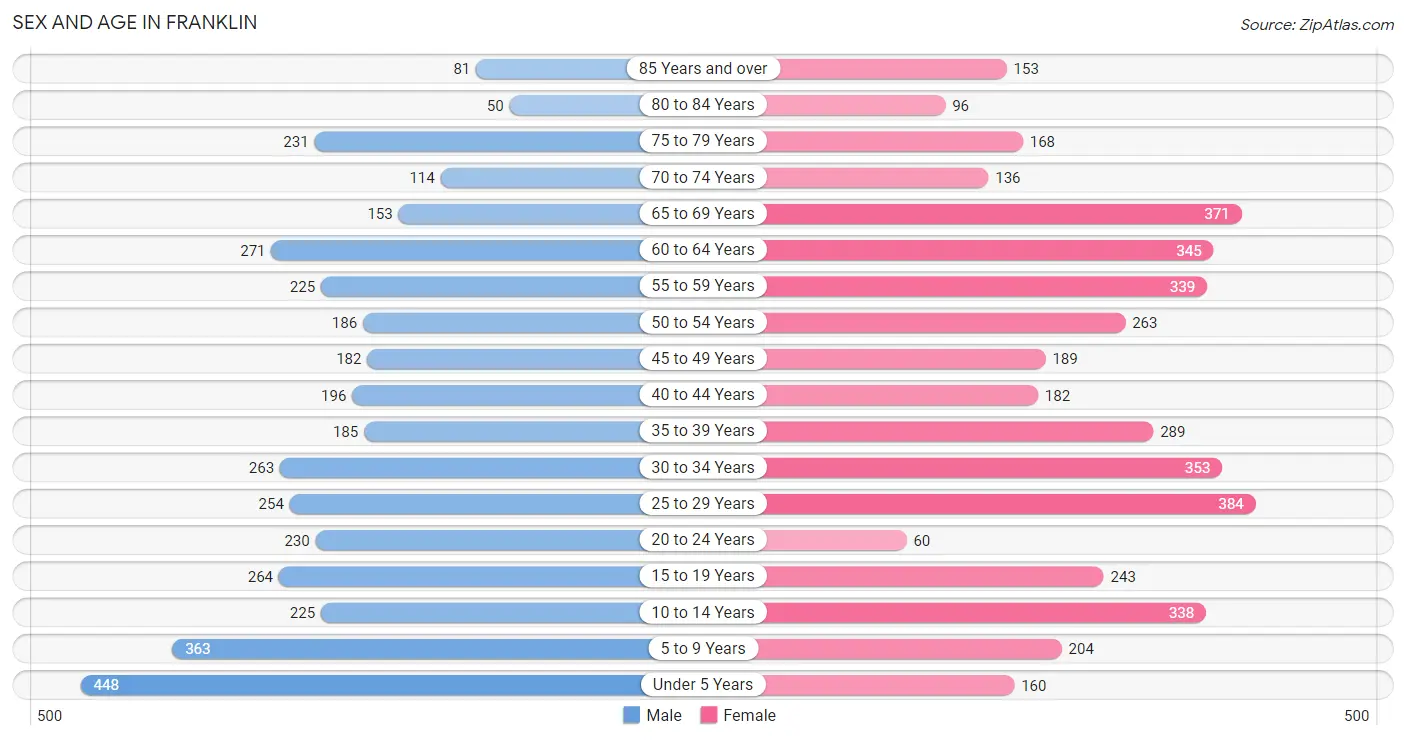
The most populous age groups in Franklin are Under 5 Years (448 | 11.4%) for men and 25 to 29 Years (384 | 9.0%) for women.
| Age Bracket | Male | Female |
| Under 5 Years | 448 (11.4%) | 160 (3.7%) |
| 5 to 9 Years | 363 (9.3%) | 204 (4.8%) |
| 10 to 14 Years | 225 (5.7%) | 338 (7.9%) |
| 15 to 19 Years | 264 (6.7%) | 243 (5.7%) |
| 20 to 24 Years | 230 (5.9%) | 60 (1.4%) |
| 25 to 29 Years | 254 (6.5%) | 384 (9.0%) |
| 30 to 34 Years | 263 (6.7%) | 353 (8.3%) |
| 35 to 39 Years | 185 (4.7%) | 289 (6.8%) |
| 40 to 44 Years | 196 (5.0%) | 182 (4.3%) |
| 45 to 49 Years | 182 (4.6%) | 189 (4.4%) |
| 50 to 54 Years | 186 (4.7%) | 263 (6.1%) |
| 55 to 59 Years | 225 (5.7%) | 339 (7.9%) |
| 60 to 64 Years | 271 (6.9%) | 345 (8.1%) |
| 65 to 69 Years | 153 (3.9%) | 371 (8.7%) |
| 70 to 74 Years | 114 (2.9%) | 136 (3.2%) |
| 75 to 79 Years | 231 (5.9%) | 168 (3.9%) |
| 80 to 84 Years | 50 (1.3%) | 96 (2.2%) |
| 85 Years and over | 81 (2.1%) | 153 (3.6%) |
| Total | 3,921 (100.0%) | 4,273 (100.0%) |
Families and Households in Franklin
Median Family Size in Franklin
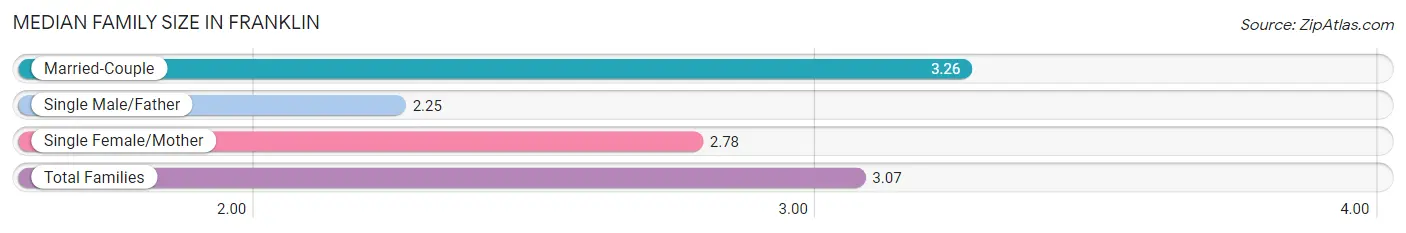
The median family size in Franklin is 3.07 persons per family, with married-couple families (1,384 | 64.7%) accounting for the largest median family size of 3.26 persons per family. On the other hand, single male/father families (102 | 4.8%) represent the smallest median family size with 2.25 persons per family.
| Family Type | # Families | Family Size |
| Married-Couple | 1,384 (64.7%) | 3.26 |
| Single Male/Father | 102 (4.8%) | 2.25 |
| Single Female/Mother | 653 (30.5%) | 2.78 |
| Total Families | 2,139 (100.0%) | 3.07 |
Median Household Size in Franklin
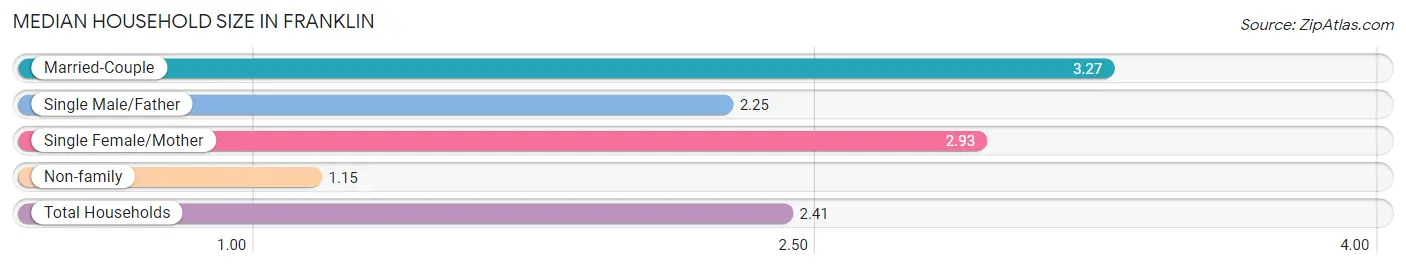
The median household size in Franklin is 2.41 persons per household, with married-couple households (1,384 | 41.3%) accounting for the largest median household size of 3.27 persons per household. non-family households (1,210 | 36.1%) represent the smallest median household size with 1.15 persons per household.
| Household Type | # Households | Household Size |
| Married-Couple | 1,384 (41.3%) | 3.27 |
| Single Male/Father | 102 (3.0%) | 2.25 |
| Single Female/Mother | 653 (19.5%) | 2.93 |
| Non-family | 1,210 (36.1%) | 1.15 |
| Total Households | 3,349 (100.0%) | 2.41 |
Household Size by Marriage Status in Franklin
Out of a total of 3,349 households in Franklin, 2,139 (63.9%) are family households, while 1,210 (36.1%) are nonfamily households. The most numerous type of family households are 2-person households, comprising 1,010, and the most common type of nonfamily households are 1-person households, comprising 1,103.
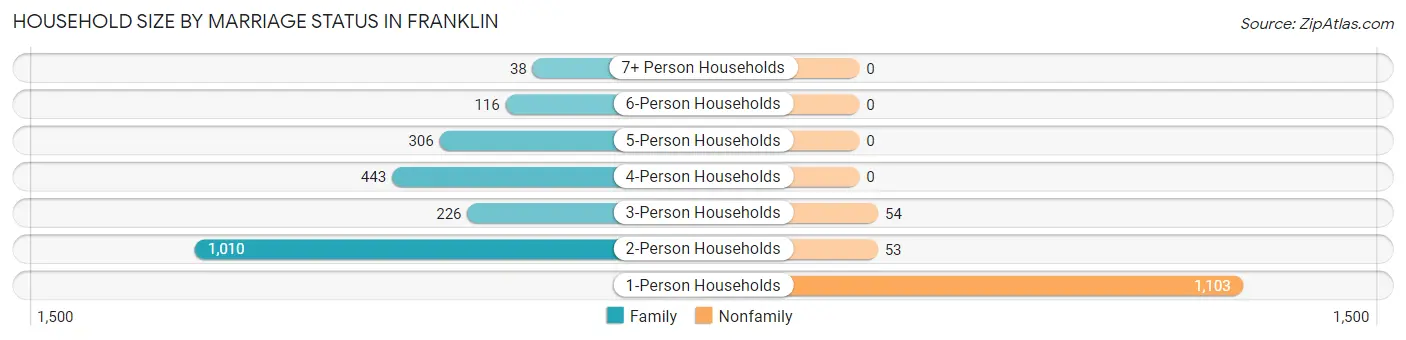
| Household Size | Family Households | Nonfamily Households |
| 1-Person Households | - | 1,103 (32.9%) |
| 2-Person Households | 1,010 (30.2%) | 53 (1.6%) |
| 3-Person Households | 226 (6.8%) | 54 (1.6%) |
| 4-Person Households | 443 (13.2%) | 0 (0.0%) |
| 5-Person Households | 306 (9.1%) | 0 (0.0%) |
| 6-Person Households | 116 (3.5%) | 0 (0.0%) |
| 7+ Person Households | 38 (1.1%) | 0 (0.0%) |
| Total | 2,139 (63.9%) | 1,210 (36.1%) |
Female Fertility in Franklin
Fertility by Age in Franklin
Average fertility rate in Franklin is 89.0 births per 1,000 women. Women in the age bracket of 35 to 50 years have the highest fertility rate with 148.0 births per 1,000 women. Women in the age bracket of 35 to 50 years acount for 66.7% of all women with births.
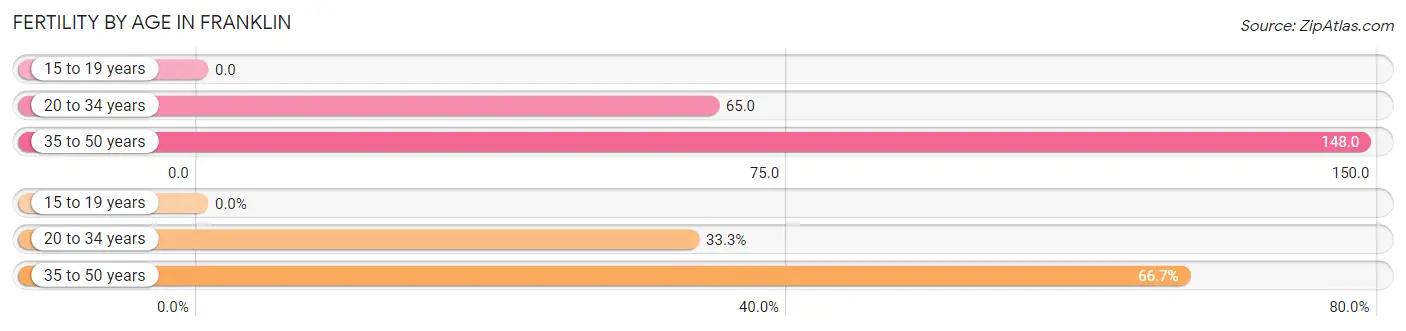
| Age Bracket | Women with Births | Births / 1,000 Women |
| 15 to 19 years | 0 (0.0%) | 0.0 |
| 20 to 34 years | 52 (33.3%) | 65.0 |
| 35 to 50 years | 104 (66.7%) | 148.0 |
| Total | 156 (100.0%) | 89.0 |
Fertility by Age by Marriage Status in Franklin
83.3% of women with births (156) in Franklin are married. The highest percentage of unmarried women with births falls into 20 to 34 years age bracket with 21.1% of them unmarried at the time of birth, while the lowest percentage of unmarried women with births belong to 35 to 50 years age bracket with 14.4% of them unmarried.
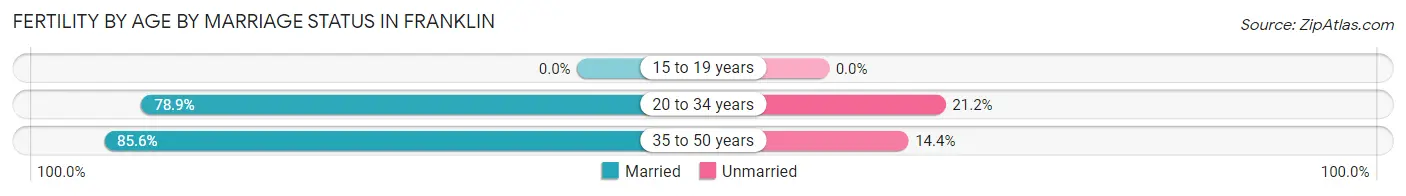
| Age Bracket | Married | Unmarried |
| 15 to 19 years | 0 (0.0%) | 0 (0.0%) |
| 20 to 34 years | 41 (78.8%) | 11 (21.1%) |
| 35 to 50 years | 89 (85.6%) | 15 (14.4%) |
| Total | 130 (83.3%) | 26 (16.7%) |
Fertility by Education in Franklin
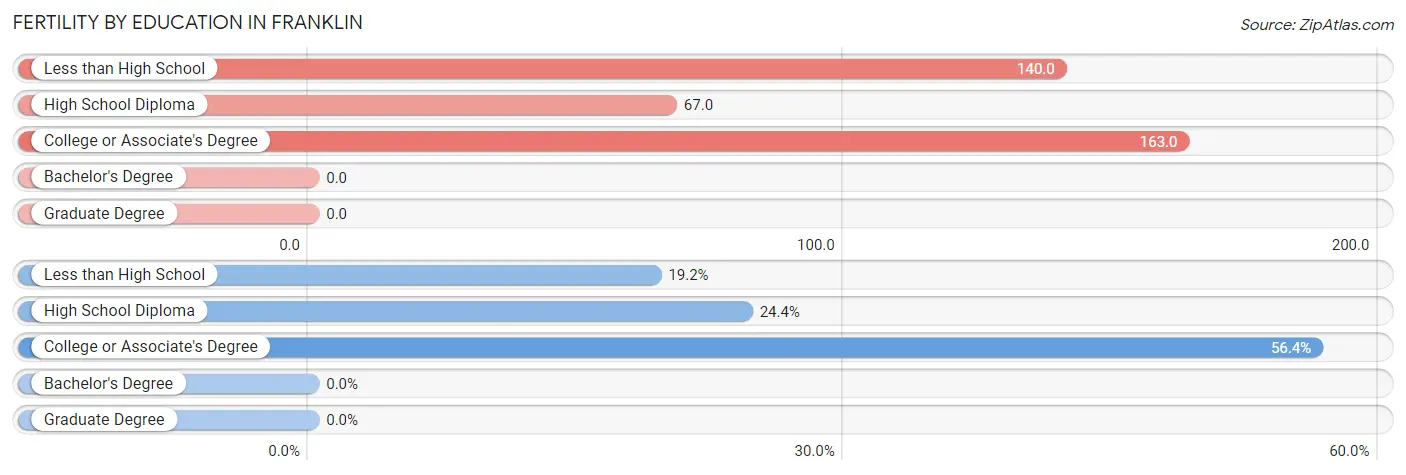
| Educational Attainment | Women with Births | Births / 1,000 Women |
| Less than High School | 30 (19.2%) | 140.0 |
| High School Diploma | 38 (24.4%) | 67.0 |
| College or Associate's Degree | 88 (56.4%) | 163.0 |
| Bachelor's Degree | 0 (0.0%) | 0.0 |
| Graduate Degree | 0 (0.0%) | 0.0 |
| Total | 156 (100.0%) | 89.0 |
Fertility by Education by Marriage Status in Franklin
16.7% of women with births in Franklin are unmarried. Women with the educational attainment of less than high school are most likely to be married with 100.0% of them married at childbirth, while women with the educational attainment of high school diploma are least likely to be married with 68.4% of them unmarried at childbirth.
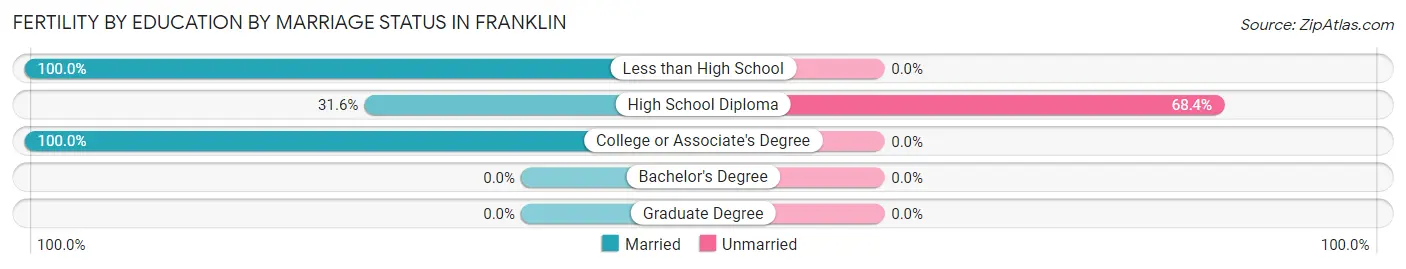
| Educational Attainment | Married | Unmarried |
| Less than High School | 30 (100.0%) | 0 (0.0%) |
| High School Diploma | 12 (31.6%) | 26 (68.4%) |
| College or Associate's Degree | 88 (100.0%) | 0 (0.0%) |
| Bachelor's Degree | 0 (0.0%) | 0 (0.0%) |
| Graduate Degree | 0 (0.0%) | 0 (0.0%) |
| Total | 130 (83.3%) | 26 (16.7%) |
Employment Characteristics in Franklin
Employment by Class of Employer in Franklin
Among the 3,367 employed individuals in Franklin, private company employees (2,228 | 66.2%), local government employees (347 | 10.3%), and not-for-profit organizations (346 | 10.3%) make up the most common classes of employment.
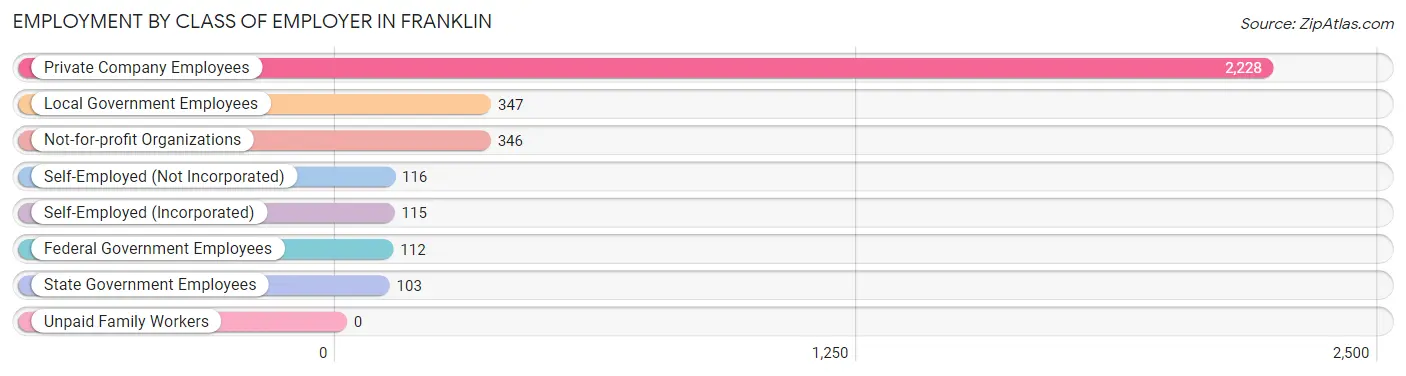
| Employer Class | # Employees | % Employees |
| Private Company Employees | 2,228 | 66.2% |
| Self-Employed (Incorporated) | 115 | 3.4% |
| Self-Employed (Not Incorporated) | 116 | 3.5% |
| Not-for-profit Organizations | 346 | 10.3% |
| Local Government Employees | 347 | 10.3% |
| State Government Employees | 103 | 3.1% |
| Federal Government Employees | 112 | 3.3% |
| Unpaid Family Workers | 0 | 0.0% |
| Total | 3,367 | 100.0% |
Employment Status by Age in Franklin
According to the labor force statistics for Franklin, out of the total population over 16 years of age (6,270), 58.1% or 3,643 individuals are in the labor force, with 5.3% or 193 of them unemployed. The age group with the highest labor force participation rate is 25 to 29 years, with 91.8% or 586 individuals in the labor force. Within the labor force, the 25 to 29 years age range has the highest percentage of unemployed individuals, with 22.7% or 133 of them being unemployed.
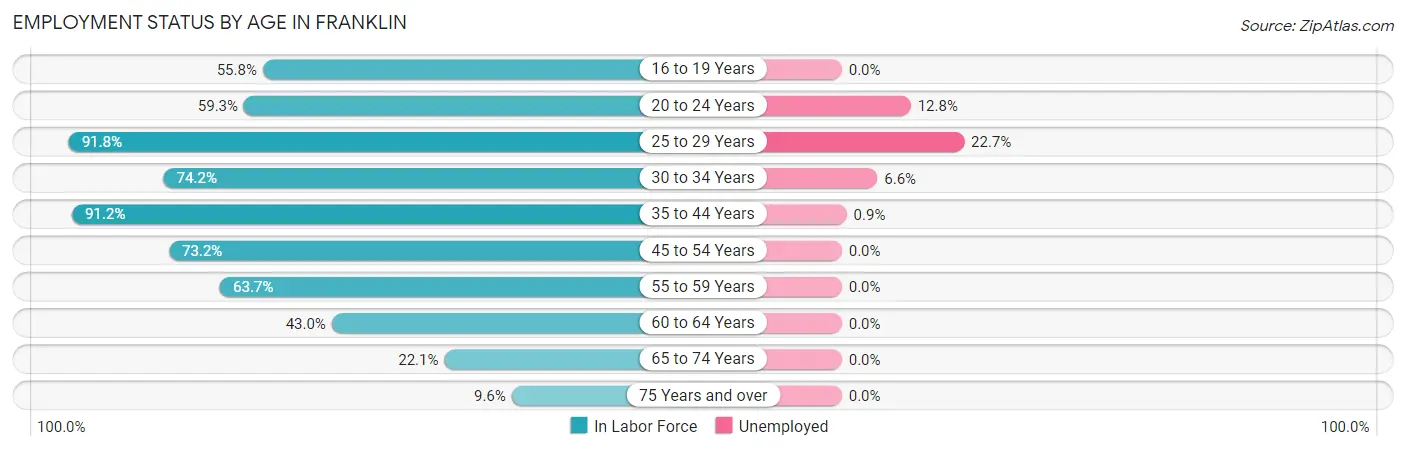
| Age Bracket | In Labor Force | Unemployed |
| 16 to 19 Years | 179 (55.8%) | 0 (0.0%) |
| 20 to 24 Years | 172 (59.3%) | 22 (12.8%) |
| 25 to 29 Years | 586 (91.8%) | 133 (22.7%) |
| 30 to 34 Years | 457 (74.2%) | 30 (6.6%) |
| 35 to 44 Years | 777 (91.2%) | 7 (0.9%) |
| 45 to 54 Years | 600 (73.2%) | 0 (0.0%) |
| 55 to 59 Years | 359 (63.7%) | 0 (0.0%) |
| 60 to 64 Years | 265 (43.0%) | 0 (0.0%) |
| 65 to 74 Years | 171 (22.1%) | 0 (0.0%) |
| 75 Years and over | 75 (9.6%) | 0 (0.0%) |
| Total | 3,643 (58.1%) | 193 (5.3%) |
Employment Status by Educational Attainment in Franklin
According to labor force statistics for Franklin, 74.1% of individuals (3,043) out of the total population between 25 and 64 years of age (4,106) are in the labor force, with 5.6% or 170 of them being unemployed. The group with the highest labor force participation rate are those with the educational attainment of college / associate degree, with 79.6% or 980 individuals in the labor force. Within the labor force, individuals with less than high school education have the highest percentage of unemployment, with 32.7% or 86 of them being unemployed.
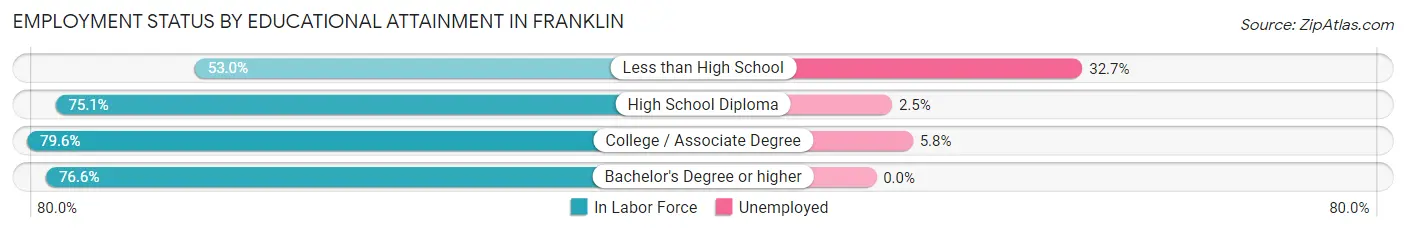
| Educational Attainment | In Labor Force | Unemployed |
| Less than High School | 263 (53.0%) | 162 (32.7%) |
| High School Diploma | 1,070 (75.1%) | 36 (2.5%) |
| College / Associate Degree | 980 (79.6%) | 71 (5.8%) |
| Bachelor's Degree or higher | 731 (76.6%) | 0 (0.0%) |
| Total | 3,043 (74.1%) | 230 (5.6%) |
Employment Occupations by Sex in Franklin
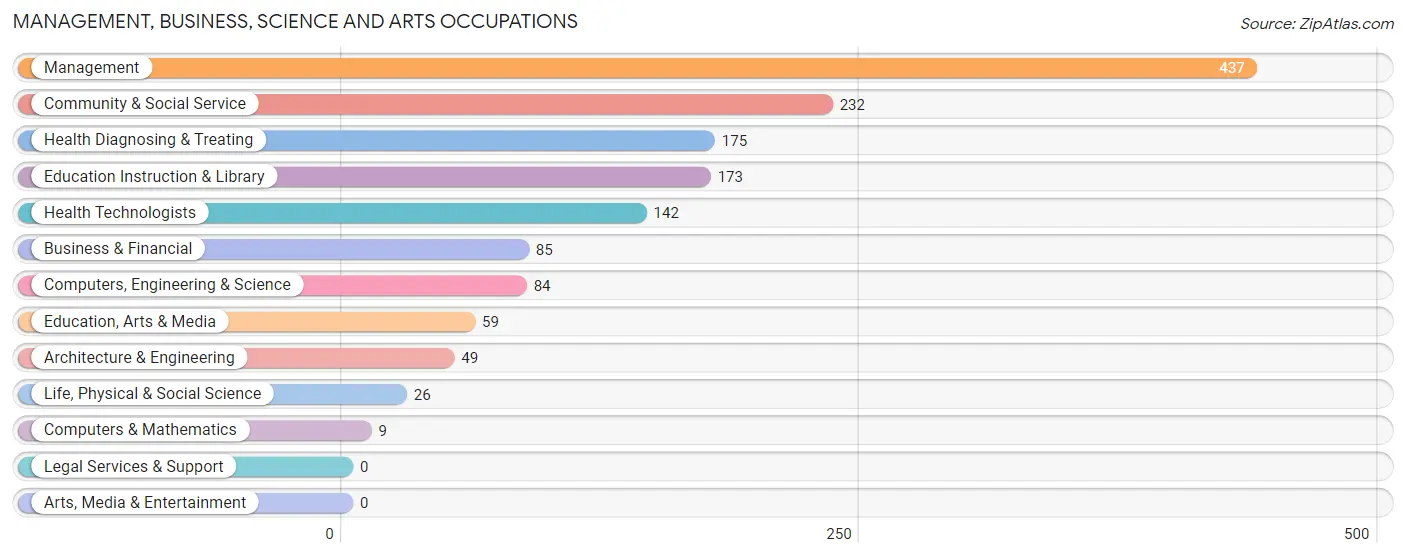
Management, Business, Science and Arts Occupations
The most common Management, Business, Science and Arts occupations in Franklin are Management (437 | 12.7%), Community & Social Service (232 | 6.7%), Health Diagnosing & Treating (175 | 5.1%), Education Instruction & Library (173 | 5.0%), and Health Technologists (142 | 4.1%).
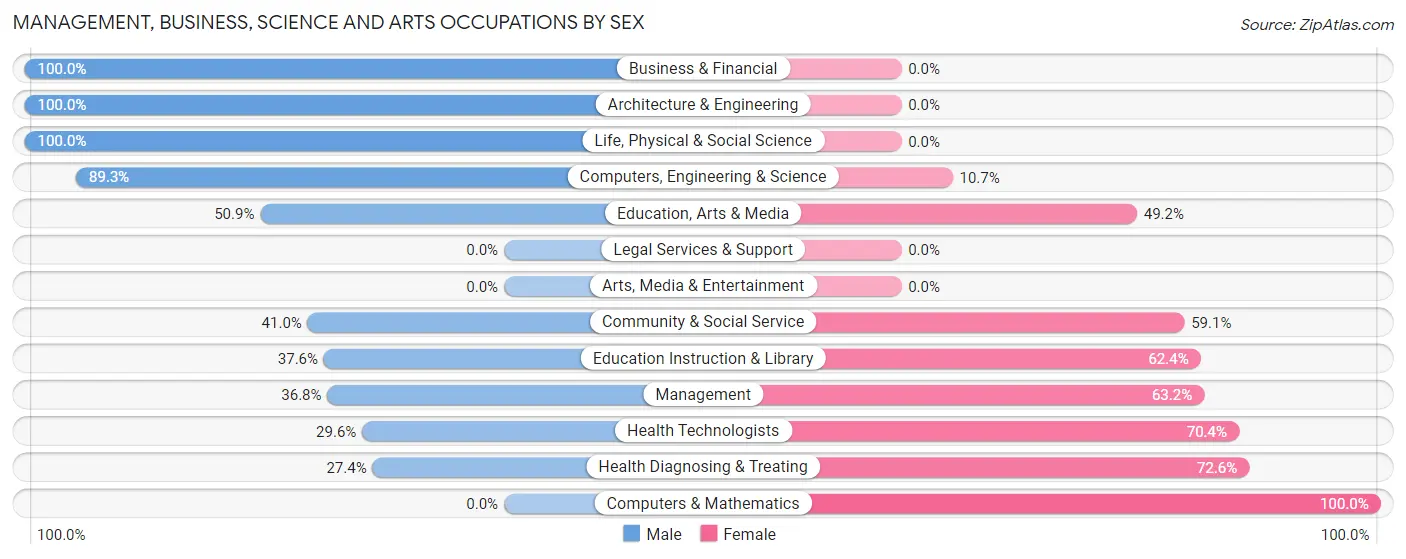
Management, Business, Science and Arts Occupations by Sex
Within the Management, Business, Science and Arts occupations in Franklin, the most male-oriented occupations are Business & Financial (100.0%), Architecture & Engineering (100.0%), and Life, Physical & Social Science (100.0%), while the most female-oriented occupations are Computers & Mathematics (100.0%), Health Diagnosing & Treating (72.6%), and Health Technologists (70.4%).
| Occupation | Male | Female |
| Management | 161 (36.8%) | 276 (63.2%) |
| Business & Financial | 85 (100.0%) | 0 (0.0%) |
| Computers, Engineering & Science | 75 (89.3%) | 9 (10.7%) |
| Computers & Mathematics | 0 (0.0%) | 9 (100.0%) |
| Architecture & Engineering | 49 (100.0%) | 0 (0.0%) |
| Life, Physical & Social Science | 26 (100.0%) | 0 (0.0%) |
| Community & Social Service | 95 (40.9%) | 137 (59.1%) |
| Education, Arts & Media | 30 (50.8%) | 29 (49.1%) |
| Legal Services & Support | 0 (0.0%) | 0 (0.0%) |
| Education Instruction & Library | 65 (37.6%) | 108 (62.4%) |
| Arts, Media & Entertainment | 0 (0.0%) | 0 (0.0%) |
| Health Diagnosing & Treating | 48 (27.4%) | 127 (72.6%) |
| Health Technologists | 42 (29.6%) | 100 (70.4%) |
| Total (Category) | 464 (45.8%) | 549 (54.2%) |
| Total (Overall) | 1,572 (45.6%) | 1,877 (54.4%) |
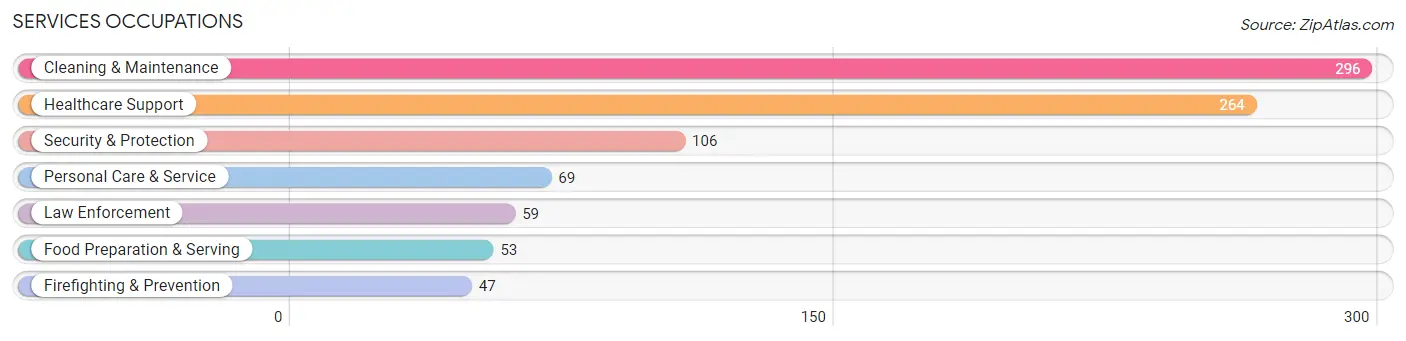
Services Occupations
The most common Services occupations in Franklin are Cleaning & Maintenance (296 | 8.6%), Healthcare Support (264 | 7.6%), Security & Protection (106 | 3.1%), Personal Care & Service (69 | 2.0%), and Law Enforcement (59 | 1.7%).
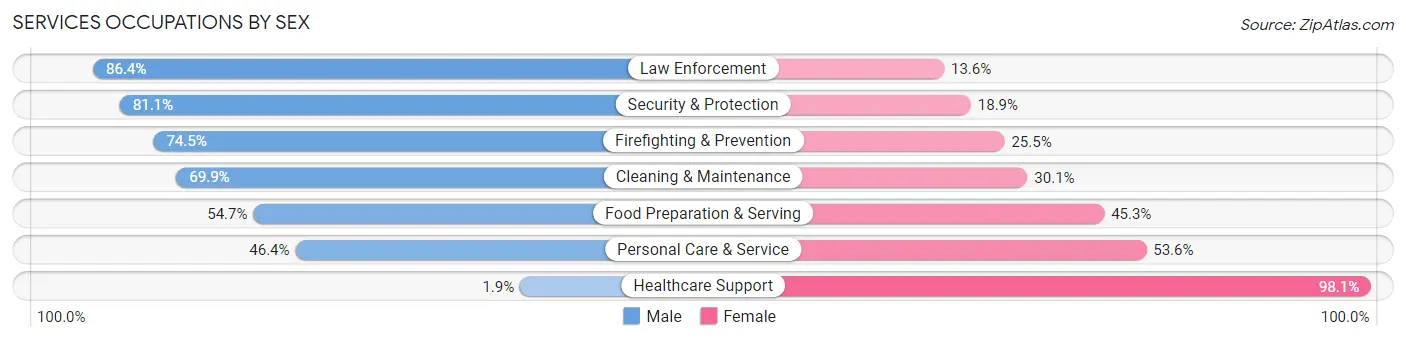
Services Occupations by Sex
Within the Services occupations in Franklin, the most male-oriented occupations are Law Enforcement (86.4%), Security & Protection (81.1%), and Firefighting & Prevention (74.5%), while the most female-oriented occupations are Healthcare Support (98.1%), Personal Care & Service (53.6%), and Food Preparation & Serving (45.3%).
| Occupation | Male | Female |
| Healthcare Support | 5 (1.9%) | 259 (98.1%) |
| Security & Protection | 86 (81.1%) | 20 (18.9%) |
| Firefighting & Prevention | 35 (74.5%) | 12 (25.5%) |
| Law Enforcement | 51 (86.4%) | 8 (13.6%) |
| Food Preparation & Serving | 29 (54.7%) | 24 (45.3%) |
| Cleaning & Maintenance | 207 (69.9%) | 89 (30.1%) |
| Personal Care & Service | 32 (46.4%) | 37 (53.6%) |
| Total (Category) | 359 (45.6%) | 429 (54.4%) |
| Total (Overall) | 1,572 (45.6%) | 1,877 (54.4%) |
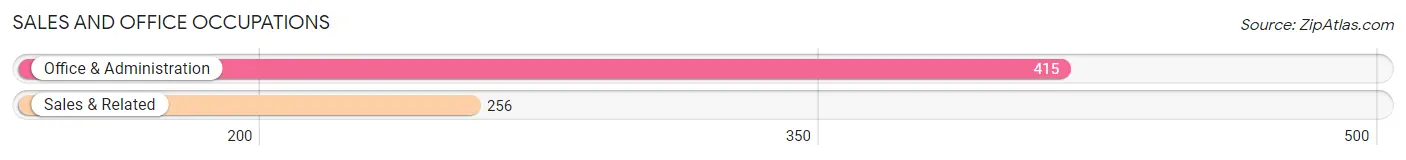
Sales and Office Occupations
The most common Sales and Office occupations in Franklin are Office & Administration (415 | 12.0%), and Sales & Related (256 | 7.4%).
Sales and Office Occupations by Sex
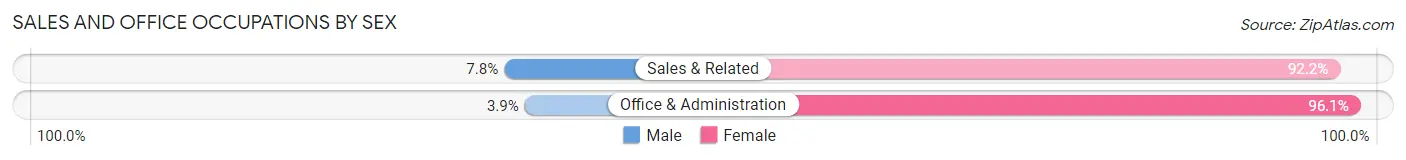
| Occupation | Male | Female |
| Sales & Related | 20 (7.8%) | 236 (92.2%) |
| Office & Administration | 16 (3.9%) | 399 (96.1%) |
| Total (Category) | 36 (5.4%) | 635 (94.6%) |
| Total (Overall) | 1,572 (45.6%) | 1,877 (54.4%) |
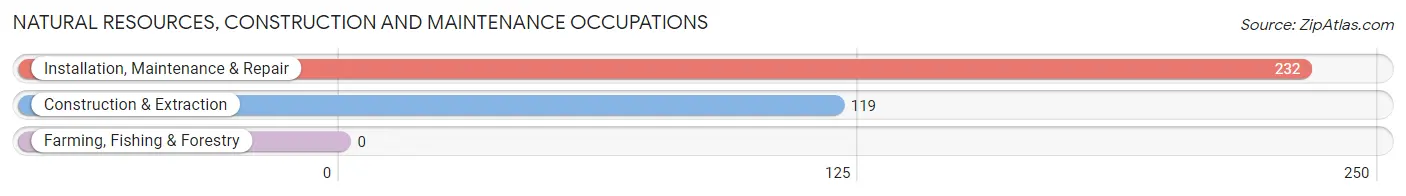
Natural Resources, Construction and Maintenance Occupations
The most common Natural Resources, Construction and Maintenance occupations in Franklin are Installation, Maintenance & Repair (232 | 6.7%), and Construction & Extraction (119 | 3.5%).
Natural Resources, Construction and Maintenance Occupations by Sex
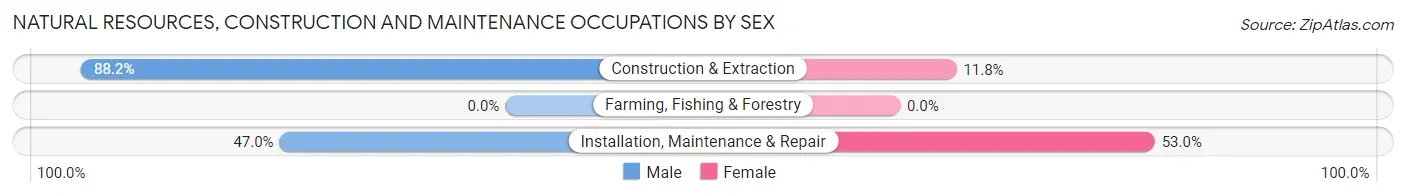
| Occupation | Male | Female |
| Farming, Fishing & Forestry | 0 (0.0%) | 0 (0.0%) |
| Construction & Extraction | 105 (88.2%) | 14 (11.8%) |
| Installation, Maintenance & Repair | 109 (47.0%) | 123 (53.0%) |
| Total (Category) | 214 (61.0%) | 137 (39.0%) |
| Total (Overall) | 1,572 (45.6%) | 1,877 (54.4%) |
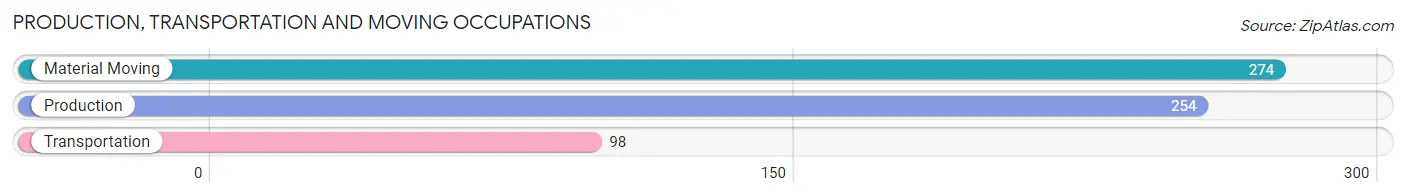
Production, Transportation and Moving Occupations
The most common Production, Transportation and Moving occupations in Franklin are Material Moving (274 | 7.9%), Production (254 | 7.4%), and Transportation (98 | 2.8%).
Production, Transportation and Moving Occupations by Sex
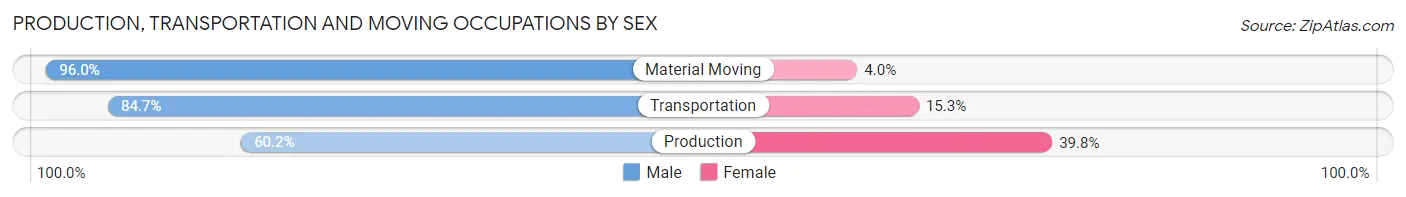
| Occupation | Male | Female |
| Production | 153 (60.2%) | 101 (39.8%) |
| Transportation | 83 (84.7%) | 15 (15.3%) |
| Material Moving | 263 (96.0%) | 11 (4.0%) |
| Total (Category) | 499 (79.7%) | 127 (20.3%) |
| Total (Overall) | 1,572 (45.6%) | 1,877 (54.4%) |
Employment Industries by Sex in Franklin
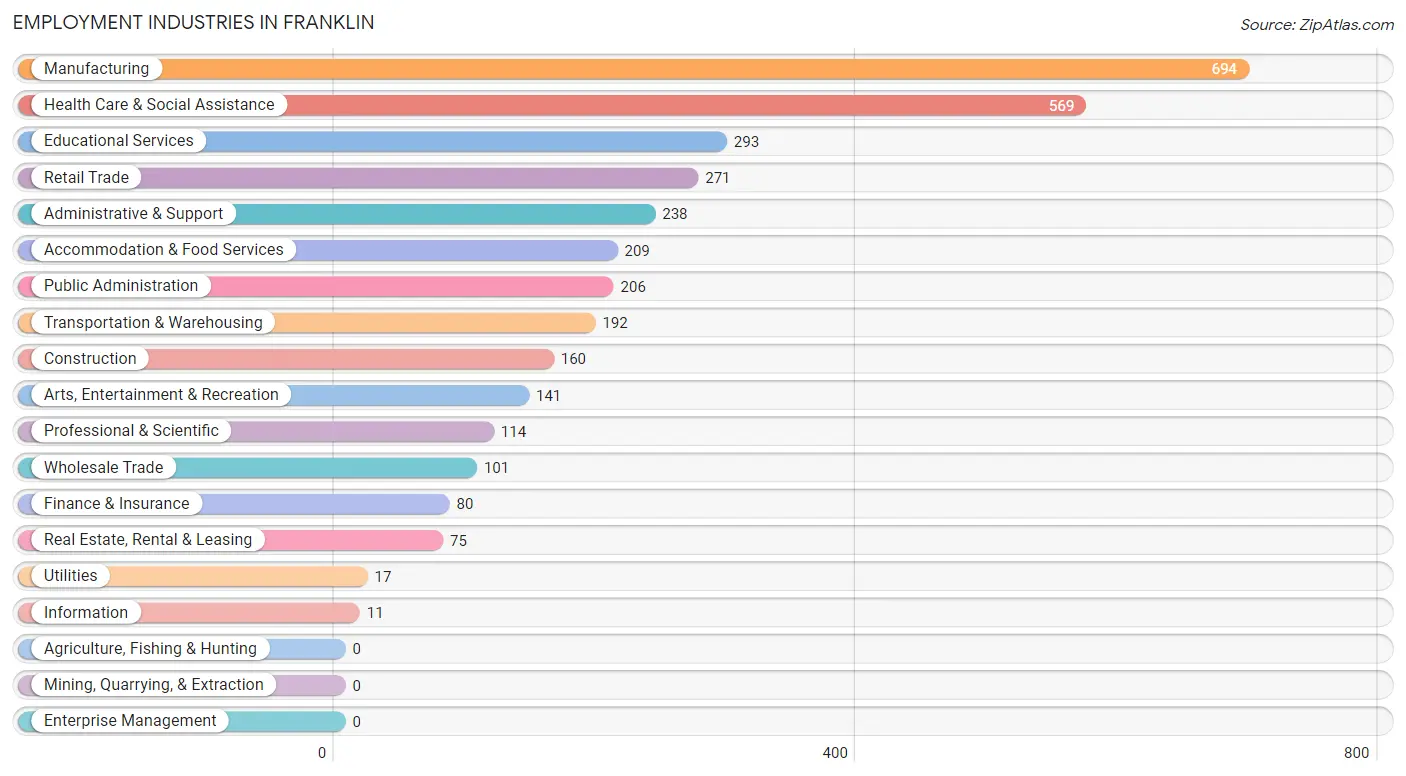
Employment Industries in Franklin
The major employment industries in Franklin include Manufacturing (694 | 20.1%), Health Care & Social Assistance (569 | 16.5%), Educational Services (293 | 8.5%), Retail Trade (271 | 7.9%), and Administrative & Support (238 | 6.9%).
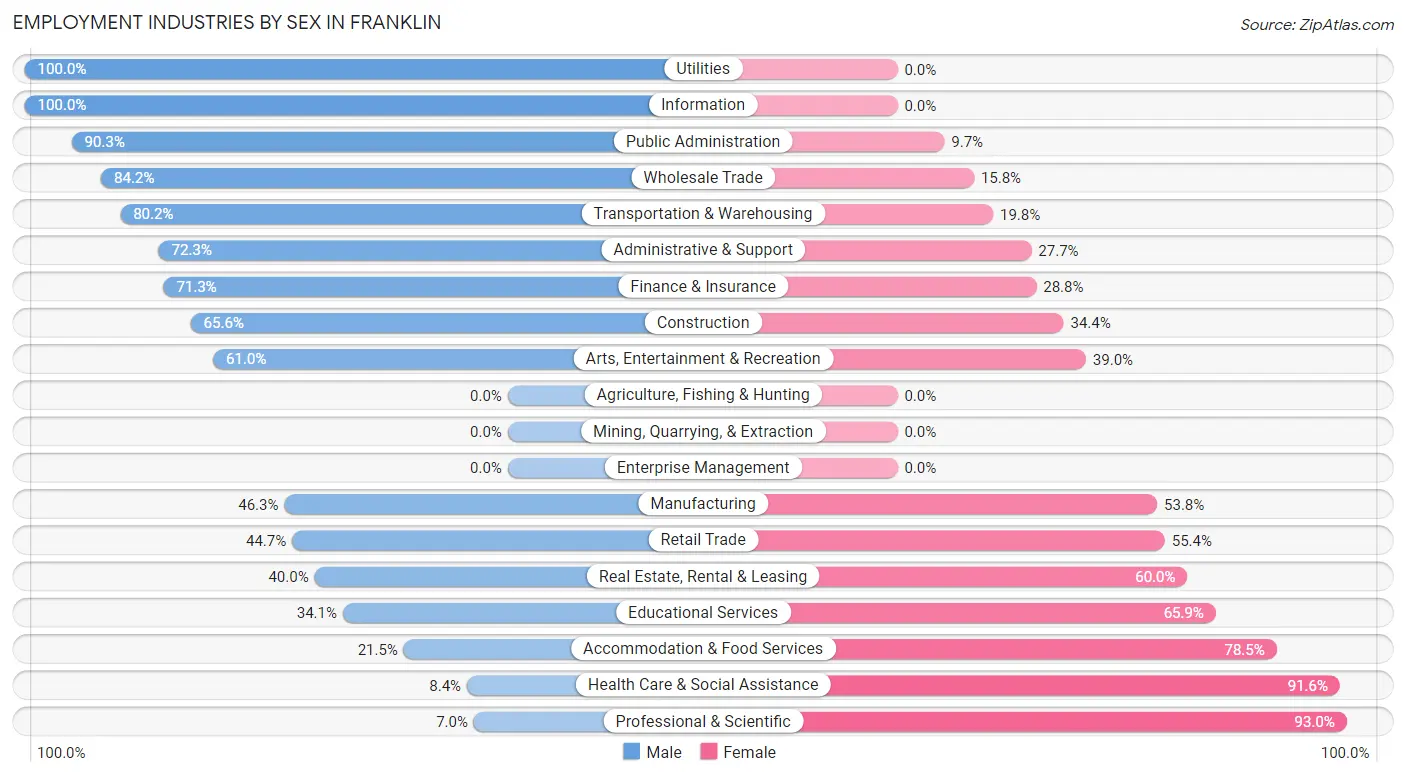
Employment Industries by Sex in Franklin
The Franklin industries that see more men than women are Utilities (100.0%), Information (100.0%), and Public Administration (90.3%), whereas the industries that tend to have a higher number of women are Professional & Scientific (93.0%), Health Care & Social Assistance (91.6%), and Accommodation & Food Services (78.5%).
| Industry | Male | Female |
| Agriculture, Fishing & Hunting | 0 (0.0%) | 0 (0.0%) |
| Mining, Quarrying, & Extraction | 0 (0.0%) | 0 (0.0%) |
| Construction | 105 (65.6%) | 55 (34.4%) |
| Manufacturing | 321 (46.3%) | 373 (53.7%) |
| Wholesale Trade | 85 (84.2%) | 16 (15.8%) |
| Retail Trade | 121 (44.7%) | 150 (55.3%) |
| Transportation & Warehousing | 154 (80.2%) | 38 (19.8%) |
| Utilities | 17 (100.0%) | 0 (0.0%) |
| Information | 11 (100.0%) | 0 (0.0%) |
| Finance & Insurance | 57 (71.3%) | 23 (28.7%) |
| Real Estate, Rental & Leasing | 30 (40.0%) | 45 (60.0%) |
| Professional & Scientific | 8 (7.0%) | 106 (93.0%) |
| Enterprise Management | 0 (0.0%) | 0 (0.0%) |
| Administrative & Support | 172 (72.3%) | 66 (27.7%) |
| Educational Services | 100 (34.1%) | 193 (65.9%) |
| Health Care & Social Assistance | 48 (8.4%) | 521 (91.6%) |
| Arts, Entertainment & Recreation | 86 (61.0%) | 55 (39.0%) |
| Accommodation & Food Services | 45 (21.5%) | 164 (78.5%) |
| Public Administration | 186 (90.3%) | 20 (9.7%) |
| Total | 1,572 (45.6%) | 1,877 (54.4%) |
Education in Franklin
School Enrollment in Franklin
The most common levels of schooling among the 1,644 students in Franklin are middle school (542 | 33.0%), elementary school (382 | 23.2%), and high school (316 | 19.2%).
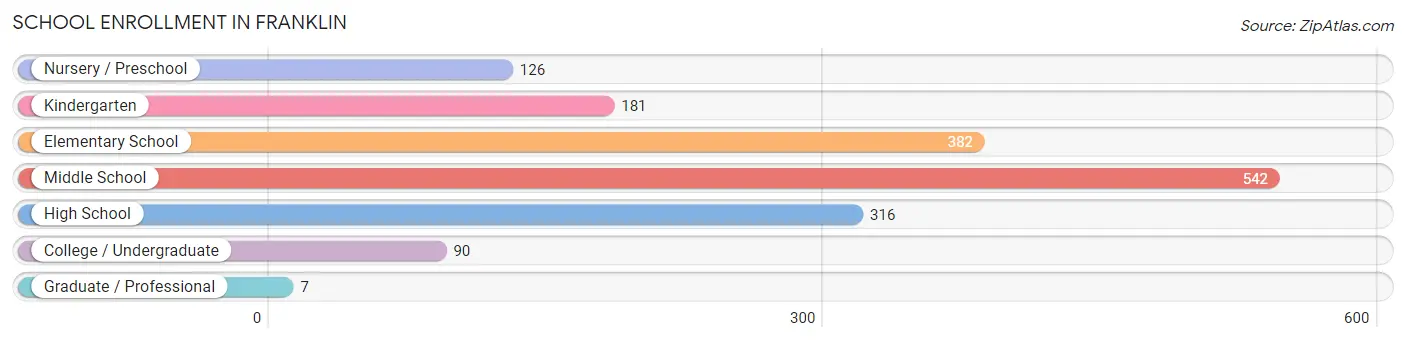
| School Level | # Students | % Students |
| Nursery / Preschool | 126 | 7.7% |
| Kindergarten | 181 | 11.0% |
| Elementary School | 382 | 23.2% |
| Middle School | 542 | 33.0% |
| High School | 316 | 19.2% |
| College / Undergraduate | 90 | 5.5% |
| Graduate / Professional | 7 | 0.4% |
| Total | 1,644 | 100.0% |
School Enrollment by Age by Funding Source in Franklin
Out of a total of 1,644 students who are enrolled in schools in Franklin, 321 (19.5%) attend a private institution, while the remaining 1,323 (80.5%) are enrolled in public schools. The age group of 18 to 19 year olds has the highest likelihood of being enrolled in private schools, with 34 (51.5% in the age bracket) enrolled. Conversely, the age group of 20 to 24 year olds has the lowest likelihood of being enrolled in a private school, with 11 (100.0% in the age bracket) attending a public institution.
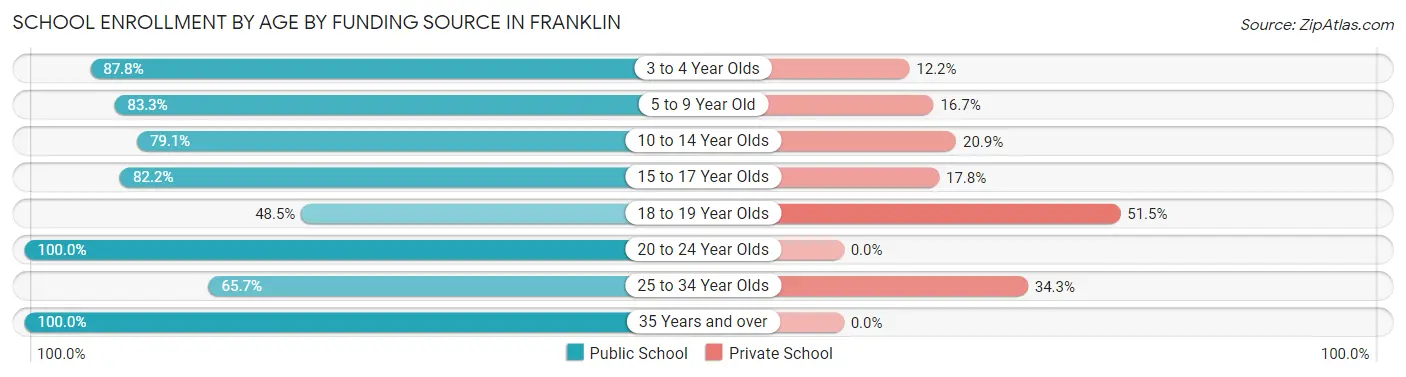
| Age Bracket | Public School | Private School |
| 3 to 4 Year Olds | 86 (87.8%) | 12 (12.2%) |
| 5 to 9 Year Old | 463 (83.3%) | 93 (16.7%) |
| 10 to 14 Year Olds | 408 (79.1%) | 108 (20.9%) |
| 15 to 17 Year Olds | 287 (82.2%) | 62 (17.8%) |
| 18 to 19 Year Olds | 32 (48.5%) | 34 (51.5%) |
| 20 to 24 Year Olds | 11 (100.0%) | 0 (0.0%) |
| 25 to 34 Year Olds | 23 (65.7%) | 12 (34.3%) |
| 35 Years and over | 13 (100.0%) | 0 (0.0%) |
| Total | 1,323 (80.5%) | 321 (19.5%) |
Educational Attainment by Field of Study in Franklin
Business (391 | 28.7%), education (322 | 23.7%), arts & humanities (171 | 12.6%), social sciences (94 | 6.9%), and science & technology (92 | 6.8%) are the most common fields of study among 1,360 individuals in Franklin who have obtained a bachelor's degree or higher.
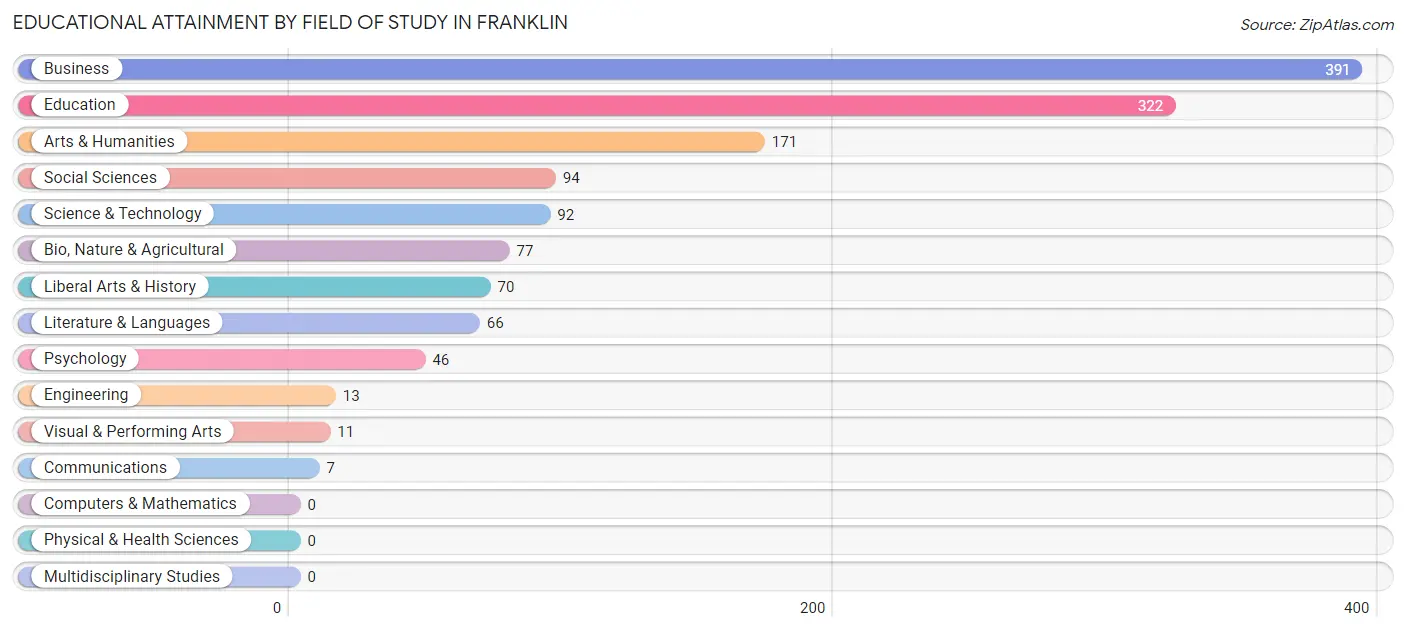
| Field of Study | # Graduates | % Graduates |
| Computers & Mathematics | 0 | 0.0% |
| Bio, Nature & Agricultural | 77 | 5.7% |
| Physical & Health Sciences | 0 | 0.0% |
| Psychology | 46 | 3.4% |
| Social Sciences | 94 | 6.9% |
| Engineering | 13 | 1.0% |
| Multidisciplinary Studies | 0 | 0.0% |
| Science & Technology | 92 | 6.8% |
| Business | 391 | 28.7% |
| Education | 322 | 23.7% |
| Literature & Languages | 66 | 4.9% |
| Liberal Arts & History | 70 | 5.1% |
| Visual & Performing Arts | 11 | 0.8% |
| Communications | 7 | 0.5% |
| Arts & Humanities | 171 | 12.6% |
| Total | 1,360 | 100.0% |
Transportation & Commute in Franklin
Vehicle Availability by Sex in Franklin
The most prevalent vehicle ownership categories in Franklin are males with 2 vehicles (673, accounting for 43.8%) and females with 2 vehicles (779, making up 36.8%).
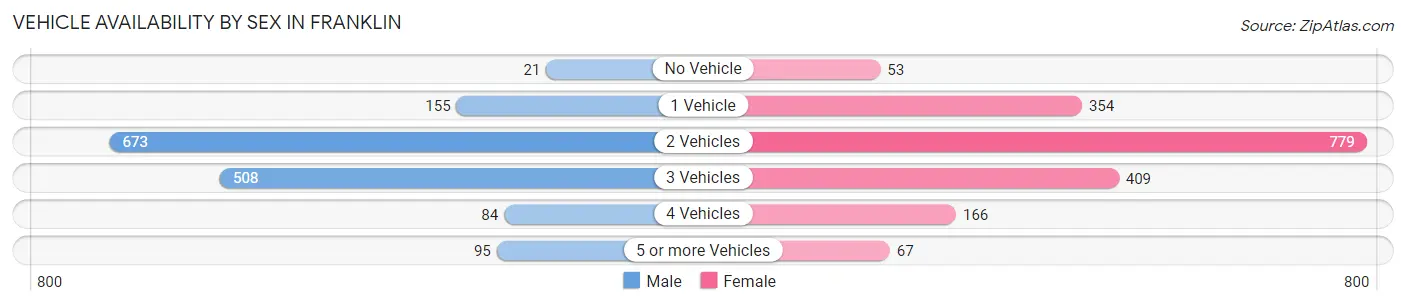
| Vehicles Available | Male | Female |
| No Vehicle | 21 (1.4%) | 53 (2.9%) |
| 1 Vehicle | 155 (10.1%) | 354 (19.4%) |
| 2 Vehicles | 673 (43.8%) | 779 (42.6%) |
| 3 Vehicles | 508 (33.1%) | 409 (22.4%) |
| 4 Vehicles | 84 (5.5%) | 166 (9.1%) |
| 5 or more Vehicles | 95 (6.2%) | 67 (3.7%) |
| Total | 1,536 (100.0%) | 1,828 (100.0%) |
Commute Time in Franklin
The most frequently occuring commute durations in Franklin are 5 to 9 minutes (840 commuters, 25.8%), 10 to 14 minutes (586 commuters, 18.0%), and 60 to 89 minutes (478 commuters, 14.7%).
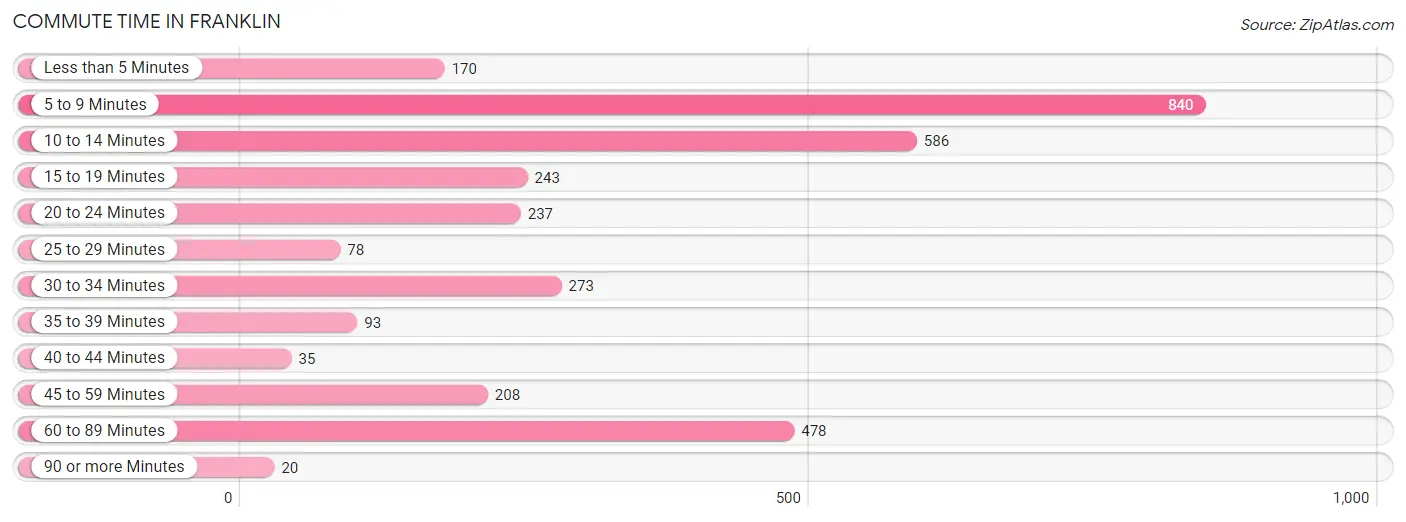
| Commute Time | # Commuters | % Commuters |
| Less than 5 Minutes | 170 | 5.2% |
| 5 to 9 Minutes | 840 | 25.8% |
| 10 to 14 Minutes | 586 | 18.0% |
| 15 to 19 Minutes | 243 | 7.4% |
| 20 to 24 Minutes | 237 | 7.3% |
| 25 to 29 Minutes | 78 | 2.4% |
| 30 to 34 Minutes | 273 | 8.4% |
| 35 to 39 Minutes | 93 | 2.9% |
| 40 to 44 Minutes | 35 | 1.1% |
| 45 to 59 Minutes | 208 | 6.4% |
| 60 to 89 Minutes | 478 | 14.7% |
| 90 or more Minutes | 20 | 0.6% |
Commute Time by Sex in Franklin
The most common commute times in Franklin are 5 to 9 minutes (281 commuters, 18.9%) for males and 5 to 9 minutes (559 commuters, 31.6%) for females.
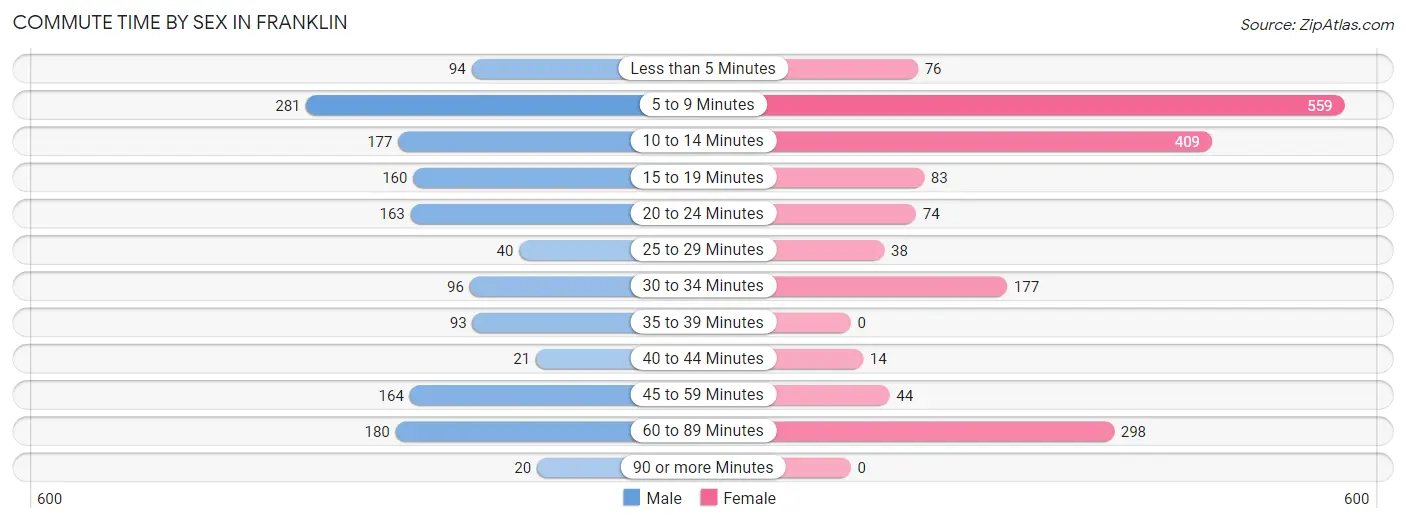
| Commute Time | Male | Female |
| Less than 5 Minutes | 94 (6.3%) | 76 (4.3%) |
| 5 to 9 Minutes | 281 (18.9%) | 559 (31.6%) |
| 10 to 14 Minutes | 177 (11.9%) | 409 (23.1%) |
| 15 to 19 Minutes | 160 (10.7%) | 83 (4.7%) |
| 20 to 24 Minutes | 163 (11.0%) | 74 (4.2%) |
| 25 to 29 Minutes | 40 (2.7%) | 38 (2.1%) |
| 30 to 34 Minutes | 96 (6.5%) | 177 (10.0%) |
| 35 to 39 Minutes | 93 (6.2%) | 0 (0.0%) |
| 40 to 44 Minutes | 21 (1.4%) | 14 (0.8%) |
| 45 to 59 Minutes | 164 (11.0%) | 44 (2.5%) |
| 60 to 89 Minutes | 180 (12.1%) | 298 (16.8%) |
| 90 or more Minutes | 20 (1.3%) | 0 (0.0%) |
Time of Departure to Work by Sex in Franklin
The most frequent times of departure to work in Franklin are 5:00 AM to 5:29 AM (225, 15.1%) for males and 7:00 AM to 7:29 AM (326, 18.4%) for females.
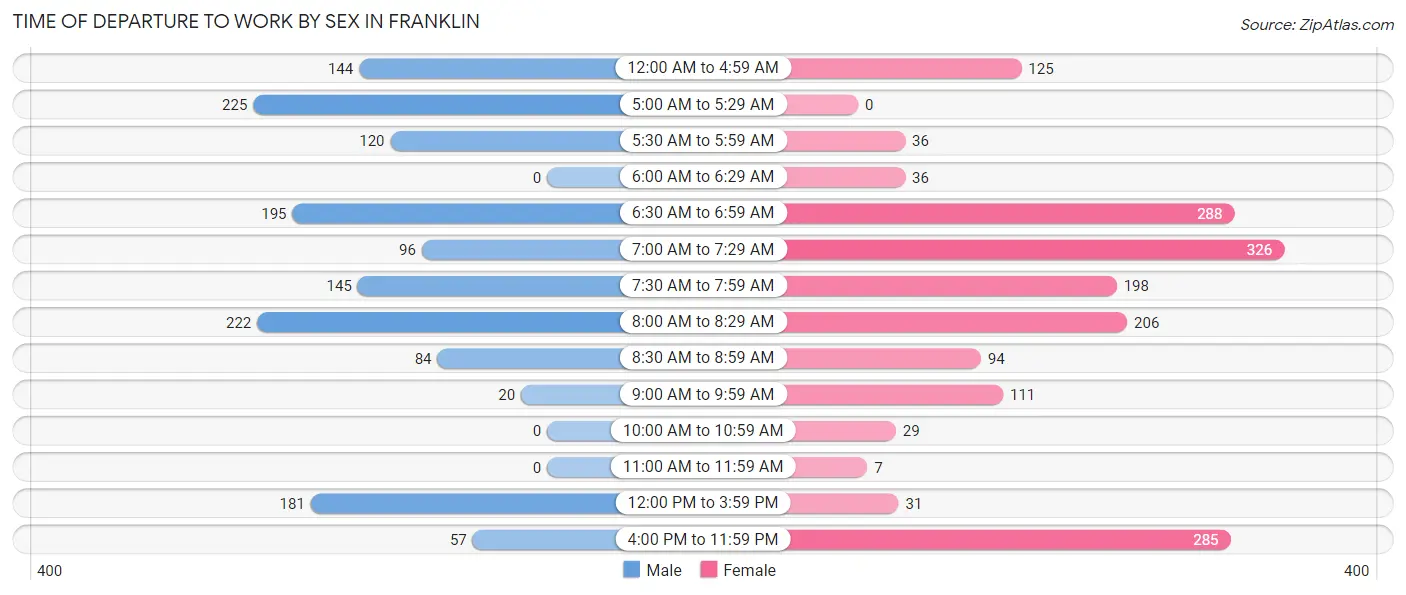
| Time of Departure | Male | Female |
| 12:00 AM to 4:59 AM | 144 (9.7%) | 125 (7.0%) |
| 5:00 AM to 5:29 AM | 225 (15.1%) | 0 (0.0%) |
| 5:30 AM to 5:59 AM | 120 (8.1%) | 36 (2.0%) |
| 6:00 AM to 6:29 AM | 0 (0.0%) | 36 (2.0%) |
| 6:30 AM to 6:59 AM | 195 (13.1%) | 288 (16.3%) |
| 7:00 AM to 7:29 AM | 96 (6.5%) | 326 (18.4%) |
| 7:30 AM to 7:59 AM | 145 (9.7%) | 198 (11.2%) |
| 8:00 AM to 8:29 AM | 222 (14.9%) | 206 (11.6%) |
| 8:30 AM to 8:59 AM | 84 (5.6%) | 94 (5.3%) |
| 9:00 AM to 9:59 AM | 20 (1.3%) | 111 (6.3%) |
| 10:00 AM to 10:59 AM | 0 (0.0%) | 29 (1.6%) |
| 11:00 AM to 11:59 AM | 0 (0.0%) | 7 (0.4%) |
| 12:00 PM to 3:59 PM | 181 (12.2%) | 31 (1.8%) |
| 4:00 PM to 11:59 PM | 57 (3.8%) | 285 (16.1%) |
| Total | 1,489 (100.0%) | 1,772 (100.0%) |
Housing Occupancy in Franklin
Occupancy by Ownership in Franklin
Of the total 3,349 dwellings in Franklin, owner-occupied units account for 1,863 (55.6%), while renter-occupied units make up 1,486 (44.4%).
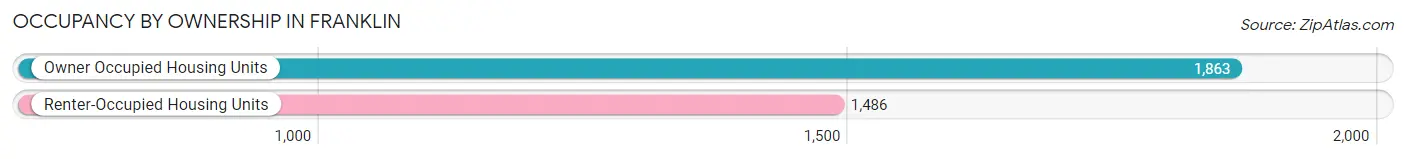
| Occupancy | # Housing Units | % Housing Units |
| Owner Occupied Housing Units | 1,863 | 55.6% |
| Renter-Occupied Housing Units | 1,486 | 44.4% |
| Total Occupied Housing Units | 3,349 | 100.0% |
Occupancy by Household Size in Franklin
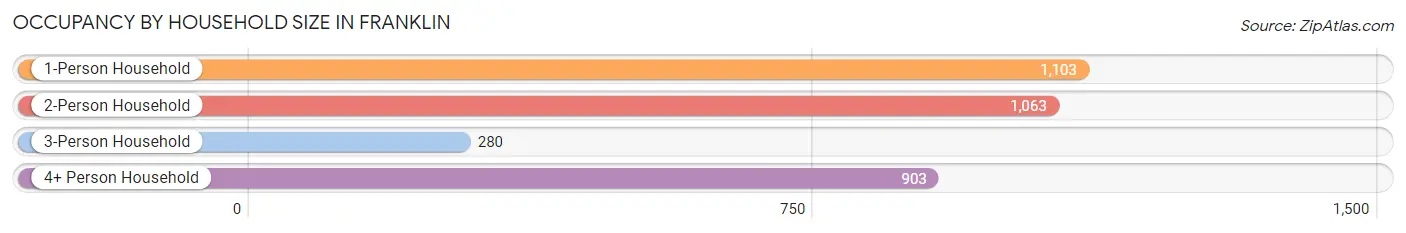
| Household Size | # Housing Units | % Housing Units |
| 1-Person Household | 1,103 | 32.9% |
| 2-Person Household | 1,063 | 31.7% |
| 3-Person Household | 280 | 8.4% |
| 4+ Person Household | 903 | 27.0% |
| Total Housing Units | 3,349 | 100.0% |
Occupancy by Ownership by Household Size in Franklin
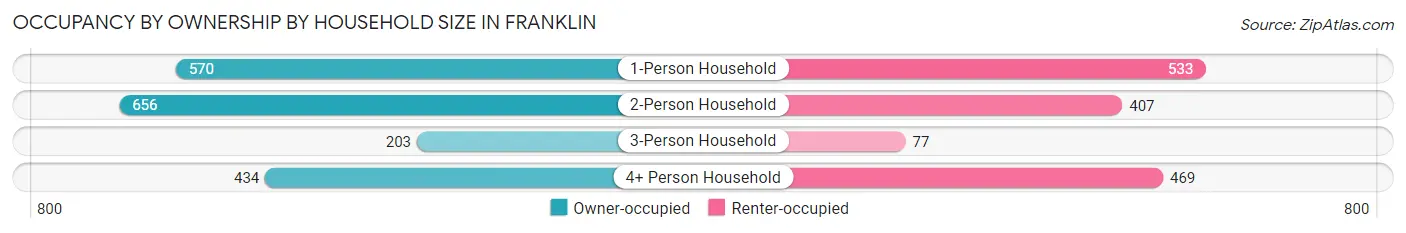
| Household Size | Owner-occupied | Renter-occupied |
| 1-Person Household | 570 (51.7%) | 533 (48.3%) |
| 2-Person Household | 656 (61.7%) | 407 (38.3%) |
| 3-Person Household | 203 (72.5%) | 77 (27.5%) |
| 4+ Person Household | 434 (48.1%) | 469 (51.9%) |
| Total Housing Units | 1,863 (55.6%) | 1,486 (44.4%) |
Occupancy by Educational Attainment in Franklin
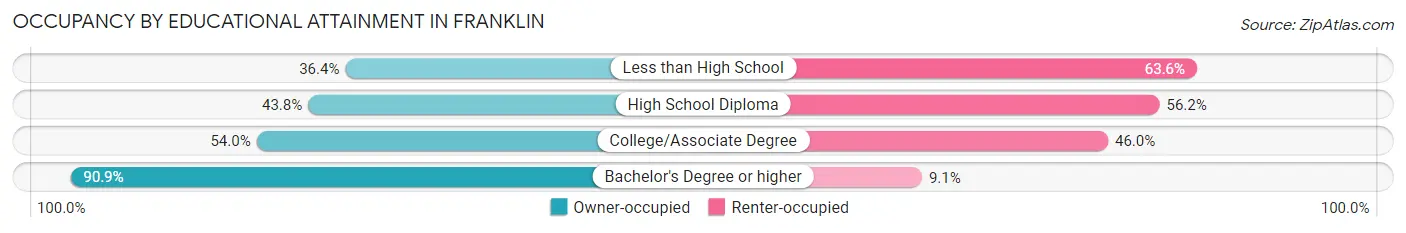
| Household Size | Owner-occupied | Renter-occupied |
| Less than High School | 212 (36.4%) | 370 (63.6%) |
| High School Diploma | 464 (43.8%) | 595 (56.2%) |
| College/Associate Degree | 536 (54.0%) | 456 (46.0%) |
| Bachelor's Degree or higher | 651 (90.9%) | 65 (9.1%) |
Occupancy by Age of Householder in Franklin
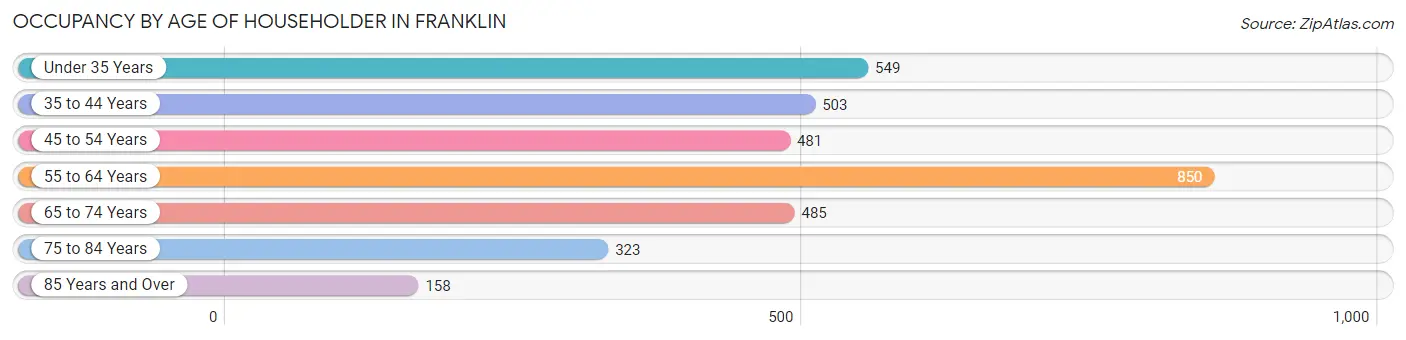
| Age Bracket | # Households | % Households |
| Under 35 Years | 549 | 16.4% |
| 35 to 44 Years | 503 | 15.0% |
| 45 to 54 Years | 481 | 14.4% |
| 55 to 64 Years | 850 | 25.4% |
| 65 to 74 Years | 485 | 14.5% |
| 75 to 84 Years | 323 | 9.6% |
| 85 Years and Over | 158 | 4.7% |
| Total | 3,349 | 100.0% |
Housing Finances in Franklin
Median Income by Occupancy in Franklin
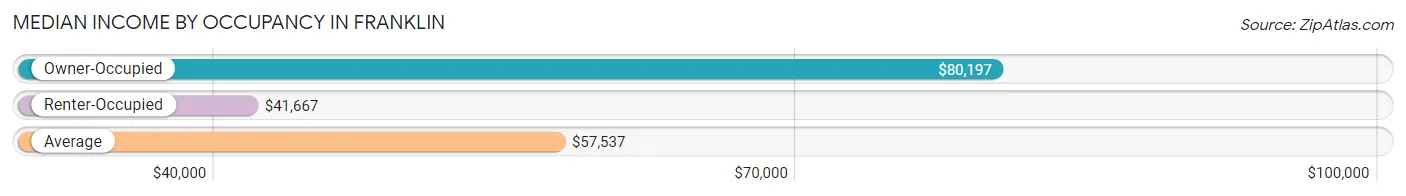
| Occupancy Type | # Households | Median Income |
| Owner-Occupied | 1,863 (55.6%) | $80,197 |
| Renter-Occupied | 1,486 (44.4%) | $41,667 |
| Average | 3,349 (100.0%) | $57,537 |
Occupancy by Householder Income Bracket in Franklin
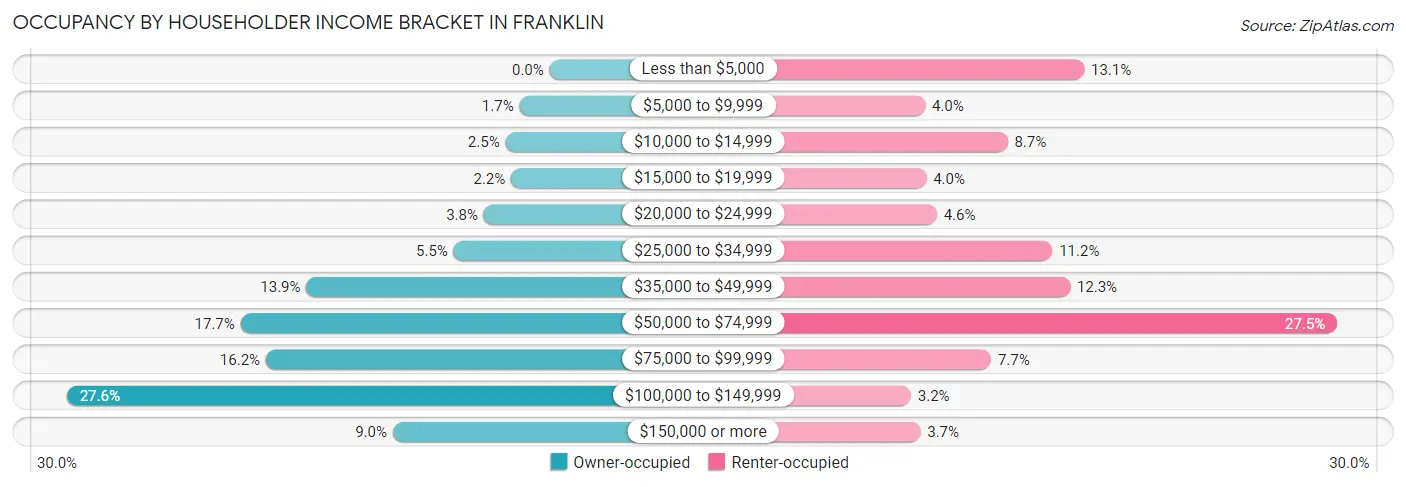
| Income Bracket | Owner-occupied | Renter-occupied |
| Less than $5,000 | 0 (0.0%) | 194 (13.1%) |
| $5,000 to $9,999 | 32 (1.7%) | 59 (4.0%) |
| $10,000 to $14,999 | 47 (2.5%) | 129 (8.7%) |
| $15,000 to $19,999 | 41 (2.2%) | 60 (4.0%) |
| $20,000 to $24,999 | 70 (3.8%) | 69 (4.6%) |
| $25,000 to $34,999 | 102 (5.5%) | 167 (11.2%) |
| $35,000 to $49,999 | 259 (13.9%) | 182 (12.2%) |
| $50,000 to $74,999 | 329 (17.7%) | 409 (27.5%) |
| $75,000 to $99,999 | 302 (16.2%) | 115 (7.7%) |
| $100,000 to $149,999 | 514 (27.6%) | 47 (3.2%) |
| $150,000 or more | 167 (9.0%) | 55 (3.7%) |
| Total | 1,863 (100.0%) | 1,486 (100.0%) |
Monthly Housing Cost Tiers in Franklin
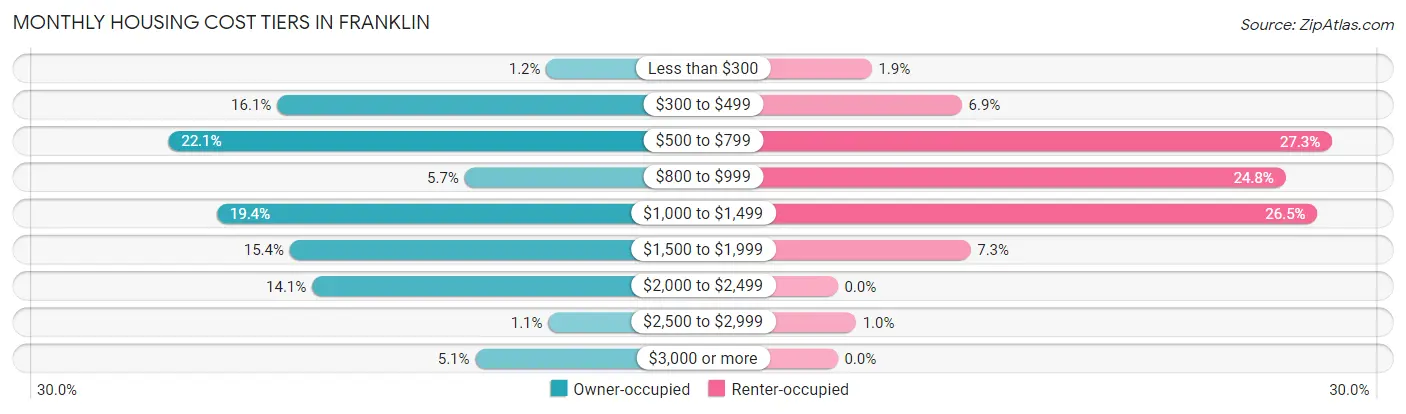
| Monthly Cost | Owner-occupied | Renter-occupied |
| Less than $300 | 22 (1.2%) | 28 (1.9%) |
| $300 to $499 | 299 (16.1%) | 102 (6.9%) |
| $500 to $799 | 411 (22.1%) | 406 (27.3%) |
| $800 to $999 | 106 (5.7%) | 368 (24.8%) |
| $1,000 to $1,499 | 361 (19.4%) | 394 (26.5%) |
| $1,500 to $1,999 | 286 (15.3%) | 109 (7.3%) |
| $2,000 to $2,499 | 263 (14.1%) | 0 (0.0%) |
| $2,500 to $2,999 | 20 (1.1%) | 15 (1.0%) |
| $3,000 or more | 95 (5.1%) | 0 (0.0%) |
| Total | 1,863 (100.0%) | 1,486 (100.0%) |
Physical Housing Characteristics in Franklin
Housing Structures in Franklin
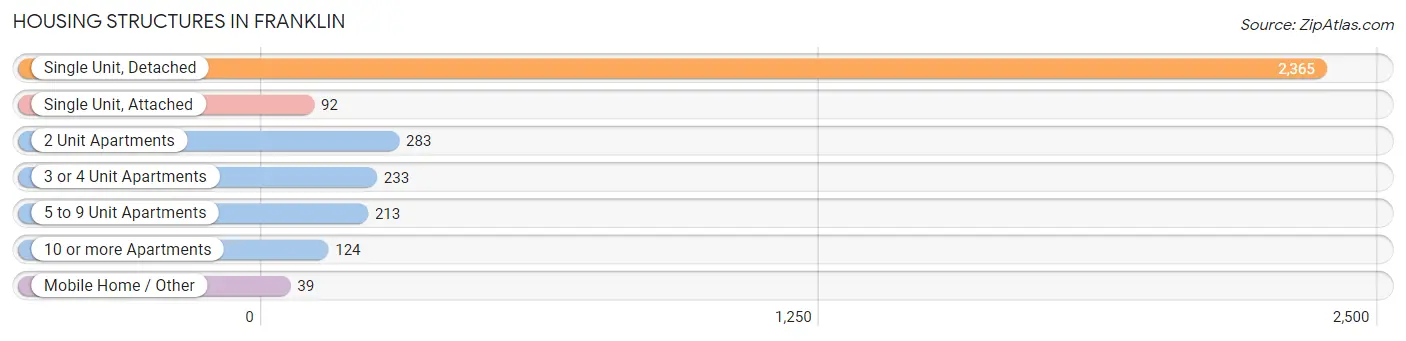
| Structure Type | # Housing Units | % Housing Units |
| Single Unit, Detached | 2,365 | 70.6% |
| Single Unit, Attached | 92 | 2.8% |
| 2 Unit Apartments | 283 | 8.5% |
| 3 or 4 Unit Apartments | 233 | 7.0% |
| 5 to 9 Unit Apartments | 213 | 6.4% |
| 10 or more Apartments | 124 | 3.7% |
| Mobile Home / Other | 39 | 1.2% |
| Total | 3,349 | 100.0% |
Housing Structures by Occupancy in Franklin
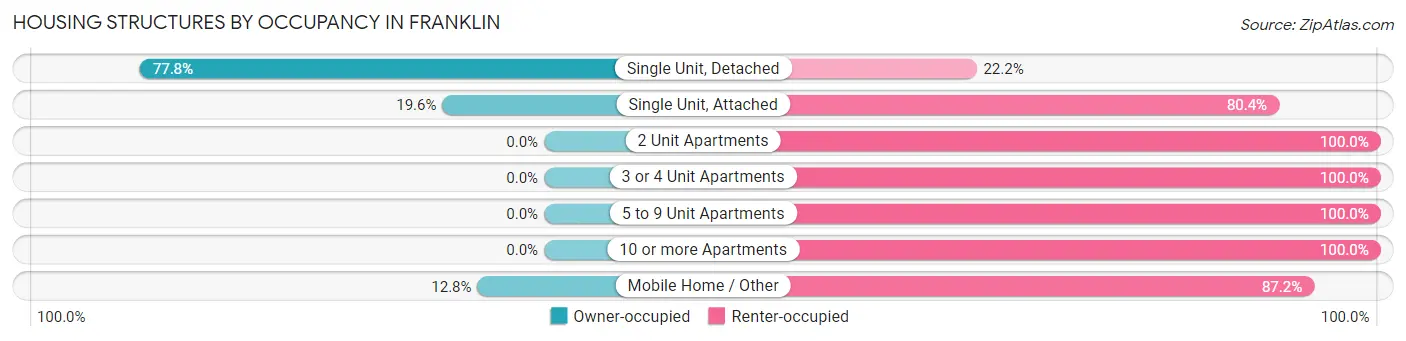
| Structure Type | Owner-occupied | Renter-occupied |
| Single Unit, Detached | 1,840 (77.8%) | 525 (22.2%) |
| Single Unit, Attached | 18 (19.6%) | 74 (80.4%) |
| 2 Unit Apartments | 0 (0.0%) | 283 (100.0%) |
| 3 or 4 Unit Apartments | 0 (0.0%) | 233 (100.0%) |
| 5 to 9 Unit Apartments | 0 (0.0%) | 213 (100.0%) |
| 10 or more Apartments | 0 (0.0%) | 124 (100.0%) |
| Mobile Home / Other | 5 (12.8%) | 34 (87.2%) |
| Total | 1,863 (55.6%) | 1,486 (44.4%) |
Housing Structures by Number of Rooms in Franklin
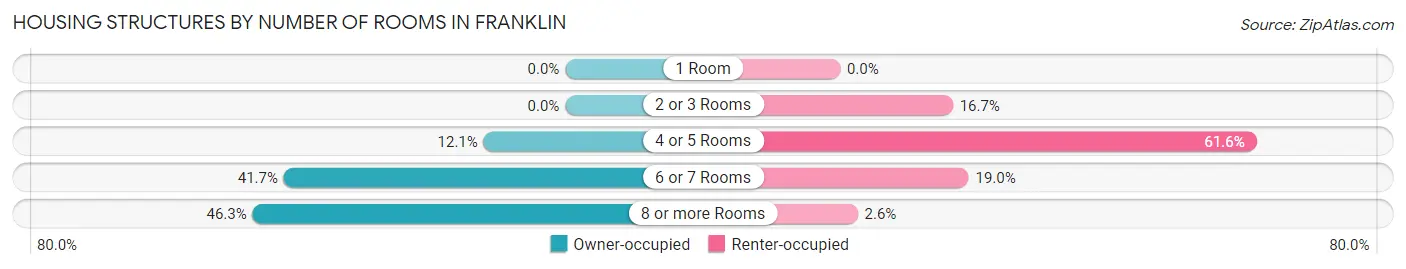
| Number of Rooms | Owner-occupied | Renter-occupied |
| 1 Room | 0 (0.0%) | 0 (0.0%) |
| 2 or 3 Rooms | 0 (0.0%) | 248 (16.7%) |
| 4 or 5 Rooms | 225 (12.1%) | 916 (61.6%) |
| 6 or 7 Rooms | 776 (41.6%) | 283 (19.0%) |
| 8 or more Rooms | 862 (46.3%) | 39 (2.6%) |
| Total | 1,863 (100.0%) | 1,486 (100.0%) |
Housing Structure by Heating Type in Franklin
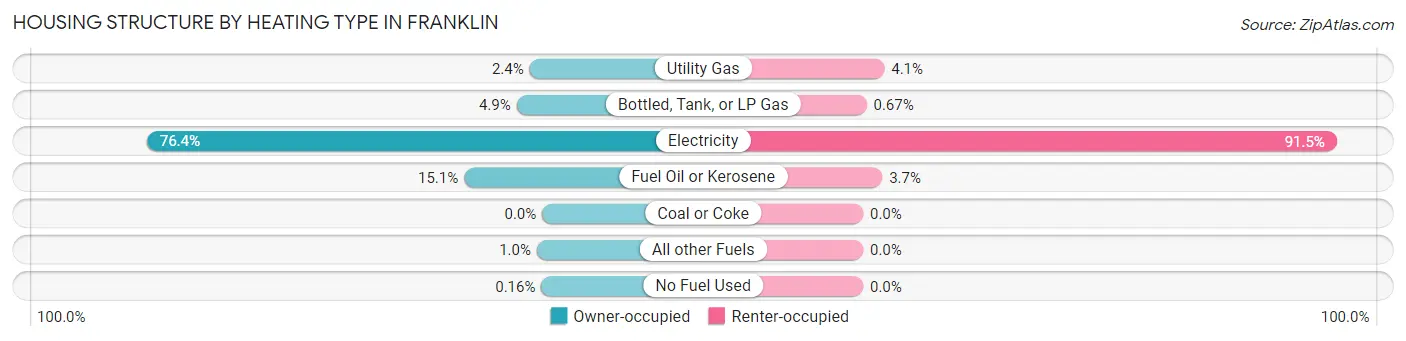
| Heating Type | Owner-occupied | Renter-occupied |
| Utility Gas | 45 (2.4%) | 61 (4.1%) |
| Bottled, Tank, or LP Gas | 92 (4.9%) | 10 (0.7%) |
| Electricity | 1,423 (76.4%) | 1,360 (91.5%) |
| Fuel Oil or Kerosene | 281 (15.1%) | 55 (3.7%) |
| Coal or Coke | 0 (0.0%) | 0 (0.0%) |
| All other Fuels | 19 (1.0%) | 0 (0.0%) |
| No Fuel Used | 3 (0.2%) | 0 (0.0%) |
| Total | 1,863 (100.0%) | 1,486 (100.0%) |
Household Vehicle Usage in Franklin
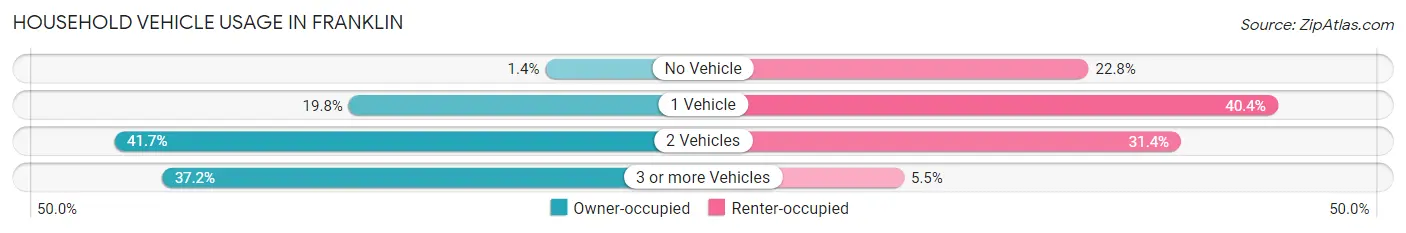
| Vehicles per Household | Owner-occupied | Renter-occupied |
| No Vehicle | 26 (1.4%) | 338 (22.8%) |
| 1 Vehicle | 368 (19.8%) | 600 (40.4%) |
| 2 Vehicles | 776 (41.6%) | 466 (31.4%) |
| 3 or more Vehicles | 693 (37.2%) | 82 (5.5%) |
| Total | 1,863 (100.0%) | 1,486 (100.0%) |
Real Estate & Mortgages in Franklin
Real Estate and Mortgage Overview in Franklin
| Characteristic | Without Mortgage | With Mortgage |
| Housing Units | 810 | 1,053 |
| Median Property Value | $167,900 | $229,800 |
| Median Household Income | $58,658 | $128 |
| Monthly Housing Costs | $532 | $95 |
| Real Estate Taxes | $1,296 | $0 |
Property Value by Mortgage Status in Franklin
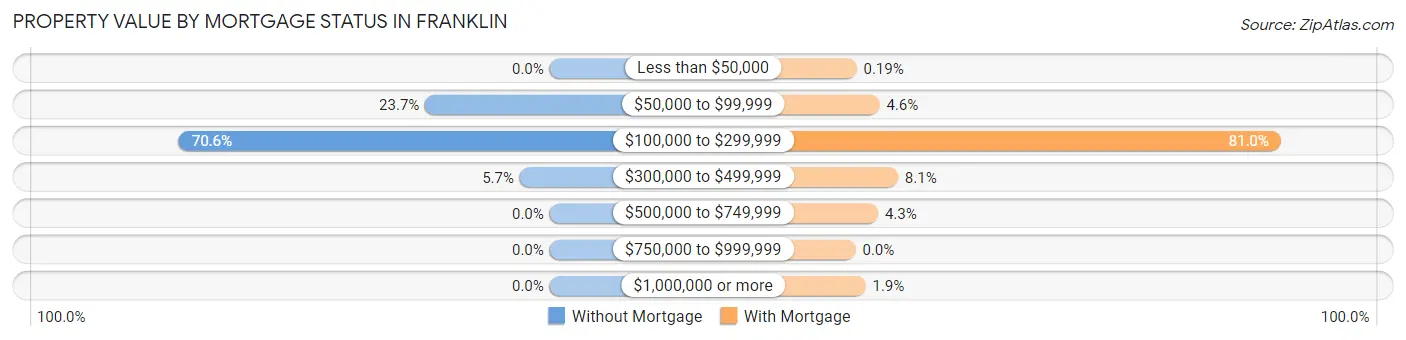
| Property Value | Without Mortgage | With Mortgage |
| Less than $50,000 | 0 (0.0%) | 2 (0.2%) |
| $50,000 to $99,999 | 192 (23.7%) | 48 (4.6%) |
| $100,000 to $299,999 | 572 (70.6%) | 853 (81.0%) |
| $300,000 to $499,999 | 46 (5.7%) | 85 (8.1%) |
| $500,000 to $749,999 | 0 (0.0%) | 45 (4.3%) |
| $750,000 to $999,999 | 0 (0.0%) | 0 (0.0%) |
| $1,000,000 or more | 0 (0.0%) | 20 (1.9%) |
| Total | 810 (100.0%) | 1,053 (100.0%) |
Household Income by Mortgage Status in Franklin
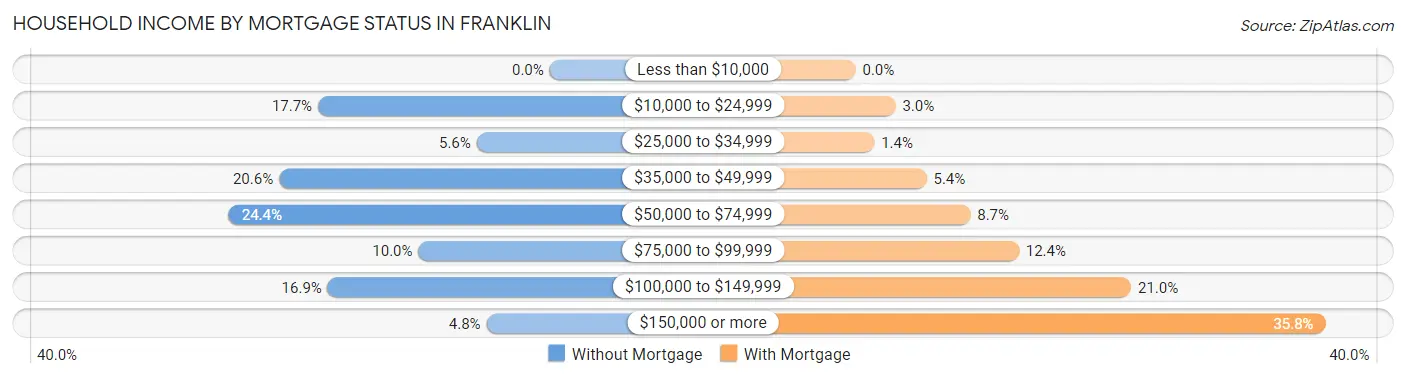
| Household Income | Without Mortgage | With Mortgage |
| Less than $10,000 | 0 (0.0%) | 0 (0.0%) |
| $10,000 to $24,999 | 143 (17.6%) | 32 (3.0%) |
| $25,000 to $34,999 | 45 (5.6%) | 15 (1.4%) |
| $35,000 to $49,999 | 167 (20.6%) | 57 (5.4%) |
| $50,000 to $74,999 | 198 (24.4%) | 92 (8.7%) |
| $75,000 to $99,999 | 81 (10.0%) | 131 (12.4%) |
| $100,000 to $149,999 | 137 (16.9%) | 221 (21.0%) |
| $150,000 or more | 39 (4.8%) | 377 (35.8%) |
| Total | 810 (100.0%) | 1,053 (100.0%) |
Property Value to Household Income Ratio in Franklin
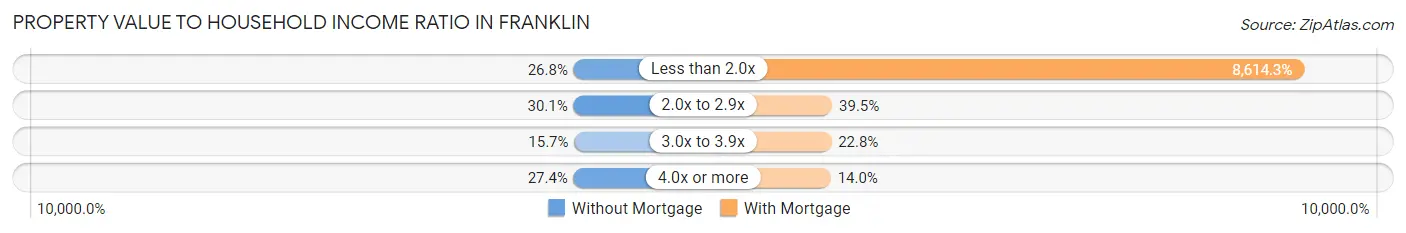
| Value-to-Income Ratio | Without Mortgage | With Mortgage |
| Less than 2.0x | 217 (26.8%) | 90,708 (8,614.2%) |
| 2.0x to 2.9x | 244 (30.1%) | 416 (39.5%) |
| 3.0x to 3.9x | 127 (15.7%) | 240 (22.8%) |
| 4.0x or more | 222 (27.4%) | 147 (14.0%) |
| Total | 810 (100.0%) | 1,053 (100.0%) |
Real Estate Taxes by Mortgage Status in Franklin
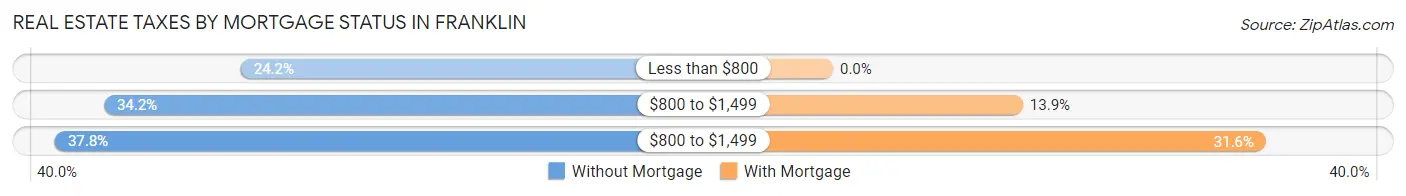
| Property Taxes | Without Mortgage | With Mortgage |
| Less than $800 | 196 (24.2%) | 0 (0.0%) |
| $800 to $1,499 | 277 (34.2%) | 146 (13.9%) |
| $800 to $1,499 | 306 (37.8%) | 333 (31.6%) |
| Total | 810 (100.0%) | 1,053 (100.0%) |
Health & Disability in Franklin
Health Insurance Coverage by Age in Franklin
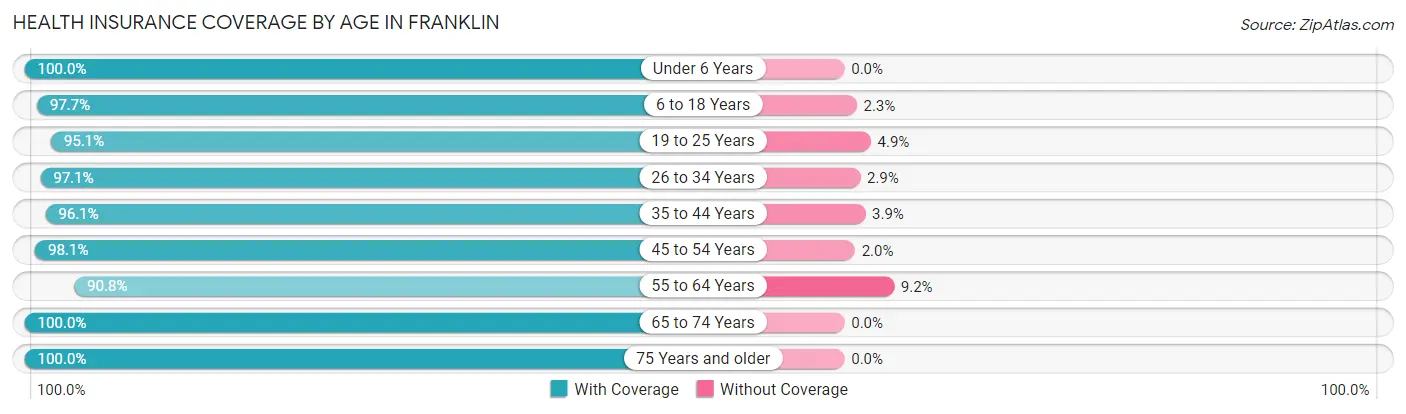
| Age Bracket | With Coverage | Without Coverage |
| Under 6 Years | 776 (100.0%) | 0 (0.0%) |
| 6 to 18 Years | 1,330 (97.7%) | 31 (2.3%) |
| 19 to 25 Years | 466 (95.1%) | 24 (4.9%) |
| 26 to 34 Years | 1,127 (97.1%) | 34 (2.9%) |
| 35 to 44 Years | 818 (96.1%) | 33 (3.9%) |
| 45 to 54 Years | 803 (98.1%) | 16 (1.9%) |
| 55 to 64 Years | 1,071 (90.8%) | 109 (9.2%) |
| 65 to 74 Years | 737 (100.0%) | 0 (0.0%) |
| 75 Years and older | 700 (100.0%) | 0 (0.0%) |
| Total | 7,828 (96.9%) | 247 (3.1%) |
Health Insurance Coverage by Citizenship Status in Franklin
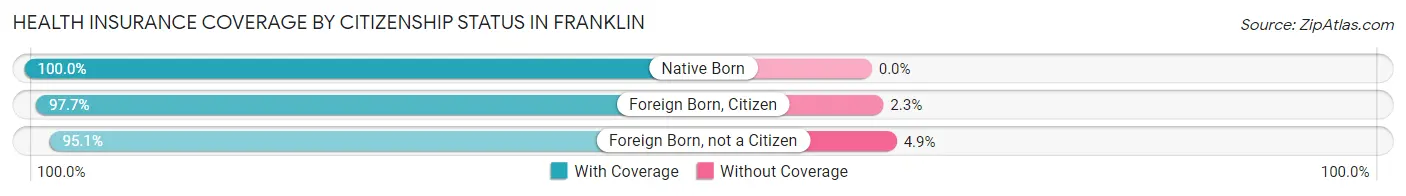
| Citizenship Status | With Coverage | Without Coverage |
| Native Born | 776 (100.0%) | 0 (0.0%) |
| Foreign Born, Citizen | 1,330 (97.7%) | 31 (2.3%) |
| Foreign Born, not a Citizen | 466 (95.1%) | 24 (4.9%) |
Health Insurance Coverage by Household Income in Franklin
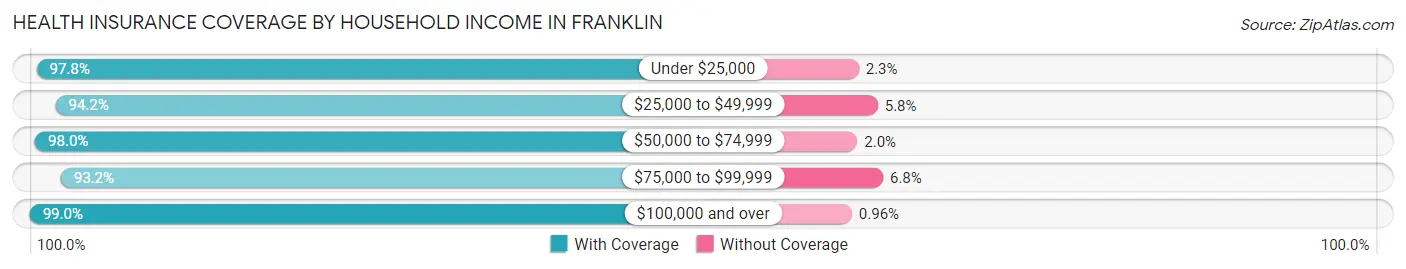
| Household Income | With Coverage | Without Coverage |
| Under $25,000 | 1,261 (97.8%) | 29 (2.2%) |
| $25,000 to $49,999 | 1,556 (94.2%) | 96 (5.8%) |
| $50,000 to $74,999 | 1,734 (98.0%) | 35 (2.0%) |
| $75,000 to $99,999 | 878 (93.2%) | 64 (6.8%) |
| $100,000 and over | 2,384 (99.0%) | 23 (1.0%) |
Public vs Private Health Insurance Coverage by Age in Franklin
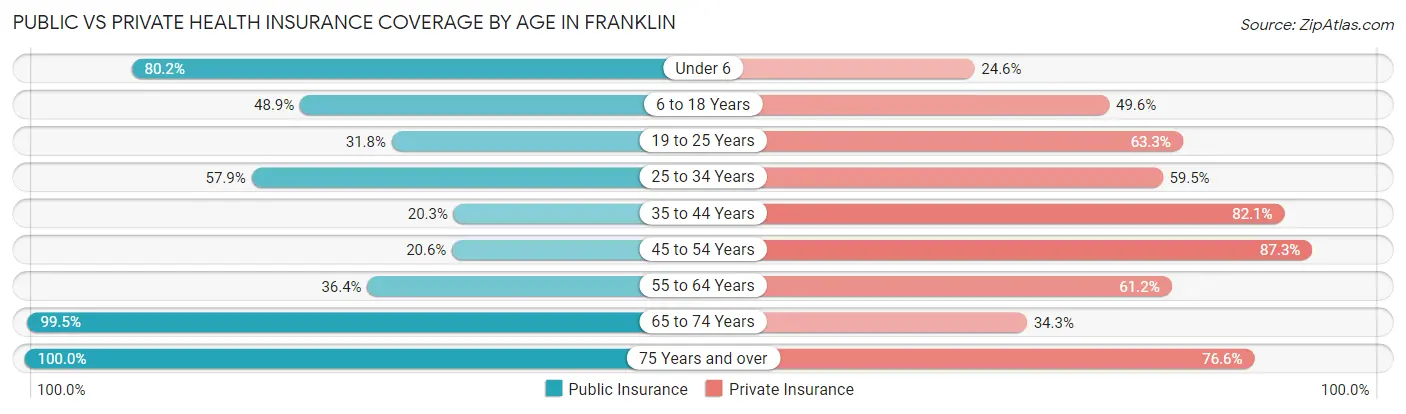
| Age Bracket | Public Insurance | Private Insurance |
| Under 6 | 622 (80.1%) | 191 (24.6%) |
| 6 to 18 Years | 665 (48.9%) | 675 (49.6%) |
| 19 to 25 Years | 156 (31.8%) | 310 (63.3%) |
| 25 to 34 Years | 672 (57.9%) | 691 (59.5%) |
| 35 to 44 Years | 173 (20.3%) | 699 (82.1%) |
| 45 to 54 Years | 169 (20.6%) | 715 (87.3%) |
| 55 to 64 Years | 429 (36.4%) | 722 (61.2%) |
| 65 to 74 Years | 733 (99.5%) | 253 (34.3%) |
| 75 Years and over | 700 (100.0%) | 536 (76.6%) |
| Total | 4,319 (53.5%) | 4,792 (59.3%) |
Disability Status by Sex by Age in Franklin
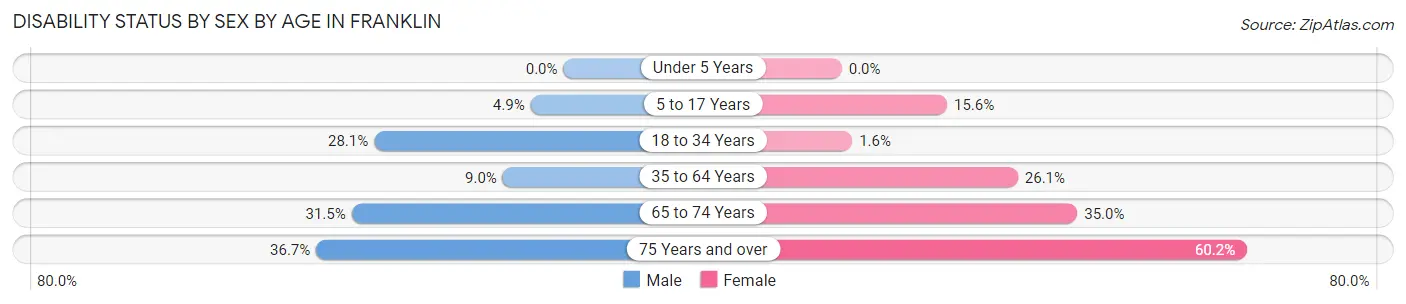
| Age Bracket | Male | Female |
| Under 5 Years | 0 (0.0%) | 0 (0.0%) |
| 5 to 17 Years | 40 (4.9%) | 106 (15.6%) |
| 18 to 34 Years | 219 (28.1%) | 14 (1.5%) |
| 35 to 64 Years | 112 (9.0%) | 420 (26.1%) |
| 65 to 74 Years | 78 (31.5%) | 171 (35.0%) |
| 75 Years and over | 127 (36.7%) | 213 (60.2%) |
Disability Class by Sex by Age in Franklin
Disability Class: Hearing Difficulty
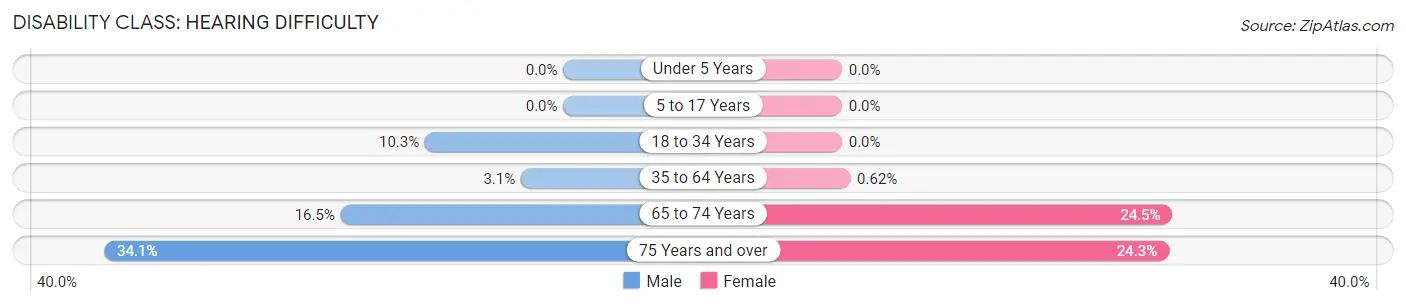
| Age Bracket | Male | Female |
| Under 5 Years | 0 (0.0%) | 0 (0.0%) |
| 5 to 17 Years | 0 (0.0%) | 0 (0.0%) |
| 18 to 34 Years | 80 (10.3%) | 0 (0.0%) |
| 35 to 64 Years | 39 (3.1%) | 10 (0.6%) |
| 65 to 74 Years | 41 (16.5%) | 120 (24.5%) |
| 75 Years and over | 118 (34.1%) | 86 (24.3%) |
Disability Class: Vision Difficulty
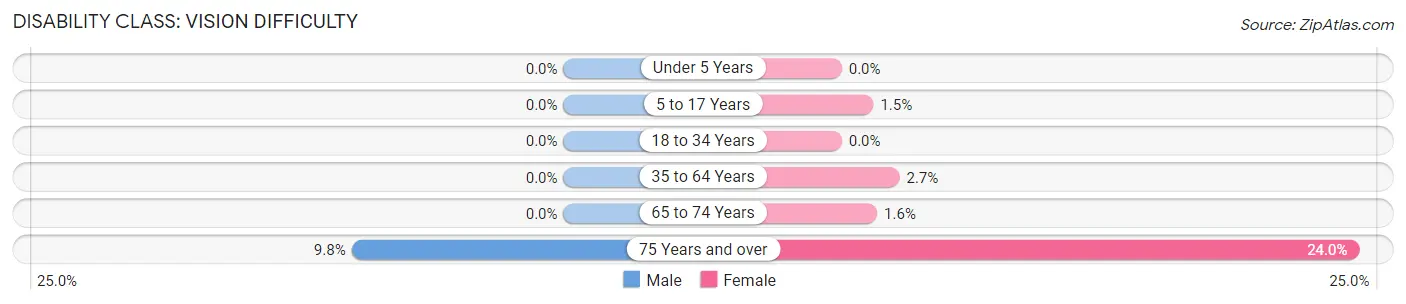
| Age Bracket | Male | Female |
| Under 5 Years | 0 (0.0%) | 0 (0.0%) |
| 5 to 17 Years | 0 (0.0%) | 10 (1.5%) |
| 18 to 34 Years | 0 (0.0%) | 0 (0.0%) |
| 35 to 64 Years | 0 (0.0%) | 43 (2.7%) |
| 65 to 74 Years | 0 (0.0%) | 8 (1.6%) |
| 75 Years and over | 34 (9.8%) | 85 (24.0%) |
Disability Class: Cognitive Difficulty
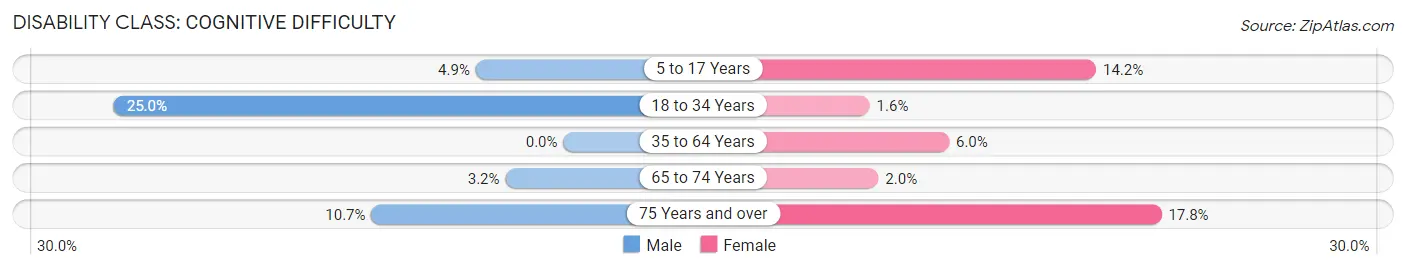
| Age Bracket | Male | Female |
| 5 to 17 Years | 40 (4.9%) | 96 (14.2%) |
| 18 to 34 Years | 195 (25.0%) | 14 (1.5%) |
| 35 to 64 Years | 0 (0.0%) | 96 (6.0%) |
| 65 to 74 Years | 8 (3.2%) | 10 (2.0%) |
| 75 Years and over | 37 (10.7%) | 63 (17.8%) |
Disability Class: Ambulatory Difficulty
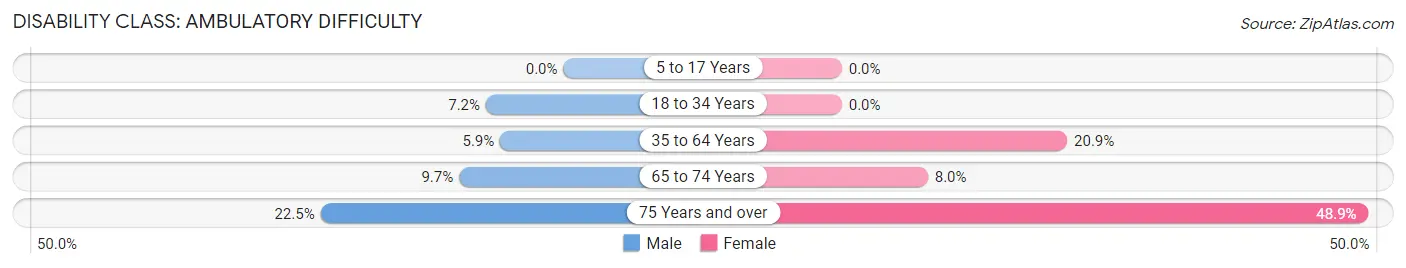
| Age Bracket | Male | Female |
| 5 to 17 Years | 0 (0.0%) | 0 (0.0%) |
| 18 to 34 Years | 56 (7.2%) | 0 (0.0%) |
| 35 to 64 Years | 73 (5.9%) | 336 (20.9%) |
| 65 to 74 Years | 24 (9.7%) | 39 (8.0%) |
| 75 Years and over | 78 (22.5%) | 173 (48.9%) |
Disability Class: Self-Care Difficulty
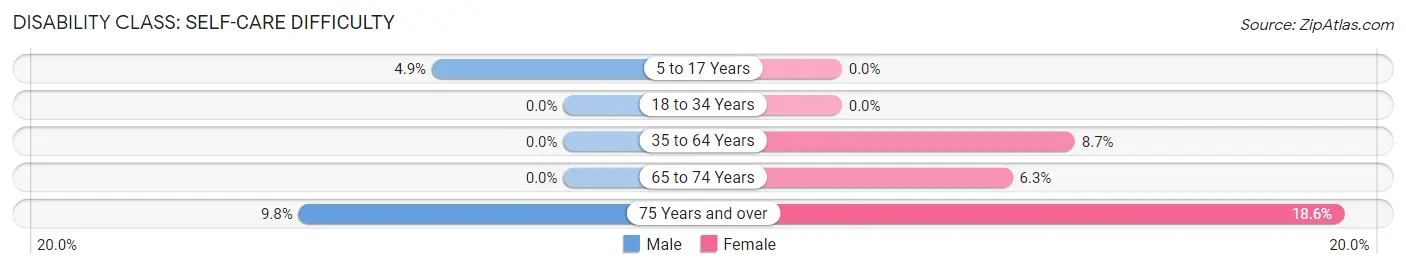
| Age Bracket | Male | Female |
| 5 to 17 Years | 40 (4.9%) | 0 (0.0%) |
| 18 to 34 Years | 0 (0.0%) | 0 (0.0%) |
| 35 to 64 Years | 0 (0.0%) | 139 (8.6%) |
| 65 to 74 Years | 0 (0.0%) | 31 (6.3%) |
| 75 Years and over | 34 (9.8%) | 66 (18.6%) |
Technology Access in Franklin
Computing Device Access in Franklin
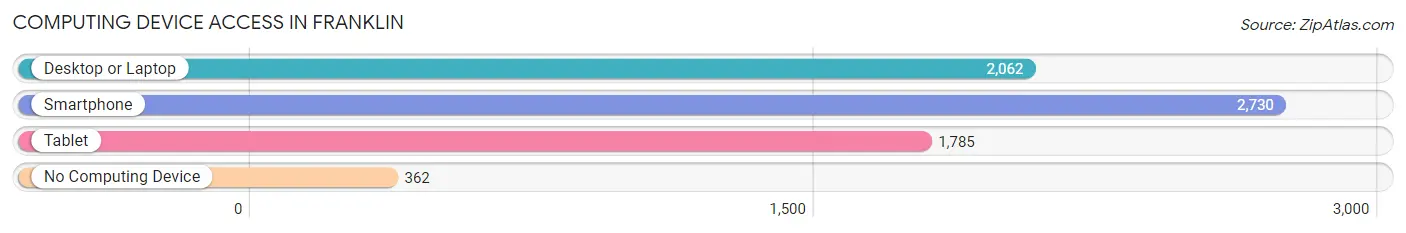
| Device Type | # Households | % Households |
| Desktop or Laptop | 2,062 | 61.6% |
| Smartphone | 2,730 | 81.5% |
| Tablet | 1,785 | 53.3% |
| No Computing Device | 362 | 10.8% |
| Total | 3,349 | 100.0% |
Internet Access in Franklin
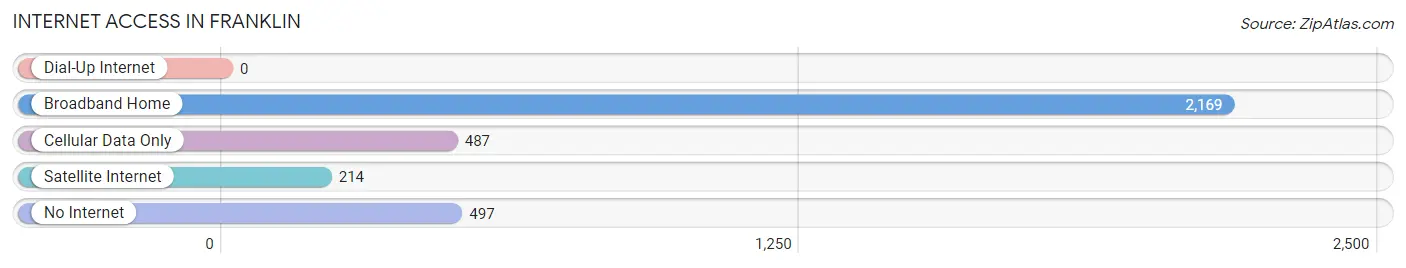
| Internet Type | # Households | % Households |
| Dial-Up Internet | 0 | 0.0% |
| Broadband Home | 2,169 | 64.8% |
| Cellular Data Only | 487 | 14.5% |
| Satellite Internet | 214 | 6.4% |
| No Internet | 497 | 14.8% |
| Total | 3,349 | 100.0% |
Franklin Summary
Franklin, Virginia is a small city located in the southeastern part of the state, in Southampton County. It is situated on the Blackwater River, about 30 miles northwest of Norfolk. The city has a population of 8,582, according to the 2010 census, and is the county seat of Southampton County.
History
The area that is now Franklin was first settled in the early 1700s by English colonists. The city was officially established in 1786 and named after Benjamin Franklin. It was incorporated as a town in 1820 and as a city in 1887.
Franklin was an important port city during the 19th century, and it was a major center for the slave trade. The city was also a major center for the Confederate Army during the Civil War. After the war, the city experienced a period of economic decline, but it was revitalized in the early 20th century with the arrival of the railroad.
Geography
Franklin is located in the southeastern part of Virginia, in Southampton County. It is situated on the Blackwater River, about 30 miles northwest of Norfolk. The city has a total area of 8.3 square miles, of which 8.2 square miles is land and 0.1 square miles is water.
The city is located in a humid subtropical climate zone, with hot, humid summers and mild winters. The average annual temperature is around 62 degrees Fahrenheit, and the average annual precipitation is around 45 inches.
Economy
Franklin’s economy is largely based on agriculture and manufacturing. The city is home to several large agricultural operations, including Smithfield Foods, which is the largest pork producer in the world. The city is also home to several manufacturing companies, including Franklin Industries, which produces furniture and other wood products.
The city is also home to several retail stores, restaurants, and other businesses. The city’s largest employer is the Southampton County Public Schools, which employs over 1,000 people.
Demographics
According to the 2010 census, Franklin has a population of 8,582. The racial makeup of the city is 73.3% White, 22.2% African American, 0.4% Native American, 0.7% Asian, 0.1% Pacific Islander, 1.3% from other races, and 2.0% from two or more races.
The median household income in Franklin is $37,945, and the median family income is $45,938. The per capita income in the city is $19,945. The poverty rate in Franklin is 22.3%, which is higher than the national average.
Franklin is served by the Southampton County Public Schools, which includes four elementary schools, one middle school, and one high school. The city is also home to Paul D. Camp Community College, which offers a variety of associate degree and certificate programs.
Common Questions
What is Per Capita Income in Franklin?
Per Capita income in Franklin is $29,683.
What is the Median Family Income in Franklin?
Median Family Income in Franklin is $71,886.
What is the Median Household income in Franklin?
Median Household Income in Franklin is $57,537.
What is Income or Wage Gap in Franklin?
Income or Wage Gap in Franklin is 26.0%.
Women in Franklin earn 74.0 cents for every dollar earned by a man.
What is Family Income Deficit in Franklin?
Family Income Deficit in Franklin is $13,154.
Families that are below poverty line in Franklin earn $13,154 less on average than the poverty threshold level.
What is Inequality or Gini Index in Franklin?
Inequality or Gini Index in Franklin is 0.43.
What is the Total Population of Franklin?
Total Population of Franklin is 8,194.
What is the Total Male Population of Franklin?
Total Male Population of Franklin is 3,921.
What is the Total Female Population of Franklin?
Total Female Population of Franklin is 4,273.
What is the Ratio of Males per 100 Females in Franklin?
There are 91.76 Males per 100 Females in Franklin.
What is the Ratio of Females per 100 Males in Franklin?
There are 108.98 Females per 100 Males in Franklin.
What is the Median Population Age in Franklin?
Median Population Age in Franklin is 38.8 Years.
What is the Average Family Size in Franklin
Average Family Size in Franklin is 3.1 People.
What is the Average Household Size in Franklin
Average Household Size in Franklin is 2.4 People.
How Large is the Labor Force in Franklin?
There are 3,643 People in the Labor Forcein in Franklin.
What is the Percentage of People in the Labor Force in Franklin?
58.1% of People are in the Labor Force in Franklin.
What is the Unemployment Rate in Franklin?
Unemployment Rate in Franklin is 5.3%.