Ferrum, VA Map & Demographics
Ferrum Map
Ferrum Overview
$13,150
PER CAPITA INCOME
$47,120
AVG FAMILY INCOME
$33,967
AVG HOUSEHOLD INCOME
8.1%
WAGE / INCOME GAP [ % ]
91.9¢/ $1
WAGE / INCOME GAP [ $ ]
0.53
INEQUALITY / GINI INDEX
1,717
TOTAL POPULATION
848
MALE POPULATION
869
FEMALE POPULATION
97.58
MALES / 100 FEMALES
102.48
FEMALES / 100 MALES
21.3
MEDIAN AGE
2.6
AVG FAMILY SIZE
1.9
AVG HOUSEHOLD SIZE
876
LABOR FORCE [ PEOPLE ]
54.6%
PERCENT IN LABOR FORCE
6.5%
UNEMPLOYMENT RATE
Ferrum Zip Codes
Ferrum Area Codes
Income in Ferrum
Income Overview in Ferrum
Per Capita Income in Ferrum is $13,150, while median incomes of families and households are $47,120 and $33,967 respectively.
| Characteristic | Number | Measure |
| Per Capita Income | 1,717 | $13,150 |
| Median Family Income | 209 | $47,120 |
| Mean Family Income | 209 | $68,389 |
| Median Household Income | 377 | $33,967 |
| Mean Household Income | 377 | $45,780 |
| Income Deficit | 209 | $0 |
| Wage / Income Gap (%) | 1,717 | 8.15% |
| Wage / Income Gap ($) | 1,717 | 91.85¢ per $1 |
| Gini / Inequality Index | 1,717 | 0.53 |
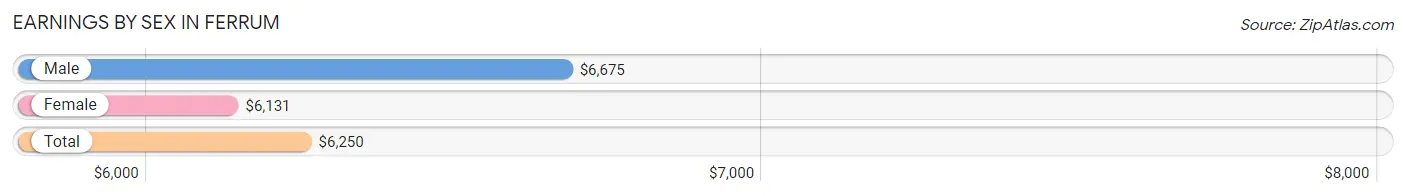
Earnings by Sex in Ferrum
Average Earnings in Ferrum are $6,250, $6,675 for men and $6,131 for women, a difference of 8.2%.
| Sex | Number | Average Earnings |
| Male | 513 (46.6%) | $6,675 |
| Female | 587 (53.4%) | $6,131 |
| Total | 1,100 (100.0%) | $6,250 |
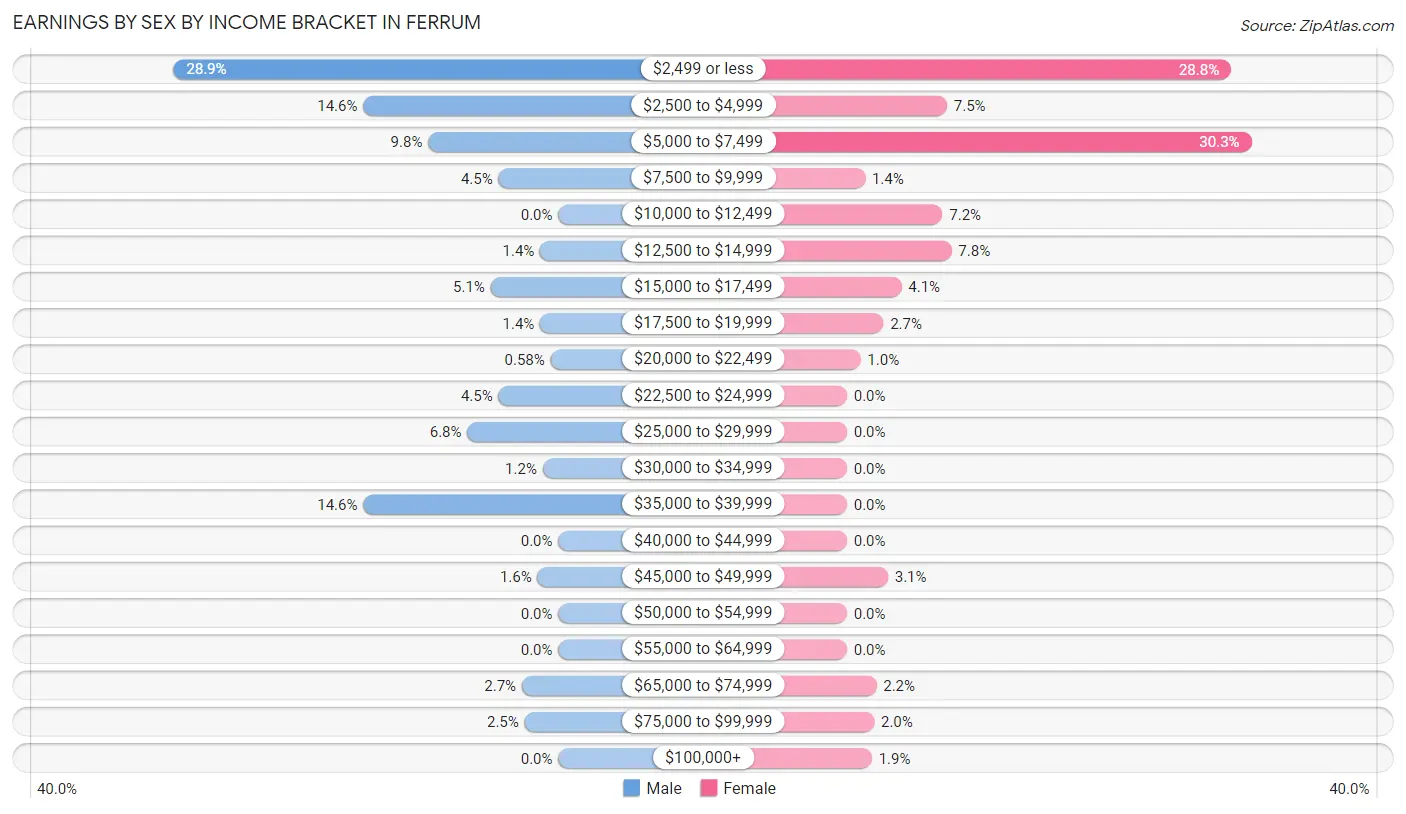
Earnings by Sex by Income Bracket in Ferrum
The most common earnings brackets in Ferrum are $2,499 or less for men (148 | 28.8%) and $5,000 to $7,499 for women (178 | 30.3%).
| Income | Male | Female |
| $2,499 or less | 148 (28.8%) | 169 (28.8%) |
| $2,500 to $4,999 | 75 (14.6%) | 44 (7.5%) |
| $5,000 to $7,499 | 50 (9.8%) | 178 (30.3%) |
| $7,500 to $9,999 | 23 (4.5%) | 8 (1.4%) |
| $10,000 to $12,499 | 0 (0.0%) | 42 (7.2%) |
| $12,500 to $14,999 | 7 (1.4%) | 46 (7.8%) |
| $15,000 to $17,499 | 26 (5.1%) | 24 (4.1%) |
| $17,500 to $19,999 | 7 (1.4%) | 16 (2.7%) |
| $20,000 to $22,499 | 3 (0.6%) | 6 (1.0%) |
| $22,500 to $24,999 | 23 (4.5%) | 0 (0.0%) |
| $25,000 to $29,999 | 35 (6.8%) | 0 (0.0%) |
| $30,000 to $34,999 | 6 (1.2%) | 0 (0.0%) |
| $35,000 to $39,999 | 75 (14.6%) | 0 (0.0%) |
| $40,000 to $44,999 | 0 (0.0%) | 0 (0.0%) |
| $45,000 to $49,999 | 8 (1.6%) | 18 (3.1%) |
| $50,000 to $54,999 | 0 (0.0%) | 0 (0.0%) |
| $55,000 to $64,999 | 0 (0.0%) | 0 (0.0%) |
| $65,000 to $74,999 | 14 (2.7%) | 13 (2.2%) |
| $75,000 to $99,999 | 13 (2.5%) | 12 (2.0%) |
| $100,000+ | 0 (0.0%) | 11 (1.9%) |
| Total | 513 (100.0%) | 587 (100.0%) |
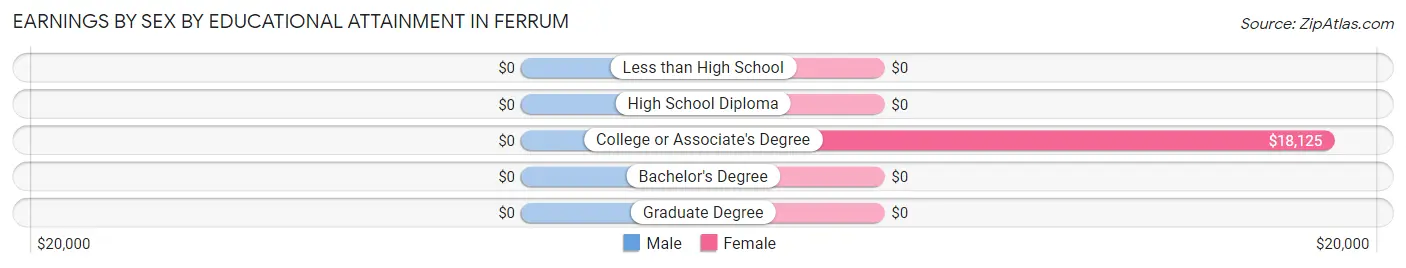
Earnings by Sex by Educational Attainment in Ferrum
| Educational Attainment | Male Income | Female Income |
| Less than High School | - | - |
| High School Diploma | - | - |
| College or Associate's Degree | - | - |
| Bachelor's Degree | - | - |
| Graduate Degree | - | - |
| Total | $26,574 | $49,375 |
Family Income in Ferrum
Family Income Brackets in Ferrum
According to the Ferrum family income data, there are 55 families falling into the $15,000 to $24,999 income range, which is the most common income bracket and makes up 26.3% of all families.
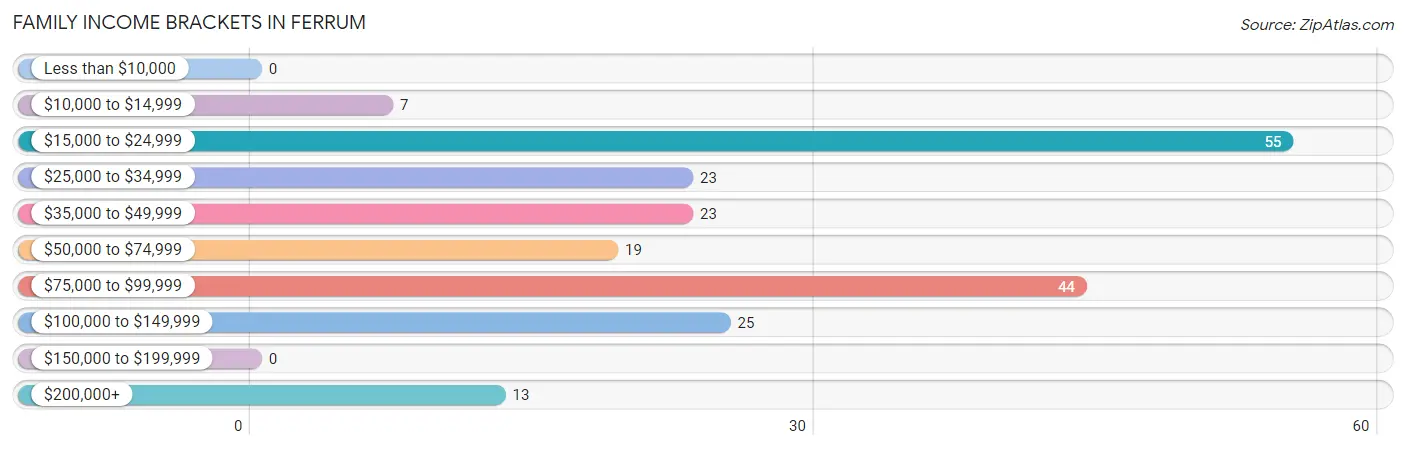
| Income Bracket | # Families | % Families |
| Less than $10,000 | 0 | 0.0% |
| $10,000 to $14,999 | 7 | 3.3% |
| $15,000 to $24,999 | 55 | 26.3% |
| $25,000 to $34,999 | 23 | 11.0% |
| $35,000 to $49,999 | 23 | 11.0% |
| $50,000 to $74,999 | 19 | 9.1% |
| $75,000 to $99,999 | 44 | 21.1% |
| $100,000 to $149,999 | 25 | 12.0% |
| $150,000 to $199,999 | 0 | 0.0% |
| $200,000+ | 13 | 6.2% |
Family Income by Famaliy Size in Ferrum
2-person families (92 | 44.0%) account for the highest median family income in Ferrum with $98,333 per family, while 2-person families (92 | 44.0%) have the highest median income of $49,166 per family member.
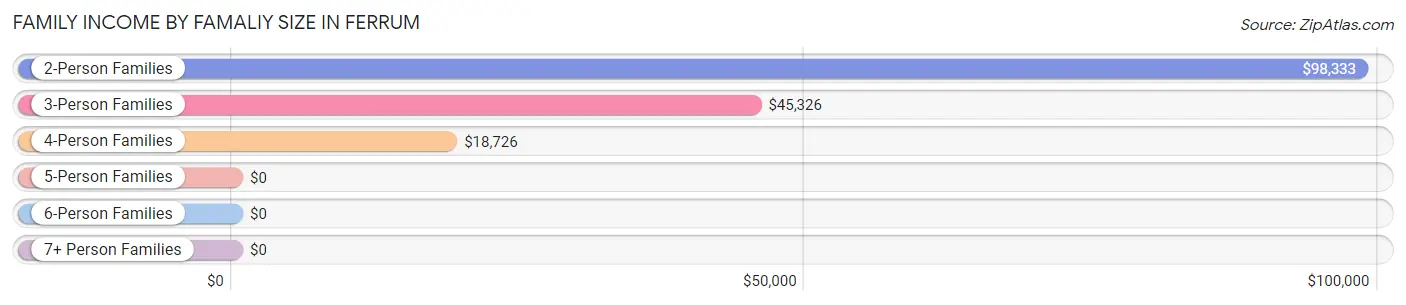
| Income Bracket | # Families | Median Income |
| 2-Person Families | 92 (44.0%) | $98,333 |
| 3-Person Families | 52 (24.9%) | $45,326 |
| 4-Person Families | 65 (31.1%) | $18,726 |
| 5-Person Families | 0 (0.0%) | $0 |
| 6-Person Families | 0 (0.0%) | $0 |
| 7+ Person Families | 0 (0.0%) | $0 |
| Total | 209 (100.0%) | $47,120 |
Family Income by Number of Earners in Ferrum
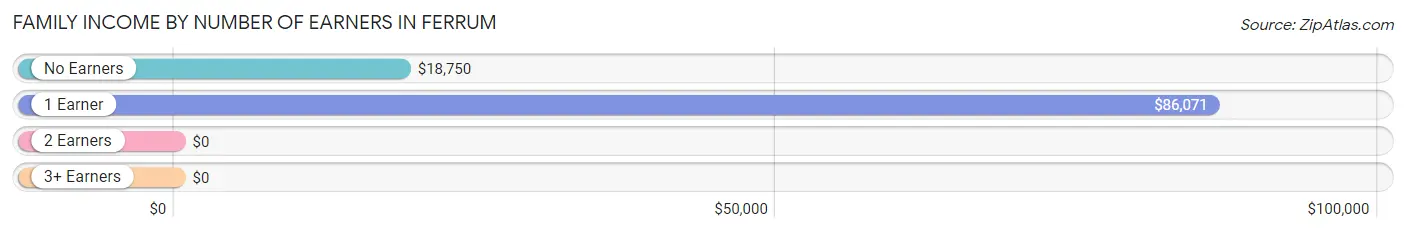
| Number of Earners | # Families | Median Income |
| No Earners | 69 (33.0%) | $18,750 |
| 1 Earner | 78 (37.3%) | $86,071 |
| 2 Earners | 56 (26.8%) | $0 |
| 3+ Earners | 6 (2.9%) | $0 |
| Total | 209 (100.0%) | $47,120 |
Household Income in Ferrum
Household Income Brackets in Ferrum
With 93 households falling in the category, the $15,000 to $24,999 income range is the most frequent in Ferrum, accounting for 24.7% of all households.
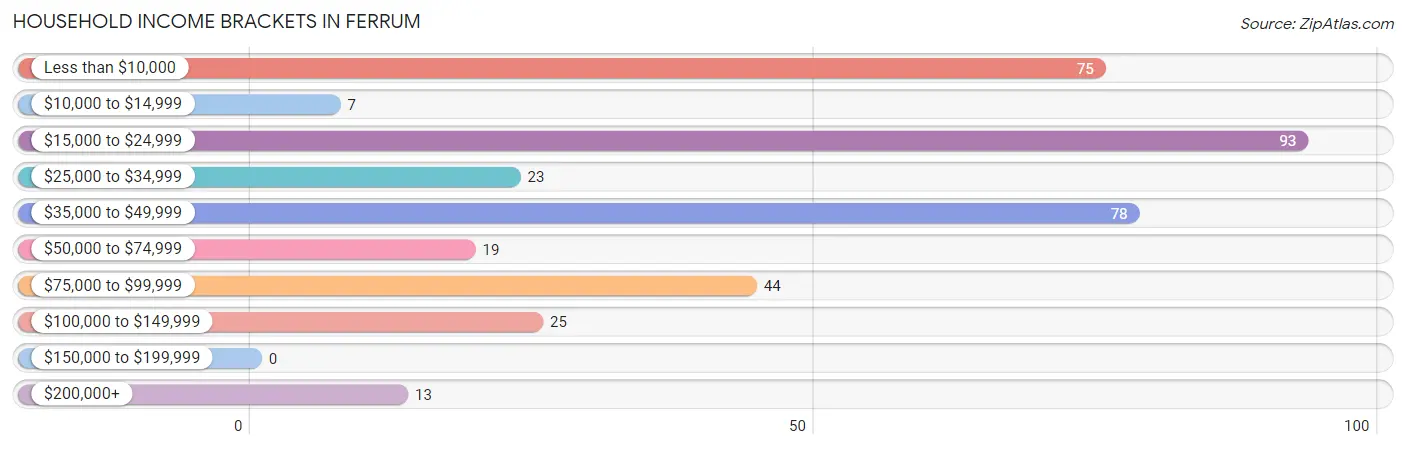
| Income Bracket | # Households | % Households |
| Less than $10,000 | 75 | 19.9% |
| $10,000 to $14,999 | 7 | 1.9% |
| $15,000 to $24,999 | 93 | 24.7% |
| $25,000 to $34,999 | 23 | 6.1% |
| $35,000 to $49,999 | 78 | 20.7% |
| $50,000 to $74,999 | 19 | 5.0% |
| $75,000 to $99,999 | 44 | 11.7% |
| $100,000 to $149,999 | 25 | 6.6% |
| $150,000 to $199,999 | 0 | 0.0% |
| $200,000+ | 13 | 3.4% |
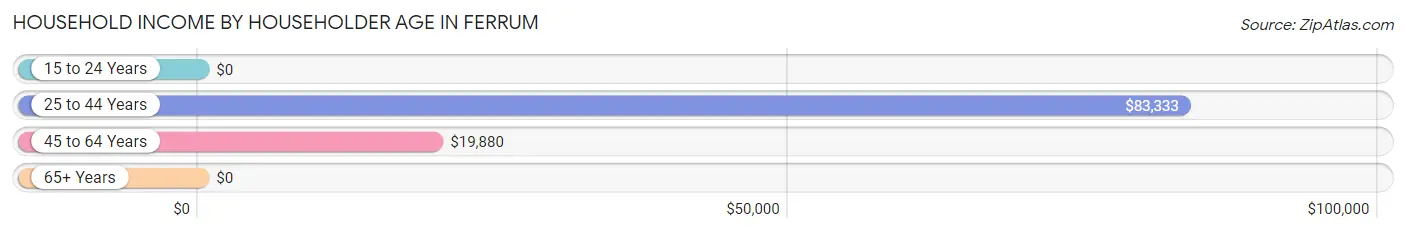
Household Income by Householder Age in Ferrum
The median household income in Ferrum is $33,967, with the highest median household income of $83,333 found in the 25 to 44 years age bracket for the primary householder. A total of 30 households (8.0%) fall into this category. Meanwhile, the 15 to 24 years age bracket for the primary householder has the lowest median household income of $0, with 68 households (18.0%) in this group.
| Income Bracket | # Households | Median Income |
| 15 to 24 Years | 68 (18.0%) | $0 |
| 25 to 44 Years | 30 (8.0%) | $83,333 |
| 45 to 64 Years | 197 (52.2%) | $19,880 |
| 65+ Years | 82 (21.7%) | $0 |
| Total | 377 (100.0%) | $33,967 |
Poverty in Ferrum
Income Below Poverty by Sex and Age in Ferrum
With 33.0% poverty level for males and 43.1% for females among the residents of Ferrum, under 5 year old males and 5 year old females are the most vulnerable to poverty, with 5 males (100.0%) and 20 females (100.0%) in their respective age groups living below the poverty level.
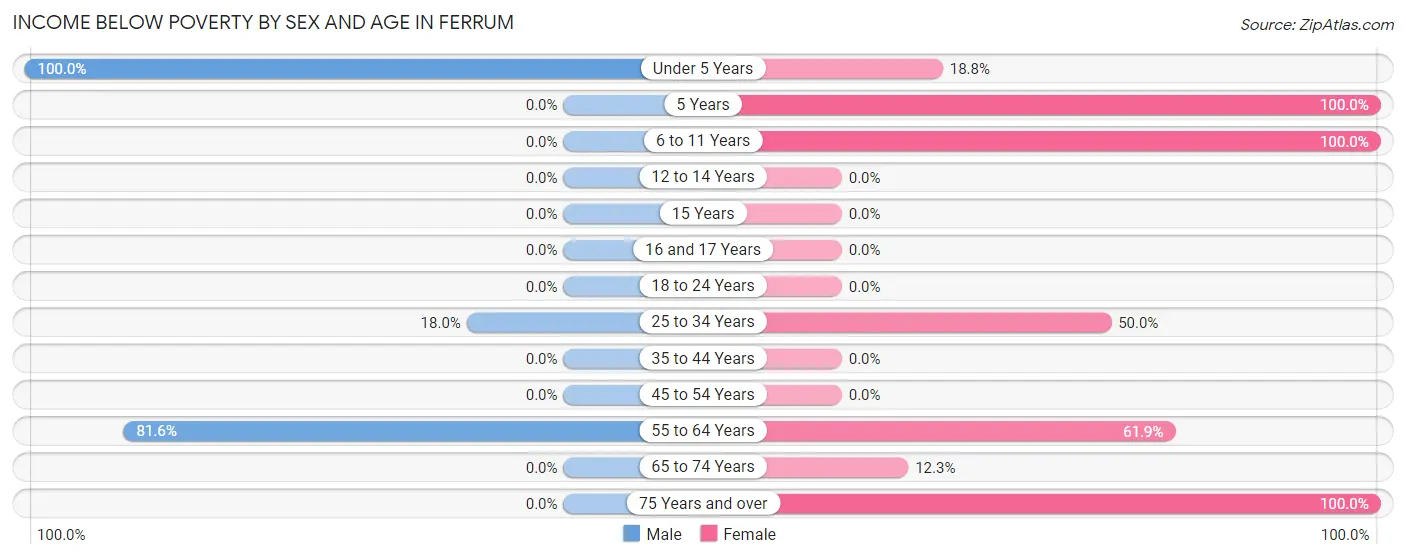
| Age Bracket | Male | Female |
| Under 5 Years | 5 (100.0%) | 6 (18.8%) |
| 5 Years | 0 (0.0%) | 20 (100.0%) |
| 6 to 11 Years | 0 (0.0%) | 40 (100.0%) |
| 12 to 14 Years | 0 (0.0%) | 0 (0.0%) |
| 15 Years | 0 (0.0%) | 0 (0.0%) |
| 16 and 17 Years | 0 (0.0%) | 0 (0.0%) |
| 18 to 24 Years | 0 (0.0%) | 0 (0.0%) |
| 25 to 34 Years | 7 (17.9%) | 6 (50.0%) |
| 35 to 44 Years | 0 (0.0%) | 0 (0.0%) |
| 45 to 54 Years | 0 (0.0%) | 0 (0.0%) |
| 55 to 64 Years | 111 (81.6%) | 52 (61.9%) |
| 65 to 74 Years | 0 (0.0%) | 9 (12.3%) |
| 75 Years and over | 0 (0.0%) | 17 (100.0%) |
| Total | 123 (33.0%) | 150 (43.1%) |
Income Above Poverty by Sex and Age in Ferrum
According to the poverty statistics in Ferrum, males aged 6 to 11 years and females aged 18 to 24 years are the age groups that are most secure financially, with 100.0% of males and 100.0% of females in these age groups living above the poverty line.
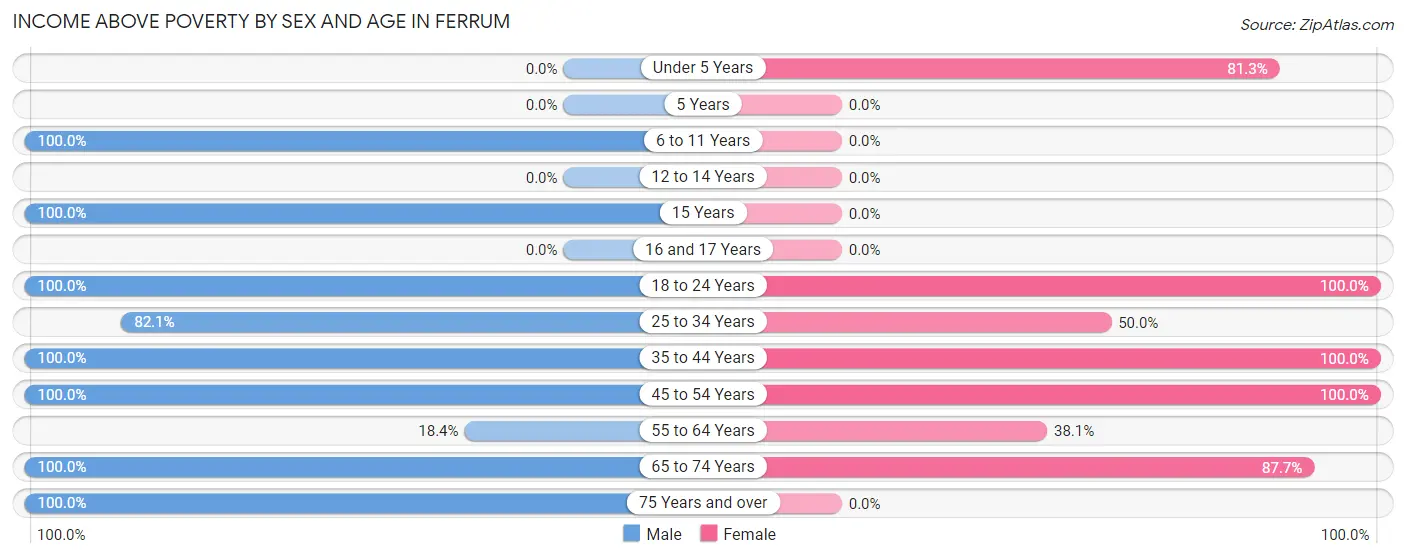
| Age Bracket | Male | Female |
| Under 5 Years | 0 (0.0%) | 26 (81.2%) |
| 5 Years | 0 (0.0%) | 0 (0.0%) |
| 6 to 11 Years | 10 (100.0%) | 0 (0.0%) |
| 12 to 14 Years | 0 (0.0%) | 0 (0.0%) |
| 15 Years | 6 (100.0%) | 0 (0.0%) |
| 16 and 17 Years | 0 (0.0%) | 0 (0.0%) |
| 18 to 24 Years | 77 (100.0%) | 21 (100.0%) |
| 25 to 34 Years | 32 (82.1%) | 6 (50.0%) |
| 35 to 44 Years | 6 (100.0%) | 17 (100.0%) |
| 45 to 54 Years | 59 (100.0%) | 32 (100.0%) |
| 55 to 64 Years | 25 (18.4%) | 32 (38.1%) |
| 65 to 74 Years | 27 (100.0%) | 64 (87.7%) |
| 75 Years and over | 8 (100.0%) | 0 (0.0%) |
| Total | 250 (67.0%) | 198 (56.9%) |
Income Below Poverty Among Married-Couple Families in Ferrum
The poverty statistics for married-couple families in Ferrum show that 30.9% or 59 of the total 191 families live below the poverty line. Families with 1 or 2 children have the highest poverty rate of 62.8%, comprising of 59 families. On the other hand, families with no children have the lowest poverty rate of 0.0%, which includes 0 families.
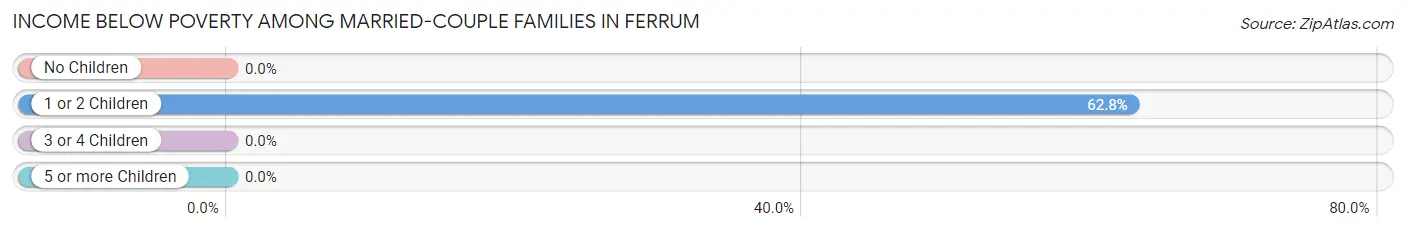
| Children | Above Poverty | Below Poverty |
| No Children | 97 (100.0%) | 0 (0.0%) |
| 1 or 2 Children | 35 (37.2%) | 59 (62.8%) |
| 3 or 4 Children | 0 (0.0%) | 0 (0.0%) |
| 5 or more Children | 0 (0.0%) | 0 (0.0%) |
| Total | 132 (69.1%) | 59 (30.9%) |
Income Below Poverty Among Single-Parent Households in Ferrum
| Children | Single Father | Single Mother |
| No Children | 0 (0.0%) | 0 (0.0%) |
| 1 or 2 Children | 0 (0.0%) | 0 (0.0%) |
| 3 or 4 Children | 0 (0.0%) | 0 (0.0%) |
| 5 or more Children | 0 (0.0%) | 0 (0.0%) |
| Total | 0 (0.0%) | 0 (0.0%) |
Income Below Poverty Among Married-Couple vs Single-Parent Households in Ferrum
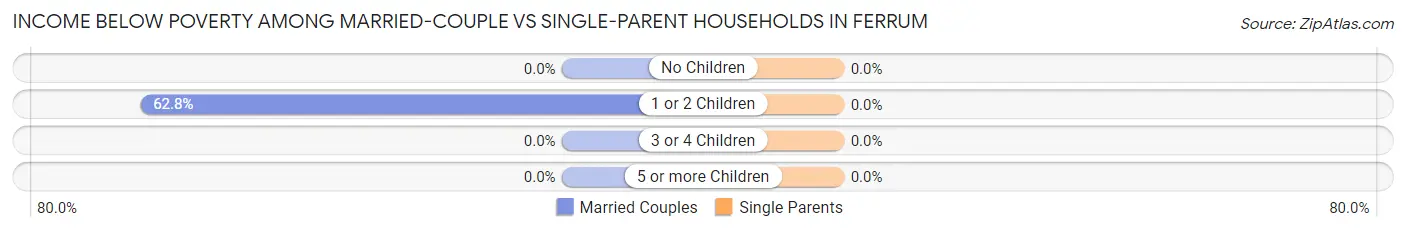
| Children | Married-Couple Families | Single-Parent Households |
| No Children | 0 (0.0%) | 0 (0.0%) |
| 1 or 2 Children | 59 (62.8%) | 0 (0.0%) |
| 3 or 4 Children | 0 (0.0%) | 0 (0.0%) |
| 5 or more Children | 0 (0.0%) | 0 (0.0%) |
| Total | 59 (30.9%) | 0 (0.0%) |
Race in Ferrum
The most populous races in Ferrum are White / Caucasian (1,171 | 68.2%), Black / African American (455 | 26.5%), and Hispanic or Latino (96 | 5.6%).
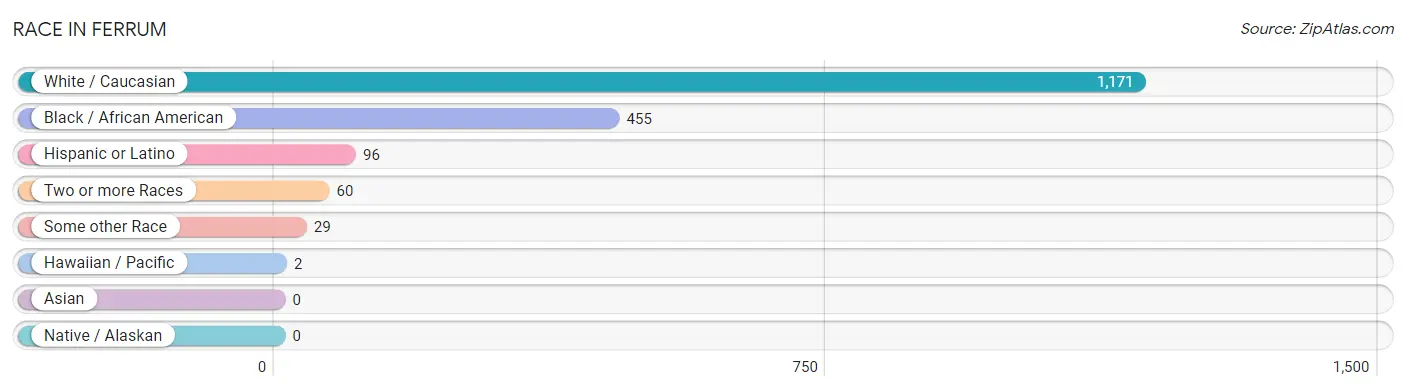
| Race | # Population | % Population |
| Asian | 0 | 0.0% |
| Black / African American | 455 | 26.5% |
| Hawaiian / Pacific | 2 | 0.1% |
| Hispanic or Latino | 96 | 5.6% |
| Native / Alaskan | 0 | 0.0% |
| White / Caucasian | 1,171 | 68.2% |
| Two or more Races | 60 | 3.5% |
| Some other Race | 29 | 1.7% |
| Total | 1,717 | 100.0% |
Ancestry in Ferrum
The most populous ancestries reported in Ferrum are American (375 | 21.8%), English (147 | 8.6%), Scottish (74 | 4.3%), German (52 | 3.0%), and Welsh (50 | 2.9%), together accounting for 40.6% of all Ferrum residents.
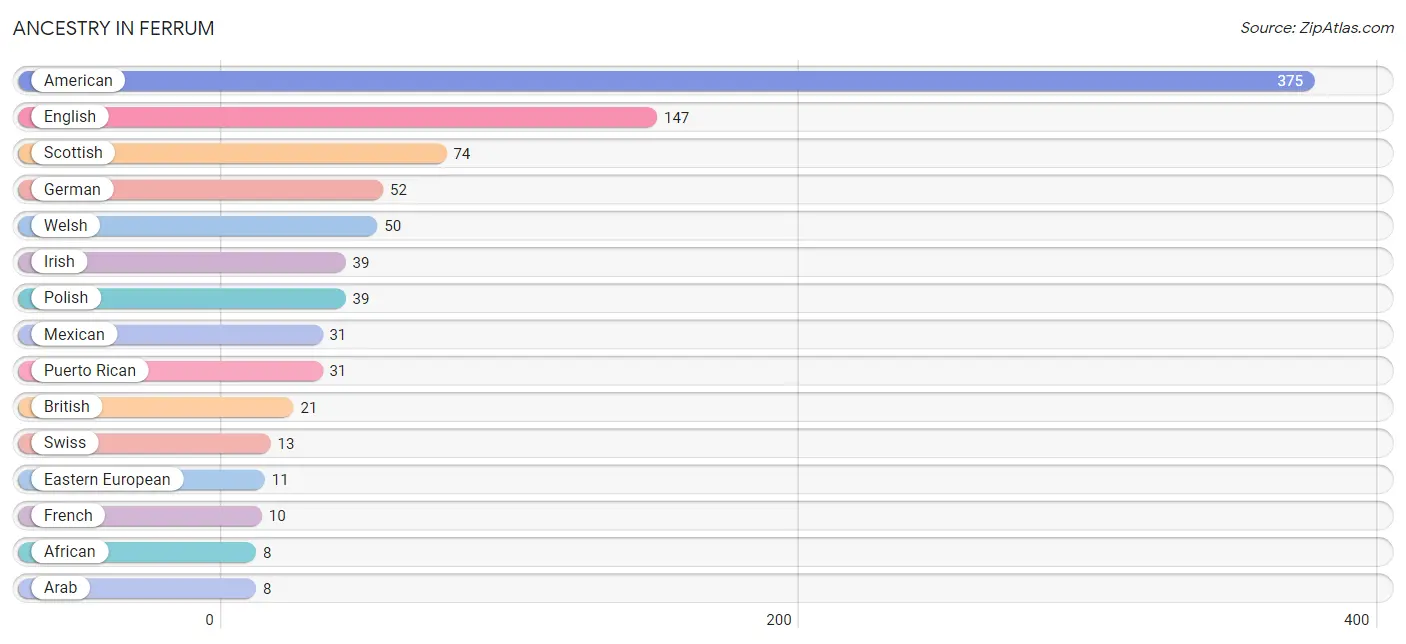
| Ancestry | # Population | % Population |
| African | 8 | 0.5% |
| American | 375 | 21.8% |
| Arab | 8 | 0.5% |
| Bhutanese | 3 | 0.2% |
| British | 21 | 1.2% |
| Cuban | 2 | 0.1% |
| Eastern European | 11 | 0.6% |
| English | 147 | 8.6% |
| French | 10 | 0.6% |
| German | 52 | 3.0% |
| Irish | 39 | 2.3% |
| Mexican | 31 | 1.8% |
| Native Hawaiian | 2 | 0.1% |
| Palestinian | 8 | 0.5% |
| Polish | 39 | 2.3% |
| Puerto Rican | 31 | 1.8% |
| Scottish | 74 | 4.3% |
| Subsaharan African | 8 | 0.5% |
| Swiss | 13 | 0.8% |
| Welsh | 50 | 2.9% | View All 20 Rows |
Immigrants in Ferrum
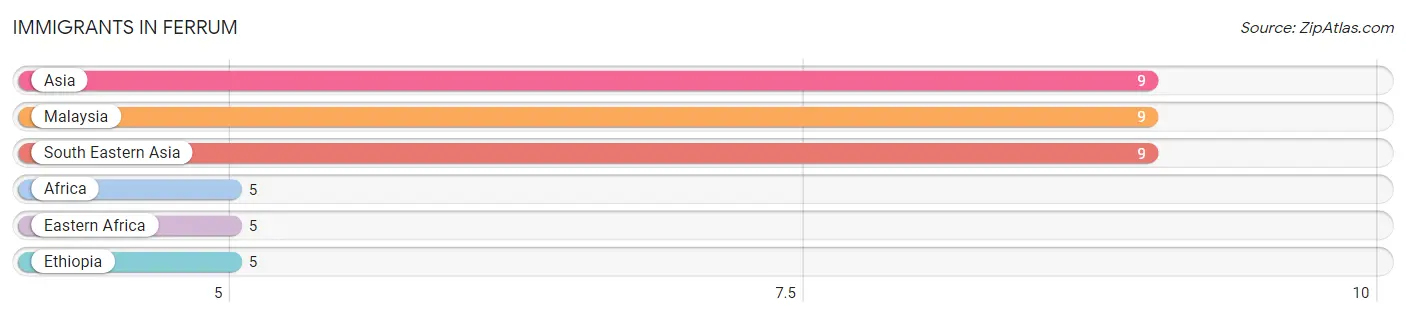
The most numerous immigrant groups reported in Ferrum came from Asia (9 | 0.5%), Malaysia (9 | 0.5%), South Eastern Asia (9 | 0.5%), Africa (5 | 0.3%), and Eastern Africa (5 | 0.3%), together accounting for 2.1% of all Ferrum residents.
| Immigration Origin | # Population | % Population |
| Africa | 5 | 0.3% |
| Asia | 9 | 0.5% |
| Eastern Africa | 5 | 0.3% |
| Ethiopia | 5 | 0.3% |
| Malaysia | 9 | 0.5% |
| South Eastern Asia | 9 | 0.5% | View All 6 Rows |
Sex and Age in Ferrum
Sex and Age in Ferrum
The most populous age groups in Ferrum are 20 to 24 Years (317 | 37.4%) for men and 15 to 19 Years (288 | 33.1%) for women.
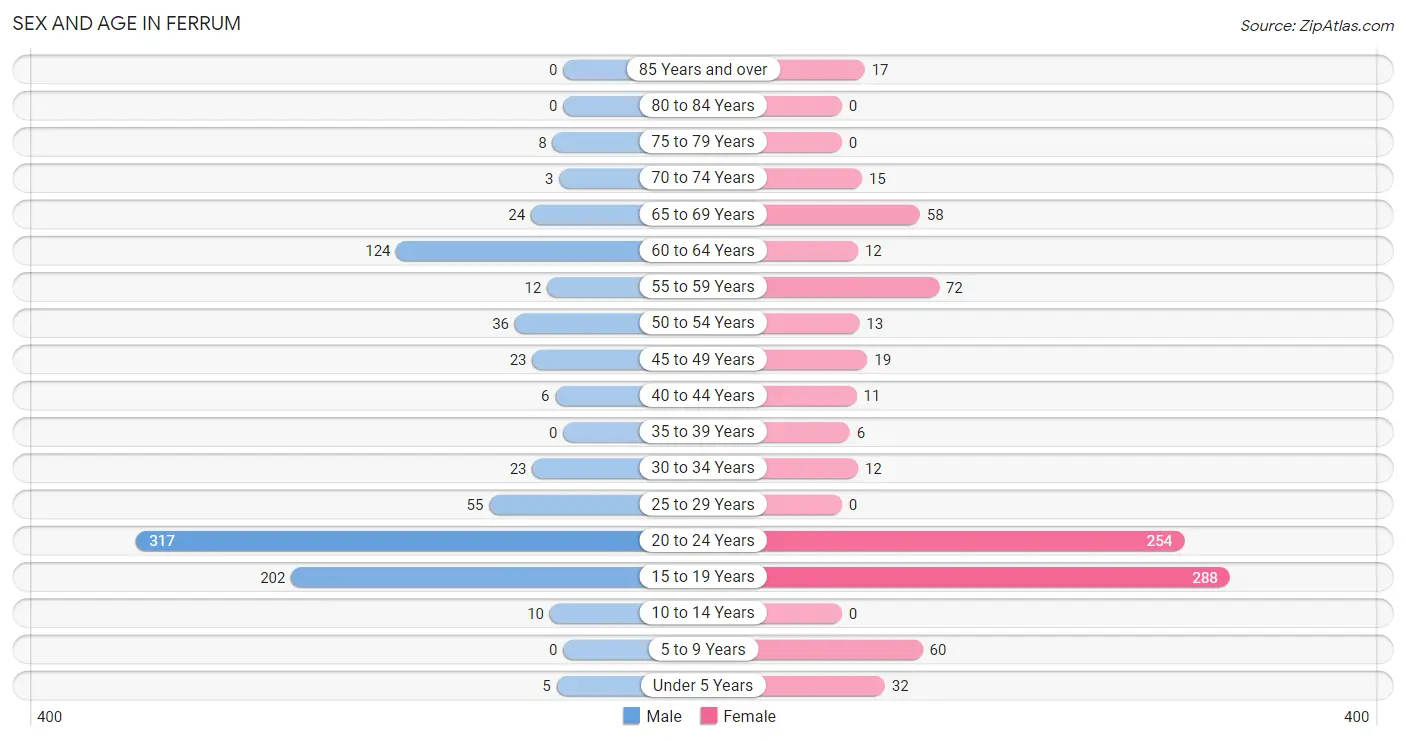
| Age Bracket | Male | Female |
| Under 5 Years | 5 (0.6%) | 32 (3.7%) |
| 5 to 9 Years | 0 (0.0%) | 60 (6.9%) |
| 10 to 14 Years | 10 (1.2%) | 0 (0.0%) |
| 15 to 19 Years | 202 (23.8%) | 288 (33.1%) |
| 20 to 24 Years | 317 (37.4%) | 254 (29.2%) |
| 25 to 29 Years | 55 (6.5%) | 0 (0.0%) |
| 30 to 34 Years | 23 (2.7%) | 12 (1.4%) |
| 35 to 39 Years | 0 (0.0%) | 6 (0.7%) |
| 40 to 44 Years | 6 (0.7%) | 11 (1.3%) |
| 45 to 49 Years | 23 (2.7%) | 19 (2.2%) |
| 50 to 54 Years | 36 (4.3%) | 13 (1.5%) |
| 55 to 59 Years | 12 (1.4%) | 72 (8.3%) |
| 60 to 64 Years | 124 (14.6%) | 12 (1.4%) |
| 65 to 69 Years | 24 (2.8%) | 58 (6.7%) |
| 70 to 74 Years | 3 (0.4%) | 15 (1.7%) |
| 75 to 79 Years | 8 (0.9%) | 0 (0.0%) |
| 80 to 84 Years | 0 (0.0%) | 0 (0.0%) |
| 85 Years and over | 0 (0.0%) | 17 (2.0%) |
| Total | 848 (100.0%) | 869 (100.0%) |
Families and Households in Ferrum
Median Family Size in Ferrum
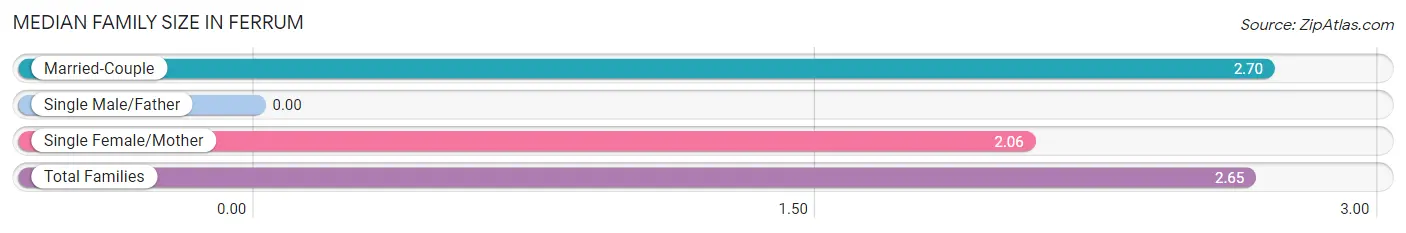
| Family Type | # Families | Family Size |
| Married-Couple | 191 (91.4%) | 2.70 |
| Single Male/Father | 0 (0.0%) | - |
| Single Female/Mother | 18 (8.6%) | 2.06 |
| Total Families | 209 (100.0%) | 2.65 |
Median Household Size in Ferrum
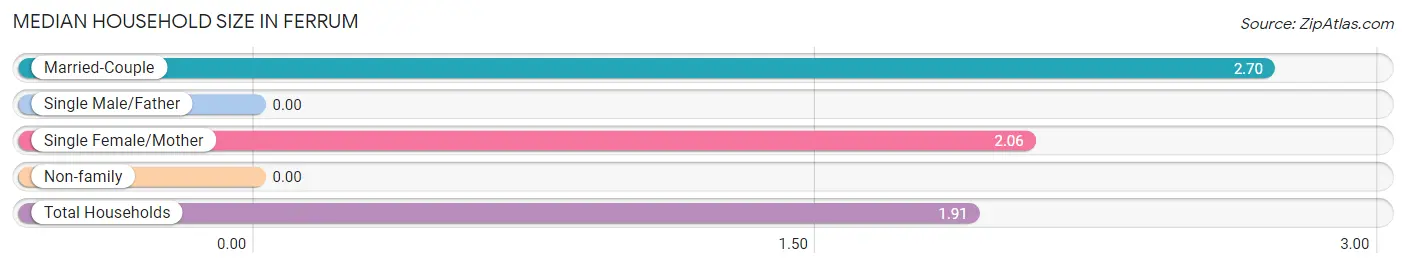
| Household Type | # Households | Household Size |
| Married-Couple | 191 (50.7%) | 2.70 |
| Single Male/Father | 0 (0.0%) | - |
| Single Female/Mother | 18 (4.8%) | 2.06 |
| Non-family | 168 (44.6%) | - |
| Total Households | 377 (100.0%) | 1.91 |
Household Size by Marriage Status in Ferrum
Out of a total of 377 households in Ferrum, 209 (55.4%) are family households, while 168 (44.6%) are nonfamily households. The most numerous type of family households are 2-person households, comprising 92, and the most common type of nonfamily households are 1-person households, comprising 168.
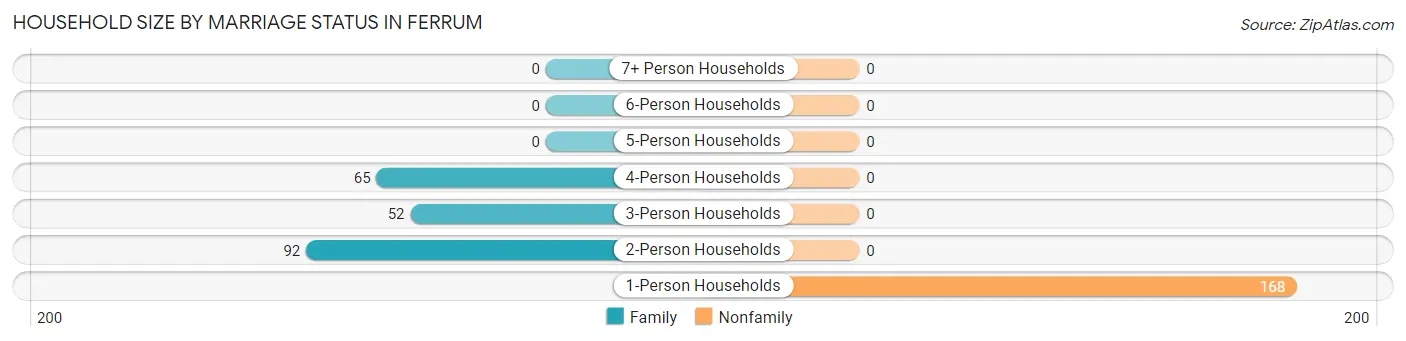
| Household Size | Family Households | Nonfamily Households |
| 1-Person Households | - | 168 (44.6%) |
| 2-Person Households | 92 (24.4%) | 0 (0.0%) |
| 3-Person Households | 52 (13.8%) | 0 (0.0%) |
| 4-Person Households | 65 (17.2%) | 0 (0.0%) |
| 5-Person Households | 0 (0.0%) | 0 (0.0%) |
| 6-Person Households | 0 (0.0%) | 0 (0.0%) |
| 7+ Person Households | 0 (0.0%) | 0 (0.0%) |
| Total | 209 (55.4%) | 168 (44.6%) |
Female Fertility in Ferrum
Fertility by Age in Ferrum
| Age Bracket | Women with Births | Births / 1,000 Women |
| 15 to 19 years | 0 (0.0%) | 0.0 |
| 20 to 34 years | 0 (0.0%) | 0.0 |
| 35 to 50 years | 0 (0.0%) | 0.0 |
| Total | 0 (0.0%) | 0.0 |
Fertility by Age by Marriage Status in Ferrum
| Age Bracket | Married | Unmarried |
| 15 to 19 years | 0 (0.0%) | 0 (0.0%) |
| 20 to 34 years | 0 (0.0%) | 0 (0.0%) |
| 35 to 50 years | 0 (0.0%) | 0 (0.0%) |
| Total | 0 (0.0%) | 0 (0.0%) |
Fertility by Education in Ferrum
| Educational Attainment | Women with Births | Births / 1,000 Women |
| Less than High School | 0 (0.0%) | 0.0 |
| High School Diploma | 0 (0.0%) | 0.0 |
| College or Associate's Degree | 0 (0.0%) | 0.0 |
| Bachelor's Degree | 0 (0.0%) | 0.0 |
| Graduate Degree | 0 (0.0%) | 0.0 |
| Total | 0 (0.0%) | 0.0 |
Fertility by Education by Marriage Status in Ferrum
| Educational Attainment | Married | Unmarried |
| Less than High School | 0 (0.0%) | 0 (0.0%) |
| High School Diploma | 0 (0.0%) | 0 (0.0%) |
| College or Associate's Degree | 0 (0.0%) | 0 (0.0%) |
| Bachelor's Degree | 0 (0.0%) | 0 (0.0%) |
| Graduate Degree | 0 (0.0%) | 0 (0.0%) |
| Total | 0 (0.0%) | 0 (0.0%) |
Employment Characteristics in Ferrum
Employment by Class of Employer in Ferrum
Among the 775 employed individuals in Ferrum, private company employees (492 | 63.5%), state government employees (95 | 12.3%), and local government employees (80 | 10.3%) make up the most common classes of employment.
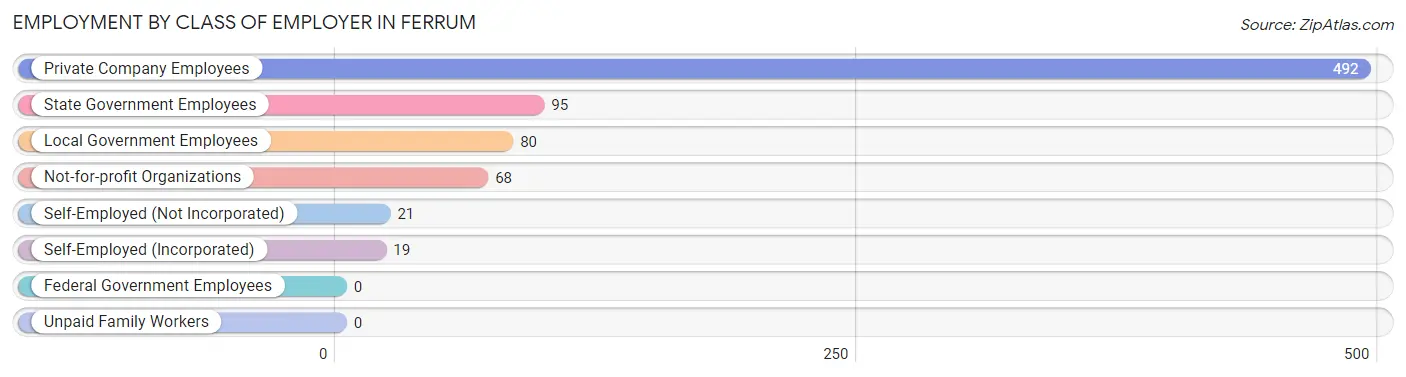
| Employer Class | # Employees | % Employees |
| Private Company Employees | 492 | 63.5% |
| Self-Employed (Incorporated) | 19 | 2.5% |
| Self-Employed (Not Incorporated) | 21 | 2.7% |
| Not-for-profit Organizations | 68 | 8.8% |
| Local Government Employees | 80 | 10.3% |
| State Government Employees | 95 | 12.3% |
| Federal Government Employees | 0 | 0.0% |
| Unpaid Family Workers | 0 | 0.0% |
| Total | 775 | 100.0% |
Employment Status by Age in Ferrum
According to the labor force statistics for Ferrum, out of the total population over 16 years of age (1,604), 54.6% or 876 individuals are in the labor force, with 6.5% or 57 of them unemployed. The age group with the highest labor force participation rate is 25 to 29 years, with 100.0% or 55 individuals in the labor force. Within the labor force, the 55 to 59 years age range has the highest percentage of unemployed individuals, with 37.5% or 12 of them being unemployed.
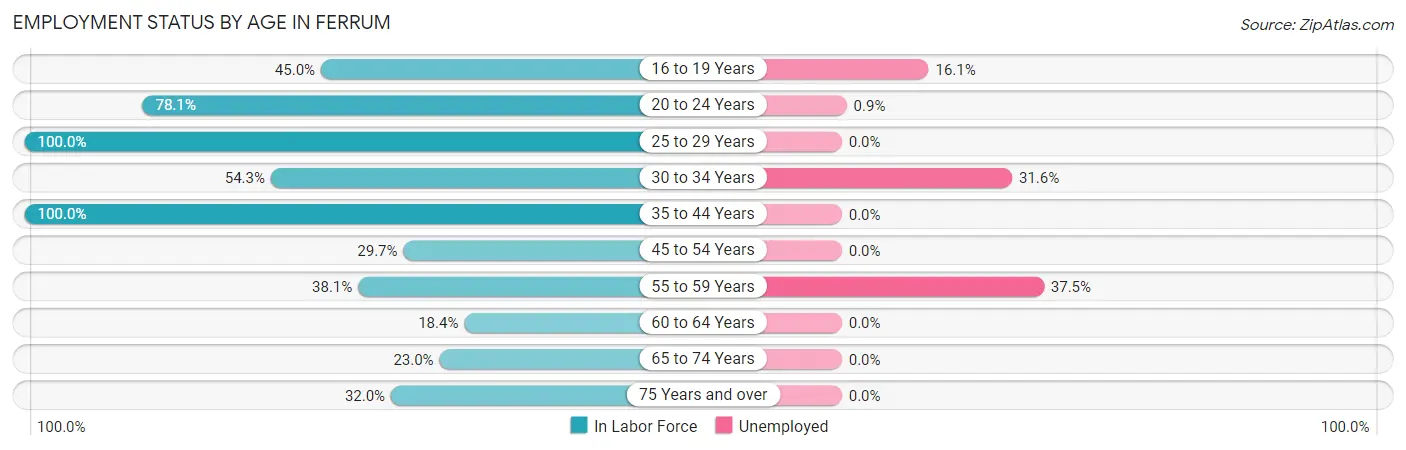
| Age Bracket | In Labor Force | Unemployed |
| 16 to 19 Years | 218 (45.0%) | 35 (16.1%) |
| 20 to 24 Years | 446 (78.1%) | 4 (0.9%) |
| 25 to 29 Years | 55 (100.0%) | 0 (0.0%) |
| 30 to 34 Years | 19 (54.3%) | 6 (31.6%) |
| 35 to 44 Years | 23 (100.0%) | 0 (0.0%) |
| 45 to 54 Years | 27 (29.7%) | 0 (0.0%) |
| 55 to 59 Years | 32 (38.1%) | 12 (37.5%) |
| 60 to 64 Years | 25 (18.4%) | 0 (0.0%) |
| 65 to 74 Years | 23 (23.0%) | 0 (0.0%) |
| 75 Years and over | 8 (32.0%) | 0 (0.0%) |
| Total | 876 (54.6%) | 57 (6.5%) |
Employment Status by Educational Attainment in Ferrum
According to labor force statistics for Ferrum, 42.7% of individuals (181) out of the total population between 25 and 64 years of age (424) are in the labor force, with 9.9% or 18 of them being unemployed. The group with the highest labor force participation rate are those with the educational attainment of bachelor's degree or higher, with 100.0% or 102 individuals in the labor force. Within the labor force, individuals with high school diploma education have the highest percentage of unemployment, with 100.0% or 6 of them being unemployed.
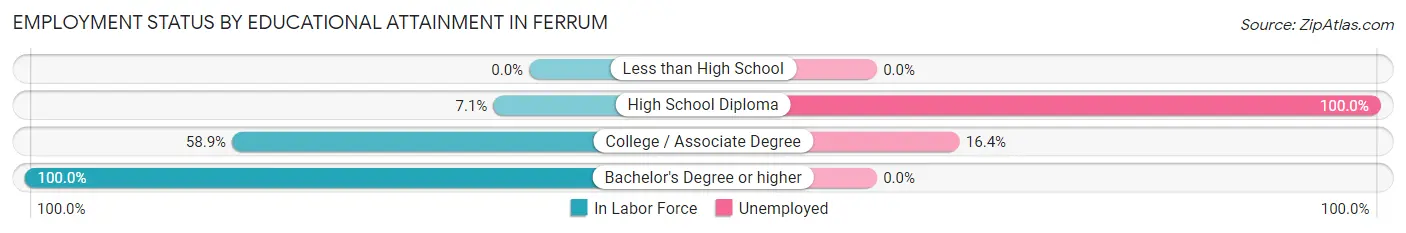
| Educational Attainment | In Labor Force | Unemployed |
| Less than High School | 0 (0.0%) | 0 (0.0%) |
| High School Diploma | 6 (7.1%) | 84 (100.0%) |
| College / Associate Degree | 73 (58.9%) | 20 (16.4%) |
| Bachelor's Degree or higher | 102 (100.0%) | 0 (0.0%) |
| Total | 181 (42.7%) | 42 (9.9%) |
Employment Occupations by Sex in Ferrum
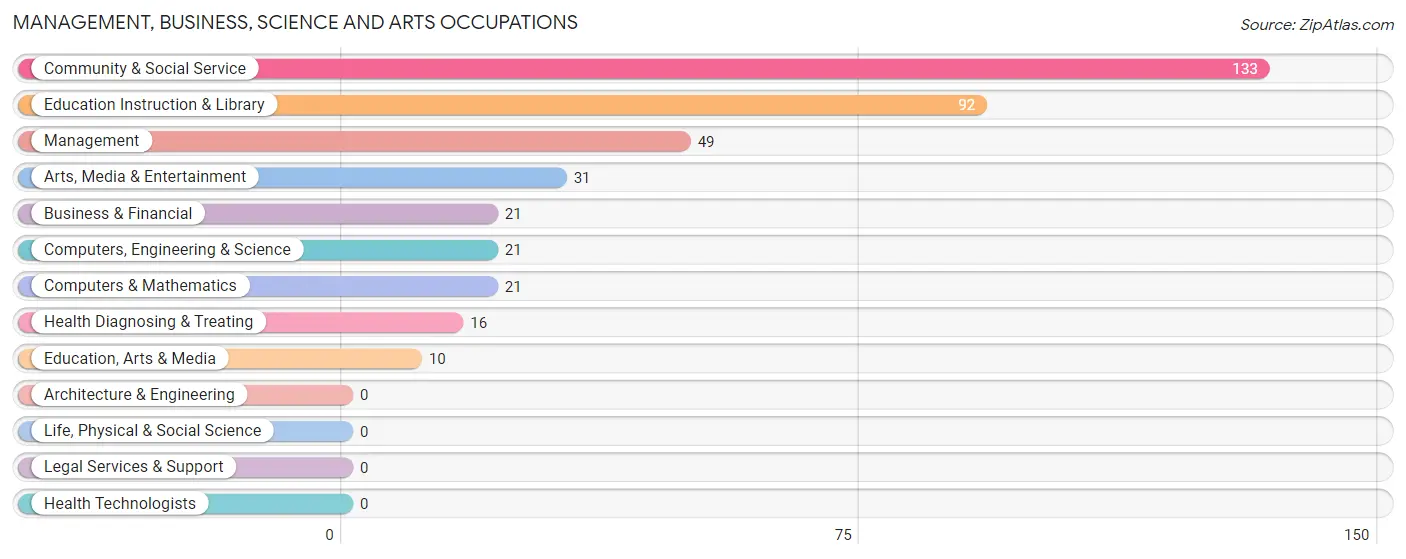
Management, Business, Science and Arts Occupations
The most common Management, Business, Science and Arts occupations in Ferrum are Community & Social Service (133 | 16.2%), Education Instruction & Library (92 | 11.2%), Management (49 | 6.0%), Arts, Media & Entertainment (31 | 3.8%), and Business & Financial (21 | 2.6%).
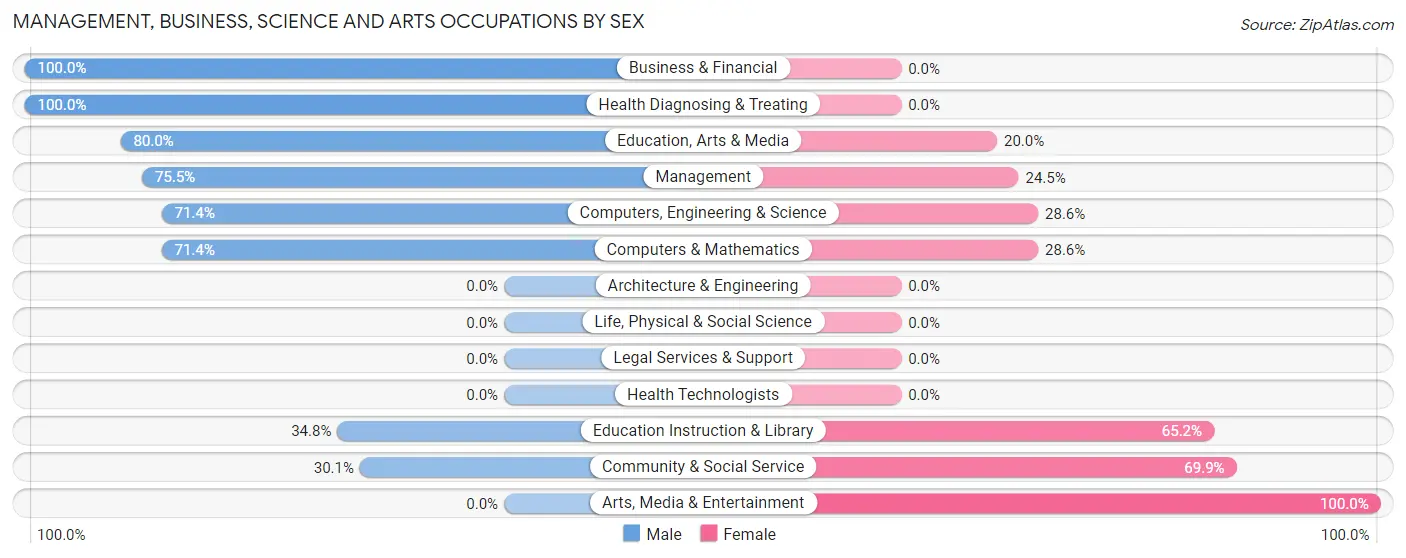
Management, Business, Science and Arts Occupations by Sex
Within the Management, Business, Science and Arts occupations in Ferrum, the most male-oriented occupations are Business & Financial (100.0%), Health Diagnosing & Treating (100.0%), and Education, Arts & Media (80.0%), while the most female-oriented occupations are Arts, Media & Entertainment (100.0%), Community & Social Service (69.9%), and Education Instruction & Library (65.2%).
| Occupation | Male | Female |
| Management | 37 (75.5%) | 12 (24.5%) |
| Business & Financial | 21 (100.0%) | 0 (0.0%) |
| Computers, Engineering & Science | 15 (71.4%) | 6 (28.6%) |
| Computers & Mathematics | 15 (71.4%) | 6 (28.6%) |
| Architecture & Engineering | 0 (0.0%) | 0 (0.0%) |
| Life, Physical & Social Science | 0 (0.0%) | 0 (0.0%) |
| Community & Social Service | 40 (30.1%) | 93 (69.9%) |
| Education, Arts & Media | 8 (80.0%) | 2 (20.0%) |
| Legal Services & Support | 0 (0.0%) | 0 (0.0%) |
| Education Instruction & Library | 32 (34.8%) | 60 (65.2%) |
| Arts, Media & Entertainment | 0 (0.0%) | 31 (100.0%) |
| Health Diagnosing & Treating | 16 (100.0%) | 0 (0.0%) |
| Health Technologists | 0 (0.0%) | 0 (0.0%) |
| Total (Category) | 129 (53.7%) | 111 (46.3%) |
| Total (Overall) | 408 (49.8%) | 411 (50.2%) |
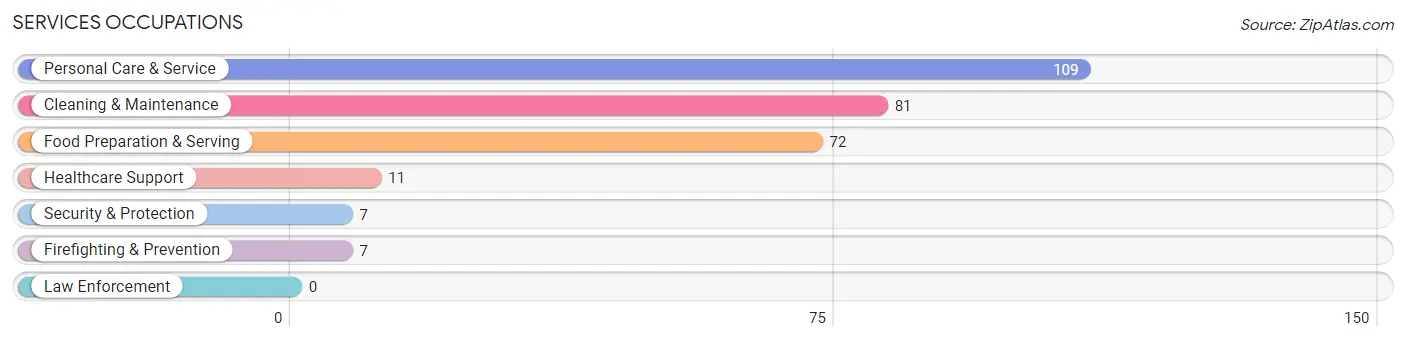
Services Occupations
The most common Services occupations in Ferrum are Personal Care & Service (109 | 13.3%), Cleaning & Maintenance (81 | 9.9%), Food Preparation & Serving (72 | 8.8%), Healthcare Support (11 | 1.3%), and Security & Protection (7 | 0.9%).
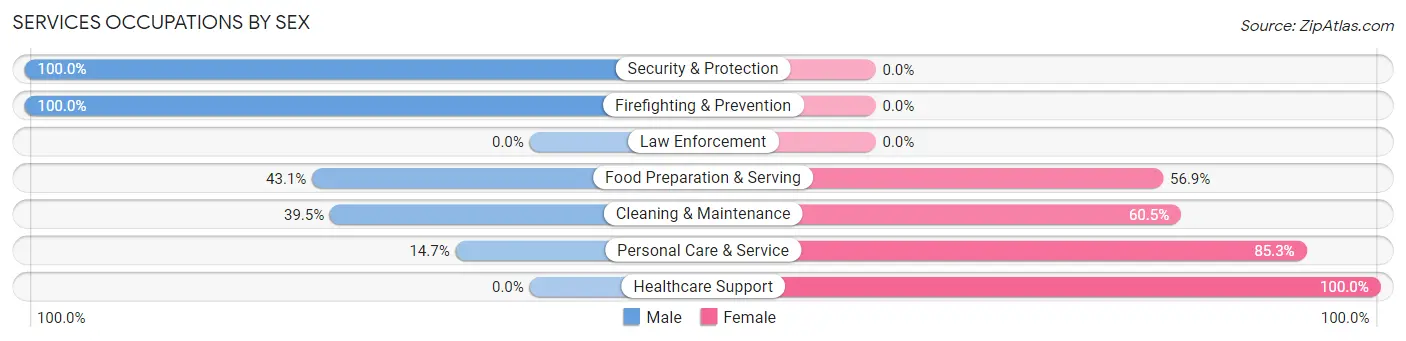
Services Occupations by Sex
Within the Services occupations in Ferrum, the most male-oriented occupations are Security & Protection (100.0%), Firefighting & Prevention (100.0%), and Food Preparation & Serving (43.1%), while the most female-oriented occupations are Healthcare Support (100.0%), Personal Care & Service (85.3%), and Cleaning & Maintenance (60.5%).
| Occupation | Male | Female |
| Healthcare Support | 0 (0.0%) | 11 (100.0%) |
| Security & Protection | 7 (100.0%) | 0 (0.0%) |
| Firefighting & Prevention | 7 (100.0%) | 0 (0.0%) |
| Law Enforcement | 0 (0.0%) | 0 (0.0%) |
| Food Preparation & Serving | 31 (43.1%) | 41 (56.9%) |
| Cleaning & Maintenance | 32 (39.5%) | 49 (60.5%) |
| Personal Care & Service | 16 (14.7%) | 93 (85.3%) |
| Total (Category) | 86 (30.7%) | 194 (69.3%) |
| Total (Overall) | 408 (49.8%) | 411 (50.2%) |
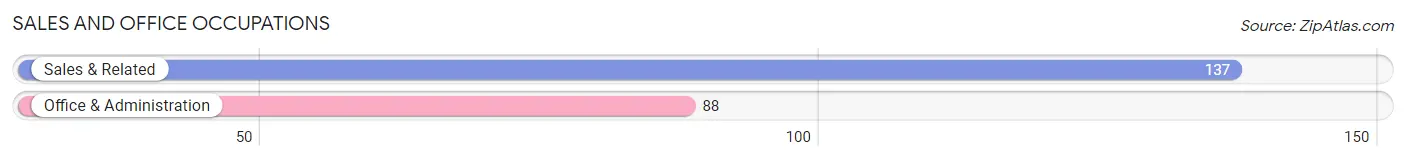
Sales and Office Occupations
The most common Sales and Office occupations in Ferrum are Sales & Related (137 | 16.7%), and Office & Administration (88 | 10.7%).
Sales and Office Occupations by Sex
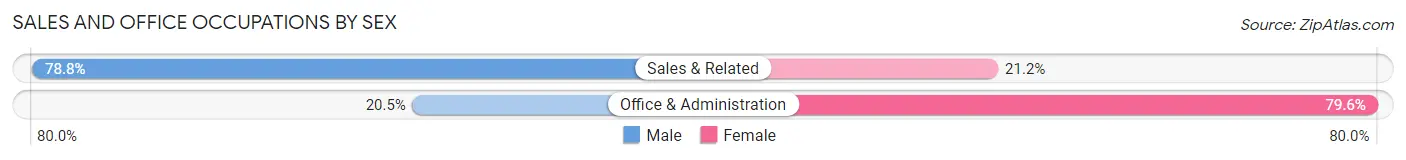
| Occupation | Male | Female |
| Sales & Related | 108 (78.8%) | 29 (21.2%) |
| Office & Administration | 18 (20.4%) | 70 (79.5%) |
| Total (Category) | 126 (56.0%) | 99 (44.0%) |
| Total (Overall) | 408 (49.8%) | 411 (50.2%) |
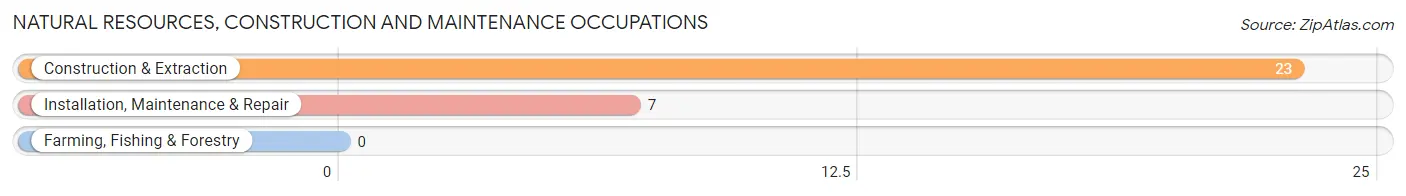
Natural Resources, Construction and Maintenance Occupations
The most common Natural Resources, Construction and Maintenance occupations in Ferrum are Construction & Extraction (23 | 2.8%), and Installation, Maintenance & Repair (7 | 0.9%).
Natural Resources, Construction and Maintenance Occupations by Sex
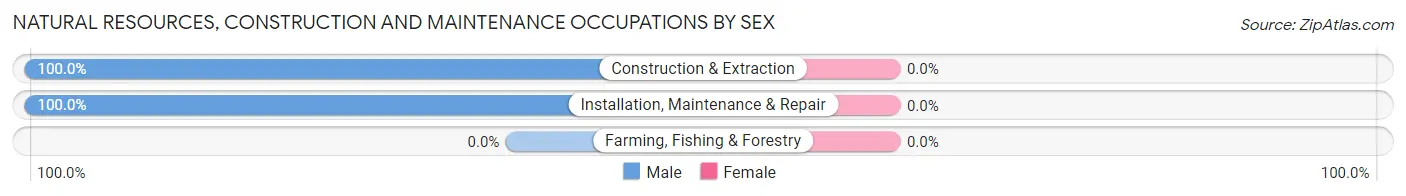
| Occupation | Male | Female |
| Farming, Fishing & Forestry | 0 (0.0%) | 0 (0.0%) |
| Construction & Extraction | 23 (100.0%) | 0 (0.0%) |
| Installation, Maintenance & Repair | 7 (100.0%) | 0 (0.0%) |
| Total (Category) | 30 (100.0%) | 0 (0.0%) |
| Total (Overall) | 408 (49.8%) | 411 (50.2%) |
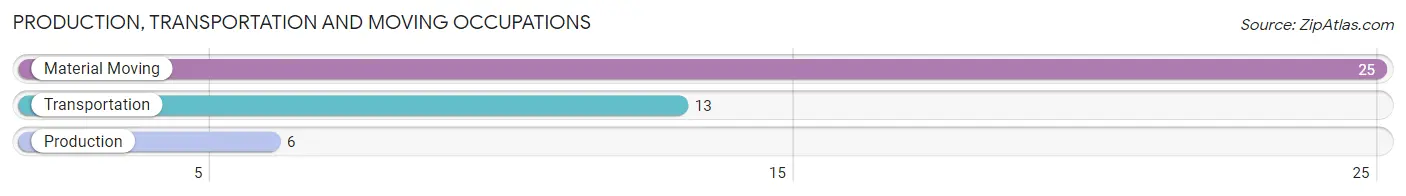
Production, Transportation and Moving Occupations
The most common Production, Transportation and Moving occupations in Ferrum are Material Moving (25 | 3.0%), Transportation (13 | 1.6%), and Production (6 | 0.7%).
Production, Transportation and Moving Occupations by Sex
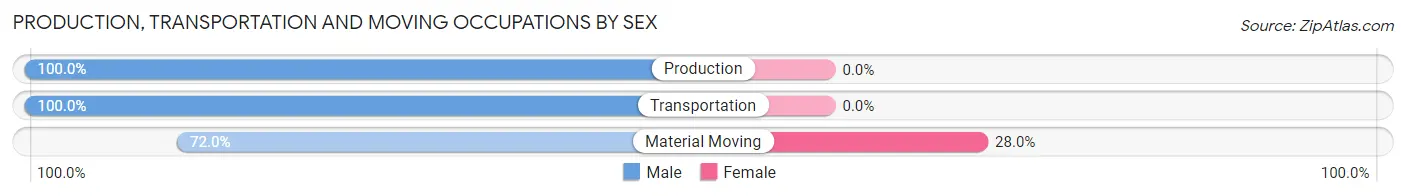
| Occupation | Male | Female |
| Production | 6 (100.0%) | 0 (0.0%) |
| Transportation | 13 (100.0%) | 0 (0.0%) |
| Material Moving | 18 (72.0%) | 7 (28.0%) |
| Total (Category) | 37 (84.1%) | 7 (15.9%) |
| Total (Overall) | 408 (49.8%) | 411 (50.2%) |
Employment Industries by Sex in Ferrum
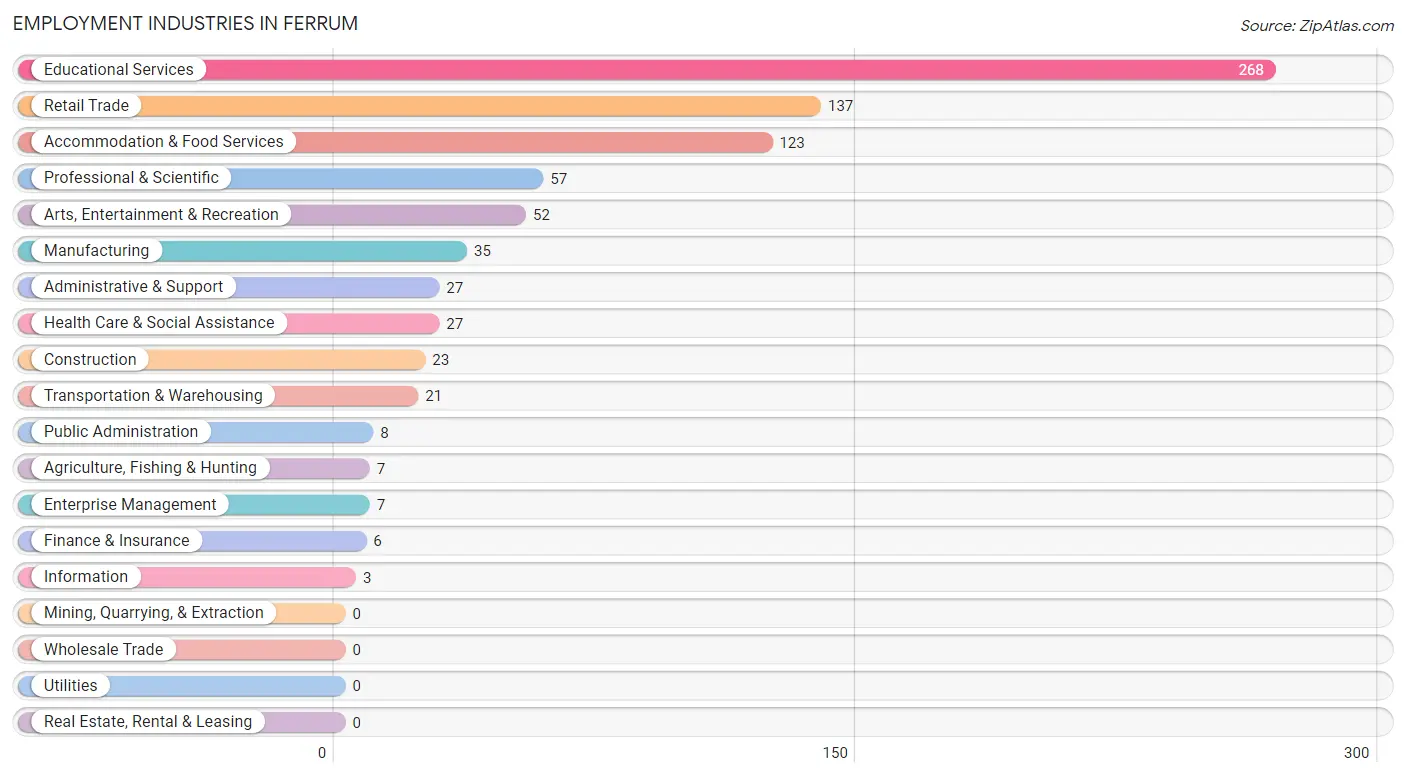
Employment Industries in Ferrum
The major employment industries in Ferrum include Educational Services (268 | 32.7%), Retail Trade (137 | 16.7%), Accommodation & Food Services (123 | 15.0%), Professional & Scientific (57 | 7.0%), and Arts, Entertainment & Recreation (52 | 6.4%).
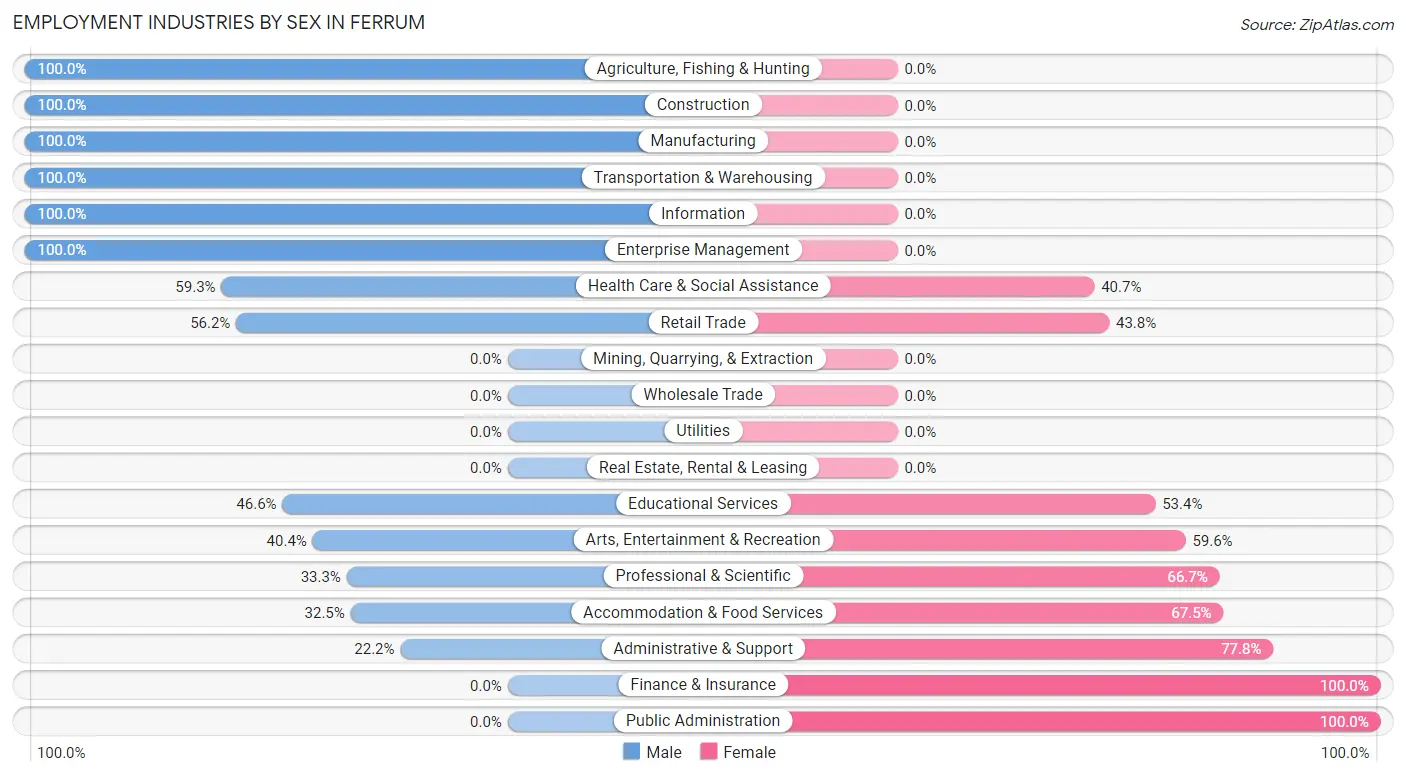
Employment Industries by Sex in Ferrum
The Ferrum industries that see more men than women are Agriculture, Fishing & Hunting (100.0%), Construction (100.0%), and Manufacturing (100.0%), whereas the industries that tend to have a higher number of women are Finance & Insurance (100.0%), Public Administration (100.0%), and Administrative & Support (77.8%).
| Industry | Male | Female |
| Agriculture, Fishing & Hunting | 7 (100.0%) | 0 (0.0%) |
| Mining, Quarrying, & Extraction | 0 (0.0%) | 0 (0.0%) |
| Construction | 23 (100.0%) | 0 (0.0%) |
| Manufacturing | 35 (100.0%) | 0 (0.0%) |
| Wholesale Trade | 0 (0.0%) | 0 (0.0%) |
| Retail Trade | 77 (56.2%) | 60 (43.8%) |
| Transportation & Warehousing | 21 (100.0%) | 0 (0.0%) |
| Utilities | 0 (0.0%) | 0 (0.0%) |
| Information | 3 (100.0%) | 0 (0.0%) |
| Finance & Insurance | 0 (0.0%) | 6 (100.0%) |
| Real Estate, Rental & Leasing | 0 (0.0%) | 0 (0.0%) |
| Professional & Scientific | 19 (33.3%) | 38 (66.7%) |
| Enterprise Management | 7 (100.0%) | 0 (0.0%) |
| Administrative & Support | 6 (22.2%) | 21 (77.8%) |
| Educational Services | 125 (46.6%) | 143 (53.4%) |
| Health Care & Social Assistance | 16 (59.3%) | 11 (40.7%) |
| Arts, Entertainment & Recreation | 21 (40.4%) | 31 (59.6%) |
| Accommodation & Food Services | 40 (32.5%) | 83 (67.5%) |
| Public Administration | 0 (0.0%) | 8 (100.0%) |
| Total | 408 (49.8%) | 411 (50.2%) |
Education in Ferrum
School Enrollment in Ferrum
The most common levels of schooling among the 1,072 students in Ferrum are college / undergraduate (969 | 90.4%), elementary school (40 | 3.7%), and graduate / professional (27 | 2.5%).
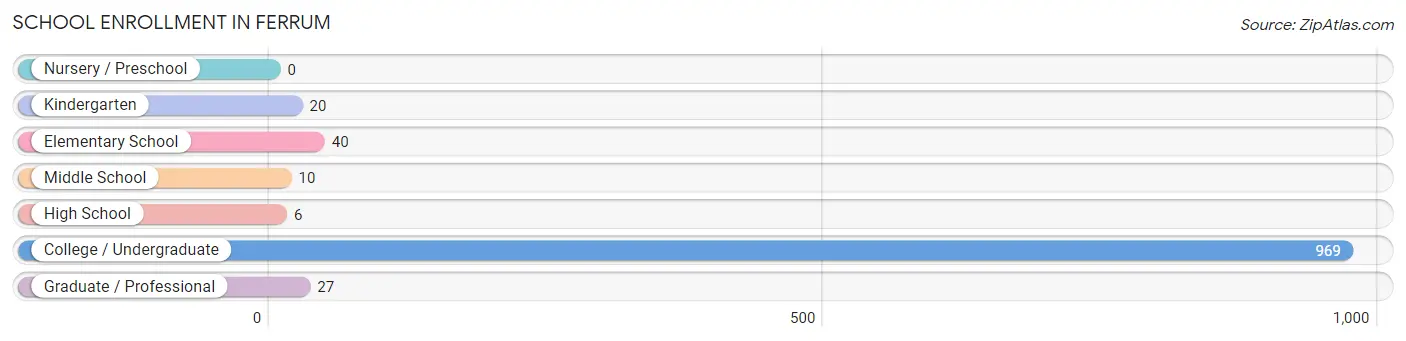
| School Level | # Students | % Students |
| Nursery / Preschool | 0 | 0.0% |
| Kindergarten | 20 | 1.9% |
| Elementary School | 40 | 3.7% |
| Middle School | 10 | 0.9% |
| High School | 6 | 0.6% |
| College / Undergraduate | 969 | 90.4% |
| Graduate / Professional | 27 | 2.5% |
| Total | 1,072 | 100.0% |
School Enrollment by Age by Funding Source in Ferrum
Out of a total of 1,072 students who are enrolled in schools in Ferrum, 601 (56.1%) attend a private institution, while the remaining 471 (43.9%) are enrolled in public schools. The age group of 20 to 24 year olds has the highest likelihood of being enrolled in private schools, with 313 (64.9% in the age bracket) enrolled. Conversely, the age group of 5 to 9 year old has the lowest likelihood of being enrolled in a private school, with 60 (100.0% in the age bracket) attending a public institution.
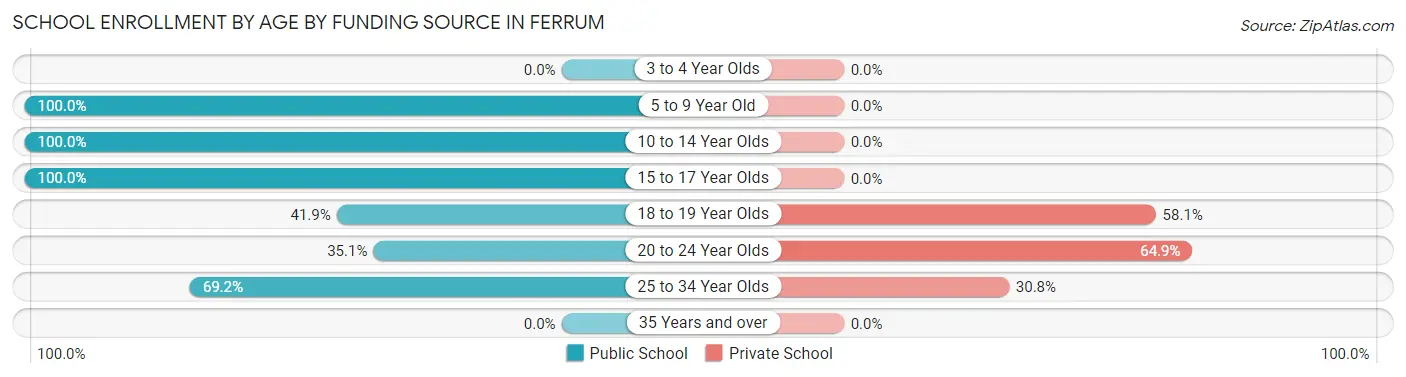
| Age Bracket | Public School | Private School |
| 3 to 4 Year Olds | 0 (0.0%) | 0 (0.0%) |
| 5 to 9 Year Old | 60 (100.0%) | 0 (0.0%) |
| 10 to 14 Year Olds | 10 (100.0%) | 0 (0.0%) |
| 15 to 17 Year Olds | 6 (100.0%) | 0 (0.0%) |
| 18 to 19 Year Olds | 199 (41.9%) | 276 (58.1%) |
| 20 to 24 Year Olds | 169 (35.1%) | 313 (64.9%) |
| 25 to 34 Year Olds | 27 (69.2%) | 12 (30.8%) |
| 35 Years and over | 0 (0.0%) | 0 (0.0%) |
| Total | 471 (43.9%) | 601 (56.1%) |
Educational Attainment by Field of Study in Ferrum
Bio, nature & agricultural (48 | 35.6%), education (30 | 22.2%), liberal arts & history (28 | 20.7%), science & technology (23 | 17.0%), and computers & mathematics (6 | 4.4%) are the most common fields of study among 135 individuals in Ferrum who have obtained a bachelor's degree or higher.
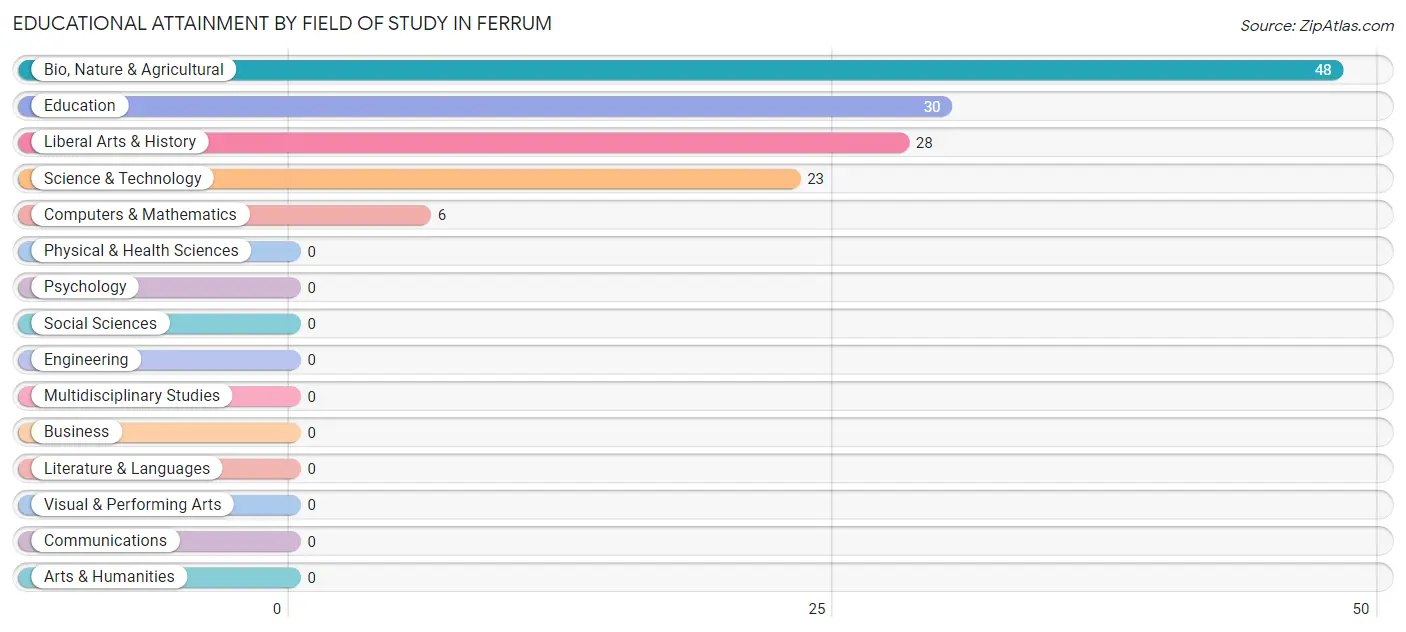
| Field of Study | # Graduates | % Graduates |
| Computers & Mathematics | 6 | 4.4% |
| Bio, Nature & Agricultural | 48 | 35.6% |
| Physical & Health Sciences | 0 | 0.0% |
| Psychology | 0 | 0.0% |
| Social Sciences | 0 | 0.0% |
| Engineering | 0 | 0.0% |
| Multidisciplinary Studies | 0 | 0.0% |
| Science & Technology | 23 | 17.0% |
| Business | 0 | 0.0% |
| Education | 30 | 22.2% |
| Literature & Languages | 0 | 0.0% |
| Liberal Arts & History | 28 | 20.7% |
| Visual & Performing Arts | 0 | 0.0% |
| Communications | 0 | 0.0% |
| Arts & Humanities | 0 | 0.0% |
| Total | 135 | 100.0% |
Transportation & Commute in Ferrum
Vehicle Availability by Sex in Ferrum
The most prevalent vehicle ownership categories in Ferrum are males with 1 vehicle (61, accounting for 39.6%) and females with 1 vehicle (0, making up 61.6%).
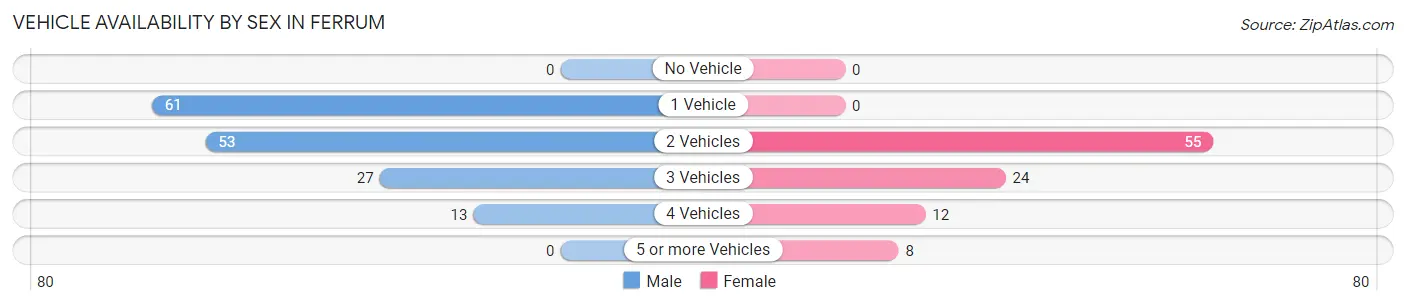
| Vehicles Available | Male | Female |
| No Vehicle | 0 (0.0%) | 0 (0.0%) |
| 1 Vehicle | 61 (39.6%) | 0 (0.0%) |
| 2 Vehicles | 53 (34.4%) | 55 (55.6%) |
| 3 Vehicles | 27 (17.5%) | 24 (24.2%) |
| 4 Vehicles | 13 (8.4%) | 12 (12.1%) |
| 5 or more Vehicles | 0 (0.0%) | 8 (8.1%) |
| Total | 154 (100.0%) | 99 (100.0%) |
Commute Time in Ferrum
The most frequently occuring commute durations in Ferrum are 10 to 14 minutes (193 commuters, 27.6%), 5 to 9 minutes (164 commuters, 23.5%), and 30 to 34 minutes (93 commuters, 13.3%).
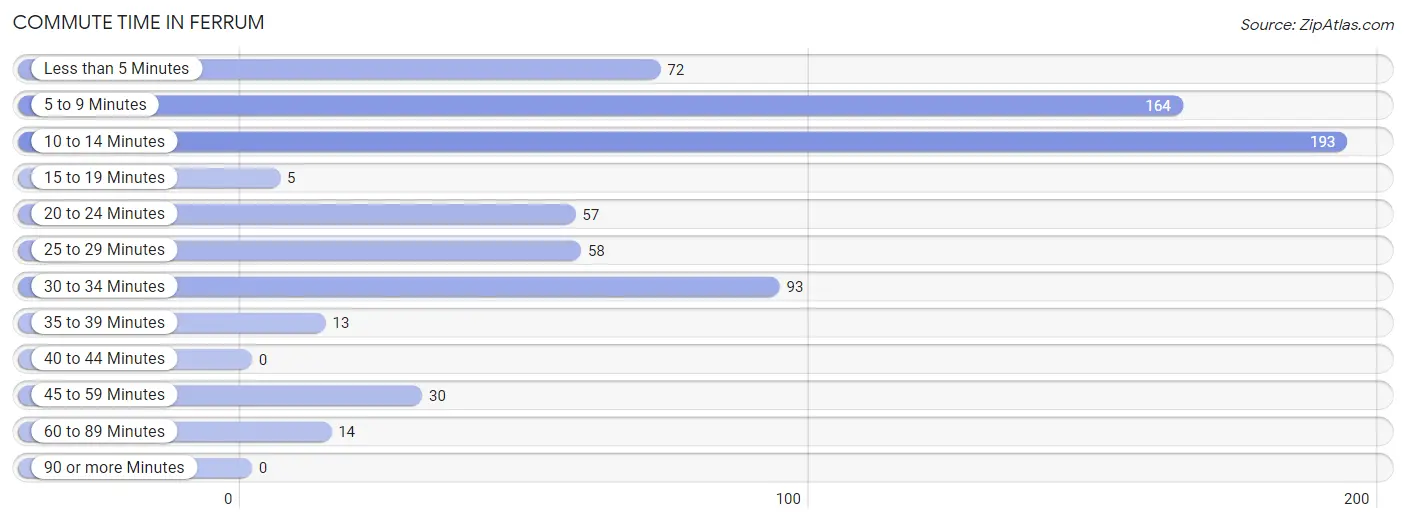
| Commute Time | # Commuters | % Commuters |
| Less than 5 Minutes | 72 | 10.3% |
| 5 to 9 Minutes | 164 | 23.5% |
| 10 to 14 Minutes | 193 | 27.6% |
| 15 to 19 Minutes | 5 | 0.7% |
| 20 to 24 Minutes | 57 | 8.2% |
| 25 to 29 Minutes | 58 | 8.3% |
| 30 to 34 Minutes | 93 | 13.3% |
| 35 to 39 Minutes | 13 | 1.9% |
| 40 to 44 Minutes | 0 | 0.0% |
| 45 to 59 Minutes | 30 | 4.3% |
| 60 to 89 Minutes | 14 | 2.0% |
| 90 or more Minutes | 0 | 0.0% |
Commute Time by Sex in Ferrum
The most common commute times in Ferrum are 5 to 9 minutes (89 commuters, 24.3%) for males and 10 to 14 minutes (128 commuters, 38.4%) for females.
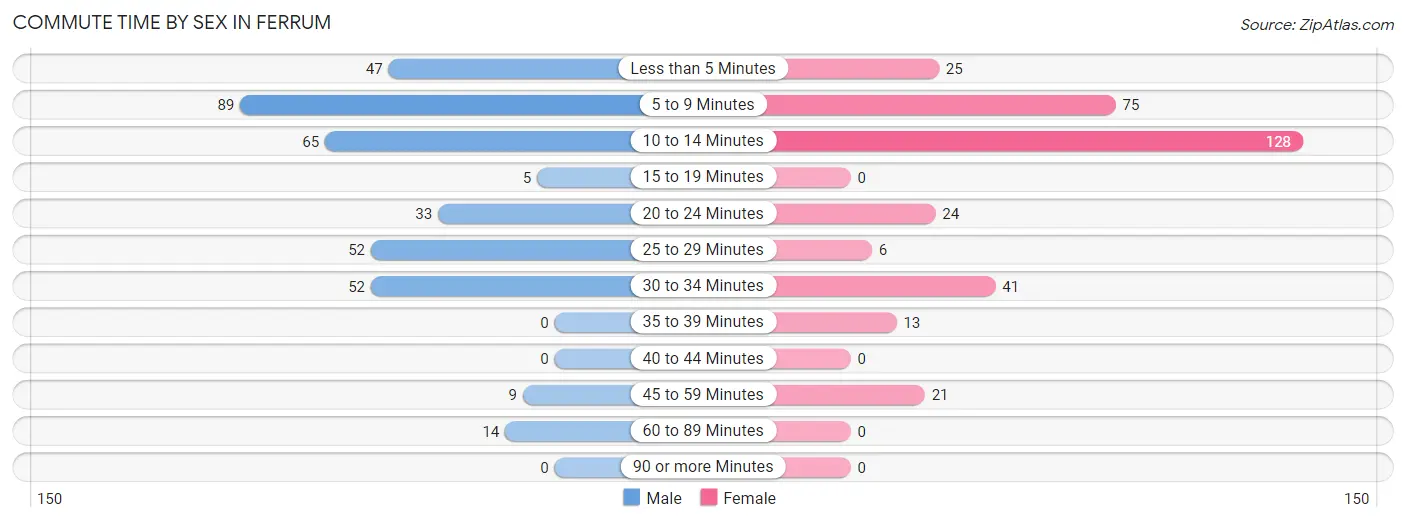
| Commute Time | Male | Female |
| Less than 5 Minutes | 47 (12.8%) | 25 (7.5%) |
| 5 to 9 Minutes | 89 (24.3%) | 75 (22.5%) |
| 10 to 14 Minutes | 65 (17.8%) | 128 (38.4%) |
| 15 to 19 Minutes | 5 (1.4%) | 0 (0.0%) |
| 20 to 24 Minutes | 33 (9.0%) | 24 (7.2%) |
| 25 to 29 Minutes | 52 (14.2%) | 6 (1.8%) |
| 30 to 34 Minutes | 52 (14.2%) | 41 (12.3%) |
| 35 to 39 Minutes | 0 (0.0%) | 13 (3.9%) |
| 40 to 44 Minutes | 0 (0.0%) | 0 (0.0%) |
| 45 to 59 Minutes | 9 (2.5%) | 21 (6.3%) |
| 60 to 89 Minutes | 14 (3.8%) | 0 (0.0%) |
| 90 or more Minutes | 0 (0.0%) | 0 (0.0%) |
Time of Departure to Work by Sex in Ferrum
The most frequent times of departure to work in Ferrum are 10:00 AM to 10:59 AM (89, 24.3%) for males and 12:00 PM to 3:59 PM (88, 26.4%) for females.
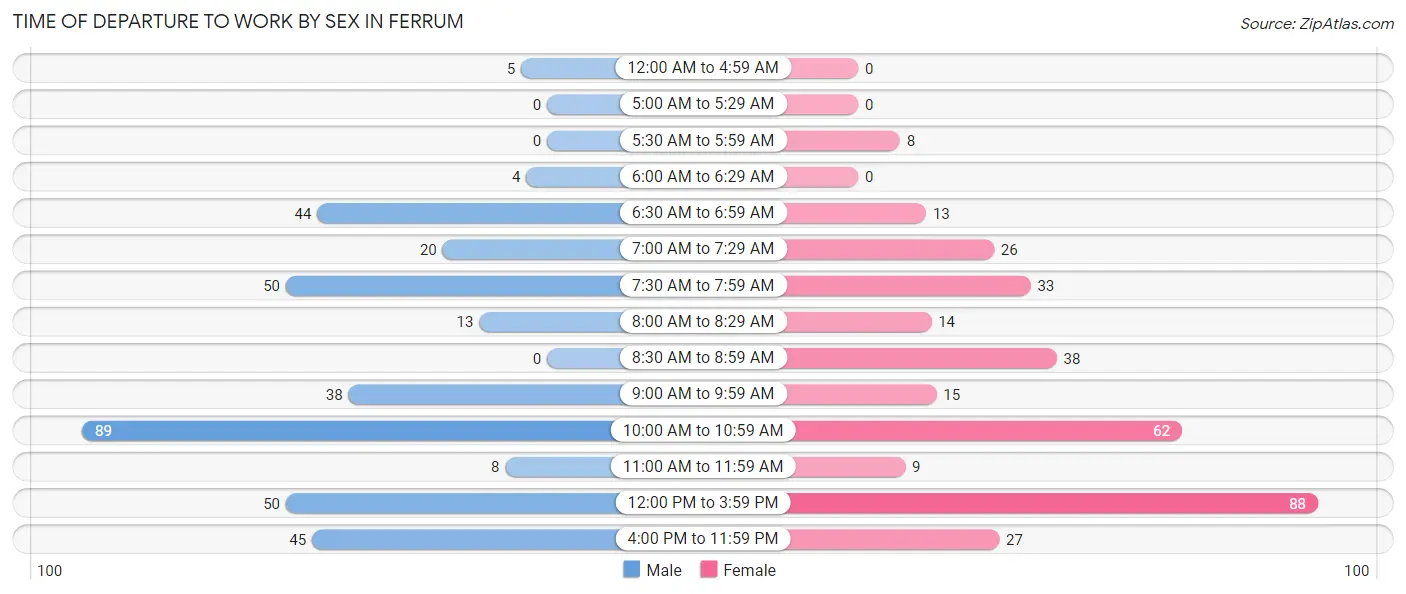
| Time of Departure | Male | Female |
| 12:00 AM to 4:59 AM | 5 (1.4%) | 0 (0.0%) |
| 5:00 AM to 5:29 AM | 0 (0.0%) | 0 (0.0%) |
| 5:30 AM to 5:59 AM | 0 (0.0%) | 8 (2.4%) |
| 6:00 AM to 6:29 AM | 4 (1.1%) | 0 (0.0%) |
| 6:30 AM to 6:59 AM | 44 (12.0%) | 13 (3.9%) |
| 7:00 AM to 7:29 AM | 20 (5.5%) | 26 (7.8%) |
| 7:30 AM to 7:59 AM | 50 (13.7%) | 33 (9.9%) |
| 8:00 AM to 8:29 AM | 13 (3.5%) | 14 (4.2%) |
| 8:30 AM to 8:59 AM | 0 (0.0%) | 38 (11.4%) |
| 9:00 AM to 9:59 AM | 38 (10.4%) | 15 (4.5%) |
| 10:00 AM to 10:59 AM | 89 (24.3%) | 62 (18.6%) |
| 11:00 AM to 11:59 AM | 8 (2.2%) | 9 (2.7%) |
| 12:00 PM to 3:59 PM | 50 (13.7%) | 88 (26.4%) |
| 4:00 PM to 11:59 PM | 45 (12.3%) | 27 (8.1%) |
| Total | 366 (100.0%) | 333 (100.0%) |
Housing Occupancy in Ferrum
Occupancy by Ownership in Ferrum
Of the total 377 dwellings in Ferrum, owner-occupied units account for 238 (63.1%), while renter-occupied units make up 139 (36.9%).
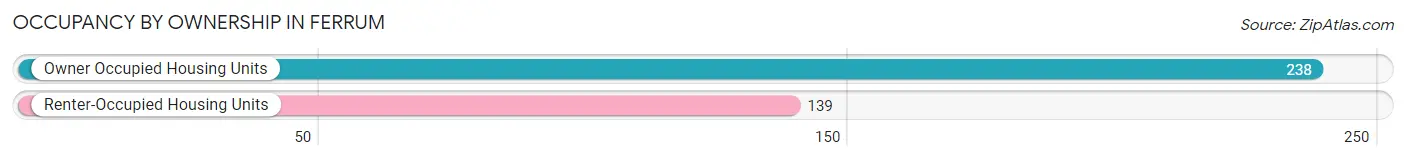
| Occupancy | # Housing Units | % Housing Units |
| Owner Occupied Housing Units | 238 | 63.1% |
| Renter-Occupied Housing Units | 139 | 36.9% |
| Total Occupied Housing Units | 377 | 100.0% |
Occupancy by Household Size in Ferrum
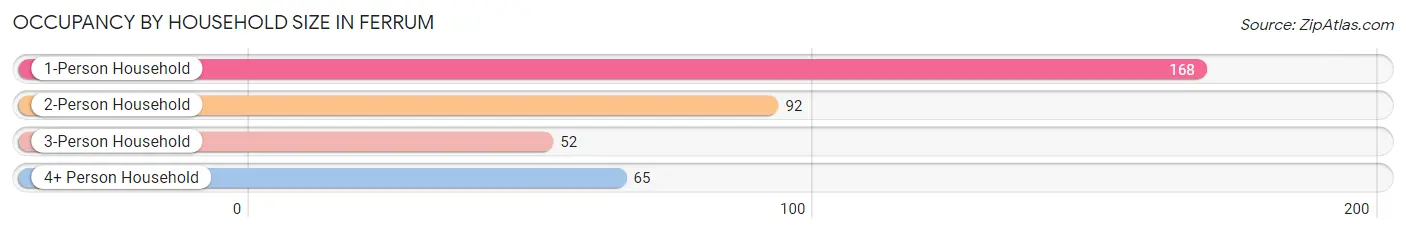
| Household Size | # Housing Units | % Housing Units |
| 1-Person Household | 168 | 44.6% |
| 2-Person Household | 92 | 24.4% |
| 3-Person Household | 52 | 13.8% |
| 4+ Person Household | 65 | 17.2% |
| Total Housing Units | 377 | 100.0% |
Occupancy by Ownership by Household Size in Ferrum
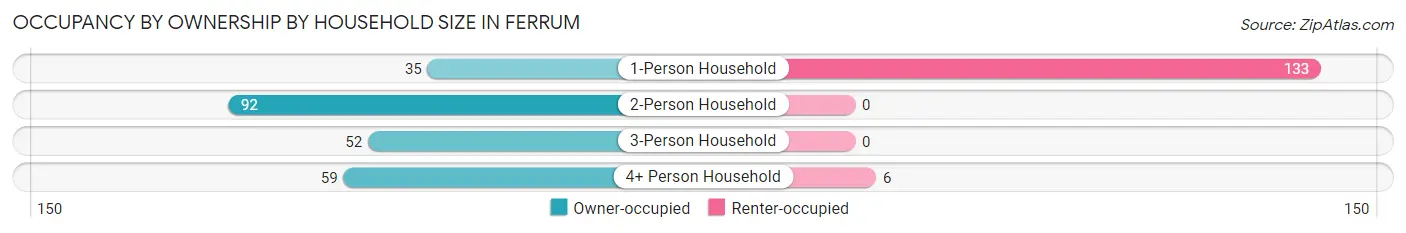
| Household Size | Owner-occupied | Renter-occupied |
| 1-Person Household | 35 (20.8%) | 133 (79.2%) |
| 2-Person Household | 92 (100.0%) | 0 (0.0%) |
| 3-Person Household | 52 (100.0%) | 0 (0.0%) |
| 4+ Person Household | 59 (90.8%) | 6 (9.2%) |
| Total Housing Units | 238 (63.1%) | 139 (36.9%) |
Occupancy by Educational Attainment in Ferrum
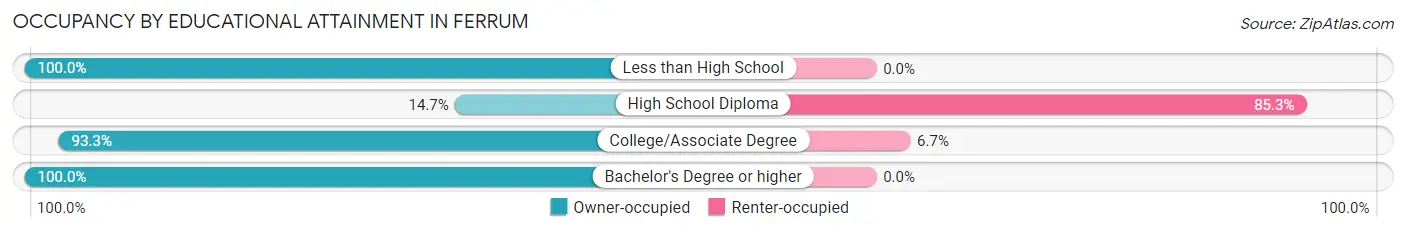
| Household Size | Owner-occupied | Renter-occupied |
| Less than High School | 75 (100.0%) | 0 (0.0%) |
| High School Diploma | 23 (14.7%) | 133 (85.3%) |
| College/Associate Degree | 83 (93.3%) | 6 (6.7%) |
| Bachelor's Degree or higher | 57 (100.0%) | 0 (0.0%) |
Occupancy by Age of Householder in Ferrum
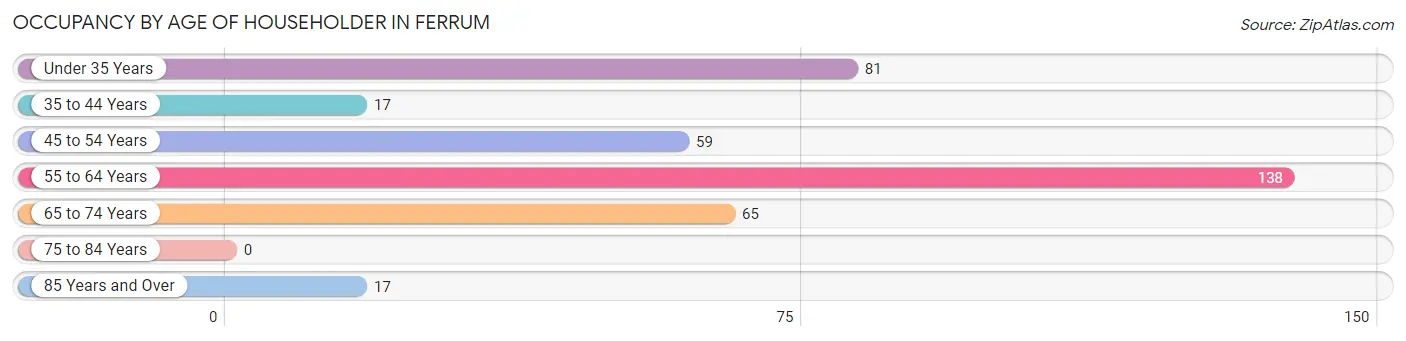
| Age Bracket | # Households | % Households |
| Under 35 Years | 81 | 21.5% |
| 35 to 44 Years | 17 | 4.5% |
| 45 to 54 Years | 59 | 15.7% |
| 55 to 64 Years | 138 | 36.6% |
| 65 to 74 Years | 65 | 17.2% |
| 75 to 84 Years | 0 | 0.0% |
| 85 Years and Over | 17 | 4.5% |
| Total | 377 | 100.0% |
Housing Finances in Ferrum
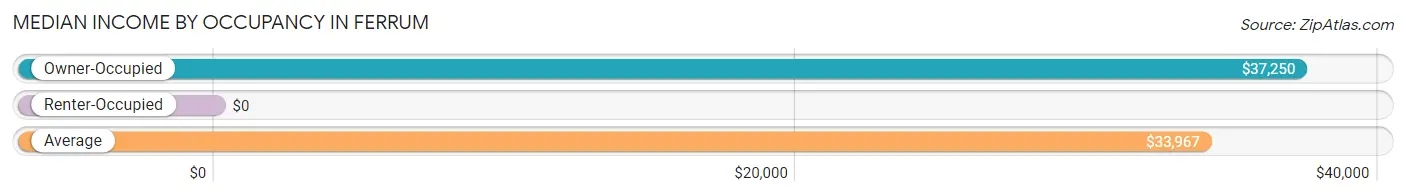
Median Income by Occupancy in Ferrum
| Occupancy Type | # Households | Median Income |
| Owner-Occupied | 238 (63.1%) | $37,250 |
| Renter-Occupied | 139 (36.9%) | $0 |
| Average | 377 (100.0%) | $33,967 |
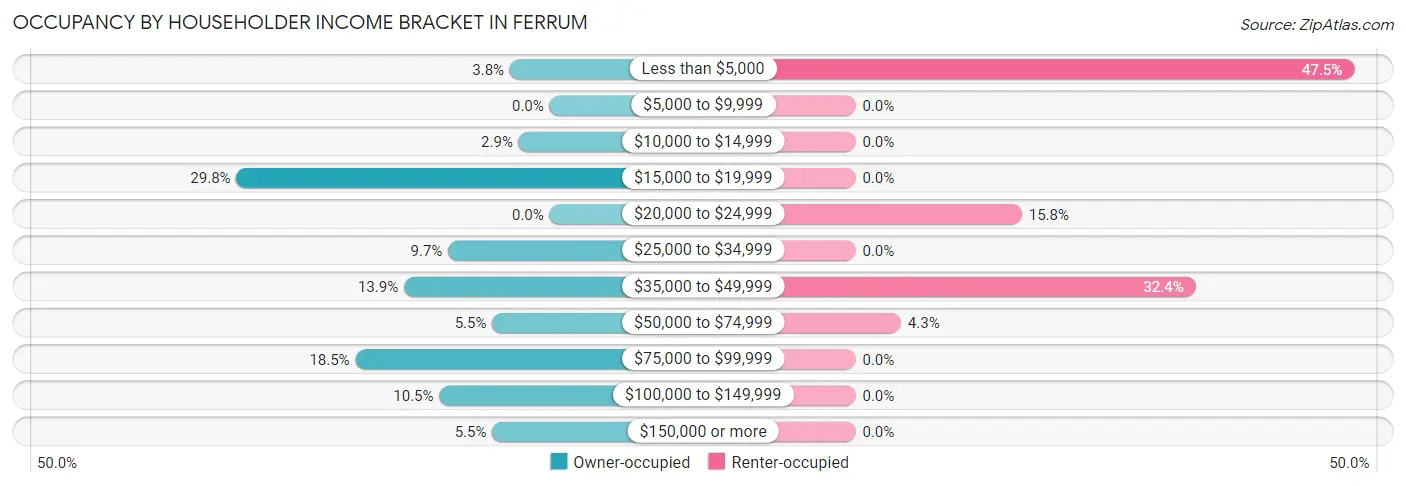
Occupancy by Householder Income Bracket in Ferrum
| Income Bracket | Owner-occupied | Renter-occupied |
| Less than $5,000 | 9 (3.8%) | 66 (47.5%) |
| $5,000 to $9,999 | 0 (0.0%) | 0 (0.0%) |
| $10,000 to $14,999 | 7 (2.9%) | 0 (0.0%) |
| $15,000 to $19,999 | 71 (29.8%) | 0 (0.0%) |
| $20,000 to $24,999 | 0 (0.0%) | 22 (15.8%) |
| $25,000 to $34,999 | 23 (9.7%) | 0 (0.0%) |
| $35,000 to $49,999 | 33 (13.9%) | 45 (32.4%) |
| $50,000 to $74,999 | 13 (5.5%) | 6 (4.3%) |
| $75,000 to $99,999 | 44 (18.5%) | 0 (0.0%) |
| $100,000 to $149,999 | 25 (10.5%) | 0 (0.0%) |
| $150,000 or more | 13 (5.5%) | 0 (0.0%) |
| Total | 238 (100.0%) | 139 (100.0%) |
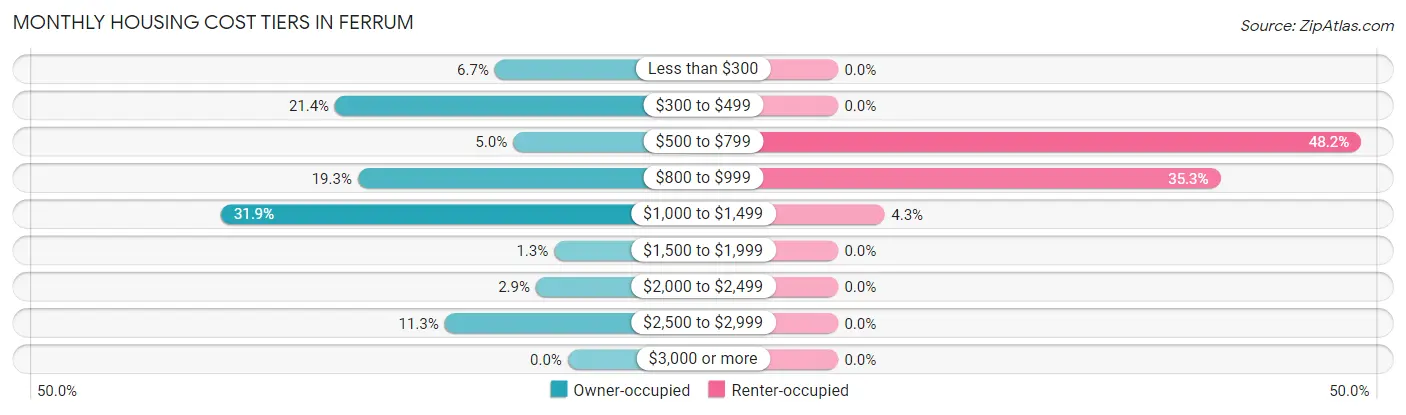
Monthly Housing Cost Tiers in Ferrum
| Monthly Cost | Owner-occupied | Renter-occupied |
| Less than $300 | 16 (6.7%) | 0 (0.0%) |
| $300 to $499 | 51 (21.4%) | 0 (0.0%) |
| $500 to $799 | 12 (5.0%) | 67 (48.2%) |
| $800 to $999 | 46 (19.3%) | 49 (35.2%) |
| $1,000 to $1,499 | 76 (31.9%) | 6 (4.3%) |
| $1,500 to $1,999 | 3 (1.3%) | 0 (0.0%) |
| $2,000 to $2,499 | 7 (2.9%) | 0 (0.0%) |
| $2,500 to $2,999 | 27 (11.3%) | 0 (0.0%) |
| $3,000 or more | 0 (0.0%) | 0 (0.0%) |
| Total | 238 (100.0%) | 139 (100.0%) |
Physical Housing Characteristics in Ferrum
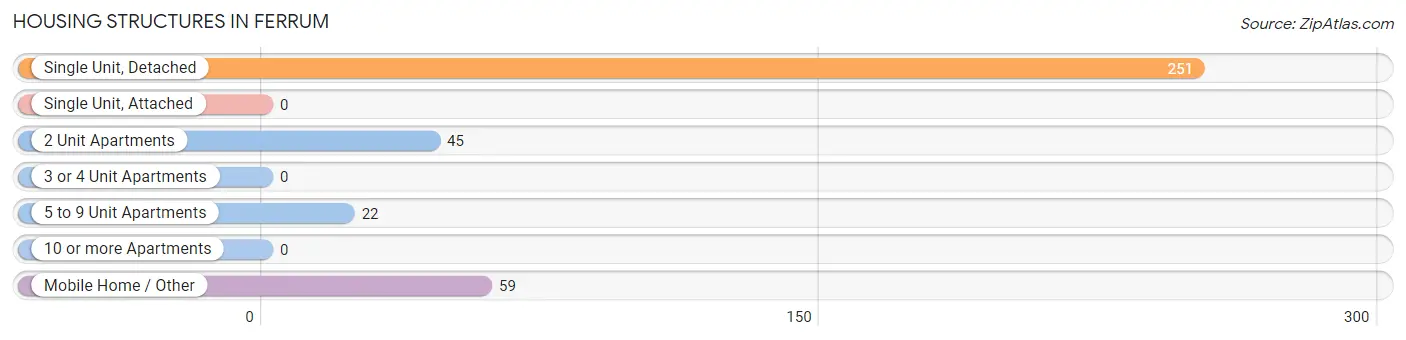
Housing Structures in Ferrum
| Structure Type | # Housing Units | % Housing Units |
| Single Unit, Detached | 251 | 66.6% |
| Single Unit, Attached | 0 | 0.0% |
| 2 Unit Apartments | 45 | 11.9% |
| 3 or 4 Unit Apartments | 0 | 0.0% |
| 5 to 9 Unit Apartments | 22 | 5.8% |
| 10 or more Apartments | 0 | 0.0% |
| Mobile Home / Other | 59 | 15.7% |
| Total | 377 | 100.0% |
Housing Structures by Occupancy in Ferrum
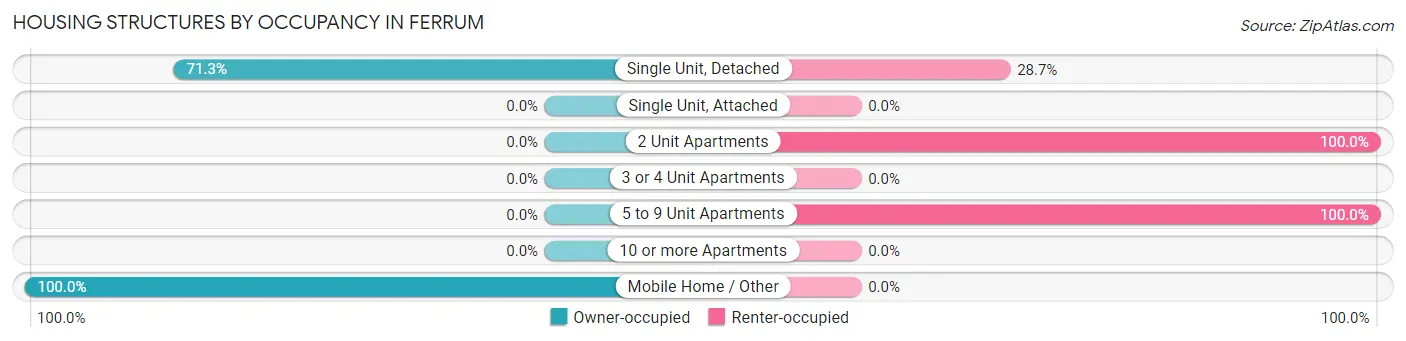
| Structure Type | Owner-occupied | Renter-occupied |
| Single Unit, Detached | 179 (71.3%) | 72 (28.7%) |
| Single Unit, Attached | 0 (0.0%) | 0 (0.0%) |
| 2 Unit Apartments | 0 (0.0%) | 45 (100.0%) |
| 3 or 4 Unit Apartments | 0 (0.0%) | 0 (0.0%) |
| 5 to 9 Unit Apartments | 0 (0.0%) | 22 (100.0%) |
| 10 or more Apartments | 0 (0.0%) | 0 (0.0%) |
| Mobile Home / Other | 59 (100.0%) | 0 (0.0%) |
| Total | 238 (63.1%) | 139 (36.9%) |
Housing Structures by Number of Rooms in Ferrum
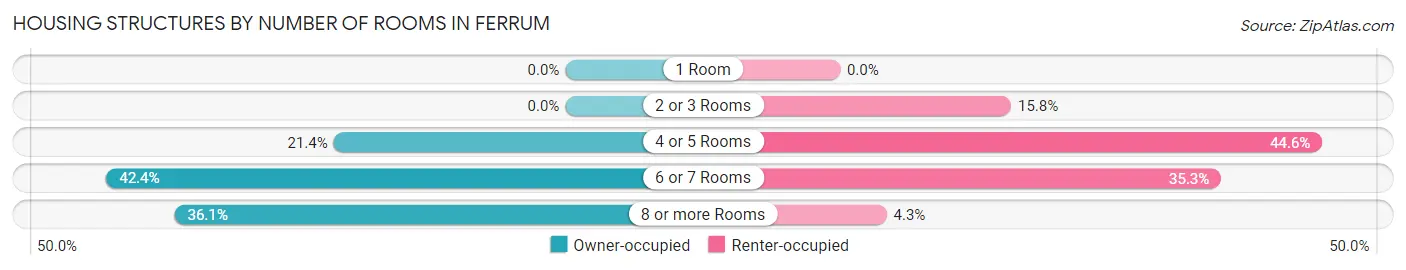
| Number of Rooms | Owner-occupied | Renter-occupied |
| 1 Room | 0 (0.0%) | 0 (0.0%) |
| 2 or 3 Rooms | 0 (0.0%) | 22 (15.8%) |
| 4 or 5 Rooms | 51 (21.4%) | 62 (44.6%) |
| 6 or 7 Rooms | 101 (42.4%) | 49 (35.2%) |
| 8 or more Rooms | 86 (36.1%) | 6 (4.3%) |
| Total | 238 (100.0%) | 139 (100.0%) |
Housing Structure by Heating Type in Ferrum
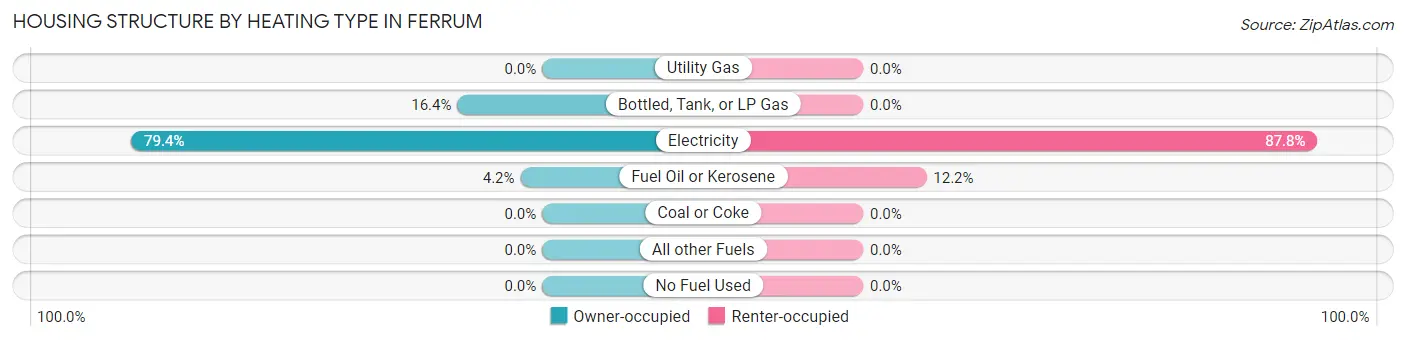
| Heating Type | Owner-occupied | Renter-occupied |
| Utility Gas | 0 (0.0%) | 0 (0.0%) |
| Bottled, Tank, or LP Gas | 39 (16.4%) | 0 (0.0%) |
| Electricity | 189 (79.4%) | 122 (87.8%) |
| Fuel Oil or Kerosene | 10 (4.2%) | 17 (12.2%) |
| Coal or Coke | 0 (0.0%) | 0 (0.0%) |
| All other Fuels | 0 (0.0%) | 0 (0.0%) |
| No Fuel Used | 0 (0.0%) | 0 (0.0%) |
| Total | 238 (100.0%) | 139 (100.0%) |
Household Vehicle Usage in Ferrum
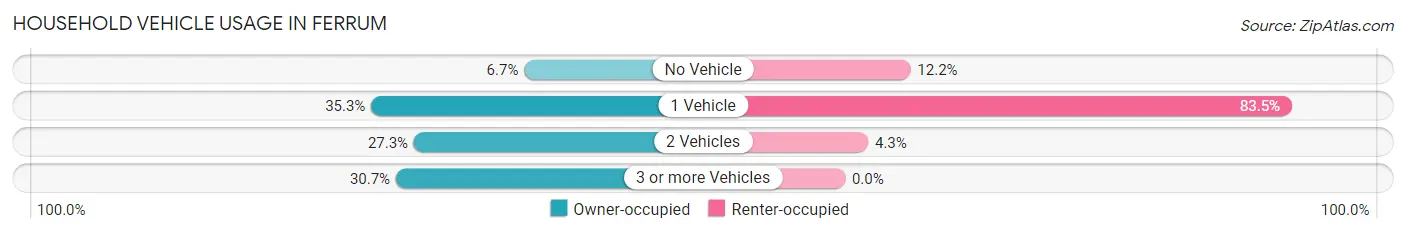
| Vehicles per Household | Owner-occupied | Renter-occupied |
| No Vehicle | 16 (6.7%) | 17 (12.2%) |
| 1 Vehicle | 84 (35.3%) | 116 (83.5%) |
| 2 Vehicles | 65 (27.3%) | 6 (4.3%) |
| 3 or more Vehicles | 73 (30.7%) | 0 (0.0%) |
| Total | 238 (100.0%) | 139 (100.0%) |
Real Estate & Mortgages in Ferrum
Real Estate and Mortgage Overview in Ferrum
| Characteristic | Without Mortgage | With Mortgage |
| Housing Units | 79 | 159 |
| Median Property Value | $151,800 | $131,300 |
| Median Household Income | - | - |
| Monthly Housing Costs | $421 | $0 |
| Real Estate Taxes | $1,236 | $0 |
Property Value by Mortgage Status in Ferrum
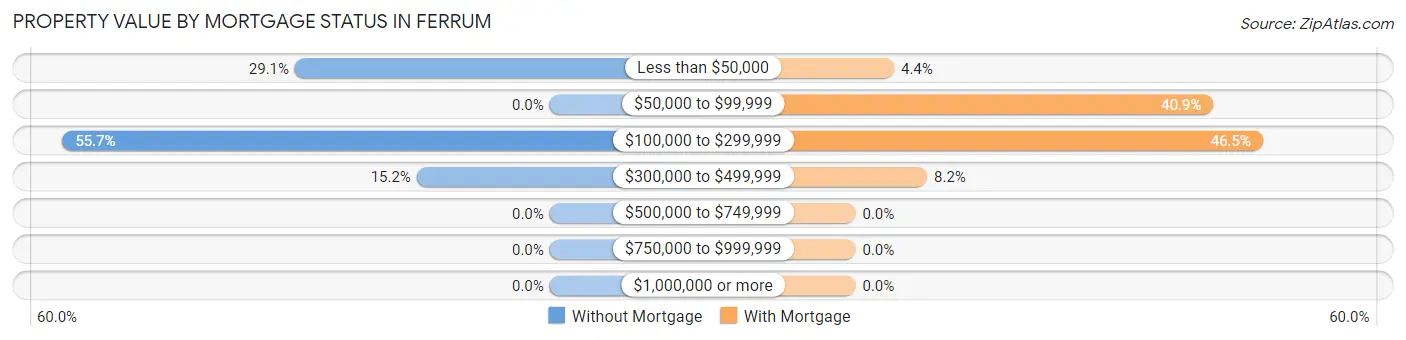
| Property Value | Without Mortgage | With Mortgage |
| Less than $50,000 | 23 (29.1%) | 7 (4.4%) |
| $50,000 to $99,999 | 0 (0.0%) | 65 (40.9%) |
| $100,000 to $299,999 | 44 (55.7%) | 74 (46.5%) |
| $300,000 to $499,999 | 12 (15.2%) | 13 (8.2%) |
| $500,000 to $749,999 | 0 (0.0%) | 0 (0.0%) |
| $750,000 to $999,999 | 0 (0.0%) | 0 (0.0%) |
| $1,000,000 or more | 0 (0.0%) | 0 (0.0%) |
| Total | 79 (100.0%) | 159 (100.0%) |
Household Income by Mortgage Status in Ferrum
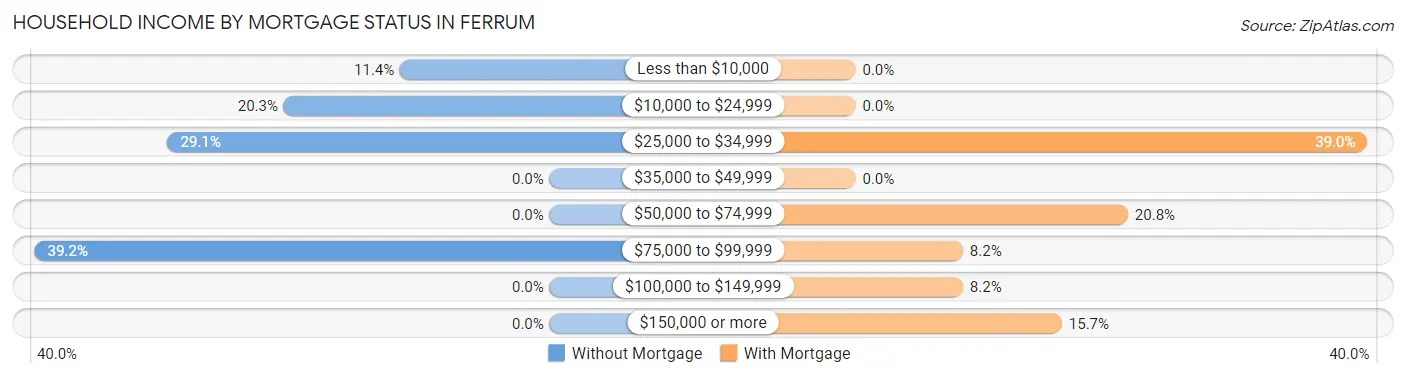
| Household Income | Without Mortgage | With Mortgage |
| Less than $10,000 | 9 (11.4%) | 0 (0.0%) |
| $10,000 to $24,999 | 16 (20.3%) | 0 (0.0%) |
| $25,000 to $34,999 | 23 (29.1%) | 62 (39.0%) |
| $35,000 to $49,999 | 0 (0.0%) | 0 (0.0%) |
| $50,000 to $74,999 | 0 (0.0%) | 33 (20.7%) |
| $75,000 to $99,999 | 31 (39.2%) | 13 (8.2%) |
| $100,000 to $149,999 | 0 (0.0%) | 13 (8.2%) |
| $150,000 or more | 0 (0.0%) | 25 (15.7%) |
| Total | 79 (100.0%) | 159 (100.0%) |
Property Value to Household Income Ratio in Ferrum
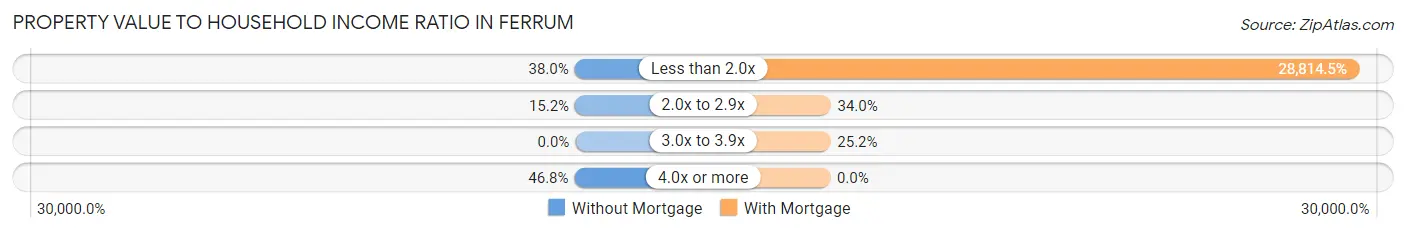
| Value-to-Income Ratio | Without Mortgage | With Mortgage |
| Less than 2.0x | 30 (38.0%) | 45,815 (28,814.5%) |
| 2.0x to 2.9x | 12 (15.2%) | 54 (34.0%) |
| 3.0x to 3.9x | 0 (0.0%) | 40 (25.2%) |
| 4.0x or more | 37 (46.8%) | 0 (0.0%) |
| Total | 79 (100.0%) | 159 (100.0%) |
Real Estate Taxes by Mortgage Status in Ferrum
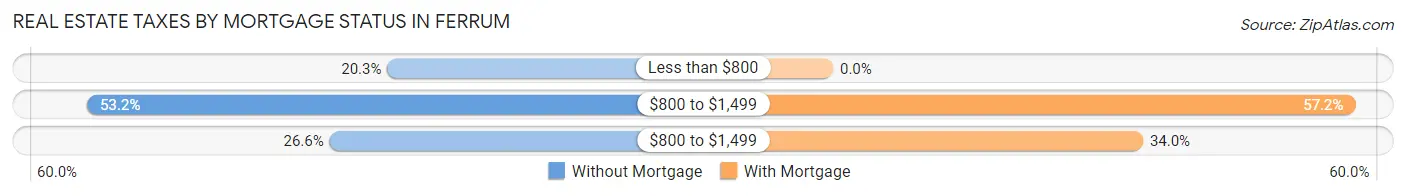
| Property Taxes | Without Mortgage | With Mortgage |
| Less than $800 | 16 (20.3%) | 0 (0.0%) |
| $800 to $1,499 | 42 (53.2%) | 91 (57.2%) |
| $800 to $1,499 | 21 (26.6%) | 54 (34.0%) |
| Total | 79 (100.0%) | 159 (100.0%) |
Health & Disability in Ferrum
Health Insurance Coverage by Age in Ferrum
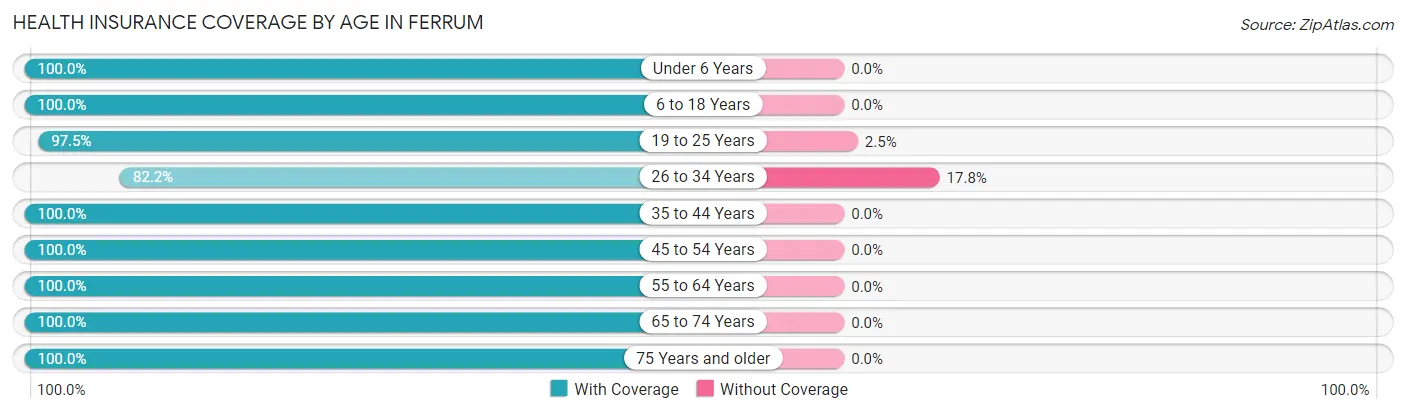
| Age Bracket | With Coverage | Without Coverage |
| Under 6 Years | 57 (100.0%) | 0 (0.0%) |
| 6 to 18 Years | 285 (100.0%) | 0 (0.0%) |
| 19 to 25 Years | 805 (97.5%) | 21 (2.5%) |
| 26 to 34 Years | 74 (82.2%) | 16 (17.8%) |
| 35 to 44 Years | 23 (100.0%) | 0 (0.0%) |
| 45 to 54 Years | 91 (100.0%) | 0 (0.0%) |
| 55 to 64 Years | 220 (100.0%) | 0 (0.0%) |
| 65 to 74 Years | 100 (100.0%) | 0 (0.0%) |
| 75 Years and older | 25 (100.0%) | 0 (0.0%) |
| Total | 1,680 (97.9%) | 37 (2.1%) |
Health Insurance Coverage by Citizenship Status in Ferrum
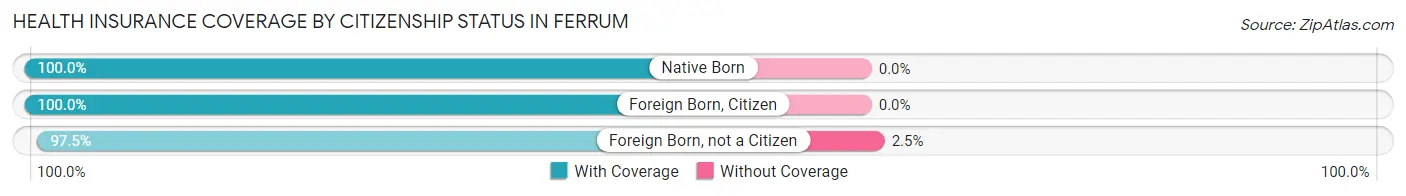
| Citizenship Status | With Coverage | Without Coverage |
| Native Born | 57 (100.0%) | 0 (0.0%) |
| Foreign Born, Citizen | 285 (100.0%) | 0 (0.0%) |
| Foreign Born, not a Citizen | 805 (97.5%) | 21 (2.5%) |
Health Insurance Coverage by Household Income in Ferrum
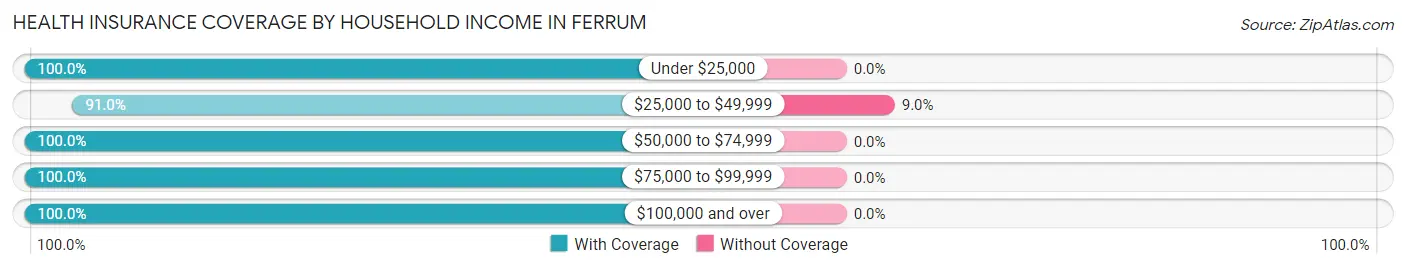
| Household Income | With Coverage | Without Coverage |
| Under $25,000 | 319 (100.0%) | 0 (0.0%) |
| $25,000 to $49,999 | 162 (91.0%) | 16 (9.0%) |
| $50,000 to $74,999 | 59 (100.0%) | 0 (0.0%) |
| $75,000 to $99,999 | 92 (100.0%) | 0 (0.0%) |
| $100,000 and over | 73 (100.0%) | 0 (0.0%) |
Public vs Private Health Insurance Coverage by Age in Ferrum
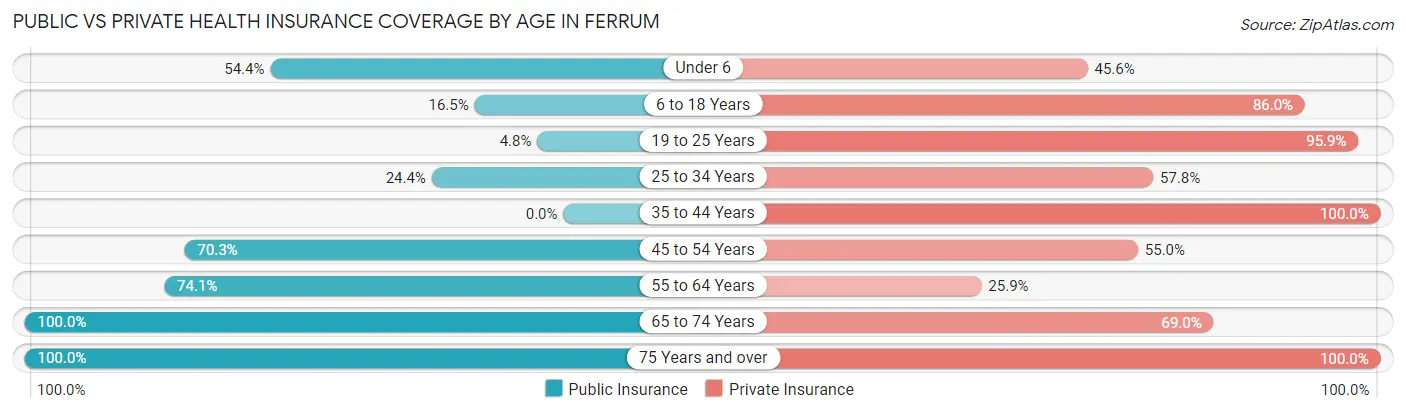
| Age Bracket | Public Insurance | Private Insurance |
| Under 6 | 31 (54.4%) | 26 (45.6%) |
| 6 to 18 Years | 47 (16.5%) | 245 (86.0%) |
| 19 to 25 Years | 40 (4.8%) | 792 (95.9%) |
| 25 to 34 Years | 22 (24.4%) | 52 (57.8%) |
| 35 to 44 Years | 0 (0.0%) | 23 (100.0%) |
| 45 to 54 Years | 64 (70.3%) | 50 (54.9%) |
| 55 to 64 Years | 163 (74.1%) | 57 (25.9%) |
| 65 to 74 Years | 100 (100.0%) | 69 (69.0%) |
| 75 Years and over | 25 (100.0%) | 25 (100.0%) |
| Total | 492 (28.6%) | 1,339 (78.0%) |
Disability Status by Sex by Age in Ferrum
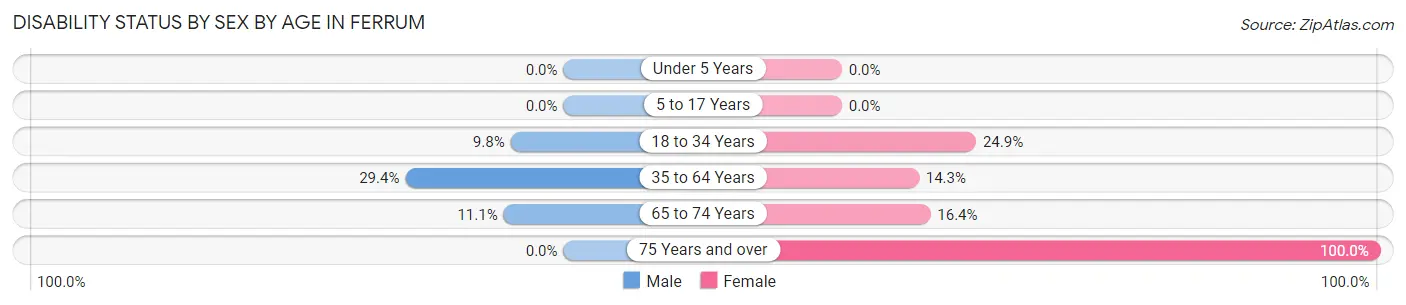
| Age Bracket | Male | Female |
| Under 5 Years | 0 (0.0%) | 0 (0.0%) |
| 5 to 17 Years | 0 (0.0%) | 0 (0.0%) |
| 18 to 34 Years | 58 (9.8%) | 138 (24.9%) |
| 35 to 64 Years | 59 (29.3%) | 19 (14.3%) |
| 65 to 74 Years | 3 (11.1%) | 12 (16.4%) |
| 75 Years and over | 0 (0.0%) | 17 (100.0%) |
Disability Class by Sex by Age in Ferrum
Disability Class: Hearing Difficulty
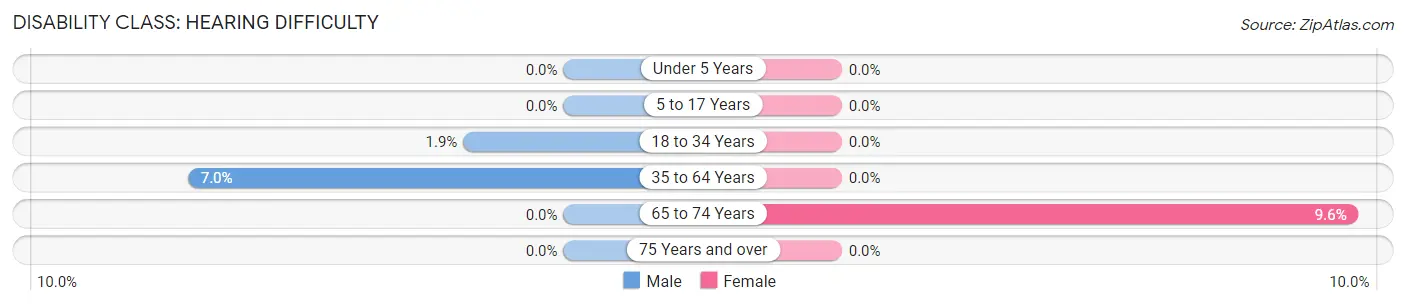
| Age Bracket | Male | Female |
| Under 5 Years | 0 (0.0%) | 0 (0.0%) |
| 5 to 17 Years | 0 (0.0%) | 0 (0.0%) |
| 18 to 34 Years | 11 (1.9%) | 0 (0.0%) |
| 35 to 64 Years | 14 (7.0%) | 0 (0.0%) |
| 65 to 74 Years | 0 (0.0%) | 7 (9.6%) |
| 75 Years and over | 0 (0.0%) | 0 (0.0%) |
Disability Class: Vision Difficulty
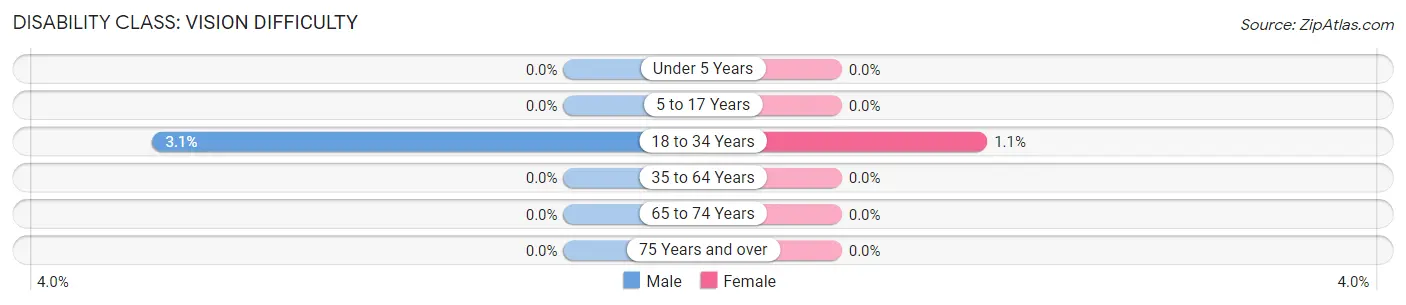
| Age Bracket | Male | Female |
| Under 5 Years | 0 (0.0%) | 0 (0.0%) |
| 5 to 17 Years | 0 (0.0%) | 0 (0.0%) |
| 18 to 34 Years | 18 (3.0%) | 6 (1.1%) |
| 35 to 64 Years | 0 (0.0%) | 0 (0.0%) |
| 65 to 74 Years | 0 (0.0%) | 0 (0.0%) |
| 75 Years and over | 0 (0.0%) | 0 (0.0%) |
Disability Class: Cognitive Difficulty
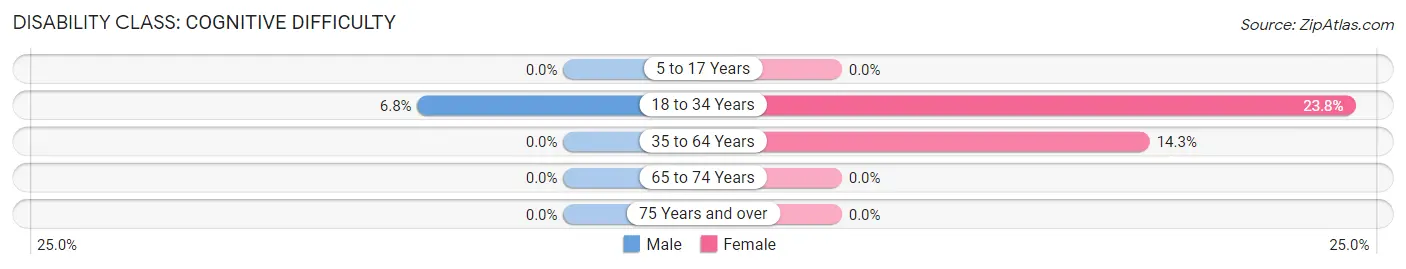
| Age Bracket | Male | Female |
| 5 to 17 Years | 0 (0.0%) | 0 (0.0%) |
| 18 to 34 Years | 40 (6.8%) | 132 (23.8%) |
| 35 to 64 Years | 0 (0.0%) | 19 (14.3%) |
| 65 to 74 Years | 0 (0.0%) | 0 (0.0%) |
| 75 Years and over | 0 (0.0%) | 0 (0.0%) |
Disability Class: Ambulatory Difficulty
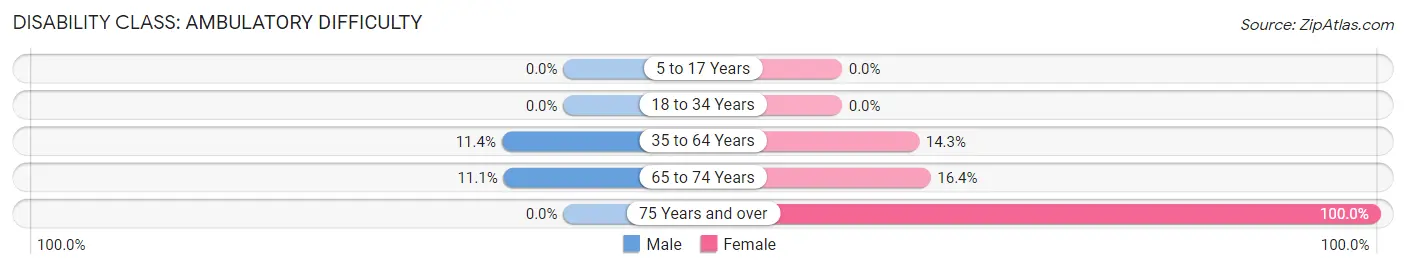
| Age Bracket | Male | Female |
| 5 to 17 Years | 0 (0.0%) | 0 (0.0%) |
| 18 to 34 Years | 0 (0.0%) | 0 (0.0%) |
| 35 to 64 Years | 23 (11.4%) | 19 (14.3%) |
| 65 to 74 Years | 3 (11.1%) | 12 (16.4%) |
| 75 Years and over | 0 (0.0%) | 17 (100.0%) |
Disability Class: Self-Care Difficulty
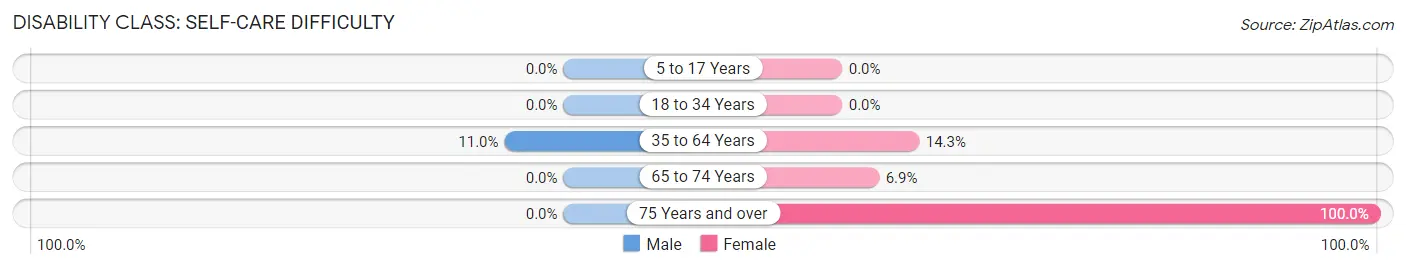
| Age Bracket | Male | Female |
| 5 to 17 Years | 0 (0.0%) | 0 (0.0%) |
| 18 to 34 Years | 0 (0.0%) | 0 (0.0%) |
| 35 to 64 Years | 22 (11.0%) | 19 (14.3%) |
| 65 to 74 Years | 0 (0.0%) | 5 (6.9%) |
| 75 Years and over | 0 (0.0%) | 17 (100.0%) |
Technology Access in Ferrum
Computing Device Access in Ferrum
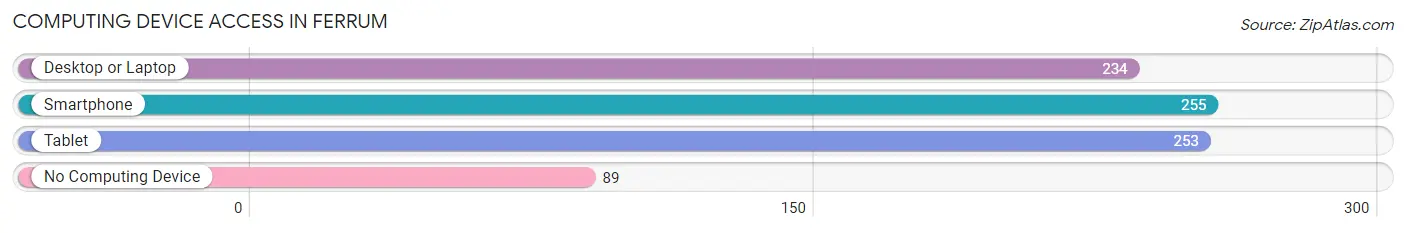
| Device Type | # Households | % Households |
| Desktop or Laptop | 234 | 62.1% |
| Smartphone | 255 | 67.6% |
| Tablet | 253 | 67.1% |
| No Computing Device | 89 | 23.6% |
| Total | 377 | 100.0% |
Internet Access in Ferrum
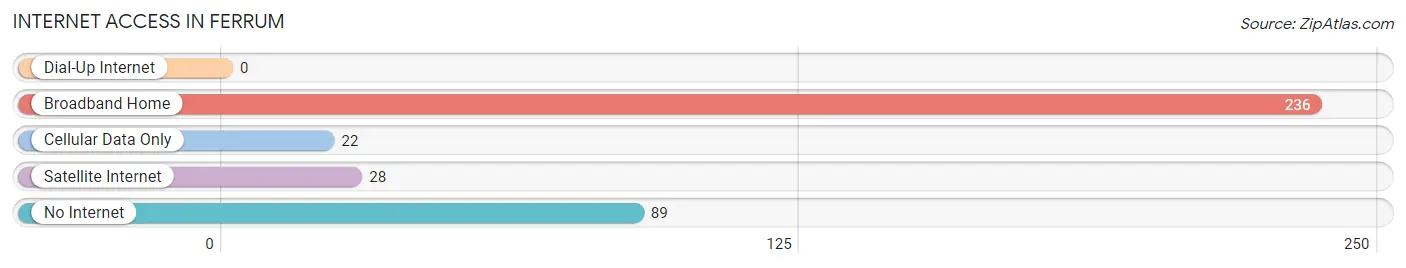
| Internet Type | # Households | % Households |
| Dial-Up Internet | 0 | 0.0% |
| Broadband Home | 236 | 62.6% |
| Cellular Data Only | 22 | 5.8% |
| Satellite Internet | 28 | 7.4% |
| No Internet | 89 | 23.6% |
| Total | 377 | 100.0% |
Ferrum Summary
Ferrum, Virginia is a small town located in Franklin County, Virginia. It is situated in the foothills of the Blue Ridge Mountains and is part of the Roanoke Metropolitan Statistical Area. The town has a population of approximately 1,400 people and is home to Ferrum College, a private liberal arts college.
History
Ferrum was founded in 1913 by the Ferrum Land Company, which was owned by the Ferrum Iron Company. The company was established to exploit the iron ore deposits in the area. The town was named after the Latin word for iron, ferrum. The town was incorporated in 1914 and the first mayor was elected in 1915.
The town grew rapidly in the early 20th century, with the Ferrum Iron Company providing employment for many of the town’s residents. The company also built a number of homes for its employees. The town also had a number of other businesses, including a general store, a bank, a post office, and a hotel.
In the late 1920s, the Ferrum Iron Company began to experience financial difficulties and eventually went out of business in 1931. The town’s economy was further impacted by the Great Depression and the population began to decline.
In the 1940s, the town was revitalized by the establishment of Ferrum College. The college provided employment for many of the town’s residents and also attracted new residents to the area. The college also provided educational opportunities for the town’s residents.
In the 1950s, the town experienced a period of growth and development. The population increased and new businesses were established. The town also experienced a period of racial integration, with African Americans moving into the area.
In the 1960s, the town experienced a period of decline. The population decreased and many businesses closed. The town was also impacted by the construction of Interstate 81, which bypassed the town.
In the 1970s, the town experienced a period of revitalization. The population began to increase and new businesses were established. The town also experienced a period of racial integration, with African Americans moving into the area.
In the 1980s, the town experienced a period of growth and development. The population increased and new businesses were established. The town also experienced a period of racial integration, with African Americans moving into the area.
Geography
Ferrum is located in the foothills of the Blue Ridge Mountains in Franklin County, Virginia. The town is situated at an elevation of 1,400 feet and is located approximately 25 miles southwest of Roanoke. The town is located along the banks of the Little River and is surrounded by the George Washington and Jefferson National Forests.
The town has a total area of 1.2 square miles, all of which is land. The town is located in a humid subtropical climate zone and experiences hot, humid summers and mild winters.
Economy
Ferrum’s economy is largely based on education and tourism. The town is home to Ferrum College, which provides employment for many of the town’s residents. The college also attracts visitors to the area, who come to attend sporting events, concerts, and other events.
The town also has a number of small businesses, including restaurants, retail stores, and service providers. The town is also home to a number of farms, which produce a variety of crops, including corn, soybeans, and hay.
Demographics
As of the 2010 census, Ferrum had a population of 1,400 people. The racial makeup of the town was 94.3% White, 2.9% African American, 0.4% Native American, 0.7% Asian, 0.1% Pacific Islander, 0.7% from other races, and 1.1% from two or more races. Hispanic or Latino of any race were 1.9% of the population.
The median household income in Ferrum was $37,500 and the median family income was $45,000. The per capita income in Ferrum was $17,000. About 11.3% of families and 14.3% of the population were below the poverty line, including 18.2% of those under age 18 and 8.3% of those age 65 or over.
Common Questions
What is Per Capita Income in Ferrum?
Per Capita income in Ferrum is $13,150.
What is the Median Family Income in Ferrum?
Median Family Income in Ferrum is $47,120.
What is the Median Household income in Ferrum?
Median Household Income in Ferrum is $33,967.
What is Income or Wage Gap in Ferrum?
Income or Wage Gap in Ferrum is 8.1%.
Women in Ferrum earn 91.9 cents for every dollar earned by a man.
What is Inequality or Gini Index in Ferrum?
Inequality or Gini Index in Ferrum is 0.53.
What is the Total Population of Ferrum?
Total Population of Ferrum is 1,717.
What is the Total Male Population of Ferrum?
Total Male Population of Ferrum is 848.
What is the Total Female Population of Ferrum?
Total Female Population of Ferrum is 869.
What is the Ratio of Males per 100 Females in Ferrum?
There are 97.58 Males per 100 Females in Ferrum.
What is the Ratio of Females per 100 Males in Ferrum?
There are 102.48 Females per 100 Males in Ferrum.
What is the Median Population Age in Ferrum?
Median Population Age in Ferrum is 21.3 Years.
What is the Average Family Size in Ferrum
Average Family Size in Ferrum is 2.6 People.
What is the Average Household Size in Ferrum
Average Household Size in Ferrum is 1.9 People.
How Large is the Labor Force in Ferrum?
There are 876 People in the Labor Forcein in Ferrum.
What is the Percentage of People in the Labor Force in Ferrum?
54.6% of People are in the Labor Force in Ferrum.
What is the Unemployment Rate in Ferrum?
Unemployment Rate in Ferrum is 6.5%.