Esmont, VA Map & Demographics
Esmont Map
Esmont Overview
$24,405
PER CAPITA INCOME
$82,882
AVG FAMILY INCOME
$53,051
AVG HOUSEHOLD INCOME
12.0%
WAGE / INCOME GAP [ % ]
88.0¢/ $1
WAGE / INCOME GAP [ $ ]
0.35
INEQUALITY / GINI INDEX
456
TOTAL POPULATION
107
MALE POPULATION
349
FEMALE POPULATION
30.66
MALES / 100 FEMALES
326.17
FEMALES / 100 MALES
38.8
MEDIAN AGE
3.0
AVG FAMILY SIZE
2.2
AVG HOUSEHOLD SIZE
243
LABOR FORCE [ PEOPLE ]
63.9%
PERCENT IN LABOR FORCE
4.5%
UNEMPLOYMENT RATE
Esmont Zip Codes
Income in Esmont
Income Overview in Esmont
Per Capita Income in Esmont is $24,405, while median incomes of families and households are $82,882 and $53,051 respectively.
| Characteristic | Number | Measure |
| Per Capita Income | 456 | $24,405 |
| Median Family Income | 107 | $82,882 |
| Mean Family Income | 107 | $68,439 |
| Median Household Income | 211 | $53,051 |
| Mean Household Income | 211 | $52,826 |
| Income Deficit | 107 | $0 |
| Wage / Income Gap (%) | 456 | 12.05% |
| Wage / Income Gap ($) | 456 | 87.95¢ per $1 |
| Gini / Inequality Index | 456 | 0.35 |
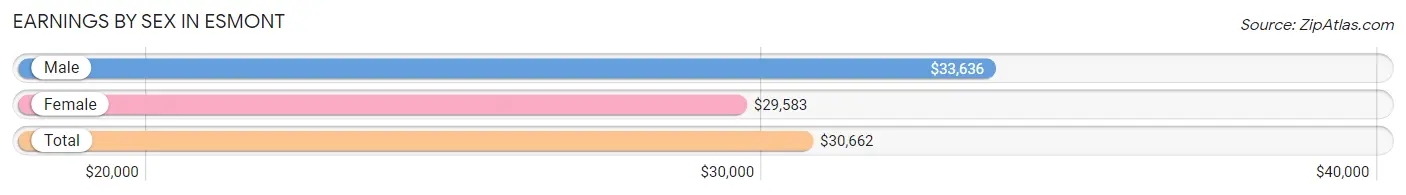
Earnings by Sex in Esmont
Average Earnings in Esmont are $30,662, $33,636 for men and $29,583 for women, a difference of 12.0%.
| Sex | Number | Average Earnings |
| Male | 36 (15.5%) | $33,636 |
| Female | 196 (84.5%) | $29,583 |
| Total | 232 (100.0%) | $30,662 |
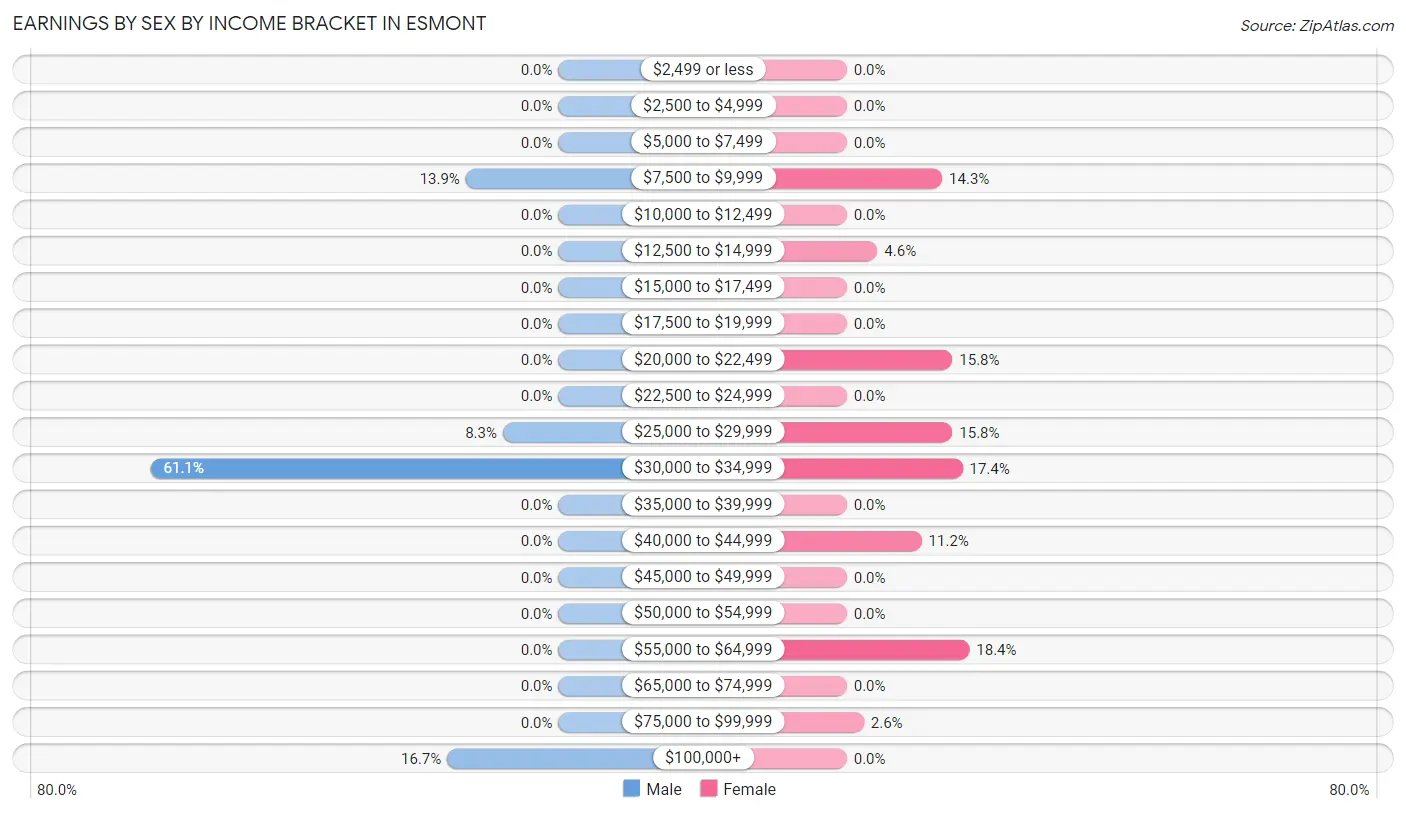
Earnings by Sex by Income Bracket in Esmont
The most common earnings brackets in Esmont are $30,000 to $34,999 for men (22 | 61.1%) and $55,000 to $64,999 for women (36 | 18.4%).
| Income | Male | Female |
| $2,499 or less | 0 (0.0%) | 0 (0.0%) |
| $2,500 to $4,999 | 0 (0.0%) | 0 (0.0%) |
| $5,000 to $7,499 | 0 (0.0%) | 0 (0.0%) |
| $7,500 to $9,999 | 5 (13.9%) | 28 (14.3%) |
| $10,000 to $12,499 | 0 (0.0%) | 0 (0.0%) |
| $12,500 to $14,999 | 0 (0.0%) | 9 (4.6%) |
| $15,000 to $17,499 | 0 (0.0%) | 0 (0.0%) |
| $17,500 to $19,999 | 0 (0.0%) | 0 (0.0%) |
| $20,000 to $22,499 | 0 (0.0%) | 31 (15.8%) |
| $22,500 to $24,999 | 0 (0.0%) | 0 (0.0%) |
| $25,000 to $29,999 | 3 (8.3%) | 31 (15.8%) |
| $30,000 to $34,999 | 22 (61.1%) | 34 (17.3%) |
| $35,000 to $39,999 | 0 (0.0%) | 0 (0.0%) |
| $40,000 to $44,999 | 0 (0.0%) | 22 (11.2%) |
| $45,000 to $49,999 | 0 (0.0%) | 0 (0.0%) |
| $50,000 to $54,999 | 0 (0.0%) | 0 (0.0%) |
| $55,000 to $64,999 | 0 (0.0%) | 36 (18.4%) |
| $65,000 to $74,999 | 0 (0.0%) | 0 (0.0%) |
| $75,000 to $99,999 | 0 (0.0%) | 5 (2.5%) |
| $100,000+ | 6 (16.7%) | 0 (0.0%) |
| Total | 36 (100.0%) | 196 (100.0%) |
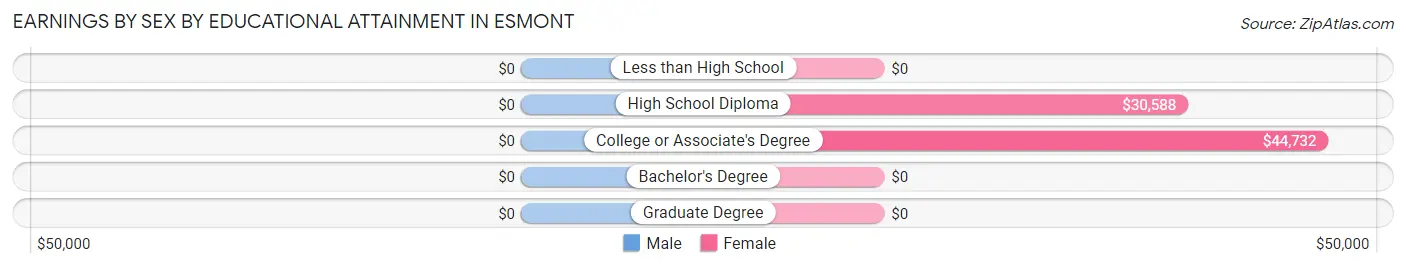
Earnings by Sex by Educational Attainment in Esmont
| Educational Attainment | Male Income | Female Income |
| Less than High School | - | - |
| High School Diploma | - | - |
| College or Associate's Degree | - | - |
| Bachelor's Degree | - | - |
| Graduate Degree | - | - |
| Total | $34,091 | $31,140 |
Family Income in Esmont
Family Income Brackets in Esmont
According to the Esmont family income data, there are 36 families falling into the $75,000 to $99,999 income range, which is the most common income bracket and makes up 33.6% of all families.
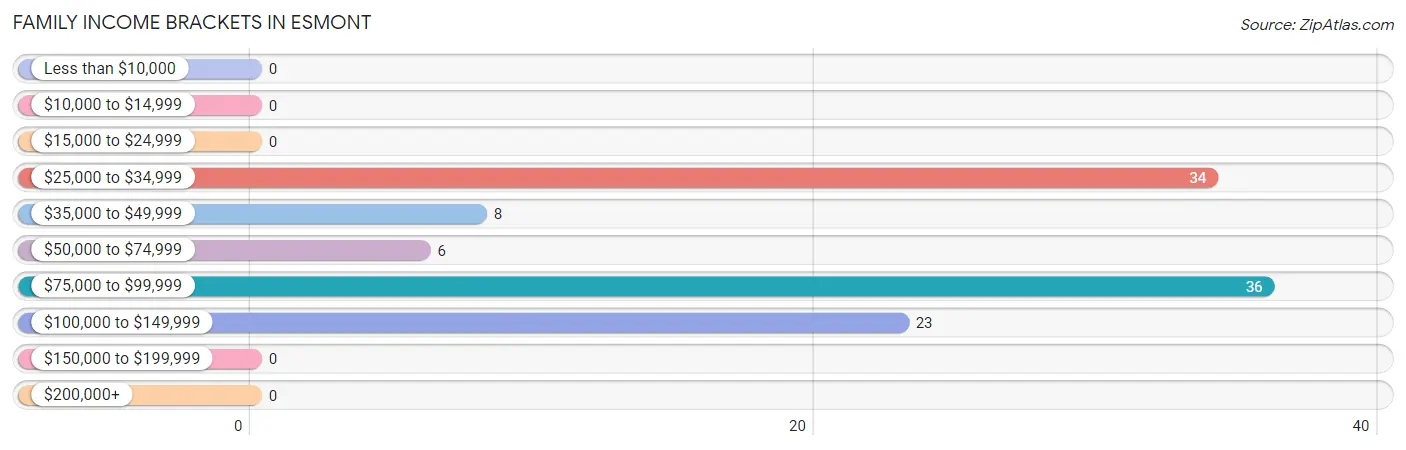
| Income Bracket | # Families | % Families |
| Less than $10,000 | 0 | 0.0% |
| $10,000 to $14,999 | 0 | 0.0% |
| $15,000 to $24,999 | 0 | 0.0% |
| $25,000 to $34,999 | 34 | 31.8% |
| $35,000 to $49,999 | 8 | 7.5% |
| $50,000 to $74,999 | 6 | 5.6% |
| $75,000 to $99,999 | 36 | 33.6% |
| $100,000 to $149,999 | 23 | 21.5% |
| $150,000 to $199,999 | 0 | 0.0% |
| $200,000+ | 0 | 0.0% |
Family Income by Famaliy Size in Esmont
3-person families (60 | 56.1%) account for the highest median family income in Esmont with $83,611 per family, while 3-person families (60 | 56.1%) have the highest median income of $27,870 per family member.
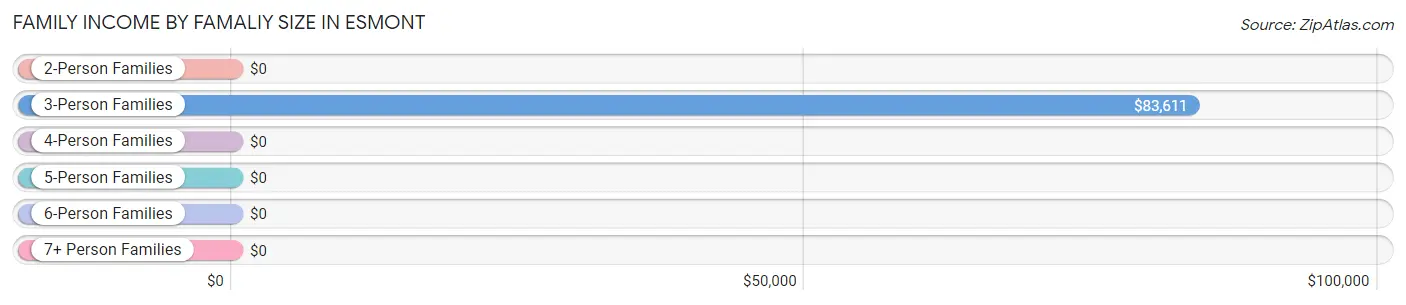
| Income Bracket | # Families | Median Income |
| 2-Person Families | 34 (31.8%) | $0 |
| 3-Person Families | 60 (56.1%) | $83,611 |
| 4-Person Families | 13 (12.1%) | $0 |
| 5-Person Families | 0 (0.0%) | $0 |
| 6-Person Families | 0 (0.0%) | $0 |
| 7+ Person Families | 0 (0.0%) | $0 |
| Total | 107 (100.0%) | $82,882 |
Family Income by Number of Earners in Esmont
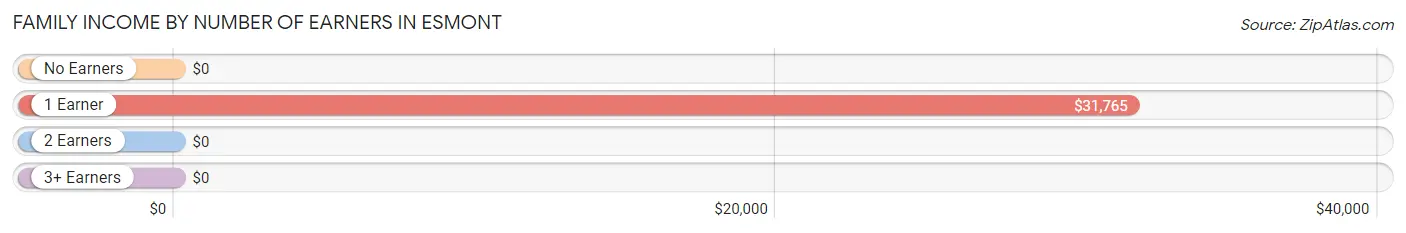
| Number of Earners | # Families | Median Income |
| No Earners | 0 (0.0%) | $0 |
| 1 Earner | 48 (44.9%) | $31,765 |
| 2 Earners | 40 (37.4%) | $0 |
| 3+ Earners | 19 (17.8%) | $0 |
| Total | 107 (100.0%) | $82,882 |
Household Income in Esmont
Household Income Brackets in Esmont
With 56 households falling in the category, the $10,000 to $14,999 income range is the most frequent in Esmont, accounting for 26.5% of all households.
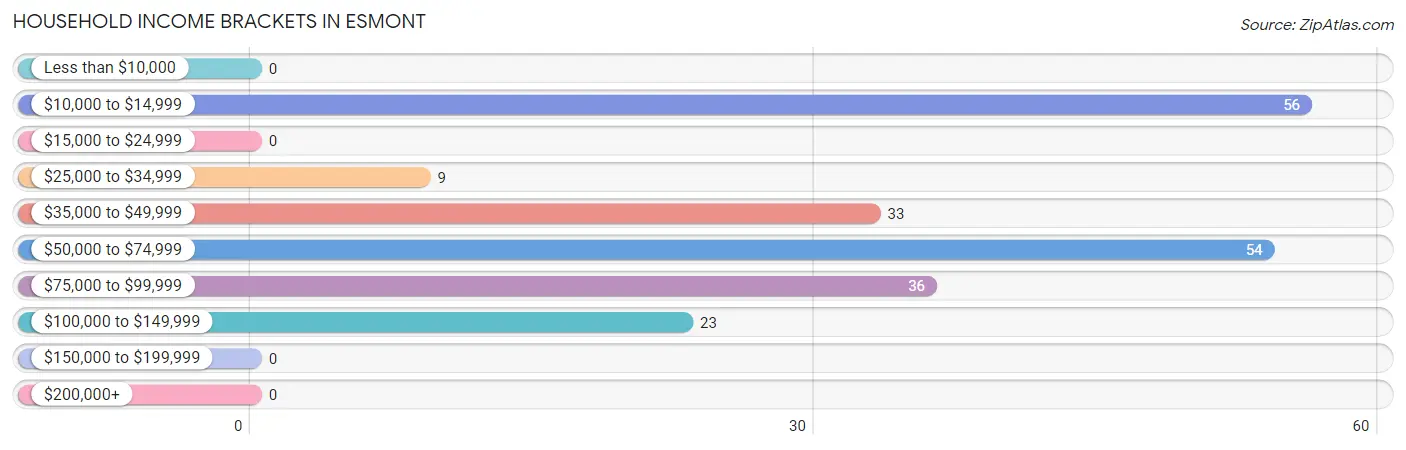
| Income Bracket | # Households | % Households |
| Less than $10,000 | 0 | 0.0% |
| $10,000 to $14,999 | 56 | 26.5% |
| $15,000 to $24,999 | 0 | 0.0% |
| $25,000 to $34,999 | 9 | 4.3% |
| $35,000 to $49,999 | 33 | 15.6% |
| $50,000 to $74,999 | 54 | 25.6% |
| $75,000 to $99,999 | 36 | 17.1% |
| $100,000 to $149,999 | 23 | 10.9% |
| $150,000 to $199,999 | 0 | 0.0% |
| $200,000+ | 0 | 0.0% |
Household Income by Householder Age in Esmont
The median household income in Esmont is $53,051, with the highest median household income of $83,194 found in the 45 to 64 years age bracket for the primary householder. A total of 78 households (37.0%) fall into this category.
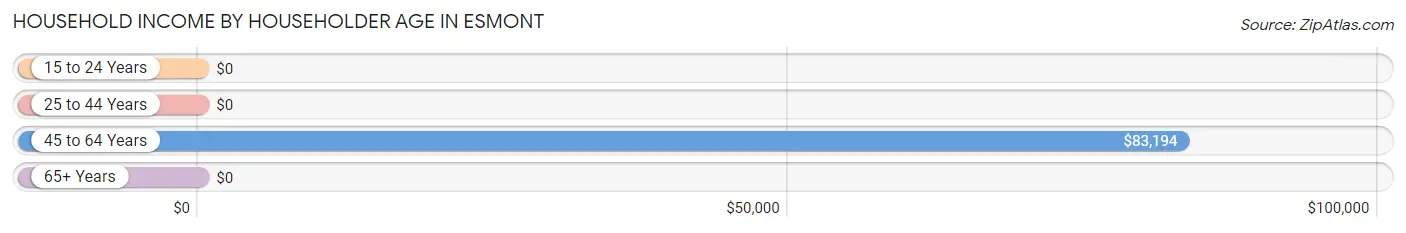
| Income Bracket | # Households | Median Income |
| 15 to 24 Years | 0 (0.0%) | $0 |
| 25 to 44 Years | 38 (18.0%) | $0 |
| 45 to 64 Years | 78 (37.0%) | $83,194 |
| 65+ Years | 95 (45.0%) | $0 |
| Total | 211 (100.0%) | $53,051 |
Poverty in Esmont
Income Below Poverty by Sex and Age in Esmont
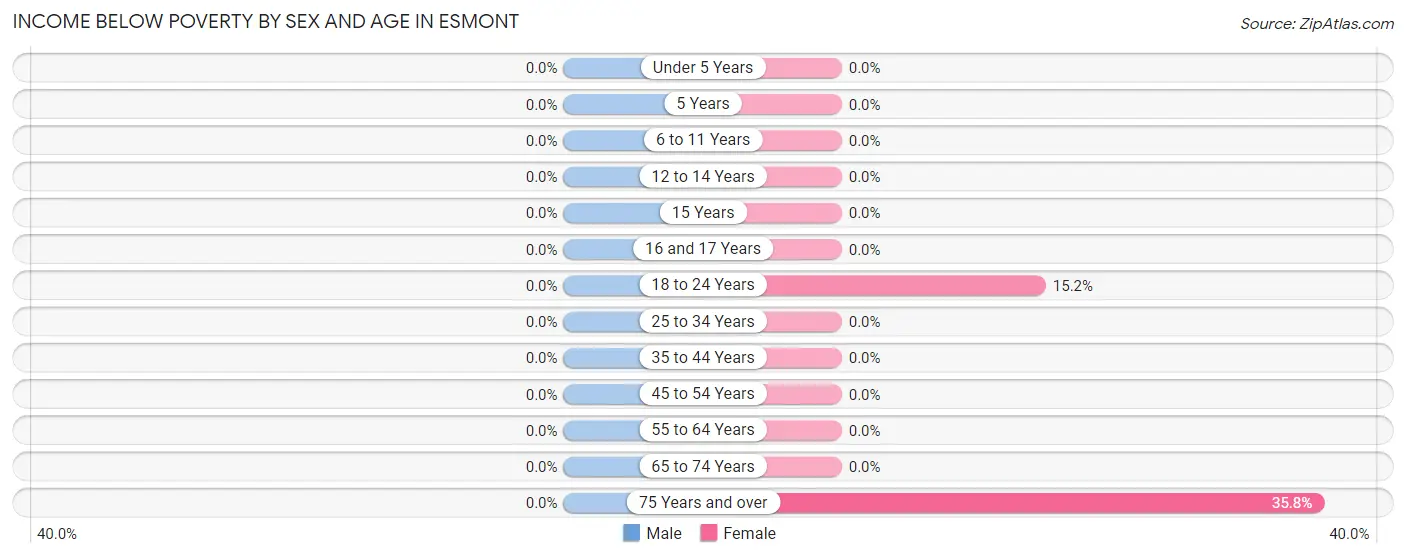
| Age Bracket | Male | Female |
| Under 5 Years | 0 (0.0%) | 0 (0.0%) |
| 5 Years | 0 (0.0%) | 0 (0.0%) |
| 6 to 11 Years | 0 (0.0%) | 0 (0.0%) |
| 12 to 14 Years | 0 (0.0%) | 0 (0.0%) |
| 15 Years | 0 (0.0%) | 0 (0.0%) |
| 16 and 17 Years | 0 (0.0%) | 0 (0.0%) |
| 18 to 24 Years | 0 (0.0%) | 5 (15.1%) |
| 25 to 34 Years | 0 (0.0%) | 0 (0.0%) |
| 35 to 44 Years | 0 (0.0%) | 0 (0.0%) |
| 45 to 54 Years | 0 (0.0%) | 0 (0.0%) |
| 55 to 64 Years | 0 (0.0%) | 0 (0.0%) |
| 65 to 74 Years | 0 (0.0%) | 0 (0.0%) |
| 75 Years and over | 0 (0.0%) | 29 (35.8%) |
| Total | 0 (0.0%) | 34 (9.7%) |
Income Above Poverty by Sex and Age in Esmont
According to the poverty statistics in Esmont, males aged 6 to 11 years and females aged under 5 years are the age groups that are most secure financially, with 100.0% of males and 100.0% of females in these age groups living above the poverty line.
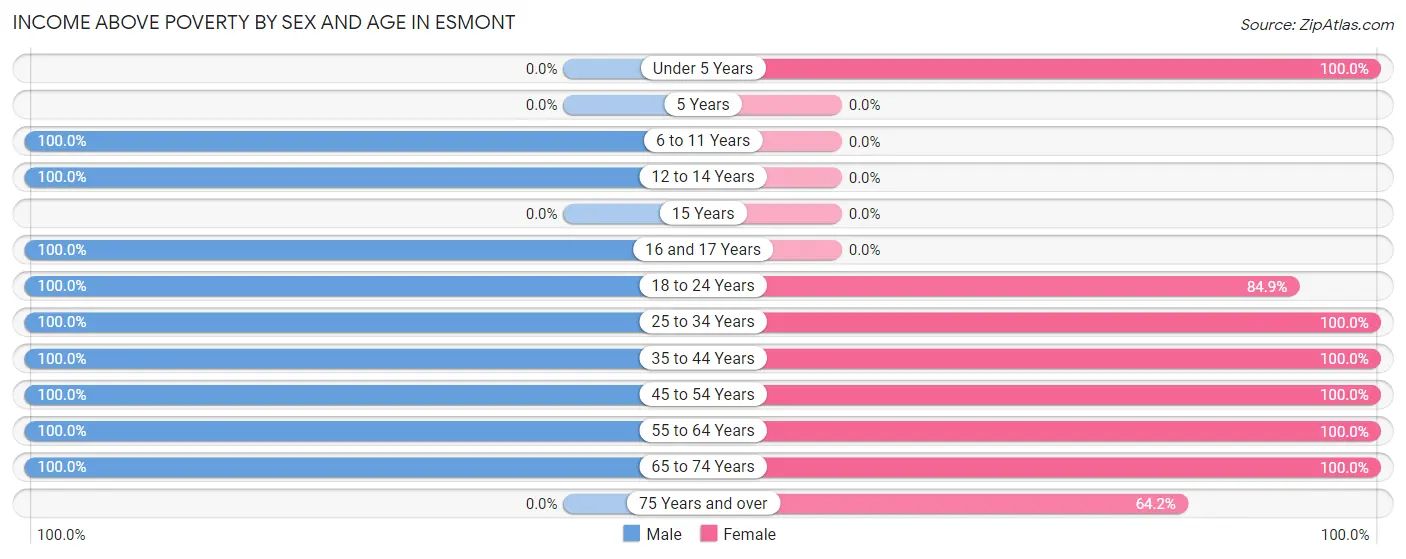
| Age Bracket | Male | Female |
| Under 5 Years | 0 (0.0%) | 58 (100.0%) |
| 5 Years | 0 (0.0%) | 0 (0.0%) |
| 6 to 11 Years | 15 (100.0%) | 0 (0.0%) |
| 12 to 14 Years | 3 (100.0%) | 0 (0.0%) |
| 15 Years | 0 (0.0%) | 0 (0.0%) |
| 16 and 17 Years | 5 (100.0%) | 0 (0.0%) |
| 18 to 24 Years | 10 (100.0%) | 28 (84.9%) |
| 25 to 34 Years | 11 (100.0%) | 65 (100.0%) |
| 35 to 44 Years | 6 (100.0%) | 29 (100.0%) |
| 45 to 54 Years | 20 (100.0%) | 6 (100.0%) |
| 55 to 64 Years | 31 (100.0%) | 69 (100.0%) |
| 65 to 74 Years | 6 (100.0%) | 8 (100.0%) |
| 75 Years and over | 0 (0.0%) | 52 (64.2%) |
| Total | 107 (100.0%) | 315 (90.3%) |
Income Below Poverty Among Married-Couple Families in Esmont
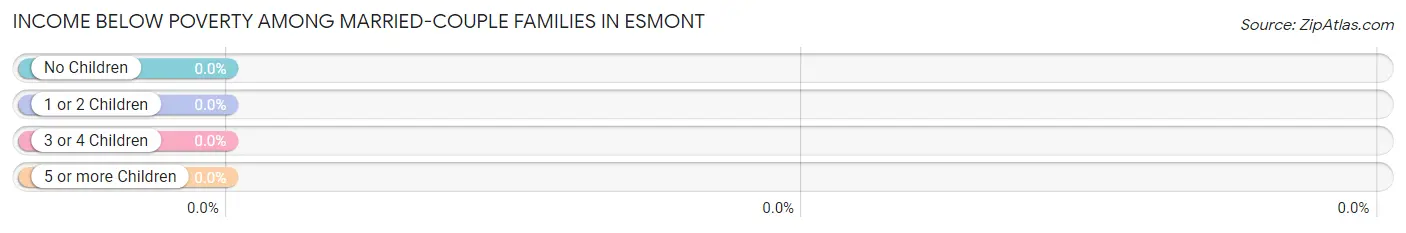
| Children | Above Poverty | Below Poverty |
| No Children | 50 (100.0%) | 0 (0.0%) |
| 1 or 2 Children | 17 (100.0%) | 0 (0.0%) |
| 3 or 4 Children | 0 (0.0%) | 0 (0.0%) |
| 5 or more Children | 0 (0.0%) | 0 (0.0%) |
| Total | 67 (100.0%) | 0 (0.0%) |
Income Below Poverty Among Single-Parent Households in Esmont
| Children | Single Father | Single Mother |
| No Children | 0 (0.0%) | 0 (0.0%) |
| 1 or 2 Children | 0 (0.0%) | 0 (0.0%) |
| 3 or 4 Children | 0 (0.0%) | 0 (0.0%) |
| 5 or more Children | 0 (0.0%) | 0 (0.0%) |
| Total | 0 (0.0%) | 0 (0.0%) |
Income Below Poverty Among Married-Couple vs Single-Parent Households in Esmont
| Children | Married-Couple Families | Single-Parent Households |
| No Children | 0 (0.0%) | 0 (0.0%) |
| 1 or 2 Children | 0 (0.0%) | 0 (0.0%) |
| 3 or 4 Children | 0 (0.0%) | 0 (0.0%) |
| 5 or more Children | 0 (0.0%) | 0 (0.0%) |
| Total | 0 (0.0%) | 0 (0.0%) |
Race in Esmont
The most populous races in Esmont are Black / African American (255 | 55.9%), White / Caucasian (143 | 31.4%), and Two or more Races (58 | 12.7%).
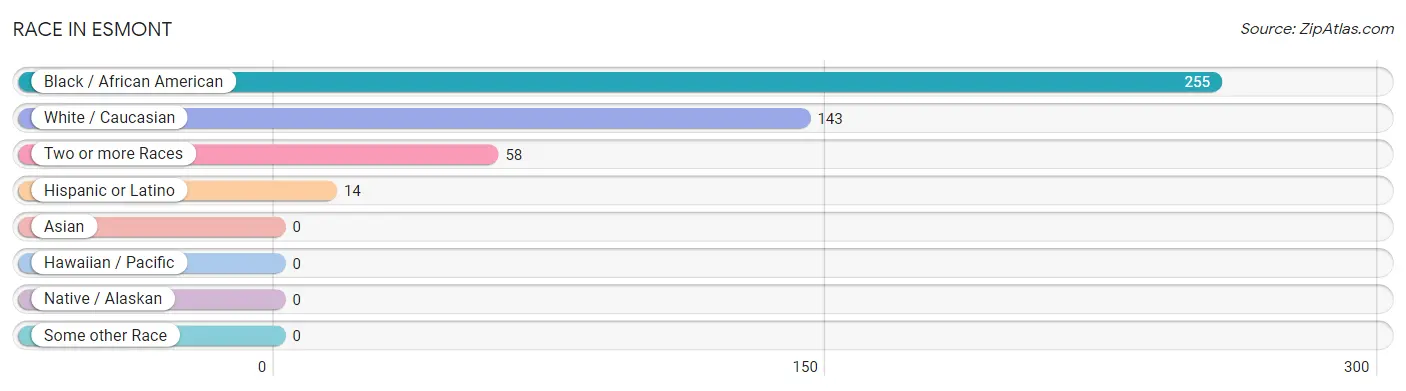
| Race | # Population | % Population |
| Asian | 0 | 0.0% |
| Black / African American | 255 | 55.9% |
| Hawaiian / Pacific | 0 | 0.0% |
| Hispanic or Latino | 14 | 3.1% |
| Native / Alaskan | 0 | 0.0% |
| White / Caucasian | 143 | 31.4% |
| Two or more Races | 58 | 12.7% |
| Some other Race | 0 | 0.0% |
| Total | 456 | 100.0% |
Ancestry in Esmont
The most populous ancestries reported in Esmont are French (92 | 20.2%), Irish (60 | 13.2%), English (36 | 7.9%), American (28 | 6.1%), and Mexican (14 | 3.1%), together accounting for 50.4% of all Esmont residents.
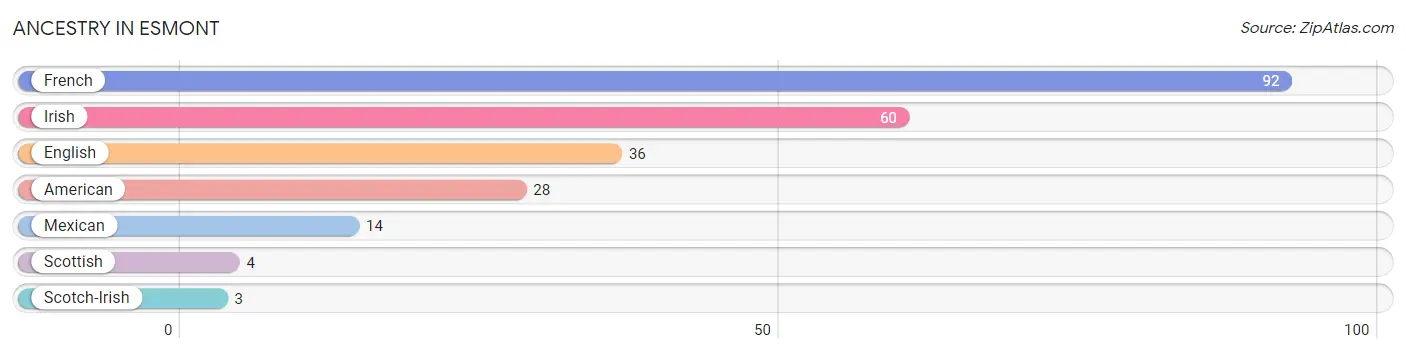
| Ancestry | # Population | % Population |
| American | 28 | 6.1% |
| English | 36 | 7.9% |
| French | 92 | 20.2% |
| Irish | 60 | 13.2% |
| Mexican | 14 | 3.1% |
| Scotch-Irish | 3 | 0.7% |
| Scottish | 4 | 0.9% | View All 7 Rows |
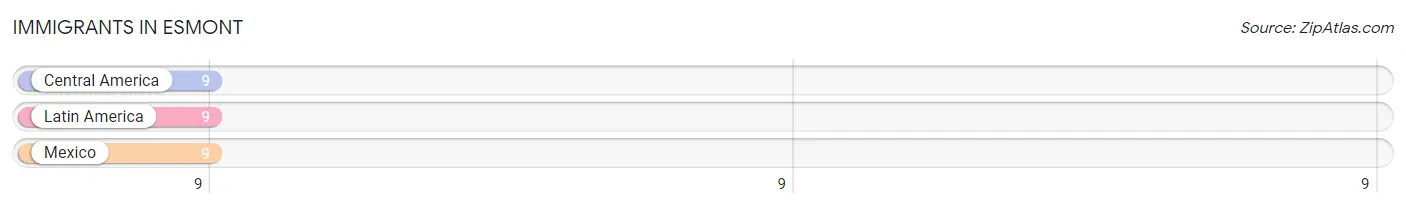
Immigrants in Esmont
The most numerous immigrant groups reported in Esmont came from Central America (9 | 2.0%), Latin America (9 | 2.0%), and Mexico (9 | 2.0%), together accounting for 5.9% of all Esmont residents.
| Immigration Origin | # Population | % Population |
| Central America | 9 | 2.0% |
| Latin America | 9 | 2.0% |
| Mexico | 9 | 2.0% | View All 3 Rows |
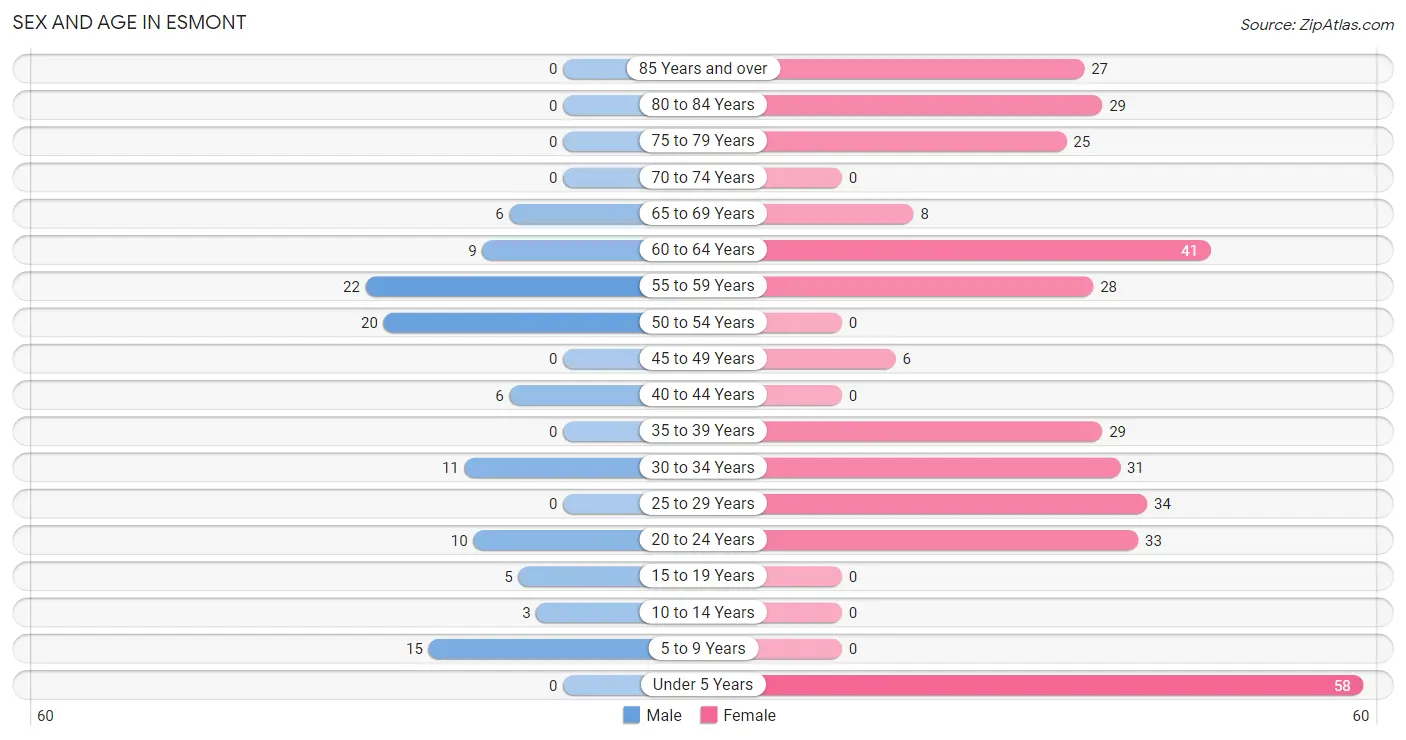
Sex and Age in Esmont
Sex and Age in Esmont
The most populous age groups in Esmont are 55 to 59 Years (22 | 20.6%) for men and Under 5 Years (58 | 16.6%) for women.
| Age Bracket | Male | Female |
| Under 5 Years | 0 (0.0%) | 58 (16.6%) |
| 5 to 9 Years | 15 (14.0%) | 0 (0.0%) |
| 10 to 14 Years | 3 (2.8%) | 0 (0.0%) |
| 15 to 19 Years | 5 (4.7%) | 0 (0.0%) |
| 20 to 24 Years | 10 (9.3%) | 33 (9.5%) |
| 25 to 29 Years | 0 (0.0%) | 34 (9.7%) |
| 30 to 34 Years | 11 (10.3%) | 31 (8.9%) |
| 35 to 39 Years | 0 (0.0%) | 29 (8.3%) |
| 40 to 44 Years | 6 (5.6%) | 0 (0.0%) |
| 45 to 49 Years | 0 (0.0%) | 6 (1.7%) |
| 50 to 54 Years | 20 (18.7%) | 0 (0.0%) |
| 55 to 59 Years | 22 (20.6%) | 28 (8.0%) |
| 60 to 64 Years | 9 (8.4%) | 41 (11.7%) |
| 65 to 69 Years | 6 (5.6%) | 8 (2.3%) |
| 70 to 74 Years | 0 (0.0%) | 0 (0.0%) |
| 75 to 79 Years | 0 (0.0%) | 25 (7.2%) |
| 80 to 84 Years | 0 (0.0%) | 29 (8.3%) |
| 85 Years and over | 0 (0.0%) | 27 (7.7%) |
| Total | 107 (100.0%) | 349 (100.0%) |
Families and Households in Esmont
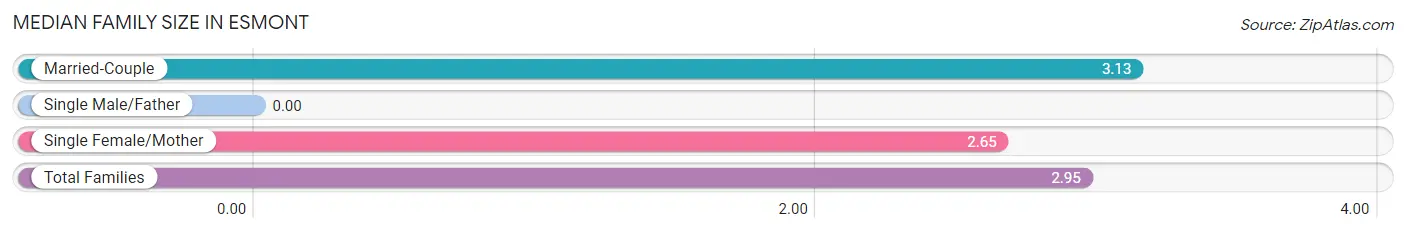
Median Family Size in Esmont
| Family Type | # Families | Family Size |
| Married-Couple | 67 (62.6%) | 3.13 |
| Single Male/Father | 0 (0.0%) | - |
| Single Female/Mother | 40 (37.4%) | 2.65 |
| Total Families | 107 (100.0%) | 2.95 |
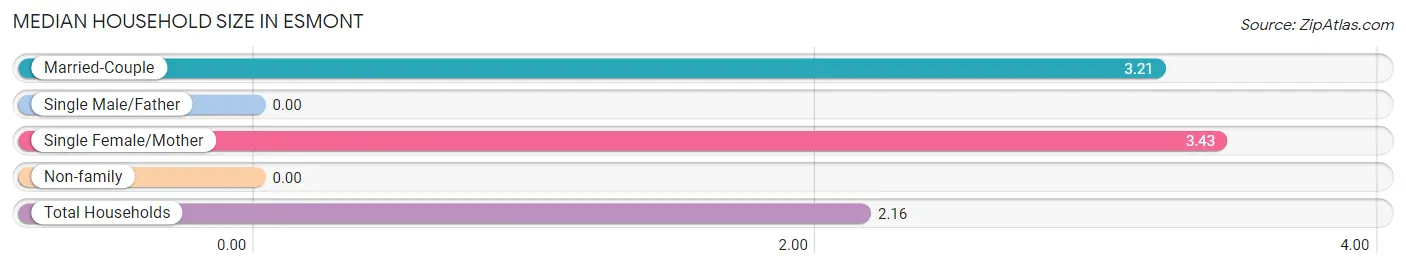
Median Household Size in Esmont
| Household Type | # Households | Household Size |
| Married-Couple | 67 (31.8%) | 3.21 |
| Single Male/Father | 0 (0.0%) | - |
| Single Female/Mother | 40 (19.0%) | 3.43 |
| Non-family | 104 (49.3%) | - |
| Total Households | 211 (100.0%) | 2.16 |
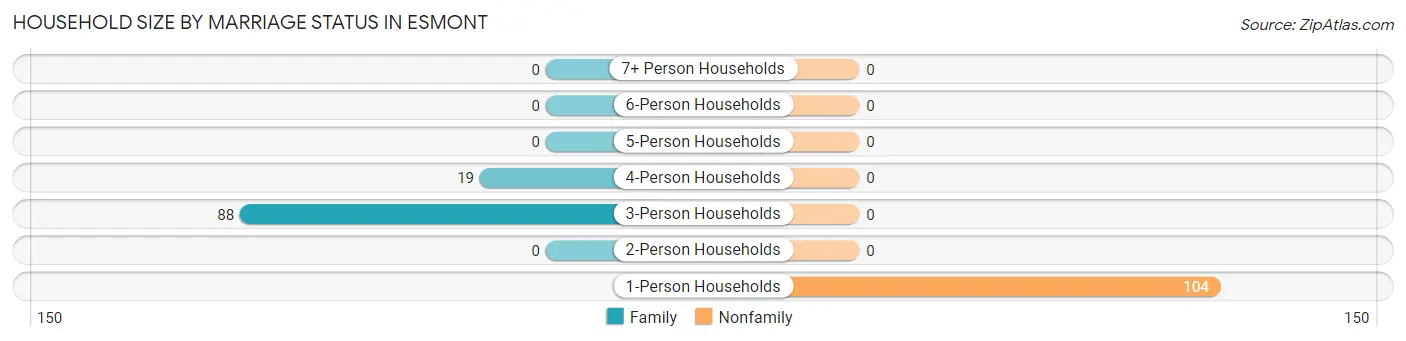
Household Size by Marriage Status in Esmont
Out of a total of 211 households in Esmont, 107 (50.7%) are family households, while 104 (49.3%) are nonfamily households. The most numerous type of family households are 3-person households, comprising 88, and the most common type of nonfamily households are 1-person households, comprising 104.
| Household Size | Family Households | Nonfamily Households |
| 1-Person Households | - | 104 (49.3%) |
| 2-Person Households | 0 (0.0%) | 0 (0.0%) |
| 3-Person Households | 88 (41.7%) | 0 (0.0%) |
| 4-Person Households | 19 (9.0%) | 0 (0.0%) |
| 5-Person Households | 0 (0.0%) | 0 (0.0%) |
| 6-Person Households | 0 (0.0%) | 0 (0.0%) |
| 7+ Person Households | 0 (0.0%) | 0 (0.0%) |
| Total | 107 (50.7%) | 104 (49.3%) |
Female Fertility in Esmont
Fertility by Age in Esmont
| Age Bracket | Women with Births | Births / 1,000 Women |
| 15 to 19 years | 0 (0.0%) | 0.0 |
| 20 to 34 years | 0 (0.0%) | 0.0 |
| 35 to 50 years | 0 (0.0%) | 0.0 |
| Total | 0 (0.0%) | 0.0 |
Fertility by Age by Marriage Status in Esmont
| Age Bracket | Married | Unmarried |
| 15 to 19 years | 0 (0.0%) | 0 (0.0%) |
| 20 to 34 years | 0 (0.0%) | 0 (0.0%) |
| 35 to 50 years | 0 (0.0%) | 0 (0.0%) |
| Total | 0 (0.0%) | 0 (0.0%) |
Fertility by Education in Esmont
| Educational Attainment | Women with Births | Births / 1,000 Women |
| Less than High School | 0 (0.0%) | 0.0 |
| High School Diploma | 0 (0.0%) | 0.0 |
| College or Associate's Degree | 0 (0.0%) | 0.0 |
| Bachelor's Degree | 0 (0.0%) | 0.0 |
| Graduate Degree | 0 (0.0%) | 0.0 |
| Total | 0 (0.0%) | 0.0 |
Fertility by Education by Marriage Status in Esmont
| Educational Attainment | Married | Unmarried |
| Less than High School | 0 (0.0%) | 0 (0.0%) |
| High School Diploma | 0 (0.0%) | 0 (0.0%) |
| College or Associate's Degree | 0 (0.0%) | 0 (0.0%) |
| Bachelor's Degree | 0 (0.0%) | 0 (0.0%) |
| Graduate Degree | 0 (0.0%) | 0 (0.0%) |
| Total | 0 (0.0%) | 0 (0.0%) |
Employment Characteristics in Esmont
Employment by Class of Employer in Esmont
Among the 232 employed individuals in Esmont, private company employees (158 | 68.1%), state government employees (44 | 19.0%), and self-employed (not incorporated) (13 | 5.6%) make up the most common classes of employment.
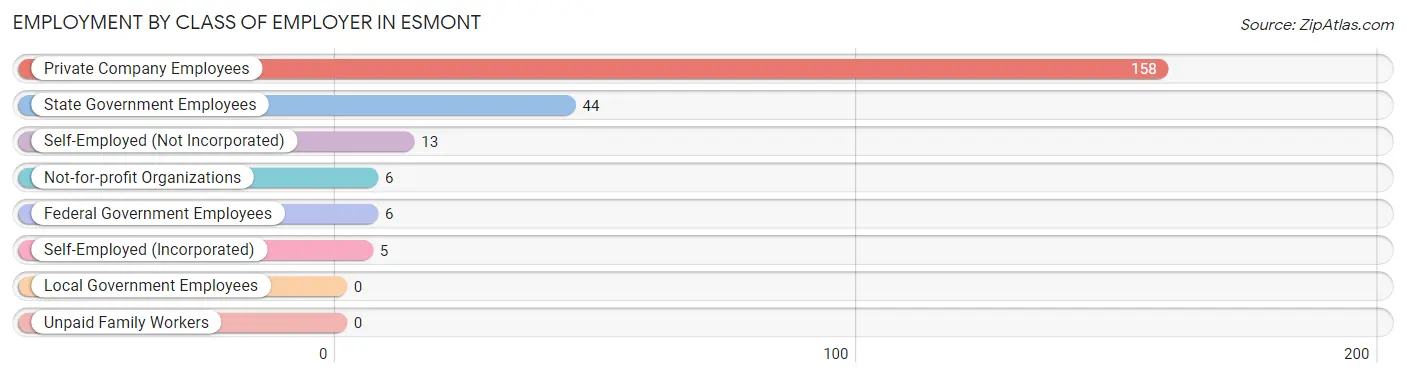
| Employer Class | # Employees | % Employees |
| Private Company Employees | 158 | 68.1% |
| Self-Employed (Incorporated) | 5 | 2.2% |
| Self-Employed (Not Incorporated) | 13 | 5.6% |
| Not-for-profit Organizations | 6 | 2.6% |
| Local Government Employees | 0 | 0.0% |
| State Government Employees | 44 | 19.0% |
| Federal Government Employees | 6 | 2.6% |
| Unpaid Family Workers | 0 | 0.0% |
| Total | 232 | 100.0% |
Employment Status by Age in Esmont
According to the labor force statistics for Esmont, out of the total population over 16 years of age (380), 63.9% or 243 individuals are in the labor force, with 4.5% or 11 of them unemployed. The age group with the highest labor force participation rate is 16 to 19 years, with 100.0% or 5 individuals in the labor force. Within the labor force, the 30 to 34 years age range has the highest percentage of unemployed individuals, with 26.2% or 11 of them being unemployed.
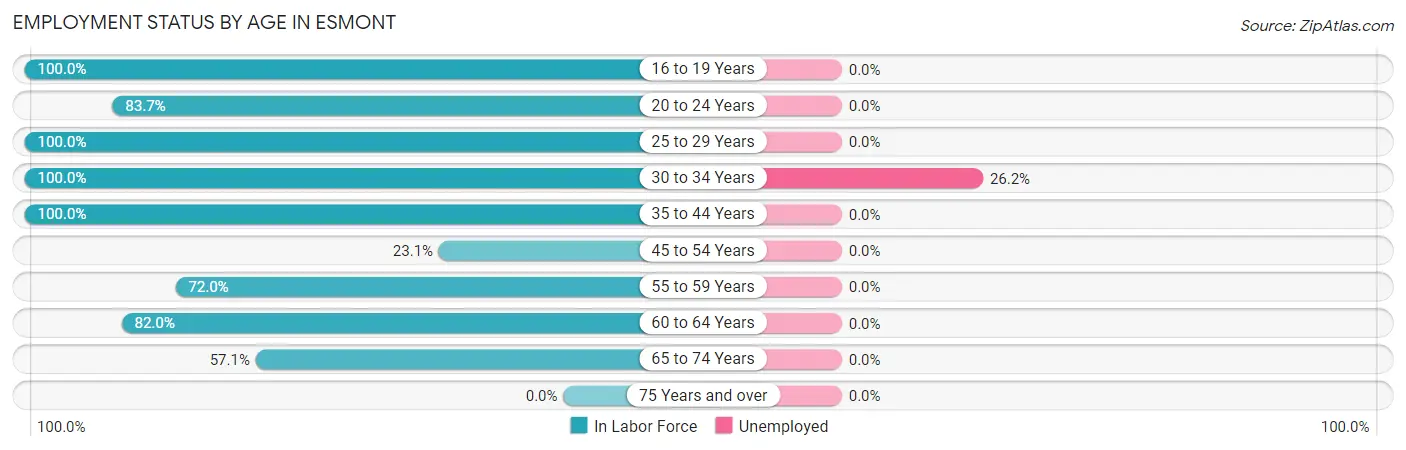
| Age Bracket | In Labor Force | Unemployed |
| 16 to 19 Years | 5 (100.0%) | 0 (0.0%) |
| 20 to 24 Years | 36 (83.7%) | 0 (0.0%) |
| 25 to 29 Years | 34 (100.0%) | 0 (0.0%) |
| 30 to 34 Years | 42 (100.0%) | 11 (26.2%) |
| 35 to 44 Years | 35 (100.0%) | 0 (0.0%) |
| 45 to 54 Years | 6 (23.1%) | 0 (0.0%) |
| 55 to 59 Years | 36 (72.0%) | 0 (0.0%) |
| 60 to 64 Years | 41 (82.0%) | 0 (0.0%) |
| 65 to 74 Years | 8 (57.1%) | 0 (0.0%) |
| 75 Years and over | 0 (0.0%) | 0 (0.0%) |
| Total | 243 (63.9%) | 11 (4.5%) |
Employment Status by Educational Attainment in Esmont
According to labor force statistics for Esmont, 81.9% of individuals (194) out of the total population between 25 and 64 years of age (237) are in the labor force, with 5.7% or 11 of them being unemployed. The group with the highest labor force participation rate are those with the educational attainment of college / associate degree, with 100.0% or 84 individuals in the labor force. Within the labor force, individuals with less than high school education have the highest percentage of unemployment, with 36.7% or 11 of them being unemployed.
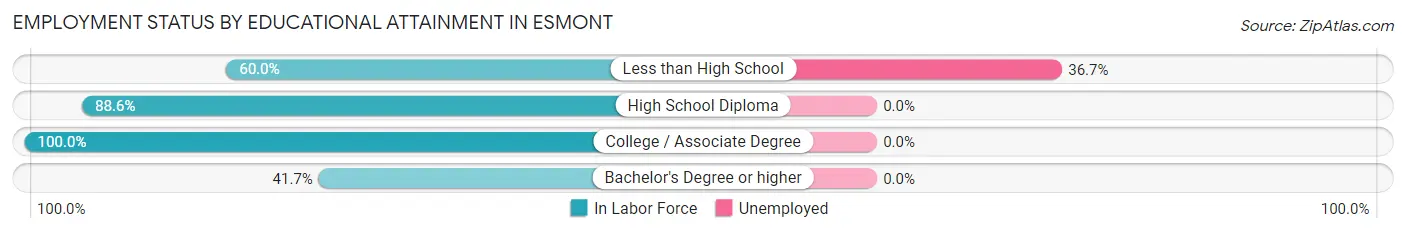
| Educational Attainment | In Labor Force | Unemployed |
| Less than High School | 30 (60.0%) | 18 (36.7%) |
| High School Diploma | 70 (88.6%) | 0 (0.0%) |
| College / Associate Degree | 84 (100.0%) | 0 (0.0%) |
| Bachelor's Degree or higher | 10 (41.7%) | 0 (0.0%) |
| Total | 194 (81.9%) | 14 (5.7%) |
Employment Occupations by Sex in Esmont
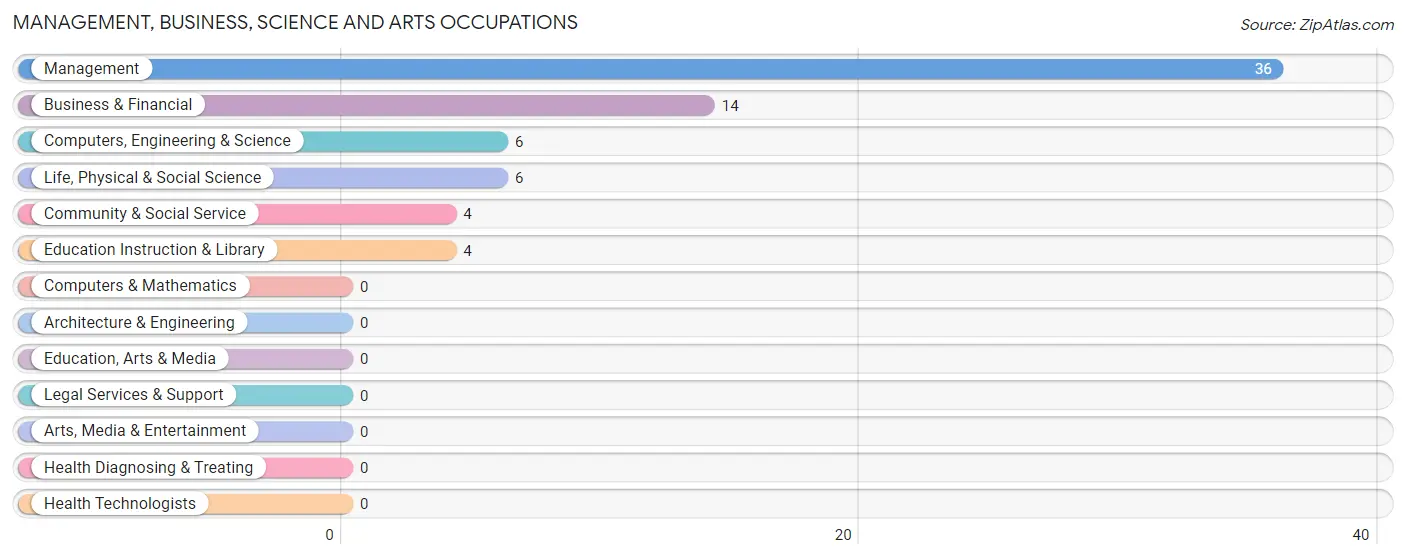
Management, Business, Science and Arts Occupations
The most common Management, Business, Science and Arts occupations in Esmont are Management (36 | 15.5%), Business & Financial (14 | 6.0%), Computers, Engineering & Science (6 | 2.6%), Life, Physical & Social Science (6 | 2.6%), and Community & Social Service (4 | 1.7%).
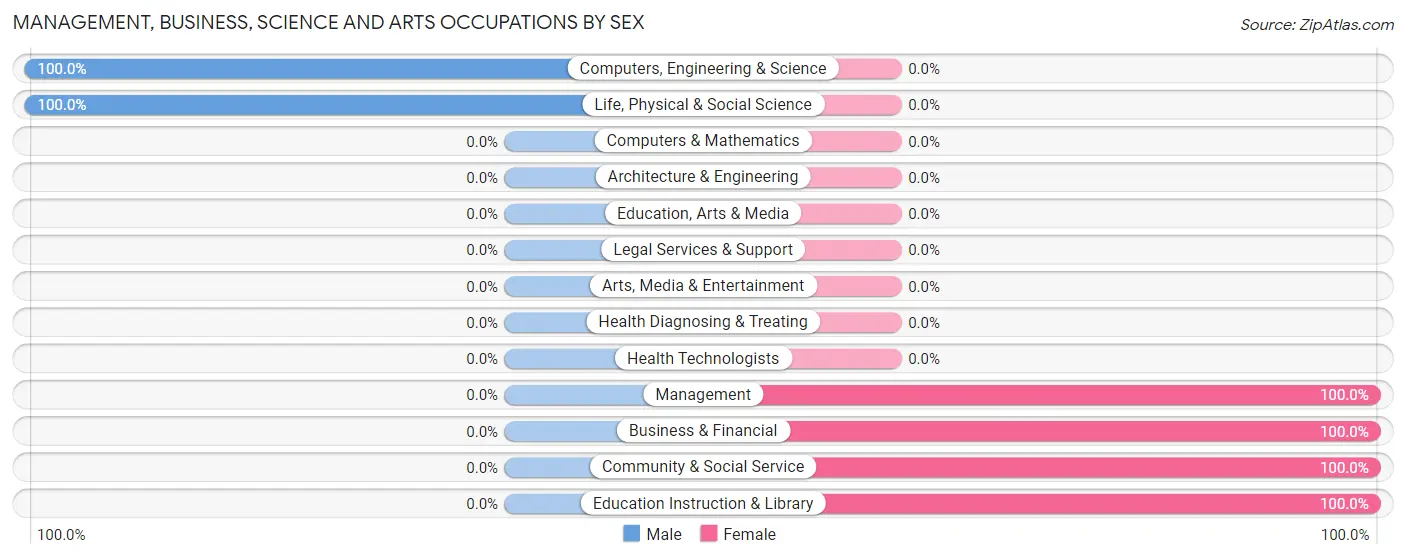
Management, Business, Science and Arts Occupations by Sex
Within the Management, Business, Science and Arts occupations in Esmont, the most male-oriented occupations are Computers, Engineering & Science (100.0%), and Life, Physical & Social Science (100.0%), while the most female-oriented occupations are Management (100.0%), Business & Financial (100.0%), and Community & Social Service (100.0%).
| Occupation | Male | Female |
| Management | 0 (0.0%) | 36 (100.0%) |
| Business & Financial | 0 (0.0%) | 14 (100.0%) |
| Computers, Engineering & Science | 6 (100.0%) | 0 (0.0%) |
| Computers & Mathematics | 0 (0.0%) | 0 (0.0%) |
| Architecture & Engineering | 0 (0.0%) | 0 (0.0%) |
| Life, Physical & Social Science | 6 (100.0%) | 0 (0.0%) |
| Community & Social Service | 0 (0.0%) | 4 (100.0%) |
| Education, Arts & Media | 0 (0.0%) | 0 (0.0%) |
| Legal Services & Support | 0 (0.0%) | 0 (0.0%) |
| Education Instruction & Library | 0 (0.0%) | 4 (100.0%) |
| Arts, Media & Entertainment | 0 (0.0%) | 0 (0.0%) |
| Health Diagnosing & Treating | 0 (0.0%) | 0 (0.0%) |
| Health Technologists | 0 (0.0%) | 0 (0.0%) |
| Total (Category) | 6 (10.0%) | 54 (90.0%) |
| Total (Overall) | 36 (15.5%) | 196 (84.5%) |
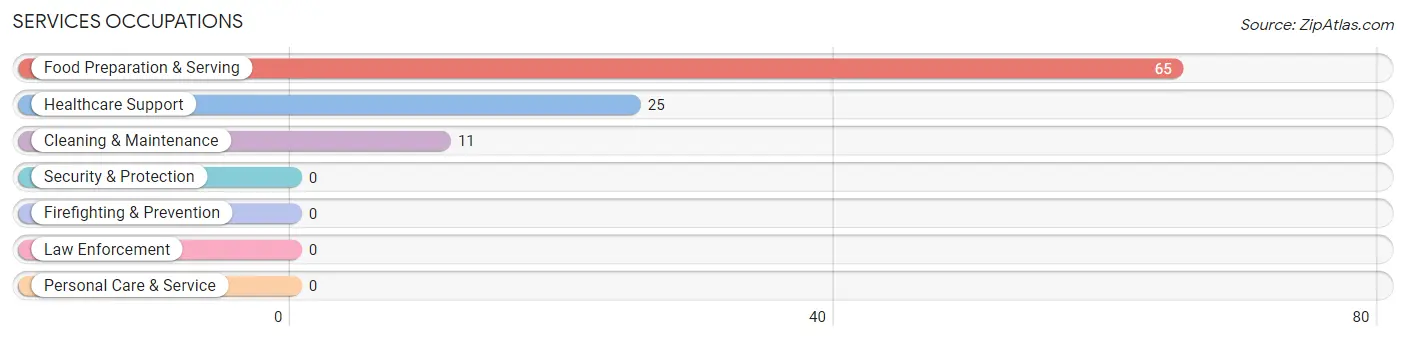
Services Occupations
The most common Services occupations in Esmont are Food Preparation & Serving (65 | 28.0%), Healthcare Support (25 | 10.8%), and Cleaning & Maintenance (11 | 4.7%).
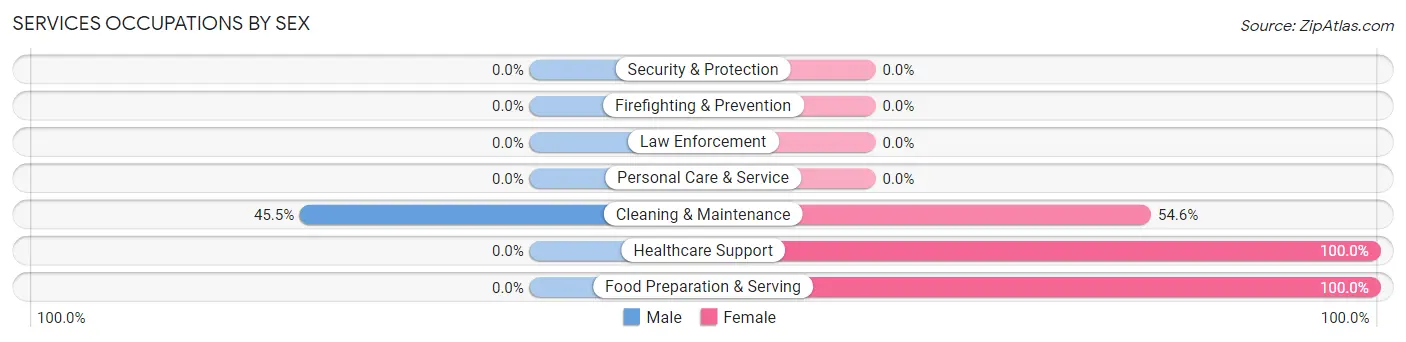
Services Occupations by Sex
| Occupation | Male | Female |
| Healthcare Support | 0 (0.0%) | 25 (100.0%) |
| Security & Protection | 0 (0.0%) | 0 (0.0%) |
| Firefighting & Prevention | 0 (0.0%) | 0 (0.0%) |
| Law Enforcement | 0 (0.0%) | 0 (0.0%) |
| Food Preparation & Serving | 0 (0.0%) | 65 (100.0%) |
| Cleaning & Maintenance | 5 (45.5%) | 6 (54.5%) |
| Personal Care & Service | 0 (0.0%) | 0 (0.0%) |
| Total (Category) | 5 (5.0%) | 96 (95.1%) |
| Total (Overall) | 36 (15.5%) | 196 (84.5%) |
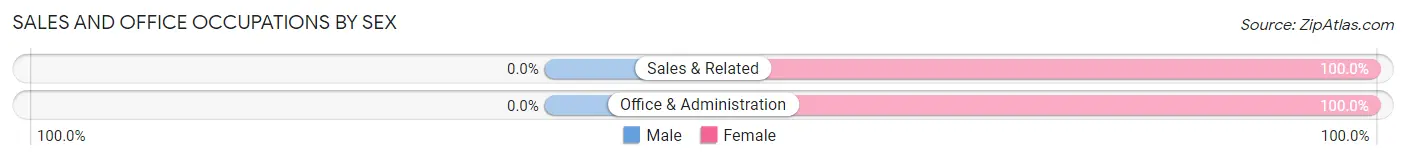
Sales and Office Occupations
The most common Sales and Office occupations in Esmont are Sales & Related (33 | 14.2%), and Office & Administration (13 | 5.6%).
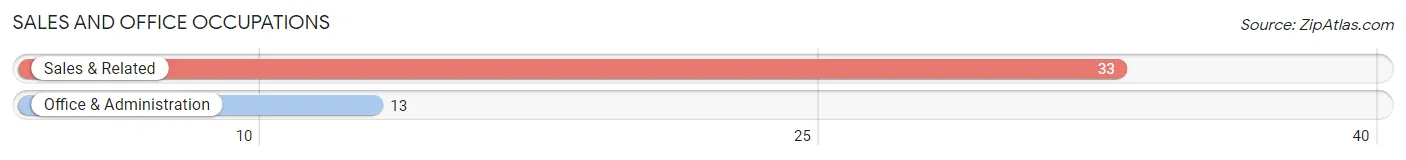
Sales and Office Occupations by Sex
| Occupation | Male | Female |
| Sales & Related | 0 (0.0%) | 33 (100.0%) |
| Office & Administration | 0 (0.0%) | 13 (100.0%) |
| Total (Category) | 0 (0.0%) | 46 (100.0%) |
| Total (Overall) | 36 (15.5%) | 196 (84.5%) |
Natural Resources, Construction and Maintenance Occupations

Natural Resources, Construction and Maintenance Occupations by Sex
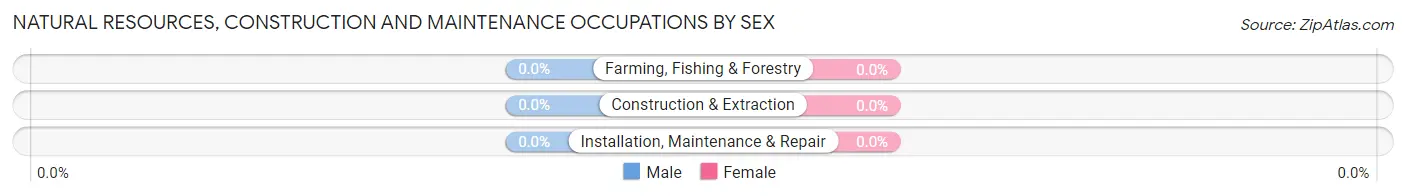
| Occupation | Male | Female |
| Farming, Fishing & Forestry | 0 (0.0%) | 0 (0.0%) |
| Construction & Extraction | 0 (0.0%) | 0 (0.0%) |
| Installation, Maintenance & Repair | 0 (0.0%) | 0 (0.0%) |
| Total (Category) | 0 (0.0%) | 0 (0.0%) |
| Total (Overall) | 36 (15.5%) | 196 (84.5%) |
Production, Transportation and Moving Occupations
The most common Production, Transportation and Moving occupations in Esmont are Transportation (22 | 9.5%), and Production (3 | 1.3%).
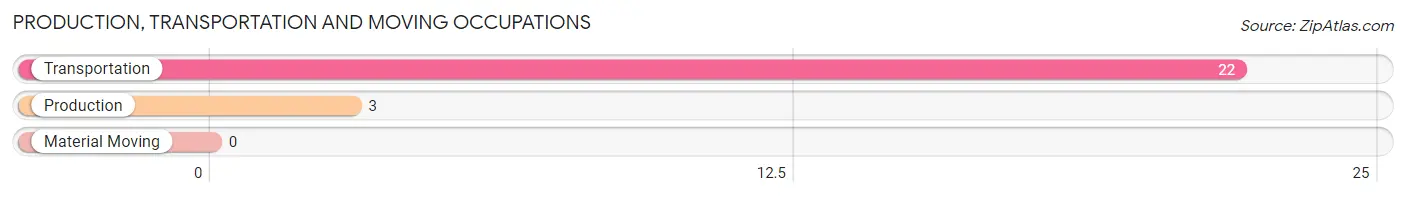
Production, Transportation and Moving Occupations by Sex
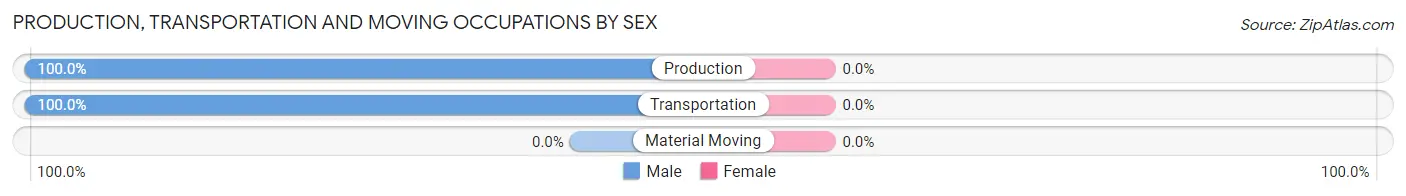
| Occupation | Male | Female |
| Production | 3 (100.0%) | 0 (0.0%) |
| Transportation | 22 (100.0%) | 0 (0.0%) |
| Material Moving | 0 (0.0%) | 0 (0.0%) |
| Total (Category) | 25 (100.0%) | 0 (0.0%) |
| Total (Overall) | 36 (15.5%) | 196 (84.5%) |
Employment Industries by Sex in Esmont
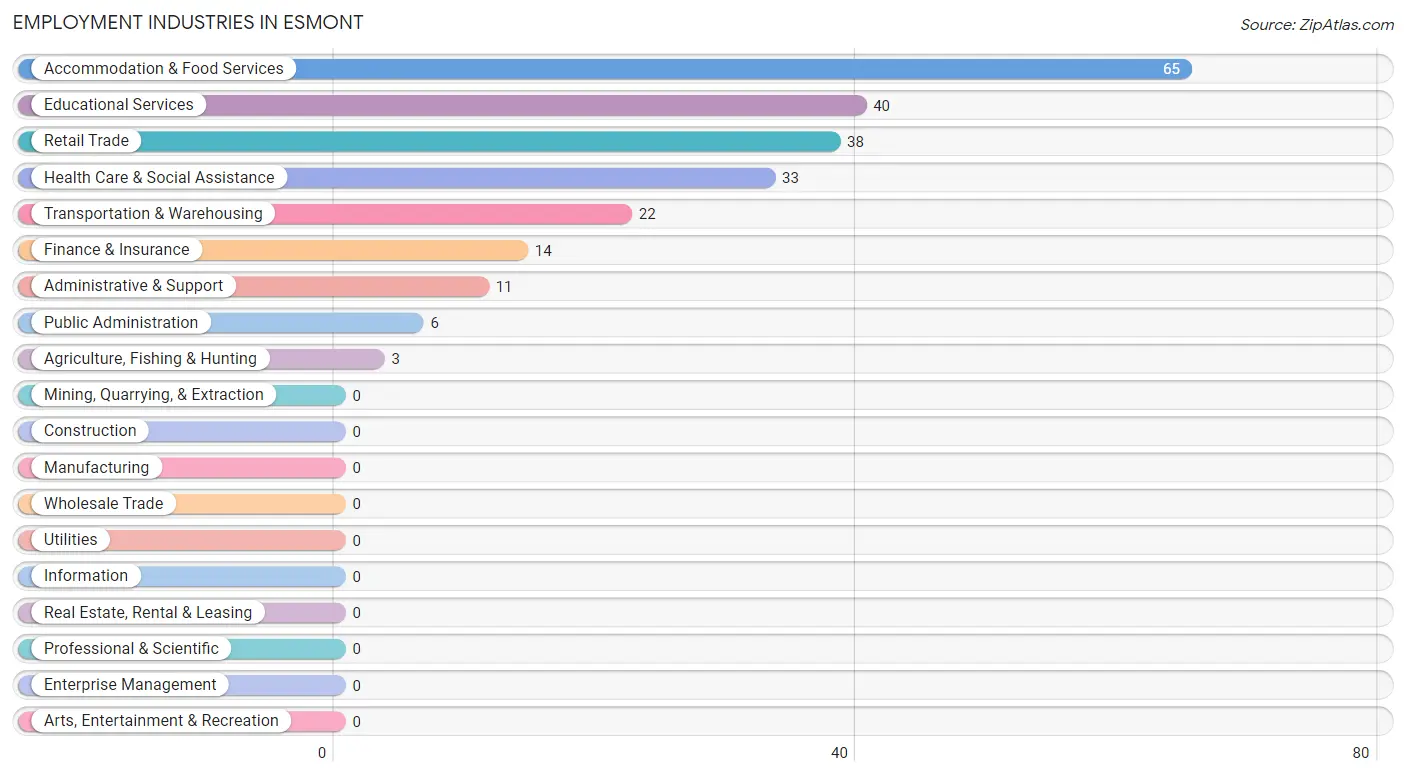
Employment Industries in Esmont
The major employment industries in Esmont include Accommodation & Food Services (65 | 28.0%), Educational Services (40 | 17.2%), Retail Trade (38 | 16.4%), Health Care & Social Assistance (33 | 14.2%), and Transportation & Warehousing (22 | 9.5%).
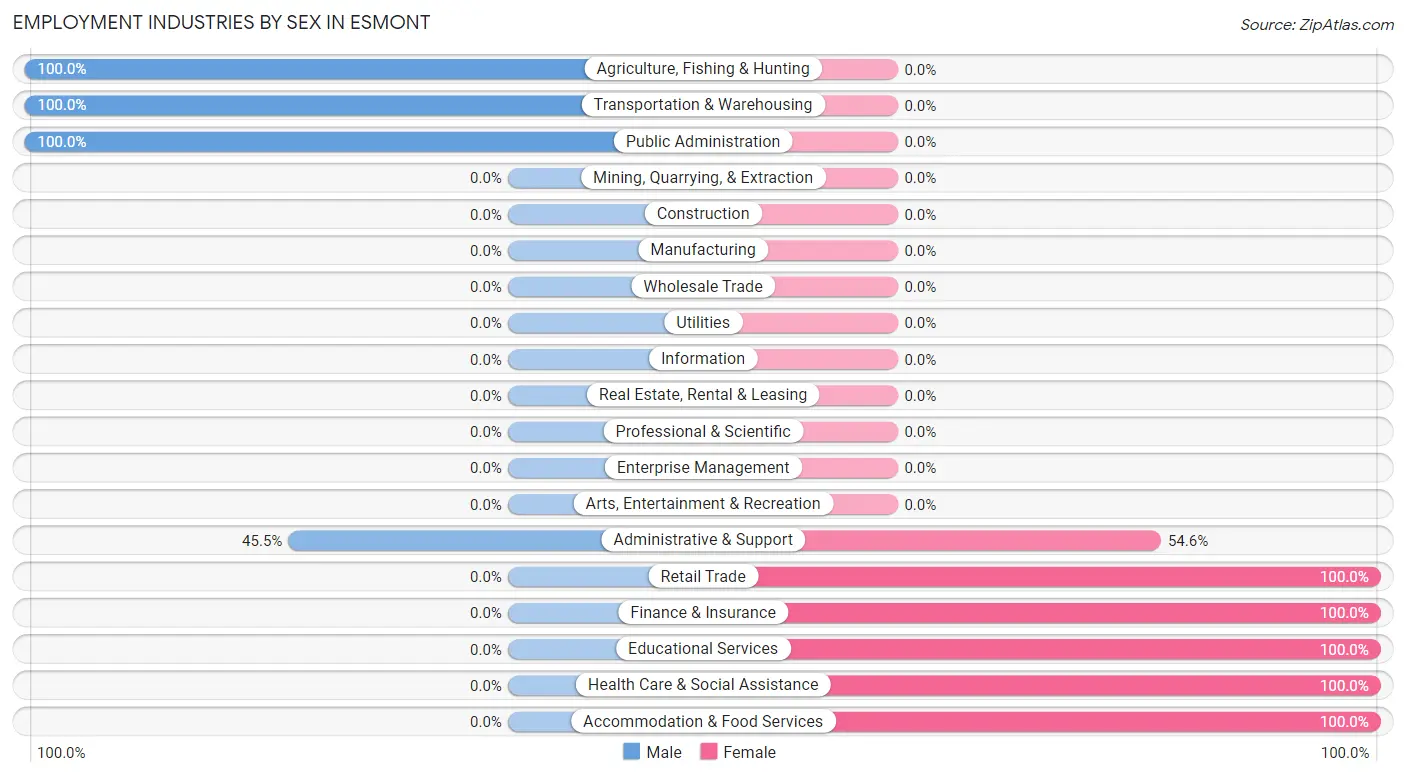
Employment Industries by Sex in Esmont
The Esmont industries that see more men than women are Agriculture, Fishing & Hunting (100.0%), Transportation & Warehousing (100.0%), and Public Administration (100.0%), whereas the industries that tend to have a higher number of women are Retail Trade (100.0%), Finance & Insurance (100.0%), and Educational Services (100.0%).
| Industry | Male | Female |
| Agriculture, Fishing & Hunting | 3 (100.0%) | 0 (0.0%) |
| Mining, Quarrying, & Extraction | 0 (0.0%) | 0 (0.0%) |
| Construction | 0 (0.0%) | 0 (0.0%) |
| Manufacturing | 0 (0.0%) | 0 (0.0%) |
| Wholesale Trade | 0 (0.0%) | 0 (0.0%) |
| Retail Trade | 0 (0.0%) | 38 (100.0%) |
| Transportation & Warehousing | 22 (100.0%) | 0 (0.0%) |
| Utilities | 0 (0.0%) | 0 (0.0%) |
| Information | 0 (0.0%) | 0 (0.0%) |
| Finance & Insurance | 0 (0.0%) | 14 (100.0%) |
| Real Estate, Rental & Leasing | 0 (0.0%) | 0 (0.0%) |
| Professional & Scientific | 0 (0.0%) | 0 (0.0%) |
| Enterprise Management | 0 (0.0%) | 0 (0.0%) |
| Administrative & Support | 5 (45.5%) | 6 (54.5%) |
| Educational Services | 0 (0.0%) | 40 (100.0%) |
| Health Care & Social Assistance | 0 (0.0%) | 33 (100.0%) |
| Arts, Entertainment & Recreation | 0 (0.0%) | 0 (0.0%) |
| Accommodation & Food Services | 0 (0.0%) | 65 (100.0%) |
| Public Administration | 6 (100.0%) | 0 (0.0%) |
| Total | 36 (15.5%) | 196 (84.5%) |
Education in Esmont
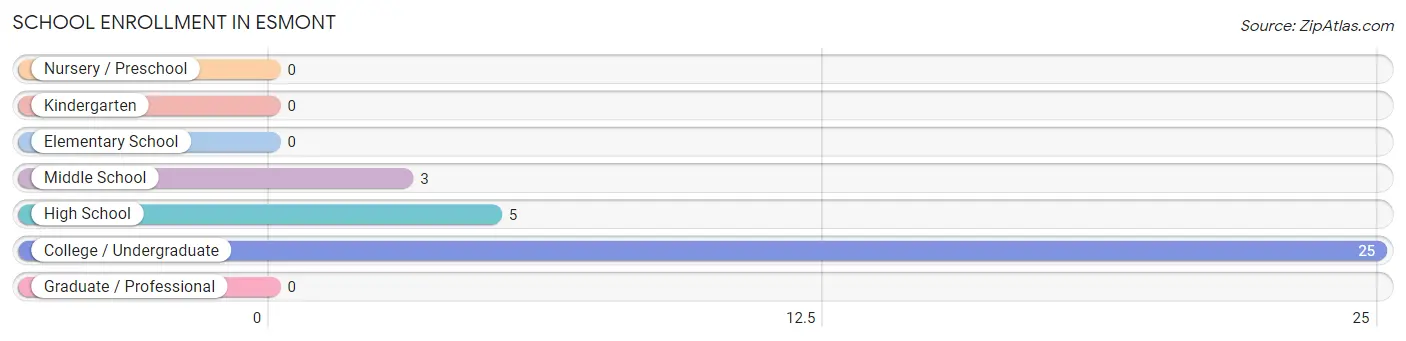
School Enrollment in Esmont
The most common levels of schooling among the 33 students in Esmont are college / undergraduate (25 | 75.8%), high school (5 | 15.1%), and middle school (3 | 9.1%).
| School Level | # Students | % Students |
| Nursery / Preschool | 0 | 0.0% |
| Kindergarten | 0 | 0.0% |
| Elementary School | 0 | 0.0% |
| Middle School | 3 | 9.1% |
| High School | 5 | 15.1% |
| College / Undergraduate | 25 | 75.8% |
| Graduate / Professional | 0 | 0.0% |
| Total | 33 | 100.0% |
School Enrollment by Age by Funding Source in Esmont
Out of a total of 33 students who are enrolled in schools in Esmont, 3 (9.1%) attend a private institution, while the remaining 30 (90.9%) are enrolled in public schools. The age group of 10 to 14 year olds has the highest likelihood of being enrolled in private schools, with 3 (100.0% in the age bracket) enrolled. Conversely, the age group of 15 to 17 year olds has the lowest likelihood of being enrolled in a private school, with 5 (100.0% in the age bracket) attending a public institution.
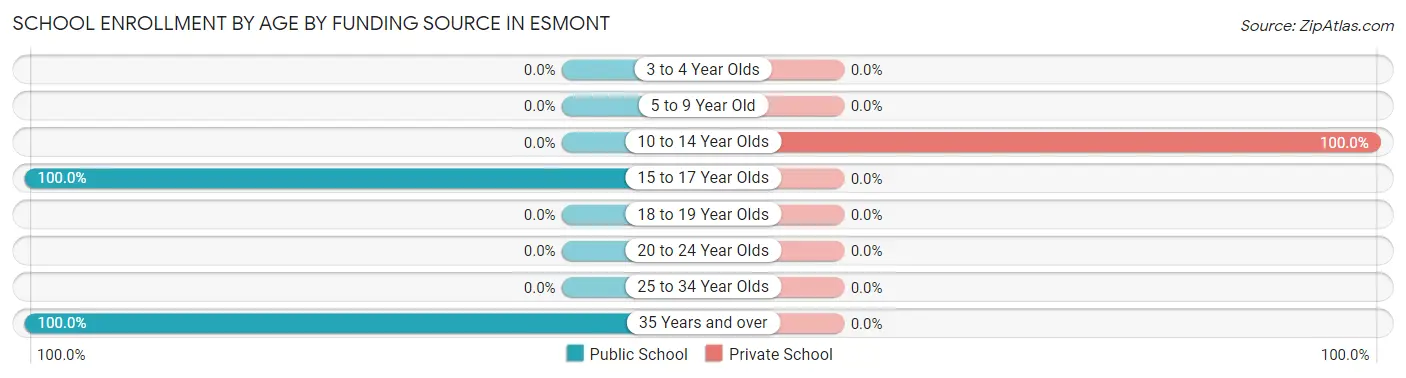
| Age Bracket | Public School | Private School |
| 3 to 4 Year Olds | 0 (0.0%) | 0 (0.0%) |
| 5 to 9 Year Old | 0 (0.0%) | 0 (0.0%) |
| 10 to 14 Year Olds | 0 (0.0%) | 3 (100.0%) |
| 15 to 17 Year Olds | 5 (100.0%) | 0 (0.0%) |
| 18 to 19 Year Olds | 0 (0.0%) | 0 (0.0%) |
| 20 to 24 Year Olds | 0 (0.0%) | 0 (0.0%) |
| 25 to 34 Year Olds | 0 (0.0%) | 0 (0.0%) |
| 35 Years and over | 25 (100.0%) | 0 (0.0%) |
| Total | 30 (90.9%) | 3 (9.1%) |
Educational Attainment by Field of Study in Esmont
Arts & humanities (14 | 58.3%), bio, nature & agricultural (6 | 25.0%), and education (4 | 16.7%) are the most common fields of study among 24 individuals in Esmont who have obtained a bachelor's degree or higher.
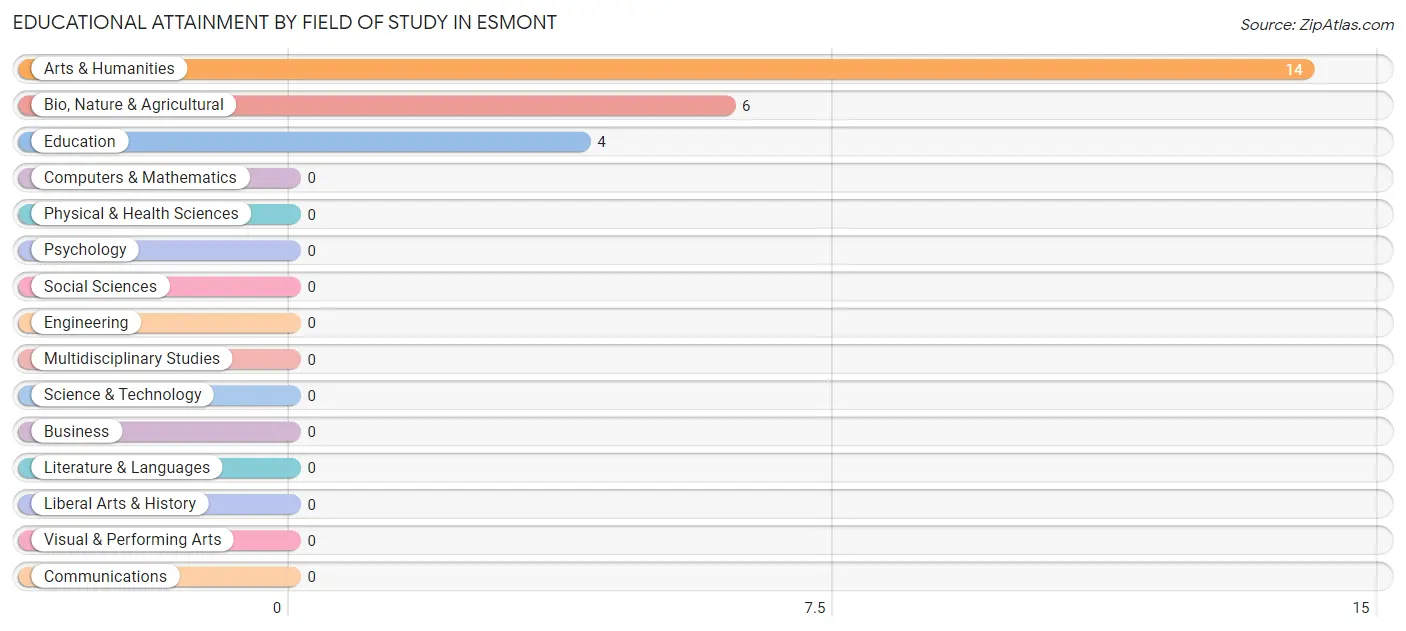
| Field of Study | # Graduates | % Graduates |
| Computers & Mathematics | 0 | 0.0% |
| Bio, Nature & Agricultural | 6 | 25.0% |
| Physical & Health Sciences | 0 | 0.0% |
| Psychology | 0 | 0.0% |
| Social Sciences | 0 | 0.0% |
| Engineering | 0 | 0.0% |
| Multidisciplinary Studies | 0 | 0.0% |
| Science & Technology | 0 | 0.0% |
| Business | 0 | 0.0% |
| Education | 4 | 16.7% |
| Literature & Languages | 0 | 0.0% |
| Liberal Arts & History | 0 | 0.0% |
| Visual & Performing Arts | 0 | 0.0% |
| Communications | 0 | 0.0% |
| Arts & Humanities | 14 | 58.3% |
| Total | 24 | 100.0% |
Transportation & Commute in Esmont
Vehicle Availability by Sex in Esmont
The most prevalent vehicle ownership categories in Esmont are males with 3 vehicles (17, accounting for 47.2%) and females with 3 vehicles (70, making up 8.7%).
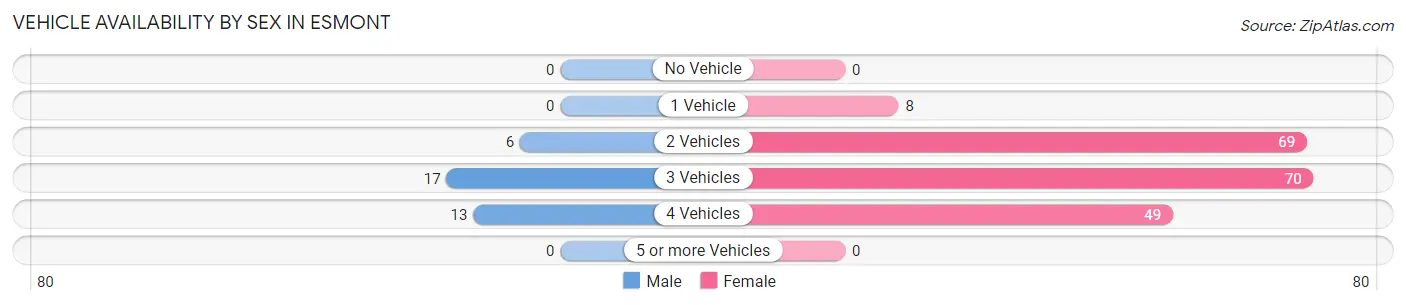
| Vehicles Available | Male | Female |
| No Vehicle | 0 (0.0%) | 0 (0.0%) |
| 1 Vehicle | 0 (0.0%) | 8 (4.1%) |
| 2 Vehicles | 6 (16.7%) | 69 (35.2%) |
| 3 Vehicles | 17 (47.2%) | 70 (35.7%) |
| 4 Vehicles | 13 (36.1%) | 49 (25.0%) |
| 5 or more Vehicles | 0 (0.0%) | 0 (0.0%) |
| Total | 36 (100.0%) | 196 (100.0%) |
Commute Time in Esmont
The most frequently occuring commute durations in Esmont are 10 to 14 minutes (65 commuters, 31.2%), 25 to 29 minutes (38 commuters, 18.3%), and 5 to 9 minutes (36 commuters, 17.3%).
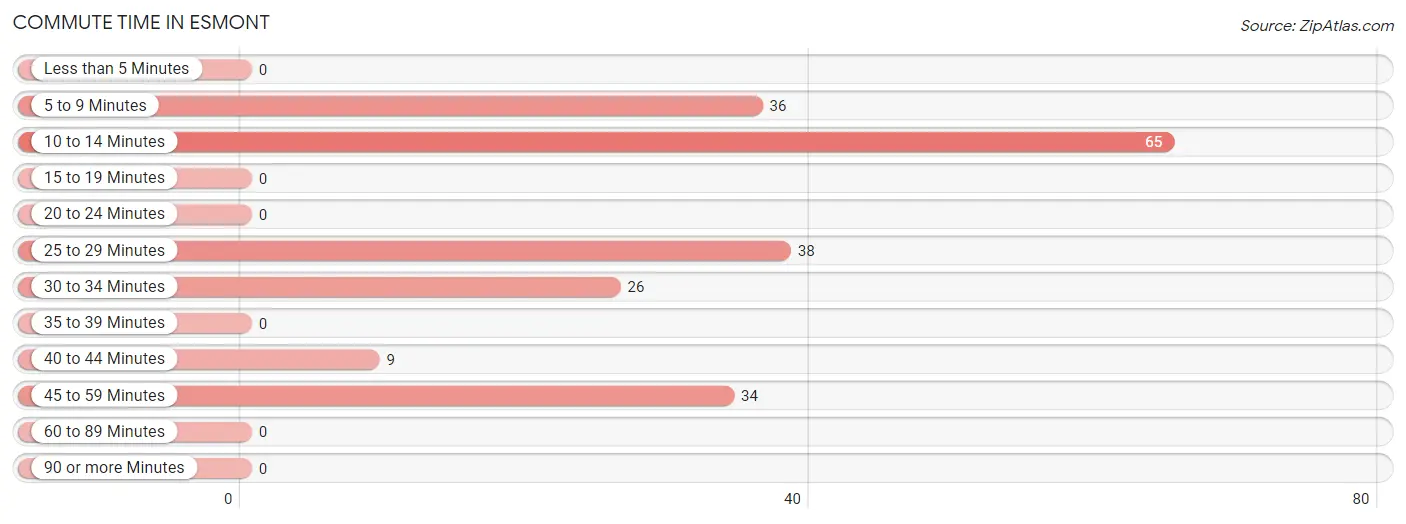
| Commute Time | # Commuters | % Commuters |
| Less than 5 Minutes | 0 | 0.0% |
| 5 to 9 Minutes | 36 | 17.3% |
| 10 to 14 Minutes | 65 | 31.2% |
| 15 to 19 Minutes | 0 | 0.0% |
| 20 to 24 Minutes | 0 | 0.0% |
| 25 to 29 Minutes | 38 | 18.3% |
| 30 to 34 Minutes | 26 | 12.5% |
| 35 to 39 Minutes | 0 | 0.0% |
| 40 to 44 Minutes | 9 | 4.3% |
| 45 to 59 Minutes | 34 | 16.4% |
| 60 to 89 Minutes | 0 | 0.0% |
| 90 or more Minutes | 0 | 0.0% |
Commute Time by Sex in Esmont
The most common commute times in Esmont are 25 to 29 minutes (13 commuters, 43.3%) for males and 10 to 14 minutes (65 commuters, 36.5%) for females.
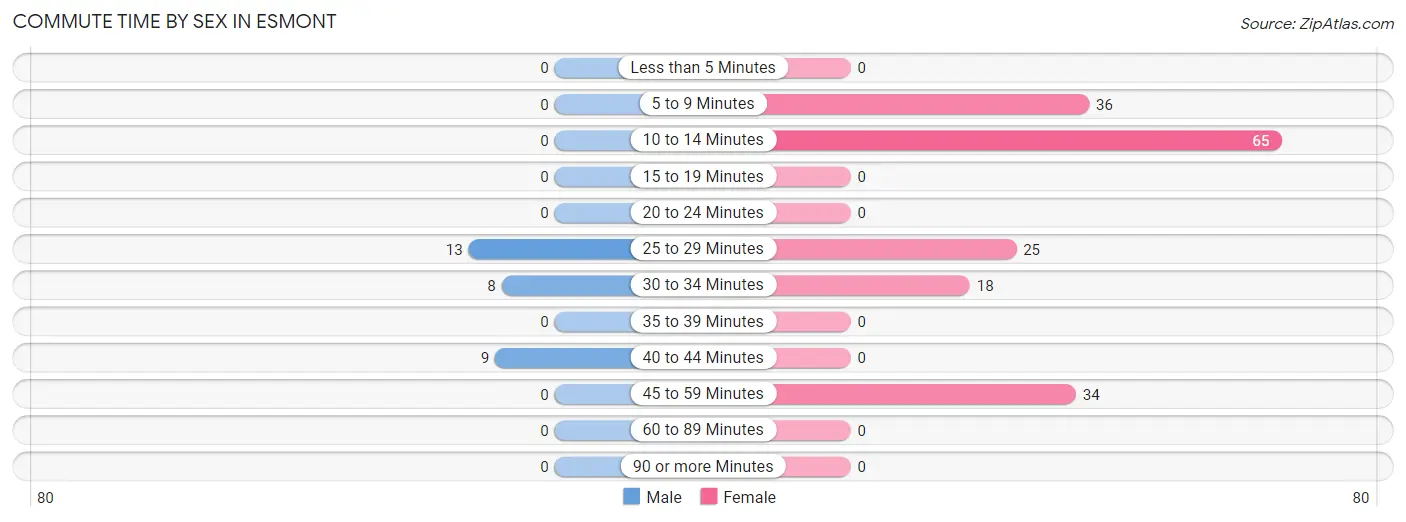
| Commute Time | Male | Female |
| Less than 5 Minutes | 0 (0.0%) | 0 (0.0%) |
| 5 to 9 Minutes | 0 (0.0%) | 36 (20.2%) |
| 10 to 14 Minutes | 0 (0.0%) | 65 (36.5%) |
| 15 to 19 Minutes | 0 (0.0%) | 0 (0.0%) |
| 20 to 24 Minutes | 0 (0.0%) | 0 (0.0%) |
| 25 to 29 Minutes | 13 (43.3%) | 25 (14.0%) |
| 30 to 34 Minutes | 8 (26.7%) | 18 (10.1%) |
| 35 to 39 Minutes | 0 (0.0%) | 0 (0.0%) |
| 40 to 44 Minutes | 9 (30.0%) | 0 (0.0%) |
| 45 to 59 Minutes | 0 (0.0%) | 34 (19.1%) |
| 60 to 89 Minutes | 0 (0.0%) | 0 (0.0%) |
| 90 or more Minutes | 0 (0.0%) | 0 (0.0%) |
Time of Departure to Work by Sex in Esmont
The most frequent times of departure to work in Esmont are 6:00 AM to 6:29 AM (13, 43.3%) for males and 10:00 AM to 10:59 AM (65, 36.5%) for females.
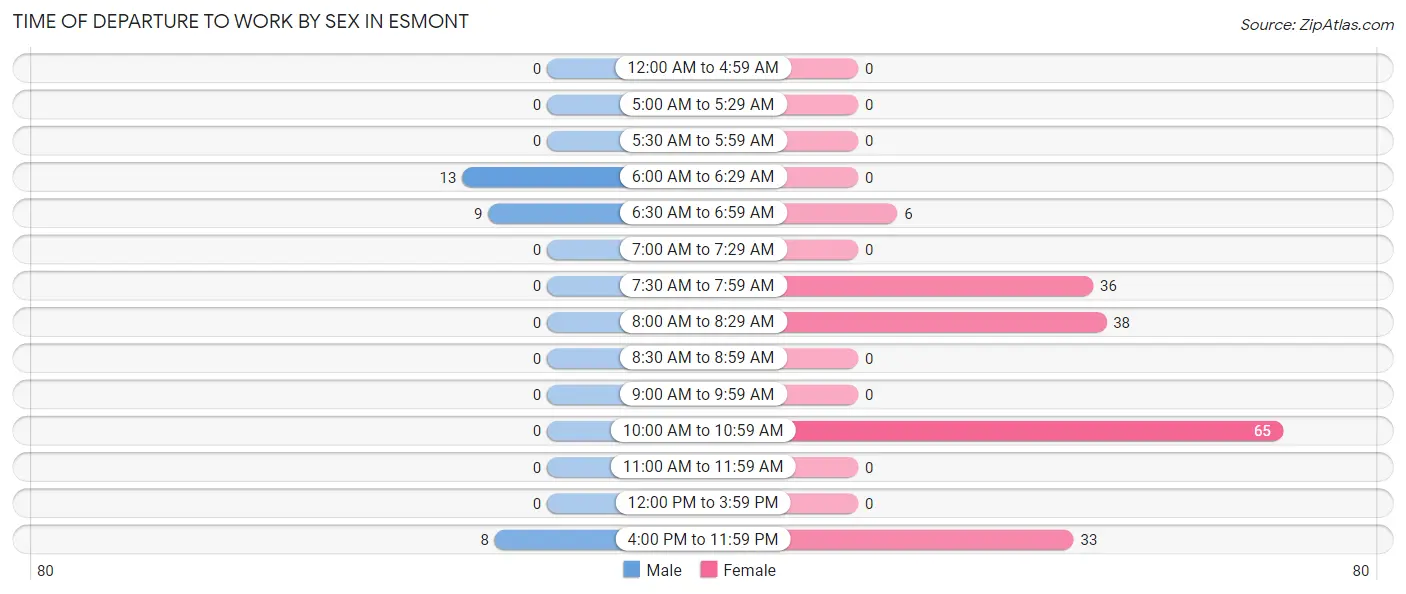
| Time of Departure | Male | Female |
| 12:00 AM to 4:59 AM | 0 (0.0%) | 0 (0.0%) |
| 5:00 AM to 5:29 AM | 0 (0.0%) | 0 (0.0%) |
| 5:30 AM to 5:59 AM | 0 (0.0%) | 0 (0.0%) |
| 6:00 AM to 6:29 AM | 13 (43.3%) | 0 (0.0%) |
| 6:30 AM to 6:59 AM | 9 (30.0%) | 6 (3.4%) |
| 7:00 AM to 7:29 AM | 0 (0.0%) | 0 (0.0%) |
| 7:30 AM to 7:59 AM | 0 (0.0%) | 36 (20.2%) |
| 8:00 AM to 8:29 AM | 0 (0.0%) | 38 (21.3%) |
| 8:30 AM to 8:59 AM | 0 (0.0%) | 0 (0.0%) |
| 9:00 AM to 9:59 AM | 0 (0.0%) | 0 (0.0%) |
| 10:00 AM to 10:59 AM | 0 (0.0%) | 65 (36.5%) |
| 11:00 AM to 11:59 AM | 0 (0.0%) | 0 (0.0%) |
| 12:00 PM to 3:59 PM | 0 (0.0%) | 0 (0.0%) |
| 4:00 PM to 11:59 PM | 8 (26.7%) | 33 (18.5%) |
| Total | 30 (100.0%) | 178 (100.0%) |
Housing Occupancy in Esmont
Occupancy by Ownership in Esmont
Of the total 211 dwellings in Esmont, owner-occupied units account for 177 (83.9%), while renter-occupied units make up 34 (16.1%).
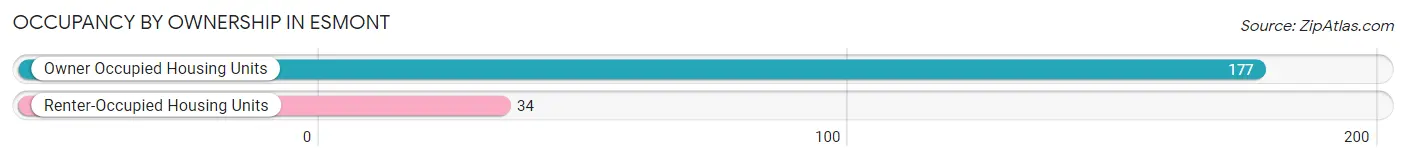
| Occupancy | # Housing Units | % Housing Units |
| Owner Occupied Housing Units | 177 | 83.9% |
| Renter-Occupied Housing Units | 34 | 16.1% |
| Total Occupied Housing Units | 211 | 100.0% |
Occupancy by Household Size in Esmont
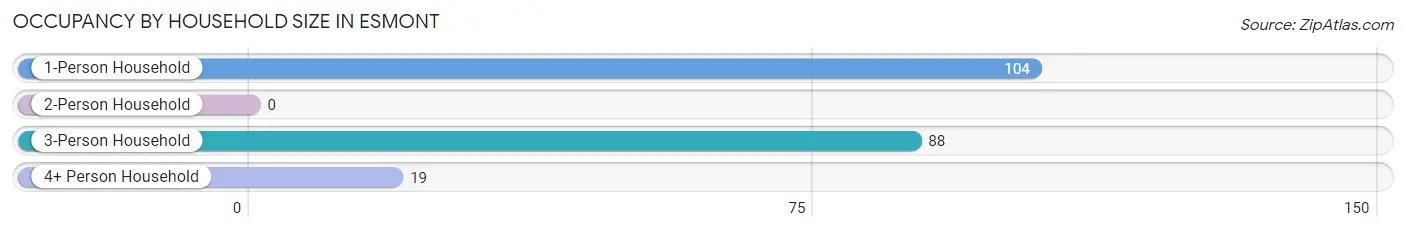
| Household Size | # Housing Units | % Housing Units |
| 1-Person Household | 104 | 49.3% |
| 2-Person Household | 0 | 0.0% |
| 3-Person Household | 88 | 41.7% |
| 4+ Person Household | 19 | 9.0% |
| Total Housing Units | 211 | 100.0% |
Occupancy by Ownership by Household Size in Esmont
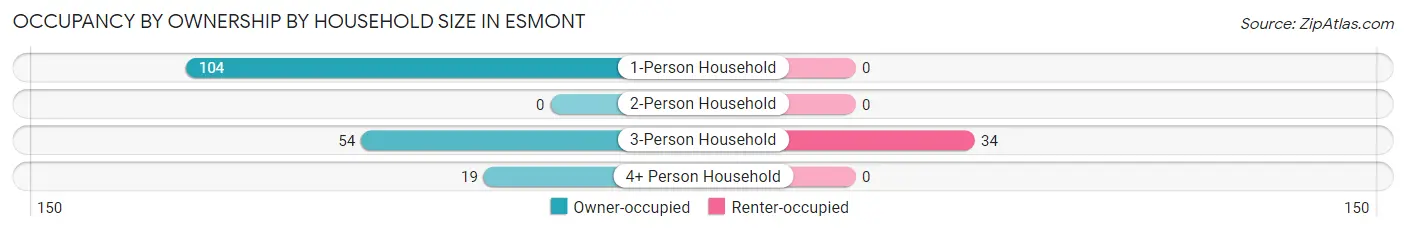
| Household Size | Owner-occupied | Renter-occupied |
| 1-Person Household | 104 (100.0%) | 0 (0.0%) |
| 2-Person Household | 0 (0.0%) | 0 (0.0%) |
| 3-Person Household | 54 (61.4%) | 34 (38.6%) |
| 4+ Person Household | 19 (100.0%) | 0 (0.0%) |
| Total Housing Units | 177 (83.9%) | 34 (16.1%) |
Occupancy by Educational Attainment in Esmont
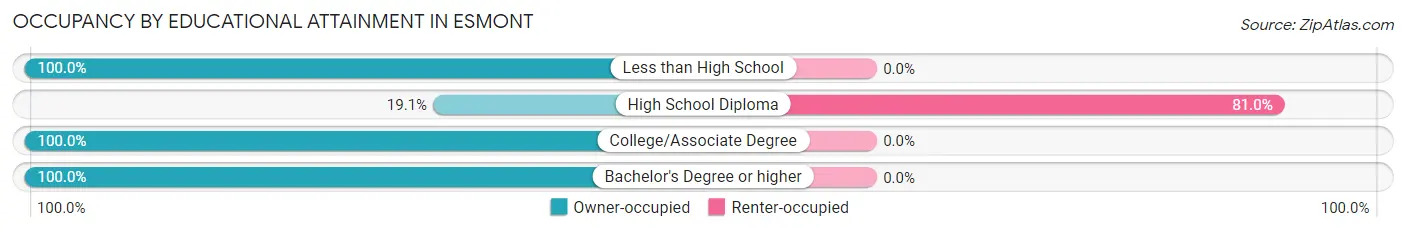
| Household Size | Owner-occupied | Renter-occupied |
| Less than High School | 48 (100.0%) | 0 (0.0%) |
| High School Diploma | 8 (19.1%) | 34 (80.9%) |
| College/Associate Degree | 103 (100.0%) | 0 (0.0%) |
| Bachelor's Degree or higher | 18 (100.0%) | 0 (0.0%) |
Occupancy by Age of Householder in Esmont
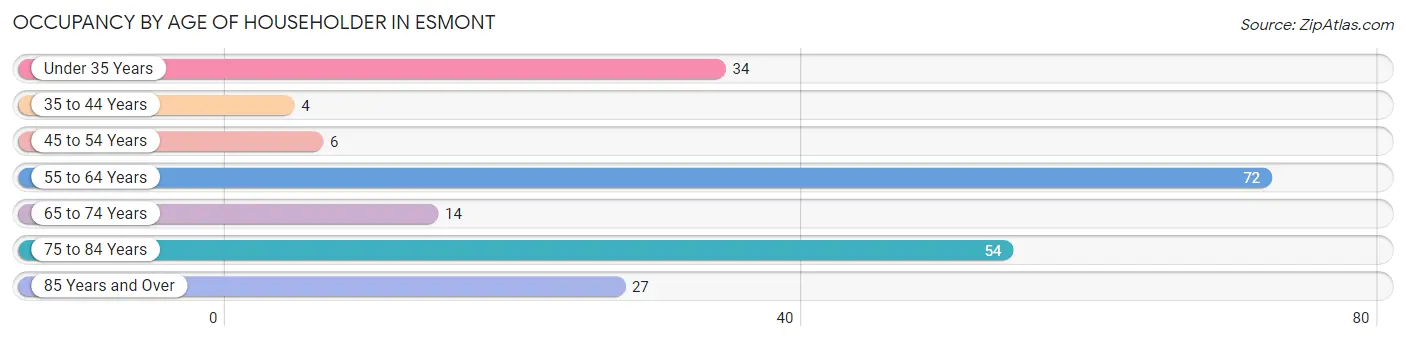
| Age Bracket | # Households | % Households |
| Under 35 Years | 34 | 16.1% |
| 35 to 44 Years | 4 | 1.9% |
| 45 to 54 Years | 6 | 2.8% |
| 55 to 64 Years | 72 | 34.1% |
| 65 to 74 Years | 14 | 6.6% |
| 75 to 84 Years | 54 | 25.6% |
| 85 Years and Over | 27 | 12.8% |
| Total | 211 | 100.0% |
Housing Finances in Esmont
Median Income by Occupancy in Esmont
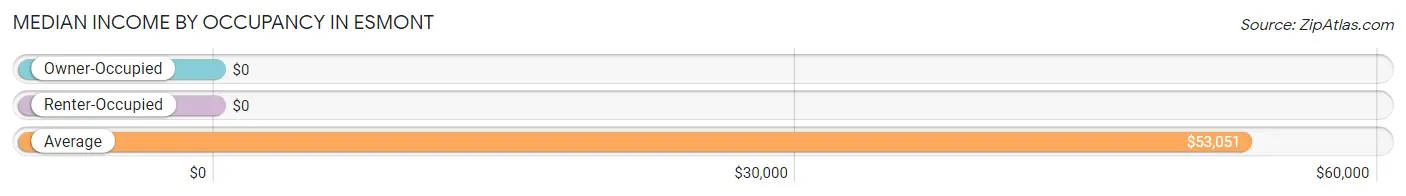
| Occupancy Type | # Households | Median Income |
| Owner-Occupied | 177 (83.9%) | $0 |
| Renter-Occupied | 34 (16.1%) | $0 |
| Average | 211 (100.0%) | $53,051 |
Occupancy by Householder Income Bracket in Esmont
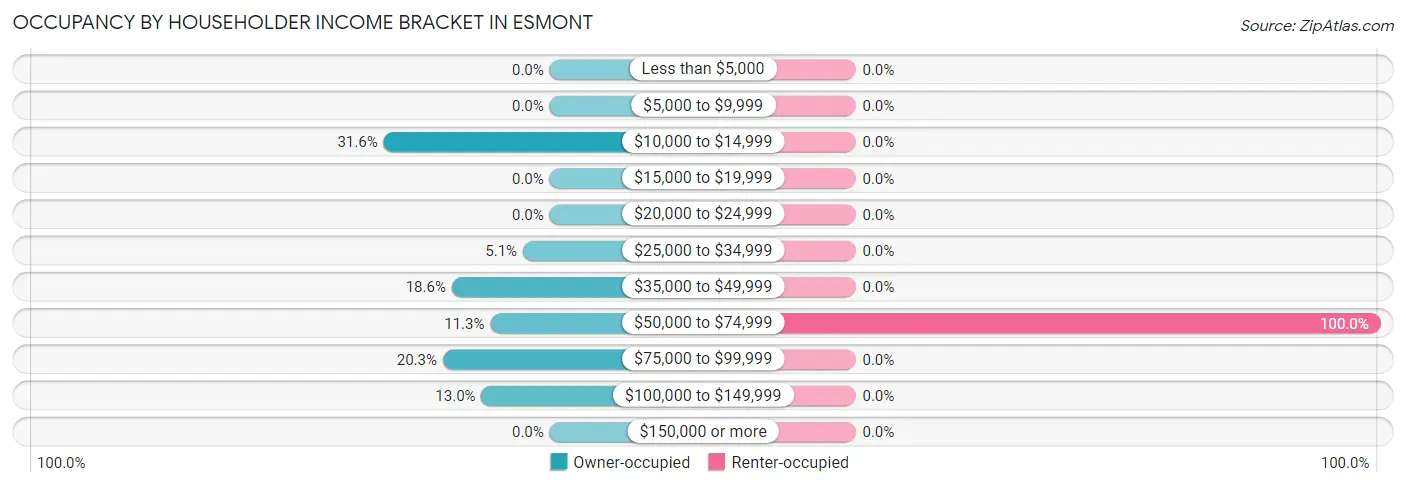
| Income Bracket | Owner-occupied | Renter-occupied |
| Less than $5,000 | 0 (0.0%) | 0 (0.0%) |
| $5,000 to $9,999 | 0 (0.0%) | 0 (0.0%) |
| $10,000 to $14,999 | 56 (31.6%) | 0 (0.0%) |
| $15,000 to $19,999 | 0 (0.0%) | 0 (0.0%) |
| $20,000 to $24,999 | 0 (0.0%) | 0 (0.0%) |
| $25,000 to $34,999 | 9 (5.1%) | 0 (0.0%) |
| $35,000 to $49,999 | 33 (18.6%) | 0 (0.0%) |
| $50,000 to $74,999 | 20 (11.3%) | 34 (100.0%) |
| $75,000 to $99,999 | 36 (20.3%) | 0 (0.0%) |
| $100,000 to $149,999 | 23 (13.0%) | 0 (0.0%) |
| $150,000 or more | 0 (0.0%) | 0 (0.0%) |
| Total | 177 (100.0%) | 34 (100.0%) |
Monthly Housing Cost Tiers in Esmont
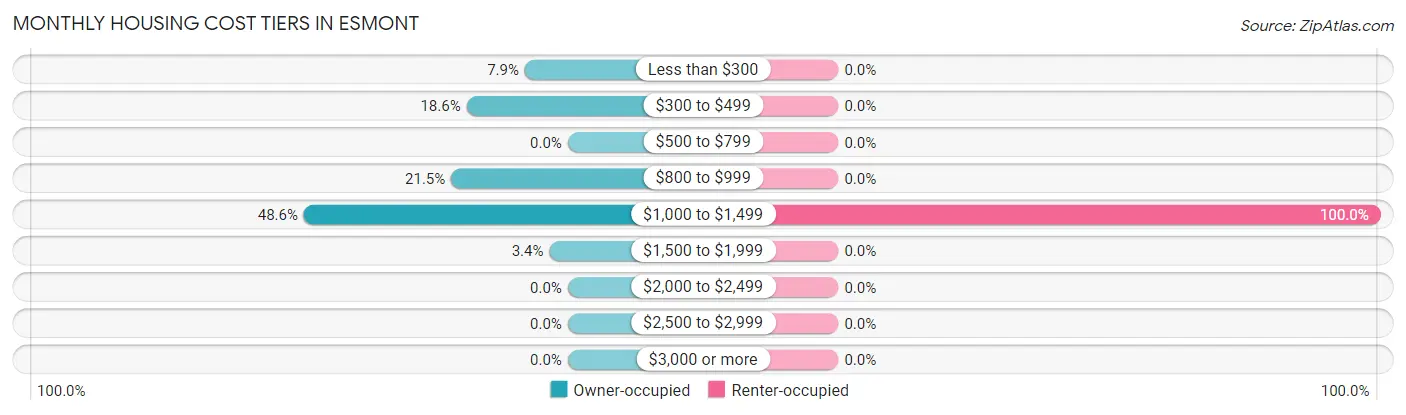
| Monthly Cost | Owner-occupied | Renter-occupied |
| Less than $300 | 14 (7.9%) | 0 (0.0%) |
| $300 to $499 | 33 (18.6%) | 0 (0.0%) |
| $500 to $799 | 0 (0.0%) | 0 (0.0%) |
| $800 to $999 | 38 (21.5%) | 0 (0.0%) |
| $1,000 to $1,499 | 86 (48.6%) | 34 (100.0%) |
| $1,500 to $1,999 | 6 (3.4%) | 0 (0.0%) |
| $2,000 to $2,499 | 0 (0.0%) | 0 (0.0%) |
| $2,500 to $2,999 | 0 (0.0%) | 0 (0.0%) |
| $3,000 or more | 0 (0.0%) | 0 (0.0%) |
| Total | 177 (100.0%) | 34 (100.0%) |
Physical Housing Characteristics in Esmont
Housing Structures in Esmont
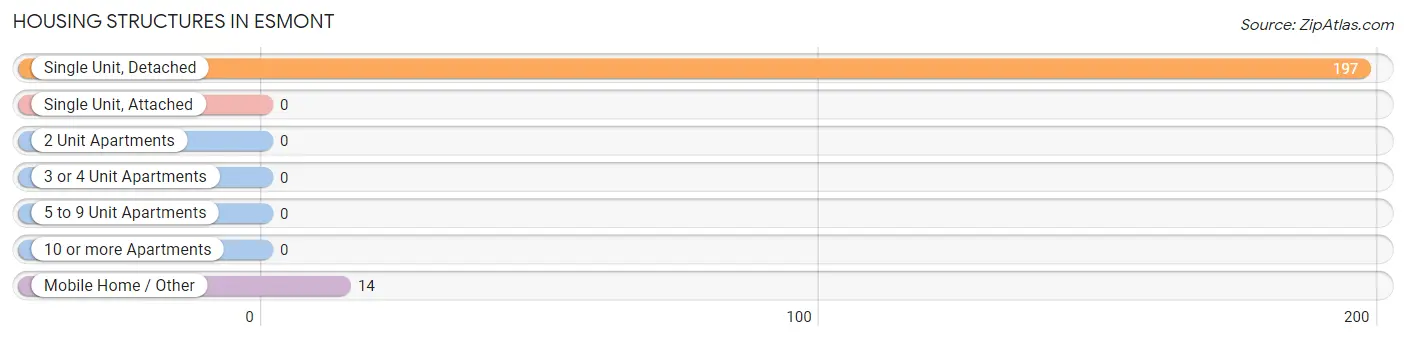
| Structure Type | # Housing Units | % Housing Units |
| Single Unit, Detached | 197 | 93.4% |
| Single Unit, Attached | 0 | 0.0% |
| 2 Unit Apartments | 0 | 0.0% |
| 3 or 4 Unit Apartments | 0 | 0.0% |
| 5 to 9 Unit Apartments | 0 | 0.0% |
| 10 or more Apartments | 0 | 0.0% |
| Mobile Home / Other | 14 | 6.6% |
| Total | 211 | 100.0% |
Housing Structures by Occupancy in Esmont
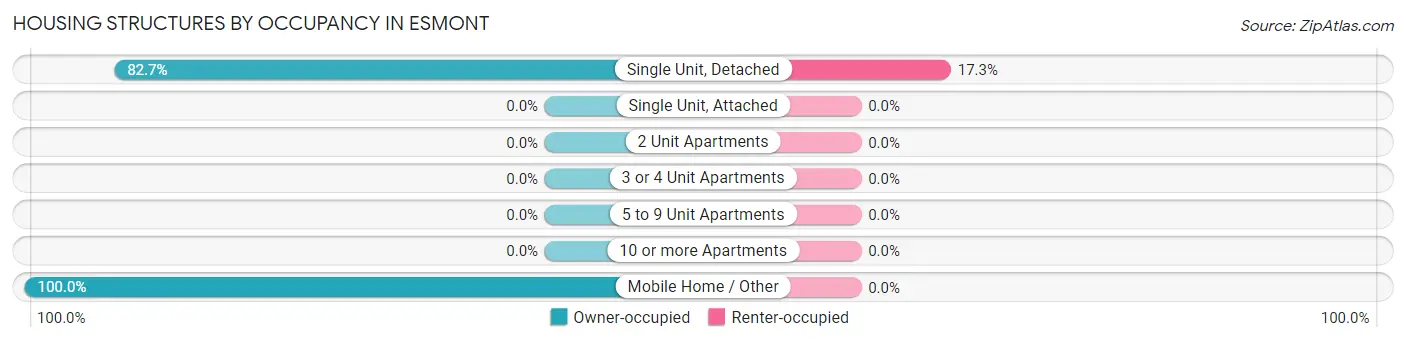
| Structure Type | Owner-occupied | Renter-occupied |
| Single Unit, Detached | 163 (82.7%) | 34 (17.3%) |
| Single Unit, Attached | 0 (0.0%) | 0 (0.0%) |
| 2 Unit Apartments | 0 (0.0%) | 0 (0.0%) |
| 3 or 4 Unit Apartments | 0 (0.0%) | 0 (0.0%) |
| 5 to 9 Unit Apartments | 0 (0.0%) | 0 (0.0%) |
| 10 or more Apartments | 0 (0.0%) | 0 (0.0%) |
| Mobile Home / Other | 14 (100.0%) | 0 (0.0%) |
| Total | 177 (83.9%) | 34 (16.1%) |
Housing Structures by Number of Rooms in Esmont
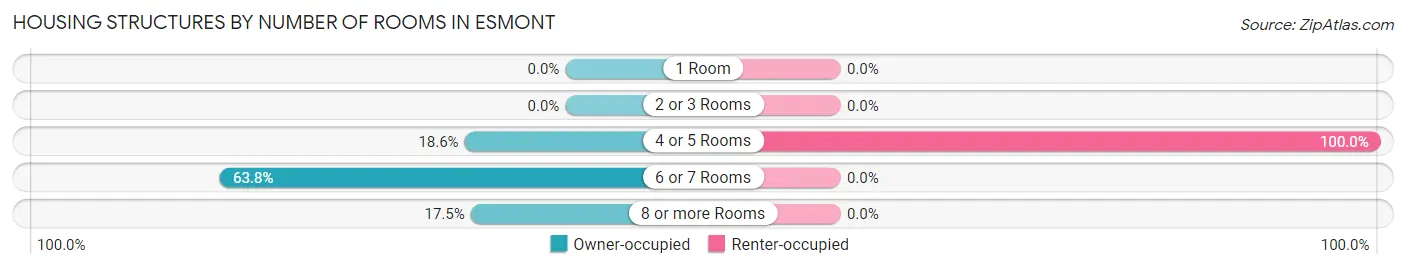
| Number of Rooms | Owner-occupied | Renter-occupied |
| 1 Room | 0 (0.0%) | 0 (0.0%) |
| 2 or 3 Rooms | 0 (0.0%) | 0 (0.0%) |
| 4 or 5 Rooms | 33 (18.6%) | 34 (100.0%) |
| 6 or 7 Rooms | 113 (63.8%) | 0 (0.0%) |
| 8 or more Rooms | 31 (17.5%) | 0 (0.0%) |
| Total | 177 (100.0%) | 34 (100.0%) |
Housing Structure by Heating Type in Esmont
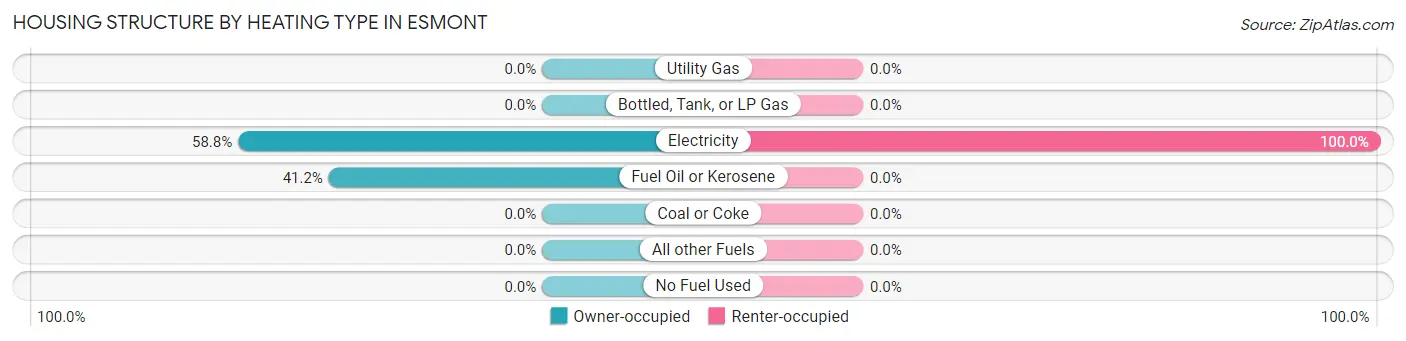
| Heating Type | Owner-occupied | Renter-occupied |
| Utility Gas | 0 (0.0%) | 0 (0.0%) |
| Bottled, Tank, or LP Gas | 0 (0.0%) | 0 (0.0%) |
| Electricity | 104 (58.8%) | 34 (100.0%) |
| Fuel Oil or Kerosene | 73 (41.2%) | 0 (0.0%) |
| Coal or Coke | 0 (0.0%) | 0 (0.0%) |
| All other Fuels | 0 (0.0%) | 0 (0.0%) |
| No Fuel Used | 0 (0.0%) | 0 (0.0%) |
| Total | 177 (100.0%) | 34 (100.0%) |
Household Vehicle Usage in Esmont
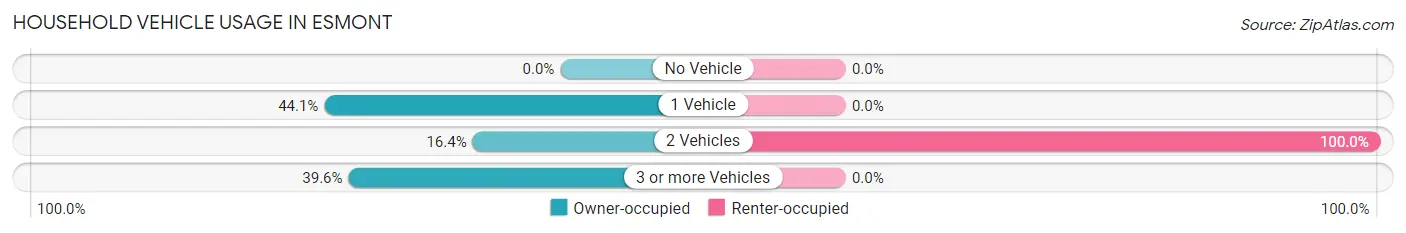
| Vehicles per Household | Owner-occupied | Renter-occupied |
| No Vehicle | 0 (0.0%) | 0 (0.0%) |
| 1 Vehicle | 78 (44.1%) | 0 (0.0%) |
| 2 Vehicles | 29 (16.4%) | 34 (100.0%) |
| 3 or more Vehicles | 70 (39.6%) | 0 (0.0%) |
| Total | 177 (100.0%) | 34 (100.0%) |
Real Estate & Mortgages in Esmont
Real Estate and Mortgage Overview in Esmont
| Characteristic | Without Mortgage | With Mortgage |
| Housing Units | 47 | 130 |
| Median Property Value | $214,400 | $210,400 |
| Median Household Income | - | - |
| Monthly Housing Costs | $368 | $0 |
| Real Estate Taxes | $1,287 | $29 |
Property Value by Mortgage Status in Esmont
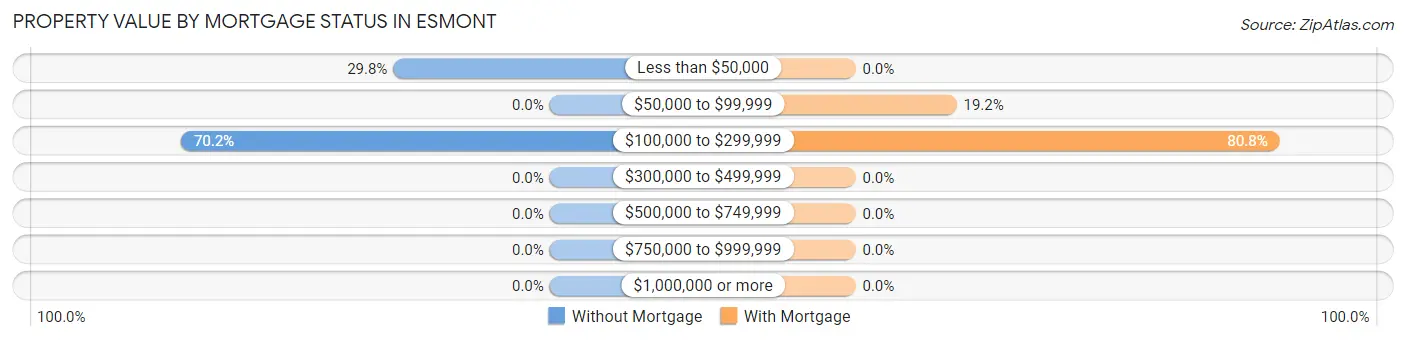
| Property Value | Without Mortgage | With Mortgage |
| Less than $50,000 | 14 (29.8%) | 0 (0.0%) |
| $50,000 to $99,999 | 0 (0.0%) | 25 (19.2%) |
| $100,000 to $299,999 | 33 (70.2%) | 105 (80.8%) |
| $300,000 to $499,999 | 0 (0.0%) | 0 (0.0%) |
| $500,000 to $749,999 | 0 (0.0%) | 0 (0.0%) |
| $750,000 to $999,999 | 0 (0.0%) | 0 (0.0%) |
| $1,000,000 or more | 0 (0.0%) | 0 (0.0%) |
| Total | 47 (100.0%) | 130 (100.0%) |
Household Income by Mortgage Status in Esmont
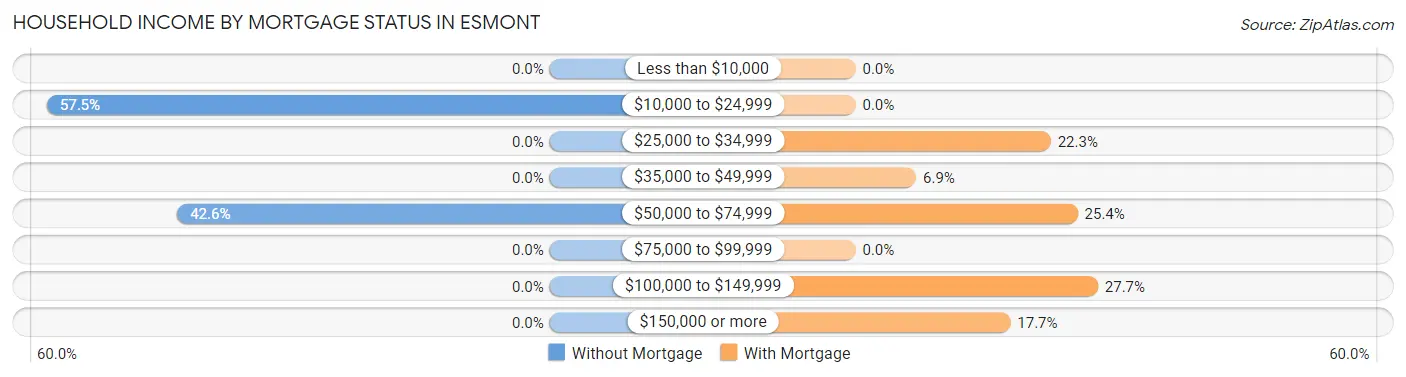
| Household Income | Without Mortgage | With Mortgage |
| Less than $10,000 | 0 (0.0%) | 0 (0.0%) |
| $10,000 to $24,999 | 27 (57.5%) | 0 (0.0%) |
| $25,000 to $34,999 | 0 (0.0%) | 29 (22.3%) |
| $35,000 to $49,999 | 0 (0.0%) | 9 (6.9%) |
| $50,000 to $74,999 | 20 (42.5%) | 33 (25.4%) |
| $75,000 to $99,999 | 0 (0.0%) | 0 (0.0%) |
| $100,000 to $149,999 | 0 (0.0%) | 36 (27.7%) |
| $150,000 or more | 0 (0.0%) | 23 (17.7%) |
| Total | 47 (100.0%) | 130 (100.0%) |
Property Value to Household Income Ratio in Esmont
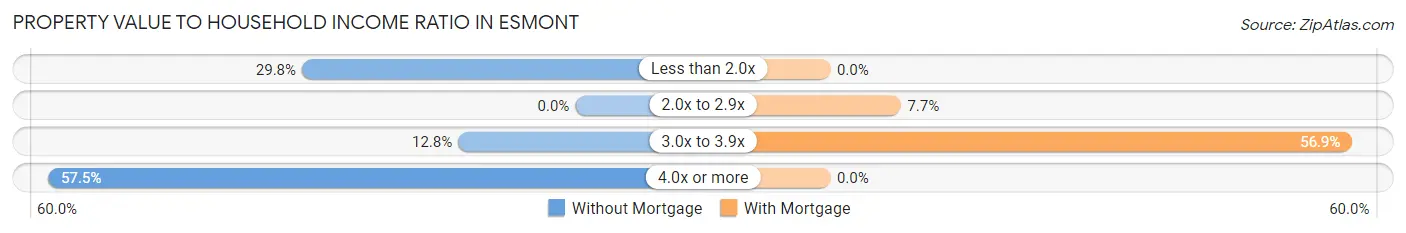
| Value-to-Income Ratio | Without Mortgage | With Mortgage |
| Less than 2.0x | 14 (29.8%) | 0 (0.0%) |
| 2.0x to 2.9x | 0 (0.0%) | 10 (7.7%) |
| 3.0x to 3.9x | 6 (12.8%) | 74 (56.9%) |
| 4.0x or more | 27 (57.5%) | 0 (0.0%) |
| Total | 47 (100.0%) | 130 (100.0%) |
Real Estate Taxes by Mortgage Status in Esmont
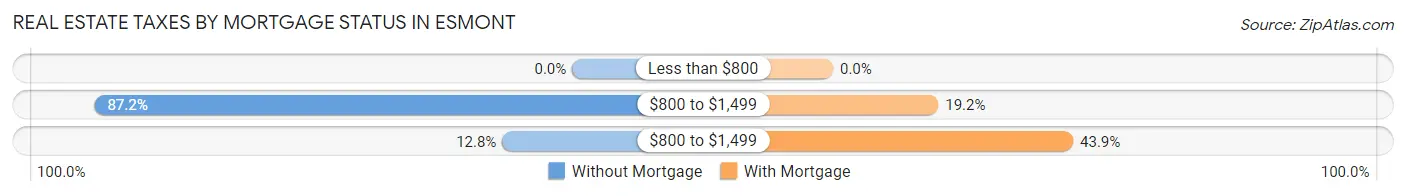
| Property Taxes | Without Mortgage | With Mortgage |
| Less than $800 | 0 (0.0%) | 0 (0.0%) |
| $800 to $1,499 | 41 (87.2%) | 25 (19.2%) |
| $800 to $1,499 | 6 (12.8%) | 57 (43.9%) |
| Total | 47 (100.0%) | 130 (100.0%) |
Health & Disability in Esmont
Health Insurance Coverage by Age in Esmont
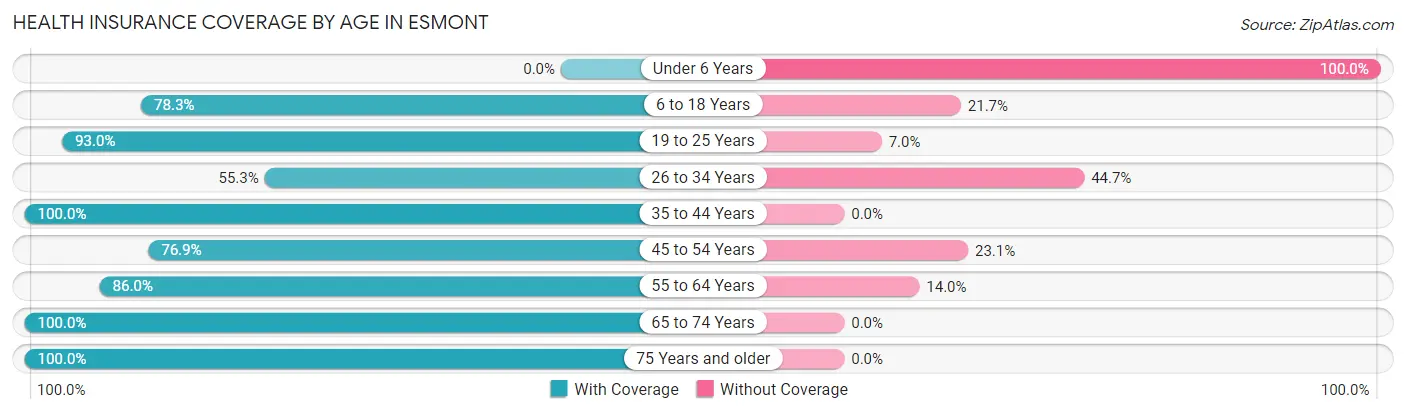
| Age Bracket | With Coverage | Without Coverage |
| Under 6 Years | 0 (0.0%) | 58 (100.0%) |
| 6 to 18 Years | 18 (78.3%) | 5 (21.7%) |
| 19 to 25 Years | 40 (93.0%) | 3 (7.0%) |
| 26 to 34 Years | 42 (55.3%) | 34 (44.7%) |
| 35 to 44 Years | 35 (100.0%) | 0 (0.0%) |
| 45 to 54 Years | 20 (76.9%) | 6 (23.1%) |
| 55 to 64 Years | 86 (86.0%) | 14 (14.0%) |
| 65 to 74 Years | 14 (100.0%) | 0 (0.0%) |
| 75 Years and older | 81 (100.0%) | 0 (0.0%) |
| Total | 336 (73.7%) | 120 (26.3%) |
Health Insurance Coverage by Citizenship Status in Esmont
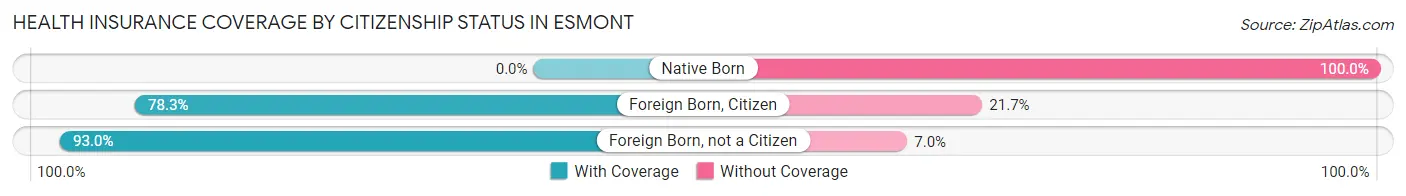
| Citizenship Status | With Coverage | Without Coverage |
| Native Born | 0 (0.0%) | 58 (100.0%) |
| Foreign Born, Citizen | 18 (78.3%) | 5 (21.7%) |
| Foreign Born, not a Citizen | 40 (93.0%) | 3 (7.0%) |
Health Insurance Coverage by Household Income in Esmont
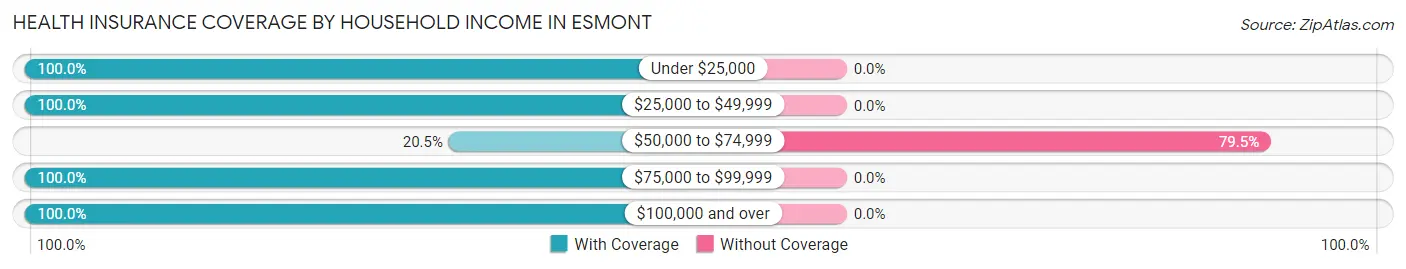
| Household Income | With Coverage | Without Coverage |
| Under $25,000 | 56 (100.0%) | 0 (0.0%) |
| $25,000 to $49,999 | 62 (100.0%) | 0 (0.0%) |
| $50,000 to $74,999 | 31 (20.5%) | 120 (79.5%) |
| $75,000 to $99,999 | 84 (100.0%) | 0 (0.0%) |
| $100,000 and over | 103 (100.0%) | 0 (0.0%) |
Public vs Private Health Insurance Coverage by Age in Esmont
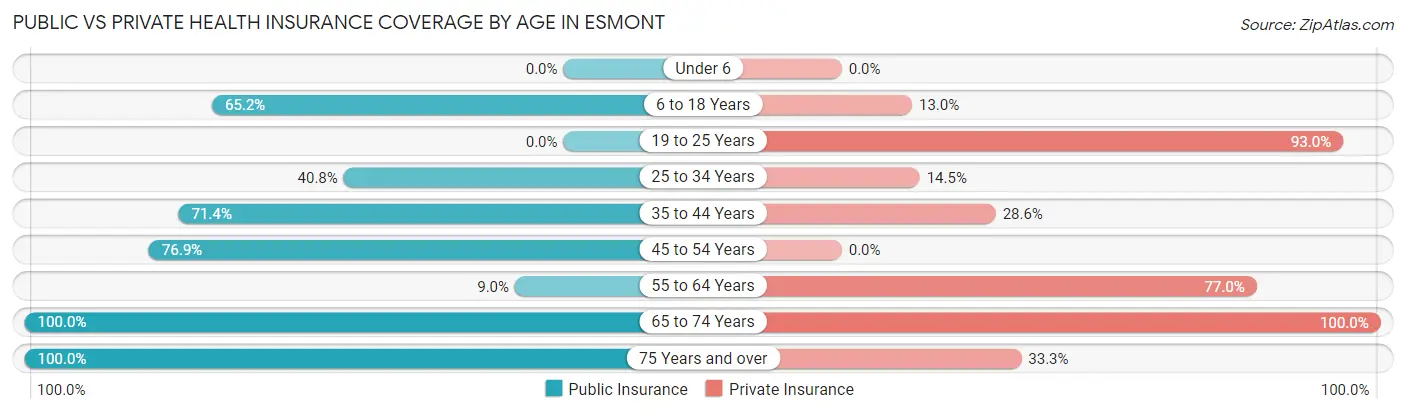
| Age Bracket | Public Insurance | Private Insurance |
| Under 6 | 0 (0.0%) | 0 (0.0%) |
| 6 to 18 Years | 15 (65.2%) | 3 (13.0%) |
| 19 to 25 Years | 0 (0.0%) | 40 (93.0%) |
| 25 to 34 Years | 31 (40.8%) | 11 (14.5%) |
| 35 to 44 Years | 25 (71.4%) | 10 (28.6%) |
| 45 to 54 Years | 20 (76.9%) | 0 (0.0%) |
| 55 to 64 Years | 9 (9.0%) | 77 (77.0%) |
| 65 to 74 Years | 14 (100.0%) | 14 (100.0%) |
| 75 Years and over | 81 (100.0%) | 27 (33.3%) |
| Total | 195 (42.8%) | 182 (39.9%) |
Disability Status by Sex by Age in Esmont
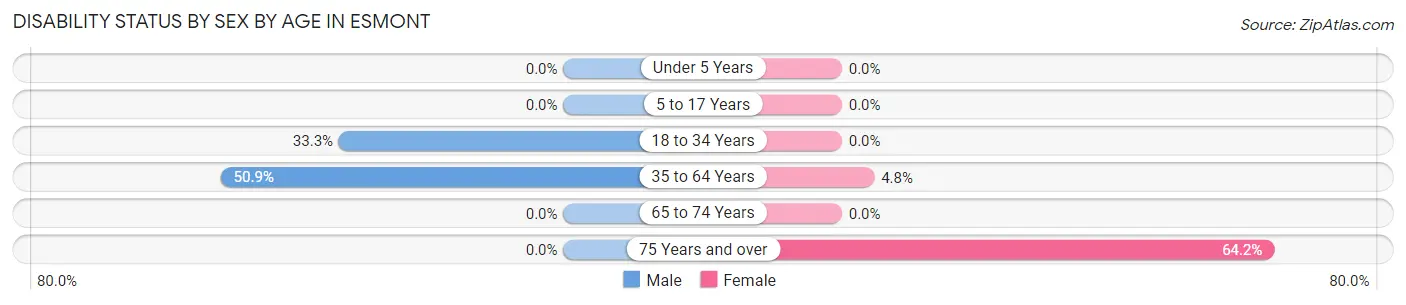
| Age Bracket | Male | Female |
| Under 5 Years | 0 (0.0%) | 0 (0.0%) |
| 5 to 17 Years | 0 (0.0%) | 0 (0.0%) |
| 18 to 34 Years | 7 (33.3%) | 0 (0.0%) |
| 35 to 64 Years | 29 (50.9%) | 5 (4.8%) |
| 65 to 74 Years | 0 (0.0%) | 0 (0.0%) |
| 75 Years and over | 0 (0.0%) | 52 (64.2%) |
Disability Class by Sex by Age in Esmont
Disability Class: Hearing Difficulty
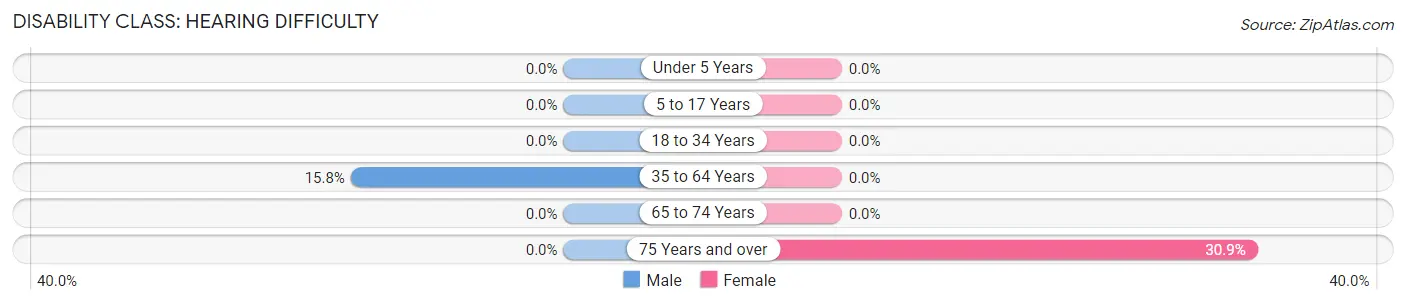
| Age Bracket | Male | Female |
| Under 5 Years | 0 (0.0%) | 0 (0.0%) |
| 5 to 17 Years | 0 (0.0%) | 0 (0.0%) |
| 18 to 34 Years | 0 (0.0%) | 0 (0.0%) |
| 35 to 64 Years | 9 (15.8%) | 0 (0.0%) |
| 65 to 74 Years | 0 (0.0%) | 0 (0.0%) |
| 75 Years and over | 0 (0.0%) | 25 (30.9%) |
Disability Class: Vision Difficulty
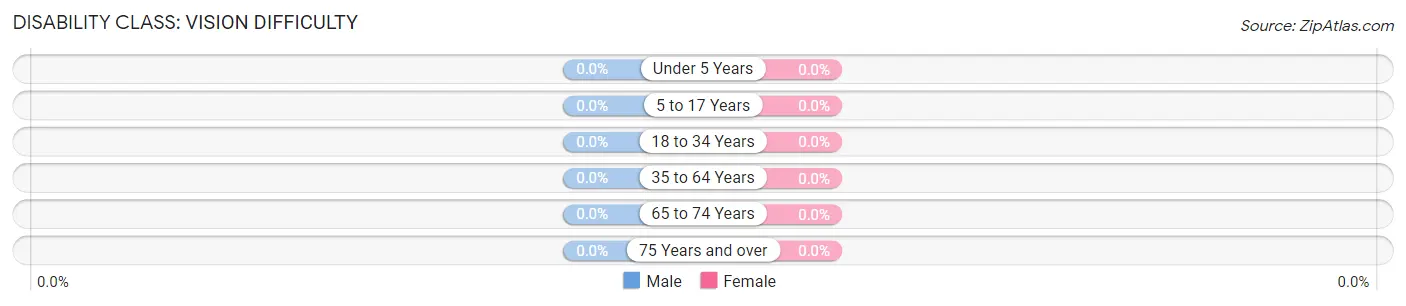
| Age Bracket | Male | Female |
| Under 5 Years | 0 (0.0%) | 0 (0.0%) |
| 5 to 17 Years | 0 (0.0%) | 0 (0.0%) |
| 18 to 34 Years | 0 (0.0%) | 0 (0.0%) |
| 35 to 64 Years | 0 (0.0%) | 0 (0.0%) |
| 65 to 74 Years | 0 (0.0%) | 0 (0.0%) |
| 75 Years and over | 0 (0.0%) | 0 (0.0%) |
Disability Class: Cognitive Difficulty
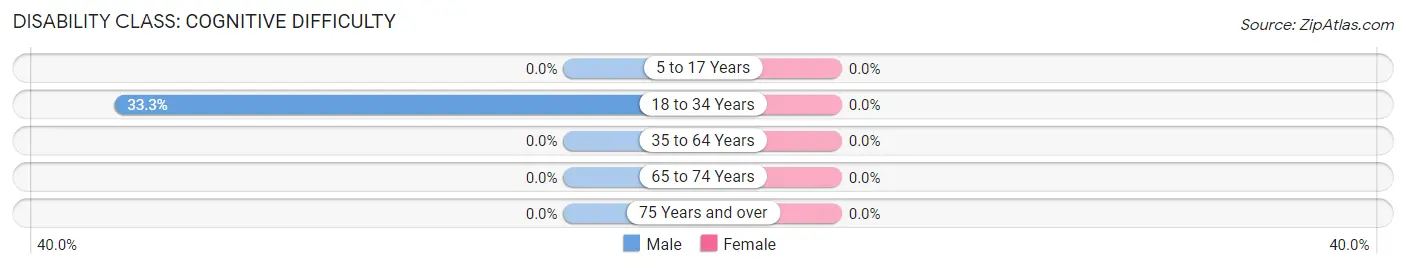
| Age Bracket | Male | Female |
| 5 to 17 Years | 0 (0.0%) | 0 (0.0%) |
| 18 to 34 Years | 7 (33.3%) | 0 (0.0%) |
| 35 to 64 Years | 0 (0.0%) | 0 (0.0%) |
| 65 to 74 Years | 0 (0.0%) | 0 (0.0%) |
| 75 Years and over | 0 (0.0%) | 0 (0.0%) |
Disability Class: Ambulatory Difficulty
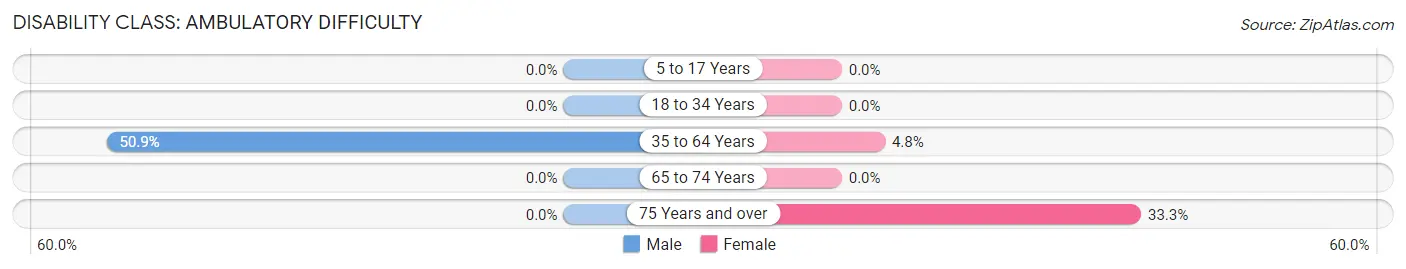
| Age Bracket | Male | Female |
| 5 to 17 Years | 0 (0.0%) | 0 (0.0%) |
| 18 to 34 Years | 0 (0.0%) | 0 (0.0%) |
| 35 to 64 Years | 29 (50.9%) | 5 (4.8%) |
| 65 to 74 Years | 0 (0.0%) | 0 (0.0%) |
| 75 Years and over | 0 (0.0%) | 27 (33.3%) |
Disability Class: Self-Care Difficulty
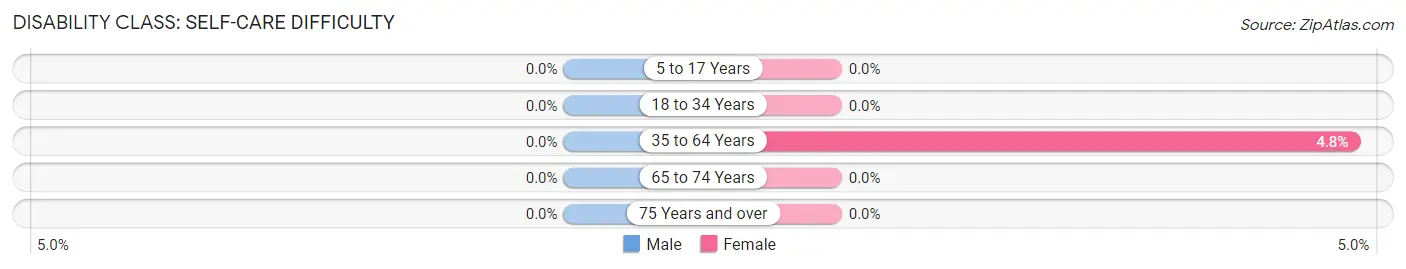
| Age Bracket | Male | Female |
| 5 to 17 Years | 0 (0.0%) | 0 (0.0%) |
| 18 to 34 Years | 0 (0.0%) | 0 (0.0%) |
| 35 to 64 Years | 0 (0.0%) | 5 (4.8%) |
| 65 to 74 Years | 0 (0.0%) | 0 (0.0%) |
| 75 Years and over | 0 (0.0%) | 0 (0.0%) |
Technology Access in Esmont
Computing Device Access in Esmont
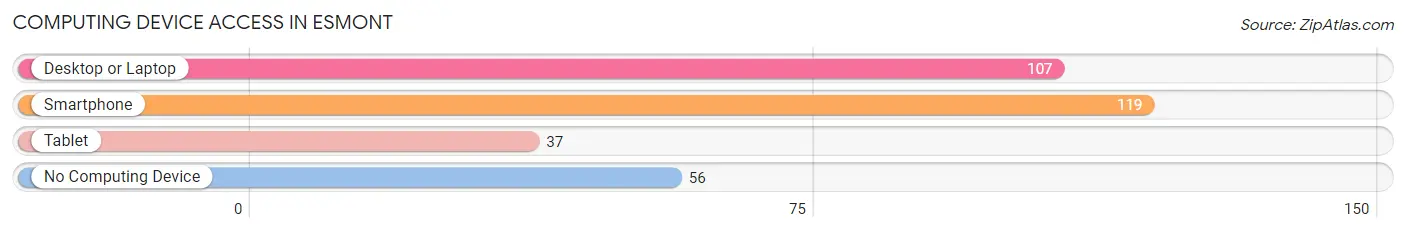
| Device Type | # Households | % Households |
| Desktop or Laptop | 107 | 50.7% |
| Smartphone | 119 | 56.4% |
| Tablet | 37 | 17.5% |
| No Computing Device | 56 | 26.5% |
| Total | 211 | 100.0% |
Internet Access in Esmont
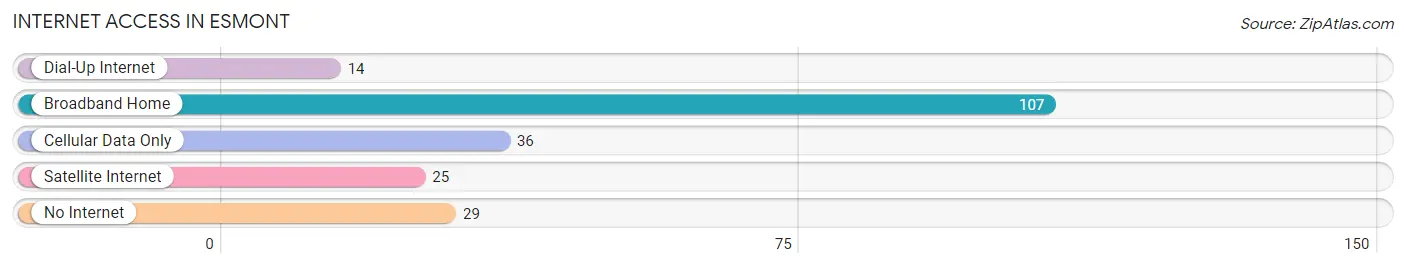
| Internet Type | # Households | % Households |
| Dial-Up Internet | 14 | 6.6% |
| Broadband Home | 107 | 50.7% |
| Cellular Data Only | 36 | 17.1% |
| Satellite Internet | 25 | 11.8% |
| No Internet | 29 | 13.7% |
| Total | 211 | 100.0% |
Esmont Summary
Esmont is a small unincorporated community located in Albemarle County, Virginia. It is situated in the foothills of the Blue Ridge Mountains, approximately 10 miles northwest of Charlottesville. The community is home to a population of approximately 500 people, and is known for its rural charm and close-knit community.
History
Esmont was first settled in the late 1700s by a group of German immigrants. The community was named after the nearby Esmont Creek, which was named after the Esmont family, who were among the first settlers in the area. The community was largely agricultural, and the Esmont family owned a large plantation in the area.
In the early 1900s, the community began to grow and develop. The Esmont post office was established in 1906, and the community was incorporated in 1908. The town was home to a variety of businesses, including a general store, a blacksmith shop, a grist mill, and a sawmill.
In the mid-1900s, the community began to decline. The post office closed in the 1950s, and the businesses in the area began to close. The population of the town began to decline, and by the 2000 census, the population was just over 500 people.
Geography
Esmont is located in the foothills of the Blue Ridge Mountains, approximately 10 miles northwest of Charlottesville. The community is situated in a rural area, and is surrounded by rolling hills and farmland. The Esmont Creek runs through the town, and is a popular spot for fishing and swimming.
The climate in Esmont is temperate, with hot summers and mild winters. The average temperature in the summer is around 80 degrees Fahrenheit, and the average temperature in the winter is around 40 degrees Fahrenheit.
Economy
The economy of Esmont is largely agricultural. The town is home to several farms, and the surrounding area is known for its production of apples, peaches, and other fruits and vegetables. The town is also home to a few small businesses, including a general store, a gas station, and a few restaurants.
Demographics
As of the 2000 census, the population of Esmont was 514 people. The racial makeup of the town was 94.3% White, 3.9% African American, 0.2% Native American, 0.2% Asian, and 1.4% from other races. The median household income was $37,500, and the median family income was $41,250. The per capita income was $17,818.
Conclusion
Esmont is a small unincorporated community located in Albemarle County, Virginia. It is situated in the foothills of the Blue Ridge Mountains, approximately 10 miles northwest of Charlottesville. The community is home to a population of approximately 500 people, and is known for its rural charm and close-knit community. The economy of Esmont is largely agricultural, and the town is home to several farms and a few small businesses. As of the 2000 census, the population of Esmont was 514 people, and the median household income was $37,500.
Common Questions
What is Per Capita Income in Esmont?
Per Capita income in Esmont is $24,405.
What is the Median Family Income in Esmont?
Median Family Income in Esmont is $82,882.
What is the Median Household income in Esmont?
Median Household Income in Esmont is $53,051.
What is Income or Wage Gap in Esmont?
Income or Wage Gap in Esmont is 12.0%.
Women in Esmont earn 88.0 cents for every dollar earned by a man.
What is Inequality or Gini Index in Esmont?
Inequality or Gini Index in Esmont is 0.35.
What is the Total Population of Esmont?
Total Population of Esmont is 456.
What is the Total Male Population of Esmont?
Total Male Population of Esmont is 107.
What is the Total Female Population of Esmont?
Total Female Population of Esmont is 349.
What is the Ratio of Males per 100 Females in Esmont?
There are 30.66 Males per 100 Females in Esmont.
What is the Ratio of Females per 100 Males in Esmont?
There are 326.17 Females per 100 Males in Esmont.
What is the Median Population Age in Esmont?
Median Population Age in Esmont is 38.8 Years.
What is the Average Family Size in Esmont
Average Family Size in Esmont is 3.0 People.
What is the Average Household Size in Esmont
Average Household Size in Esmont is 2.2 People.
How Large is the Labor Force in Esmont?
There are 243 People in the Labor Forcein in Esmont.
What is the Percentage of People in the Labor Force in Esmont?
63.9% of People are in the Labor Force in Esmont.
What is the Unemployment Rate in Esmont?
Unemployment Rate in Esmont is 4.5%.