Emporia, VA Map & Demographics
Emporia Map
Emporia Overview
$24,915
PER CAPITA INCOME
$54,091
AVG FAMILY INCOME
$41,442
AVG HOUSEHOLD INCOME
21.3%
WAGE / INCOME GAP [ % ]
78.7¢/ $1
WAGE / INCOME GAP [ $ ]
0.45
INEQUALITY / GINI INDEX
5,680
TOTAL POPULATION
2,531
MALE POPULATION
3,149
FEMALE POPULATION
80.37
MALES / 100 FEMALES
124.42
FEMALES / 100 MALES
39.9
MEDIAN AGE
3.0
AVG FAMILY SIZE
2.4
AVG HOUSEHOLD SIZE
2,350
LABOR FORCE [ PEOPLE ]
53.2%
PERCENT IN LABOR FORCE
7.0%
UNEMPLOYMENT RATE
Emporia Zip Codes
Emporia Area Codes
Income in Emporia
Income Overview in Emporia
Per Capita Income in Emporia is $24,915, while median incomes of families and households are $54,091 and $41,442 respectively.
| Characteristic | Number | Measure |
| Per Capita Income | 5,680 | $24,915 |
| Median Family Income | 1,384 | $54,091 |
| Mean Family Income | 1,384 | $69,372 |
| Median Household Income | 2,245 | $41,442 |
| Mean Household Income | 2,245 | $61,212 |
| Income Deficit | 1,384 | $0 |
| Wage / Income Gap (%) | 5,680 | 21.35% |
| Wage / Income Gap ($) | 5,680 | 78.65¢ per $1 |
| Gini / Inequality Index | 5,680 | 0.45 |
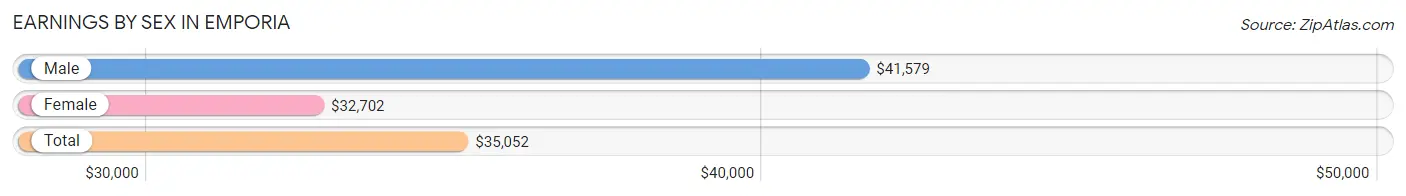
Earnings by Sex in Emporia
Average Earnings in Emporia are $35,052, $41,579 for men and $32,702 for women, a difference of 21.3%.
| Sex | Number | Average Earnings |
| Male | 1,144 (47.5%) | $41,579 |
| Female | 1,265 (52.5%) | $32,702 |
| Total | 2,409 (100.0%) | $35,052 |
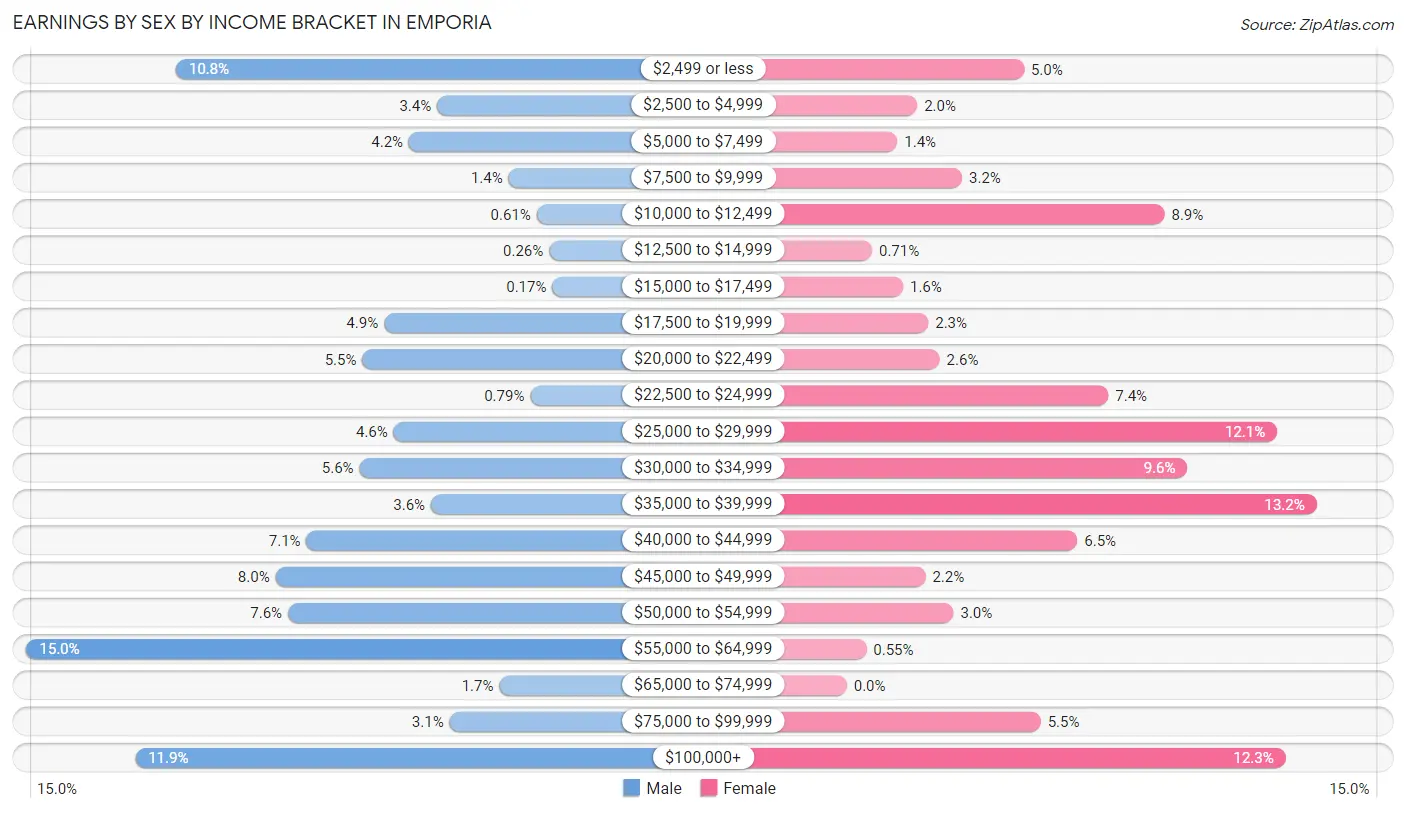
Earnings by Sex by Income Bracket in Emporia
The most common earnings brackets in Emporia are $55,000 to $64,999 for men (171 | 14.9%) and $35,000 to $39,999 for women (167 | 13.2%).
| Income | Male | Female |
| $2,499 or less | 123 (10.7%) | 63 (5.0%) |
| $2,500 to $4,999 | 39 (3.4%) | 25 (2.0%) |
| $5,000 to $7,499 | 48 (4.2%) | 18 (1.4%) |
| $7,500 to $9,999 | 16 (1.4%) | 41 (3.2%) |
| $10,000 to $12,499 | 7 (0.6%) | 113 (8.9%) |
| $12,500 to $14,999 | 3 (0.3%) | 9 (0.7%) |
| $15,000 to $17,499 | 2 (0.2%) | 20 (1.6%) |
| $17,500 to $19,999 | 56 (4.9%) | 29 (2.3%) |
| $20,000 to $22,499 | 63 (5.5%) | 33 (2.6%) |
| $22,500 to $24,999 | 9 (0.8%) | 93 (7.3%) |
| $25,000 to $29,999 | 53 (4.6%) | 153 (12.1%) |
| $30,000 to $34,999 | 64 (5.6%) | 121 (9.6%) |
| $35,000 to $39,999 | 41 (3.6%) | 167 (13.2%) |
| $40,000 to $44,999 | 81 (7.1%) | 82 (6.5%) |
| $45,000 to $49,999 | 91 (8.0%) | 28 (2.2%) |
| $50,000 to $54,999 | 87 (7.6%) | 38 (3.0%) |
| $55,000 to $64,999 | 171 (14.9%) | 7 (0.5%) |
| $65,000 to $74,999 | 19 (1.7%) | 0 (0.0%) |
| $75,000 to $99,999 | 35 (3.1%) | 69 (5.4%) |
| $100,000+ | 136 (11.9%) | 156 (12.3%) |
| Total | 1,144 (100.0%) | 1,265 (100.0%) |
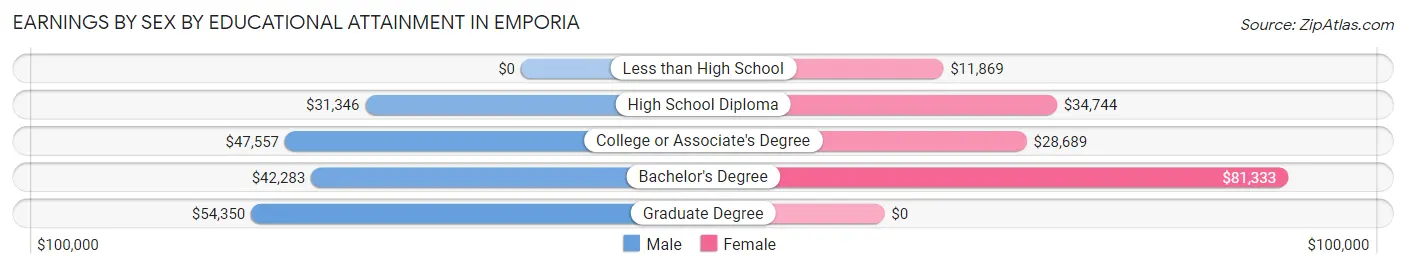
Earnings by Sex by Educational Attainment in Emporia
Average earnings in Emporia are $46,410 for men and $33,838 for women, a difference of 27.1%. Men with an educational attainment of graduate degree enjoy the highest average annual earnings of $54,350, while those with high school diploma education earn the least with $31,346. Women with an educational attainment of bachelor's degree earn the most with the average annual earnings of $81,333, while those with less than high school education have the smallest earnings of $11,869.
| Educational Attainment | Male Income | Female Income |
| Less than High School | - | - |
| High School Diploma | $31,346 | $34,744 |
| College or Associate's Degree | $47,557 | $28,689 |
| Bachelor's Degree | $42,283 | $81,333 |
| Graduate Degree | $54,350 | $0 |
| Total | $46,410 | $33,838 |
Family Income in Emporia
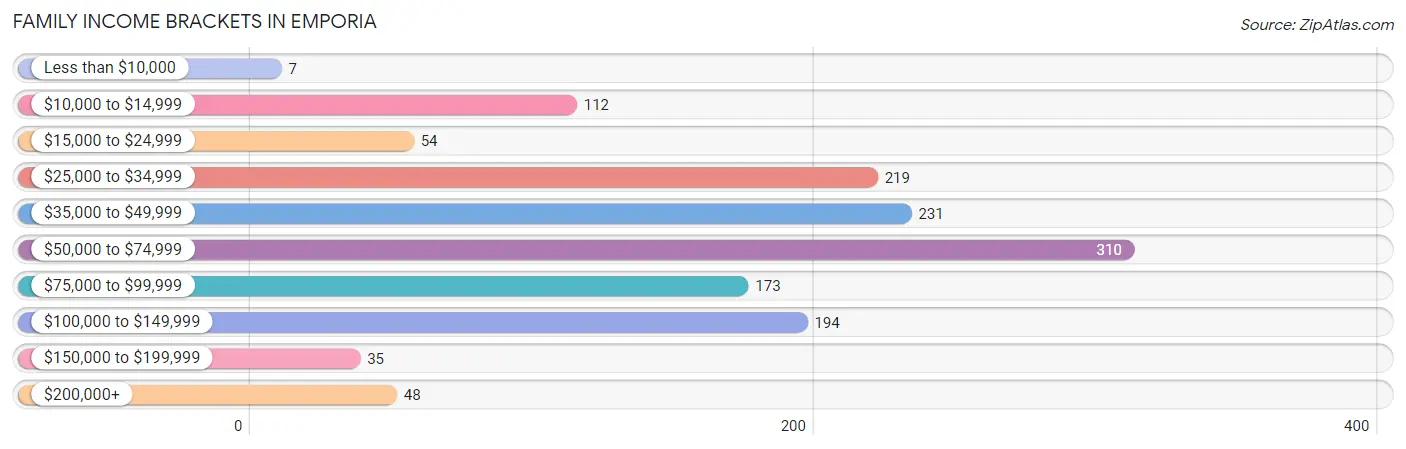
Family Income Brackets in Emporia
According to the Emporia family income data, there are 310 families falling into the $50,000 to $74,999 income range, which is the most common income bracket and makes up 22.4% of all families. Conversely, the less than $10,000 income bracket is the least frequent group with only 7 families (0.5%) belonging to this category.
| Income Bracket | # Families | % Families |
| Less than $10,000 | 7 | 0.5% |
| $10,000 to $14,999 | 112 | 8.1% |
| $15,000 to $24,999 | 54 | 3.9% |
| $25,000 to $34,999 | 219 | 15.8% |
| $35,000 to $49,999 | 231 | 16.7% |
| $50,000 to $74,999 | 310 | 22.4% |
| $75,000 to $99,999 | 173 | 12.5% |
| $100,000 to $149,999 | 194 | 14.0% |
| $150,000 to $199,999 | 35 | 2.5% |
| $200,000+ | 48 | 3.5% |
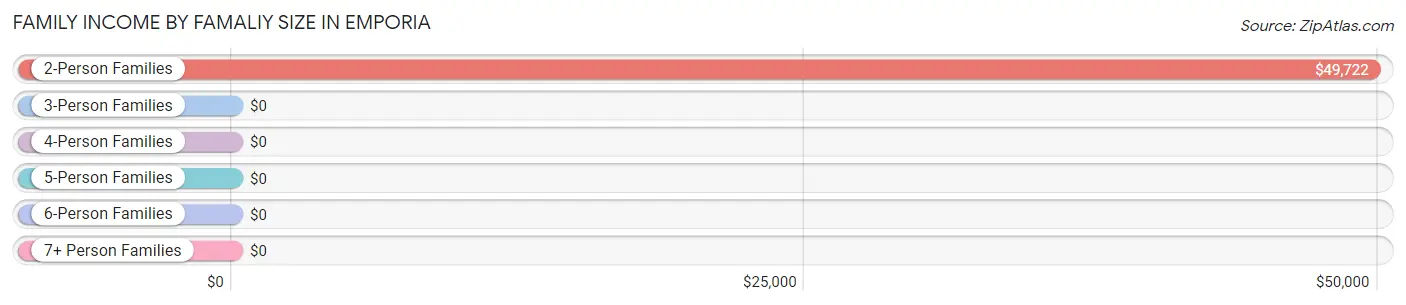
Family Income by Famaliy Size in Emporia
2-person families (756 | 54.6%) account for the highest median family income in Emporia with $49,722 per family, while 2-person families (756 | 54.6%) have the highest median income of $24,861 per family member.
| Income Bracket | # Families | Median Income |
| 2-Person Families | 756 (54.6%) | $49,722 |
| 3-Person Families | 307 (22.2%) | $0 |
| 4-Person Families | 211 (15.2%) | $0 |
| 5-Person Families | 21 (1.5%) | $0 |
| 6-Person Families | 39 (2.8%) | $0 |
| 7+ Person Families | 50 (3.6%) | $0 |
| Total | 1,384 (100.0%) | $54,091 |
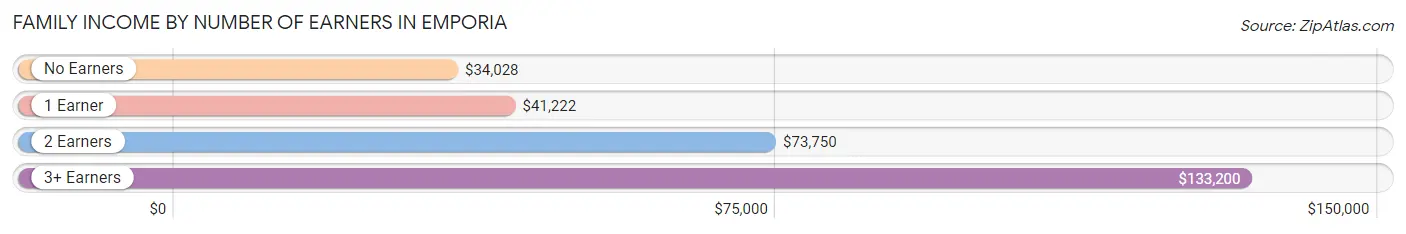
Family Income by Number of Earners in Emporia
The median family income in Emporia is $54,091, with families comprising 3+ earners (78) having the highest median family income of $133,200, while families with no earners (213) have the lowest median family income of $34,028, accounting for 5.6% and 15.4% of families, respectively.
| Number of Earners | # Families | Median Income |
| No Earners | 213 (15.4%) | $34,028 |
| 1 Earner | 588 (42.5%) | $41,222 |
| 2 Earners | 505 (36.5%) | $73,750 |
| 3+ Earners | 78 (5.6%) | $133,200 |
| Total | 1,384 (100.0%) | $54,091 |
Household Income in Emporia
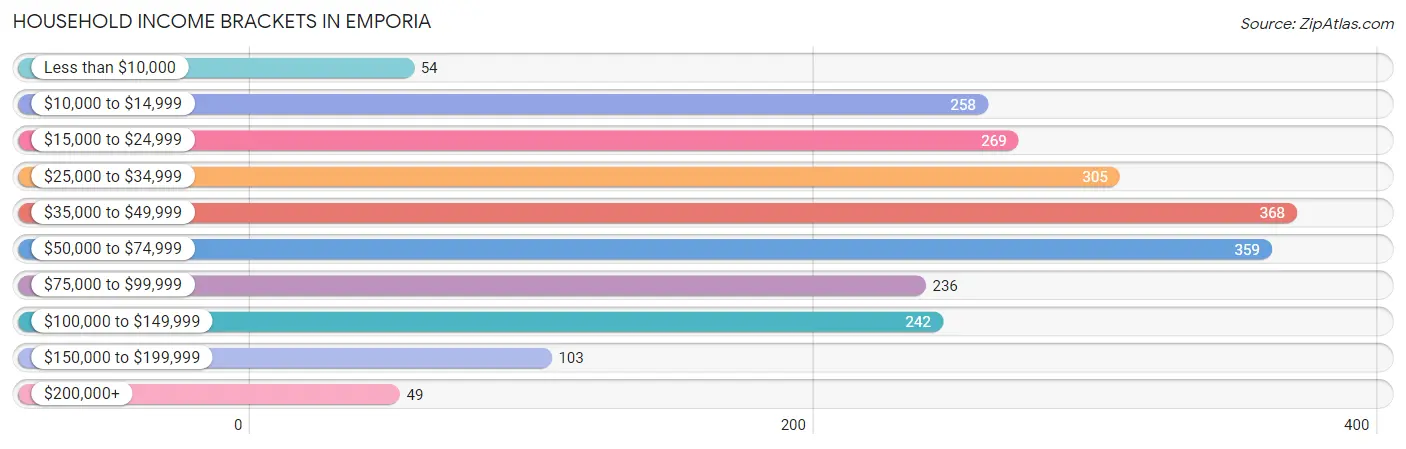
Household Income Brackets in Emporia
With 368 households falling in the category, the $35,000 to $49,999 income range is the most frequent in Emporia, accounting for 16.4% of all households. In contrast, only 49 households (2.2%) fall into the $200,000+ income bracket, making it the least populous group.
| Income Bracket | # Households | % Households |
| Less than $10,000 | 54 | 2.4% |
| $10,000 to $14,999 | 258 | 11.5% |
| $15,000 to $24,999 | 269 | 12.0% |
| $25,000 to $34,999 | 305 | 13.6% |
| $35,000 to $49,999 | 368 | 16.4% |
| $50,000 to $74,999 | 359 | 16.0% |
| $75,000 to $99,999 | 236 | 10.5% |
| $100,000 to $149,999 | 242 | 10.8% |
| $150,000 to $199,999 | 103 | 4.6% |
| $200,000+ | 49 | 2.2% |
Household Income by Householder Age in Emporia
The median household income in Emporia is $41,442, with the highest median household income of $78,043 found in the 15 to 24 years age bracket for the primary householder. A total of 72 households (3.2%) fall into this category. Meanwhile, the 65+ years age bracket for the primary householder has the lowest median household income of $31,094, with 701 households (31.2%) in this group.
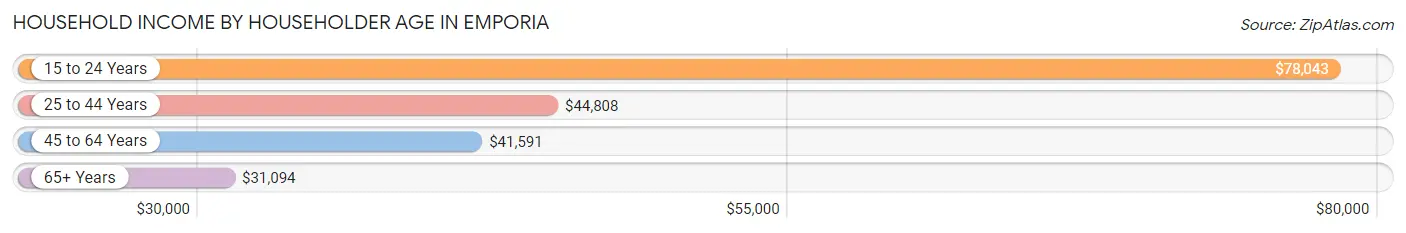
| Income Bracket | # Households | Median Income |
| 15 to 24 Years | 72 (3.2%) | $78,043 |
| 25 to 44 Years | 692 (30.8%) | $44,808 |
| 45 to 64 Years | 780 (34.7%) | $41,591 |
| 65+ Years | 701 (31.2%) | $31,094 |
| Total | 2,245 (100.0%) | $41,442 |
Poverty in Emporia
Income Below Poverty by Sex and Age in Emporia
With 11.3% poverty level for males and 22.2% for females among the residents of Emporia, 15 year old males and 15 year old females are the most vulnerable to poverty, with 19 males (55.9%) and 20 females (60.6%) in their respective age groups living below the poverty level.
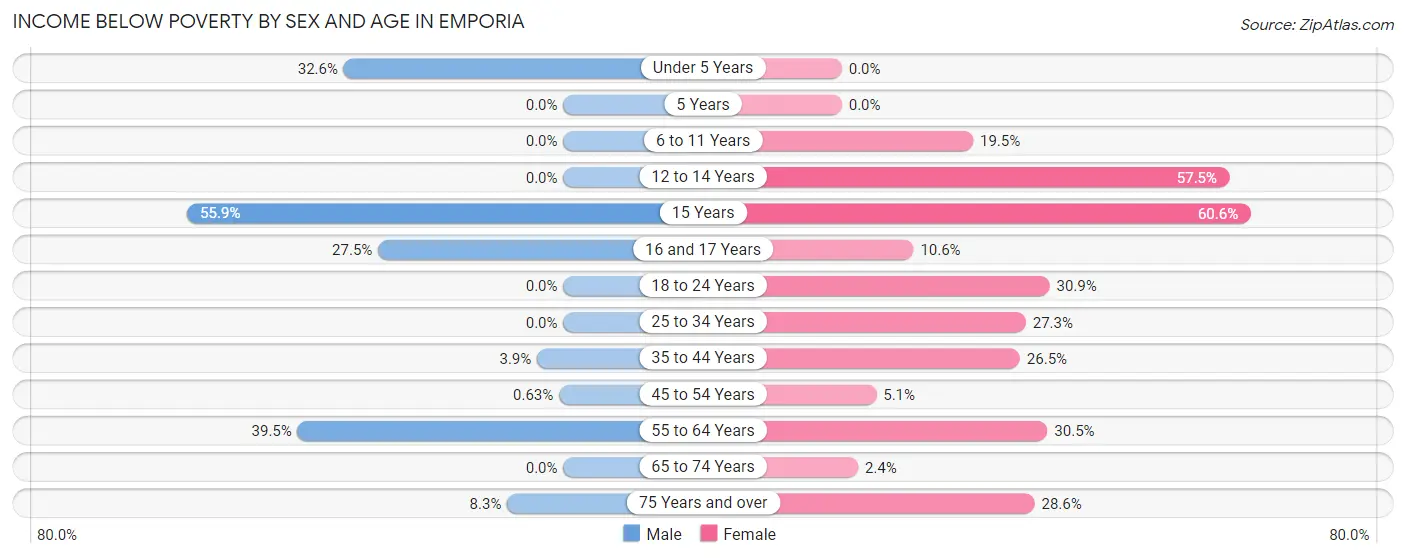
| Age Bracket | Male | Female |
| Under 5 Years | 59 (32.6%) | 0 (0.0%) |
| 5 Years | 0 (0.0%) | 0 (0.0%) |
| 6 to 11 Years | 0 (0.0%) | 53 (19.5%) |
| 12 to 14 Years | 0 (0.0%) | 50 (57.5%) |
| 15 Years | 19 (55.9%) | 20 (60.6%) |
| 16 and 17 Years | 55 (27.5%) | 5 (10.6%) |
| 18 to 24 Years | 0 (0.0%) | 91 (30.8%) |
| 25 to 34 Years | 0 (0.0%) | 100 (27.3%) |
| 35 to 44 Years | 11 (3.9%) | 132 (26.5%) |
| 45 to 54 Years | 2 (0.6%) | 17 (5.1%) |
| 55 to 64 Years | 118 (39.5%) | 109 (30.5%) |
| 65 to 74 Years | 0 (0.0%) | 7 (2.4%) |
| 75 Years and over | 10 (8.3%) | 81 (28.6%) |
| Total | 274 (11.3%) | 665 (22.2%) |
Income Above Poverty by Sex and Age in Emporia
According to the poverty statistics in Emporia, males aged 5 years and females aged under 5 years are the age groups that are most secure financially, with 100.0% of males and 100.0% of females in these age groups living above the poverty line.
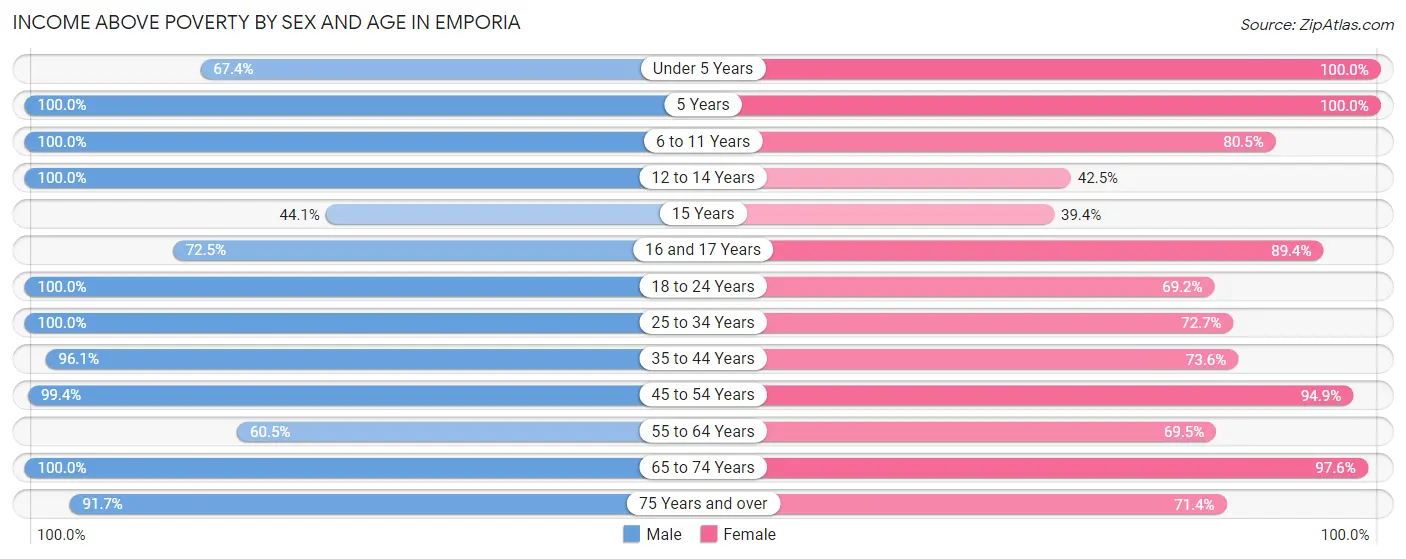
| Age Bracket | Male | Female |
| Under 5 Years | 122 (67.4%) | 121 (100.0%) |
| 5 Years | 40 (100.0%) | 7 (100.0%) |
| 6 to 11 Years | 238 (100.0%) | 219 (80.5%) |
| 12 to 14 Years | 205 (100.0%) | 37 (42.5%) |
| 15 Years | 15 (44.1%) | 13 (39.4%) |
| 16 and 17 Years | 145 (72.5%) | 42 (89.4%) |
| 18 to 24 Years | 57 (100.0%) | 204 (69.2%) |
| 25 to 34 Years | 275 (100.0%) | 266 (72.7%) |
| 35 to 44 Years | 271 (96.1%) | 367 (73.6%) |
| 45 to 54 Years | 315 (99.4%) | 315 (94.9%) |
| 55 to 64 Years | 181 (60.5%) | 248 (69.5%) |
| 65 to 74 Years | 182 (100.0%) | 284 (97.6%) |
| 75 Years and over | 110 (91.7%) | 202 (71.4%) |
| Total | 2,156 (88.7%) | 2,325 (77.8%) |
Income Below Poverty Among Married-Couple Families in Emporia
The poverty statistics for married-couple families in Emporia show that 1.3% or 7 of the total 550 families live below the poverty line. Families with no children have the highest poverty rate of 2.1%, comprising of 7 families. On the other hand, families with 1 or 2 children have the lowest poverty rate of 0.0%, which includes 0 families.
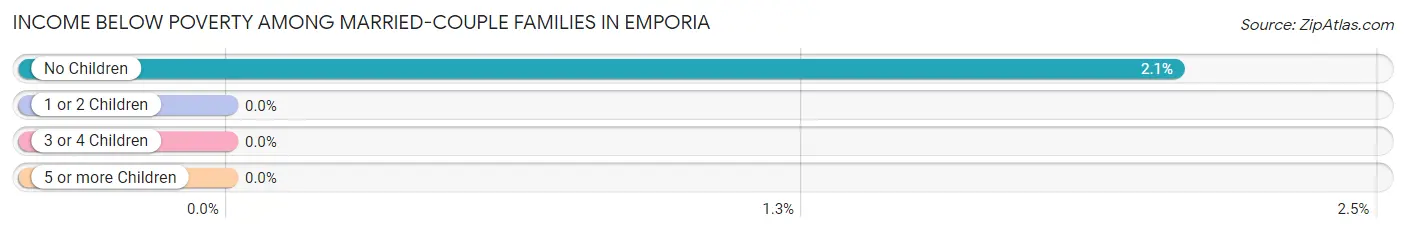
| Children | Above Poverty | Below Poverty |
| No Children | 332 (97.9%) | 7 (2.1%) |
| 1 or 2 Children | 115 (100.0%) | 0 (0.0%) |
| 3 or 4 Children | 96 (100.0%) | 0 (0.0%) |
| 5 or more Children | 0 (0.0%) | 0 (0.0%) |
| Total | 543 (98.7%) | 7 (1.3%) |
Income Below Poverty Among Single-Parent Households in Emporia
According to the poverty data in Emporia, 4.6% or 7 single-father households and 22.3% or 152 single-mother households are living below the poverty line. Among single-father households, those with no children have the highest poverty rate, with 7 households (7.4%) experiencing poverty. Likewise, among single-mother households, those with 3 or 4 children have the highest poverty rate, with 73 households (100.0%) falling below the poverty line.
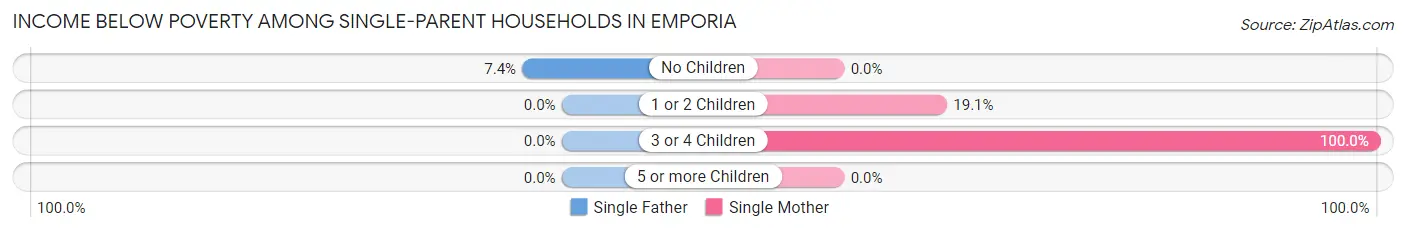
| Children | Single Father | Single Mother |
| No Children | 7 (7.4%) | 0 (0.0%) |
| 1 or 2 Children | 0 (0.0%) | 79 (19.1%) |
| 3 or 4 Children | 0 (0.0%) | 73 (100.0%) |
| 5 or more Children | 0 (0.0%) | 0 (0.0%) |
| Total | 7 (4.6%) | 152 (22.3%) |
Income Below Poverty Among Married-Couple vs Single-Parent Households in Emporia
The poverty data for Emporia shows that 7 of the married-couple family households (1.3%) and 159 of the single-parent households (19.1%) are living below the poverty level. Within the married-couple family households, those with no children have the highest poverty rate, with 7 households (2.1%) falling below the poverty line. Among the single-parent households, those with 3 or 4 children have the highest poverty rate, with 73 household (100.0%) living below poverty.
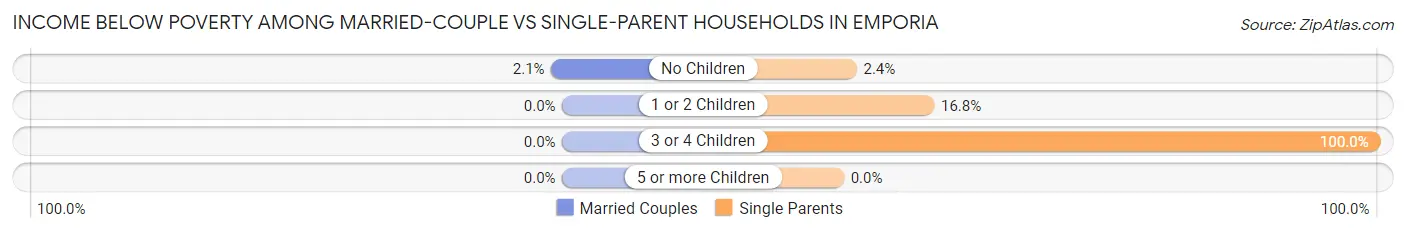
| Children | Married-Couple Families | Single-Parent Households |
| No Children | 7 (2.1%) | 7 (2.4%) |
| 1 or 2 Children | 0 (0.0%) | 79 (16.8%) |
| 3 or 4 Children | 0 (0.0%) | 73 (100.0%) |
| 5 or more Children | 0 (0.0%) | 0 (0.0%) |
| Total | 7 (1.3%) | 159 (19.1%) |
Race in Emporia
The most populous races in Emporia are Black / African American (3,440 | 60.6%), White / Caucasian (1,400 | 24.6%), and Two or more Races (796 | 14.0%).
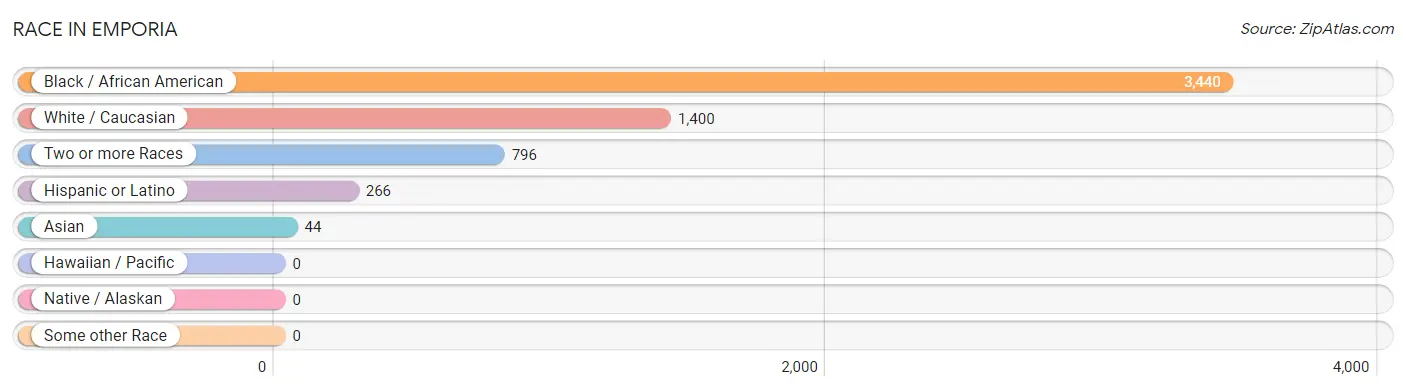
| Race | # Population | % Population |
| Asian | 44 | 0.8% |
| Black / African American | 3,440 | 60.6% |
| Hawaiian / Pacific | 0 | 0.0% |
| Hispanic or Latino | 266 | 4.7% |
| Native / Alaskan | 0 | 0.0% |
| White / Caucasian | 1,400 | 24.6% |
| Two or more Races | 796 | 14.0% |
| Some other Race | 0 | 0.0% |
| Total | 5,680 | 100.0% |
Ancestry in Emporia
The most populous ancestries reported in Emporia are Subsaharan African (1,292 | 22.8%), African (1,232 | 21.7%), English (447 | 7.9%), American (295 | 5.2%), and German (101 | 1.8%), together accounting for 59.3% of all Emporia residents.
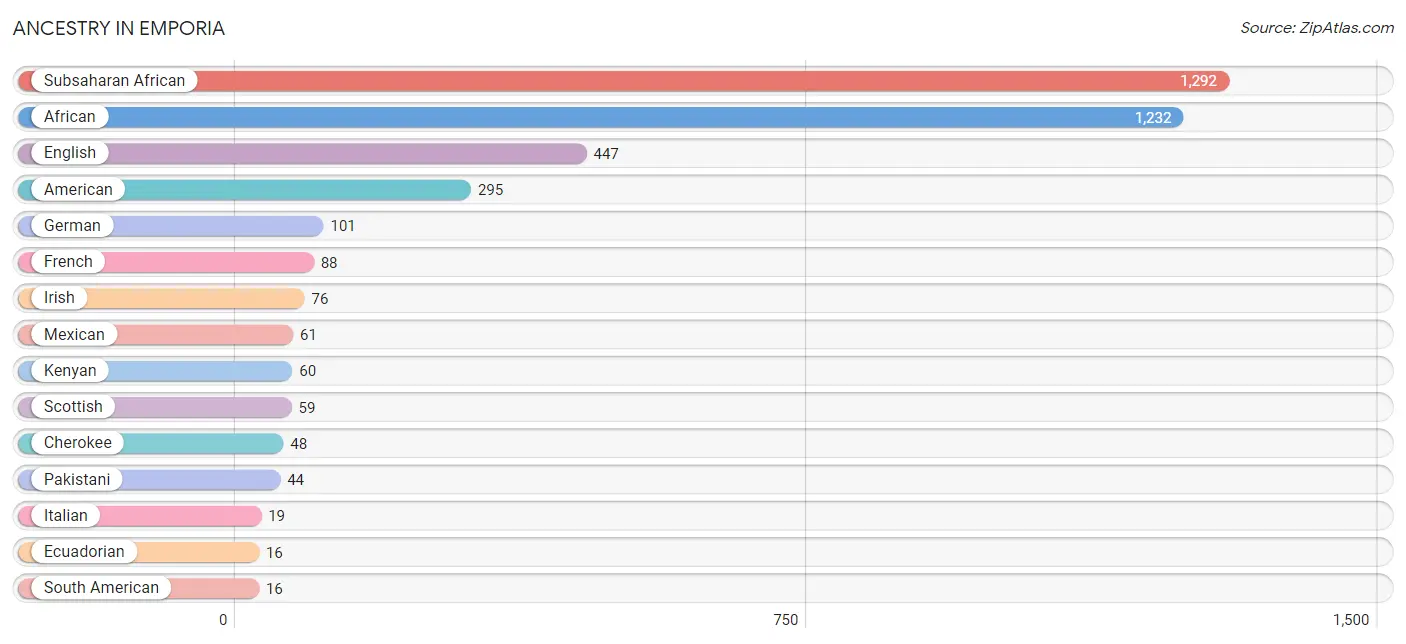
| Ancestry | # Population | % Population |
| African | 1,232 | 21.7% |
| American | 295 | 5.2% |
| Arab | 2 | 0.0% |
| Austrian | 8 | 0.1% |
| Cherokee | 48 | 0.9% |
| Danish | 9 | 0.2% |
| Eastern European | 7 | 0.1% |
| Ecuadorian | 16 | 0.3% |
| English | 447 | 7.9% |
| European | 6 | 0.1% |
| French | 88 | 1.5% |
| German | 101 | 1.8% |
| Hungarian | 2 | 0.0% |
| Iraqi | 2 | 0.0% |
| Irish | 76 | 1.3% |
| Italian | 19 | 0.3% |
| Kenyan | 60 | 1.1% |
| Mexican | 61 | 1.1% |
| Pakistani | 44 | 0.8% |
| Polish | 10 | 0.2% |
| Scottish | 59 | 1.0% |
| Slavic | 9 | 0.2% |
| South American | 16 | 0.3% |
| Subsaharan African | 1,292 | 22.8% |
| Swedish | 5 | 0.1% | View All 25 Rows |
Immigrants in Emporia
The most numerous immigrant groups reported in Emporia came from Central America (64 | 1.1%), Latin America (64 | 1.1%), Mexico (64 | 1.1%), Africa (60 | 1.1%), and Eastern Africa (60 | 1.1%), together accounting for 5.5% of all Emporia residents.
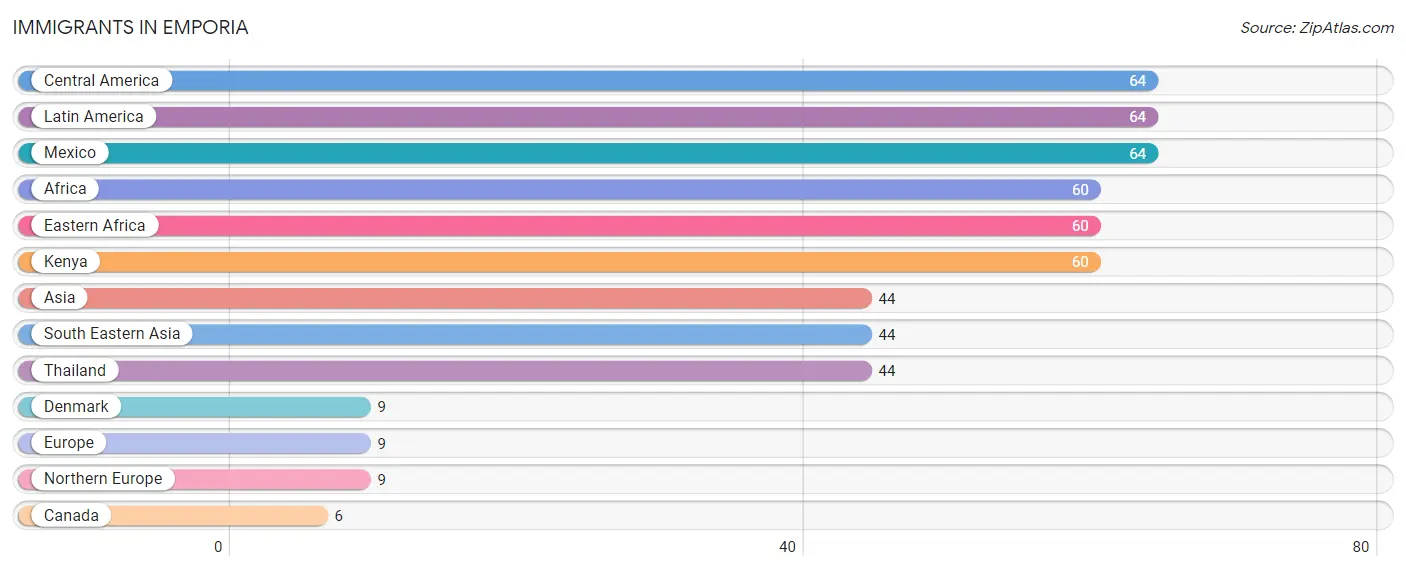
| Immigration Origin | # Population | % Population |
| Africa | 60 | 1.1% |
| Asia | 44 | 0.8% |
| Canada | 6 | 0.1% |
| Central America | 64 | 1.1% |
| Denmark | 9 | 0.2% |
| Eastern Africa | 60 | 1.1% |
| Europe | 9 | 0.2% |
| Kenya | 60 | 1.1% |
| Latin America | 64 | 1.1% |
| Mexico | 64 | 1.1% |
| Northern Europe | 9 | 0.2% |
| South Eastern Asia | 44 | 0.8% |
| Thailand | 44 | 0.8% | View All 13 Rows |
Sex and Age in Emporia
Sex and Age in Emporia
The most populous age groups in Emporia are 10 to 14 Years (254 | 10.0%) for men and 40 to 44 Years (288 | 9.1%) for women.
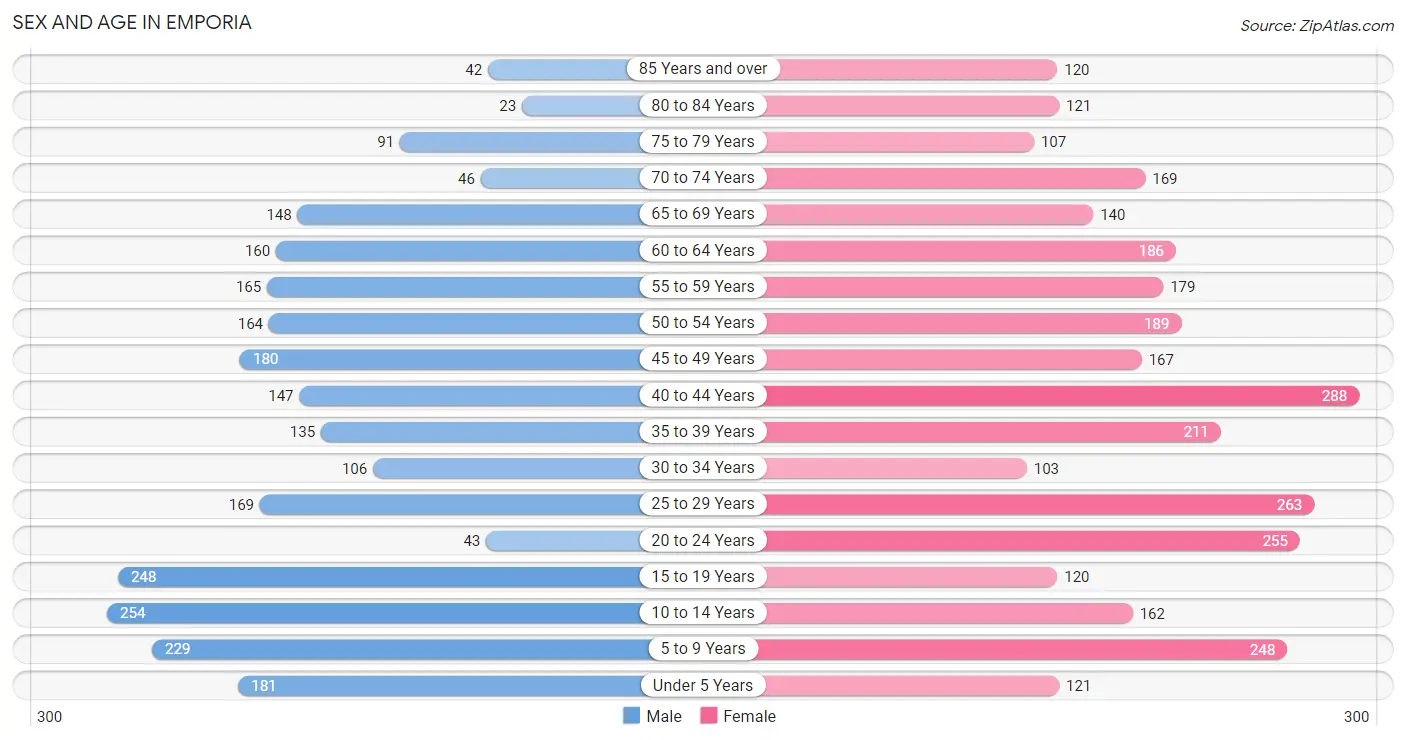
| Age Bracket | Male | Female |
| Under 5 Years | 181 (7.1%) | 121 (3.8%) |
| 5 to 9 Years | 229 (9.0%) | 248 (7.9%) |
| 10 to 14 Years | 254 (10.0%) | 162 (5.1%) |
| 15 to 19 Years | 248 (9.8%) | 120 (3.8%) |
| 20 to 24 Years | 43 (1.7%) | 255 (8.1%) |
| 25 to 29 Years | 169 (6.7%) | 263 (8.4%) |
| 30 to 34 Years | 106 (4.2%) | 103 (3.3%) |
| 35 to 39 Years | 135 (5.3%) | 211 (6.7%) |
| 40 to 44 Years | 147 (5.8%) | 288 (9.1%) |
| 45 to 49 Years | 180 (7.1%) | 167 (5.3%) |
| 50 to 54 Years | 164 (6.5%) | 189 (6.0%) |
| 55 to 59 Years | 165 (6.5%) | 179 (5.7%) |
| 60 to 64 Years | 160 (6.3%) | 186 (5.9%) |
| 65 to 69 Years | 148 (5.9%) | 140 (4.4%) |
| 70 to 74 Years | 46 (1.8%) | 169 (5.4%) |
| 75 to 79 Years | 91 (3.6%) | 107 (3.4%) |
| 80 to 84 Years | 23 (0.9%) | 121 (3.8%) |
| 85 Years and over | 42 (1.7%) | 120 (3.8%) |
| Total | 2,531 (100.0%) | 3,149 (100.0%) |
Families and Households in Emporia
Median Family Size in Emporia
The median family size in Emporia is 3.00 persons per family, with married-couple families (550 | 39.7%) accounting for the largest median family size of 3.38 persons per family. On the other hand, single female/mother families (683 | 49.3%) represent the smallest median family size with 2.74 persons per family.
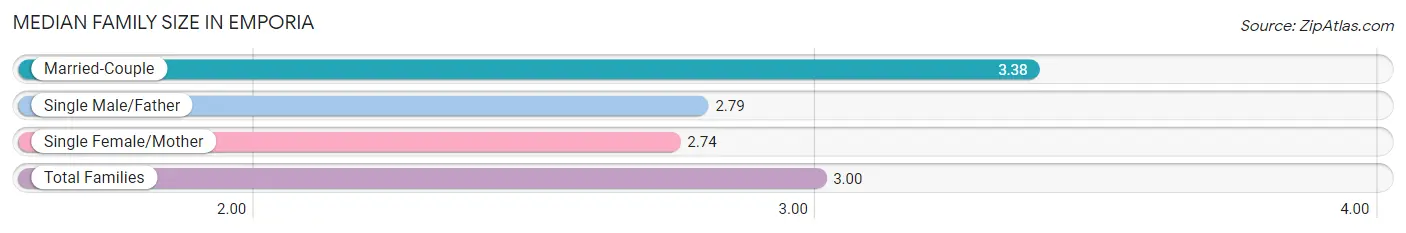
| Family Type | # Families | Family Size |
| Married-Couple | 550 (39.7%) | 3.38 |
| Single Male/Father | 151 (10.9%) | 2.79 |
| Single Female/Mother | 683 (49.3%) | 2.74 |
| Total Families | 1,384 (100.0%) | 3.00 |
Median Household Size in Emporia
The median household size in Emporia is 2.43 persons per household, with single male/father households (151 | 6.7%) accounting for the largest median household size of 4.25 persons per household. non-family households (861 | 38.4%) represent the smallest median household size with 1.09 persons per household.
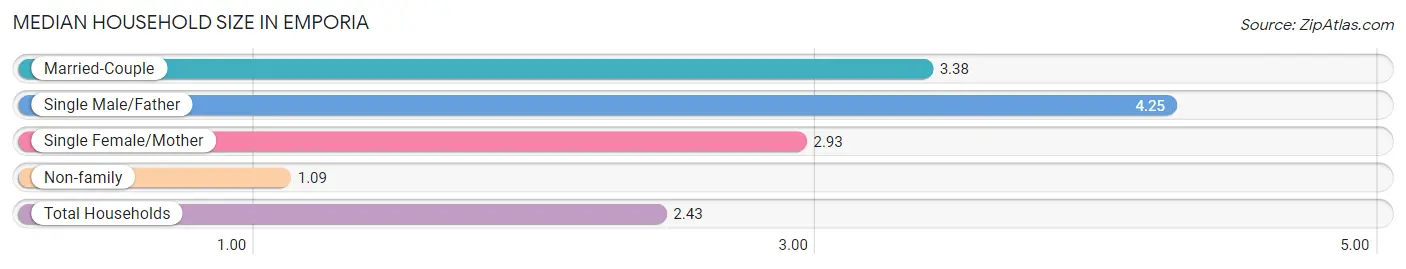
| Household Type | # Households | Household Size |
| Married-Couple | 550 (24.5%) | 3.38 |
| Single Male/Father | 151 (6.7%) | 4.25 |
| Single Female/Mother | 683 (30.4%) | 2.93 |
| Non-family | 861 (38.4%) | 1.09 |
| Total Households | 2,245 (100.0%) | 2.43 |
Household Size by Marriage Status in Emporia
Out of a total of 2,245 households in Emporia, 1,384 (61.7%) are family households, while 861 (38.4%) are nonfamily households. The most numerous type of family households are 2-person households, comprising 693, and the most common type of nonfamily households are 1-person households, comprising 767.
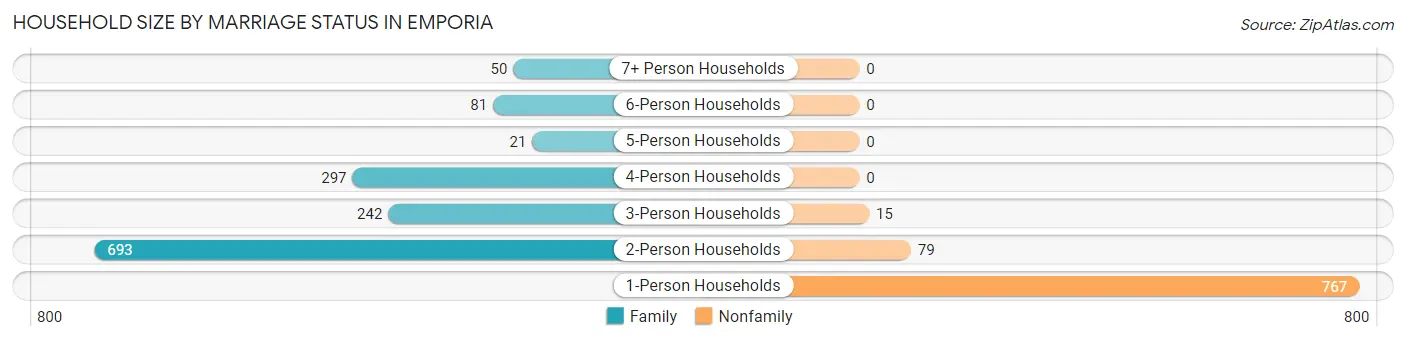
| Household Size | Family Households | Nonfamily Households |
| 1-Person Households | - | 767 (34.2%) |
| 2-Person Households | 693 (30.9%) | 79 (3.5%) |
| 3-Person Households | 242 (10.8%) | 15 (0.7%) |
| 4-Person Households | 297 (13.2%) | 0 (0.0%) |
| 5-Person Households | 21 (0.9%) | 0 (0.0%) |
| 6-Person Households | 81 (3.6%) | 0 (0.0%) |
| 7+ Person Households | 50 (2.2%) | 0 (0.0%) |
| Total | 1,384 (61.7%) | 861 (38.4%) |
Female Fertility in Emporia
Fertility by Age in Emporia
Average fertility rate in Emporia is 63.0 births per 1,000 women. Women in the age bracket of 15 to 19 years have the highest fertility rate with 300.0 births per 1,000 women. Women in the age bracket of 20 to 34 years acount for 60.0% of all women with births.
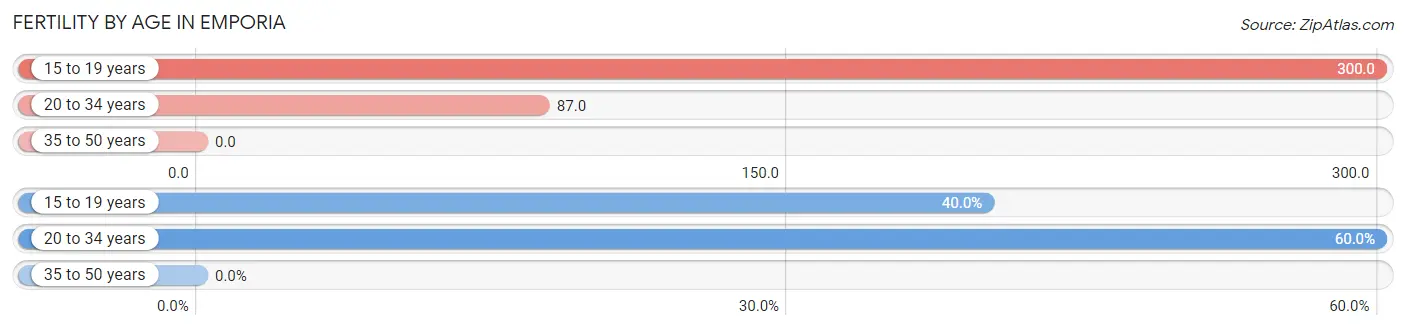
| Age Bracket | Women with Births | Births / 1,000 Women |
| 15 to 19 years | 36 (40.0%) | 300.0 |
| 20 to 34 years | 54 (60.0%) | 87.0 |
| 35 to 50 years | 0 (0.0%) | 0.0 |
| Total | 90 (100.0%) | 63.0 |
Fertility by Age by Marriage Status in Emporia
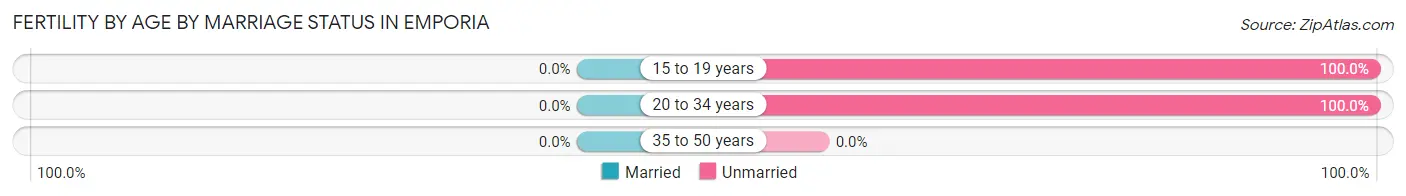
| Age Bracket | Married | Unmarried |
| 15 to 19 years | 0 (0.0%) | 36 (100.0%) |
| 20 to 34 years | 0 (0.0%) | 54 (100.0%) |
| 35 to 50 years | 0 (0.0%) | 0 (0.0%) |
| Total | 0 (0.0%) | 90 (100.0%) |
Fertility by Education in Emporia
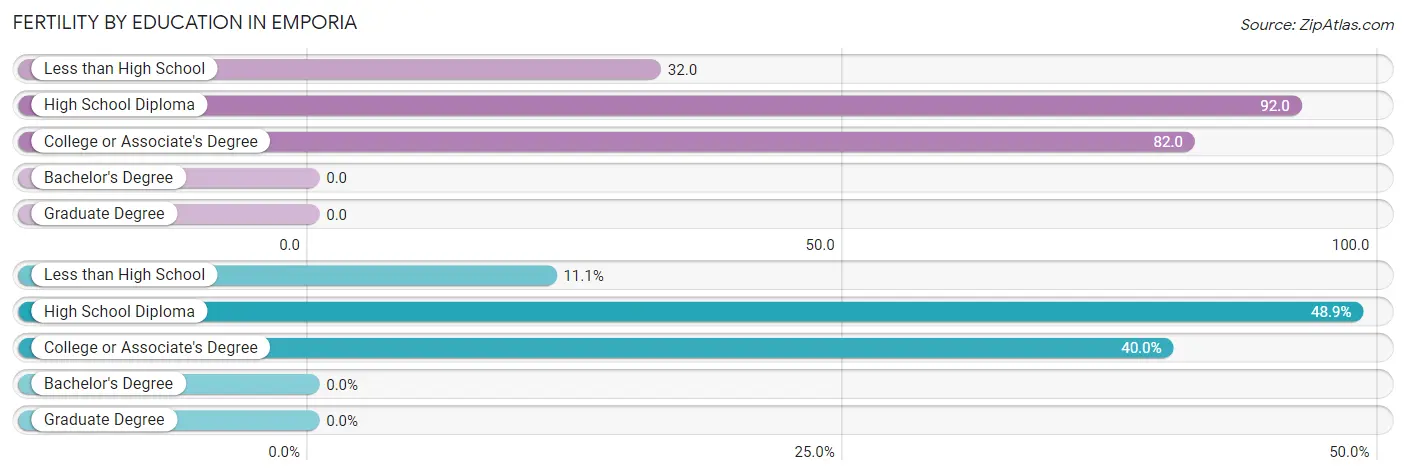
| Educational Attainment | Women with Births | Births / 1,000 Women |
| Less than High School | 10 (11.1%) | 32.0 |
| High School Diploma | 44 (48.9%) | 92.0 |
| College or Associate's Degree | 36 (40.0%) | 82.0 |
| Bachelor's Degree | 0 (0.0%) | 0.0 |
| Graduate Degree | 0 (0.0%) | 0.0 |
| Total | 90 (100.0%) | 63.0 |
Fertility by Education by Marriage Status in Emporia
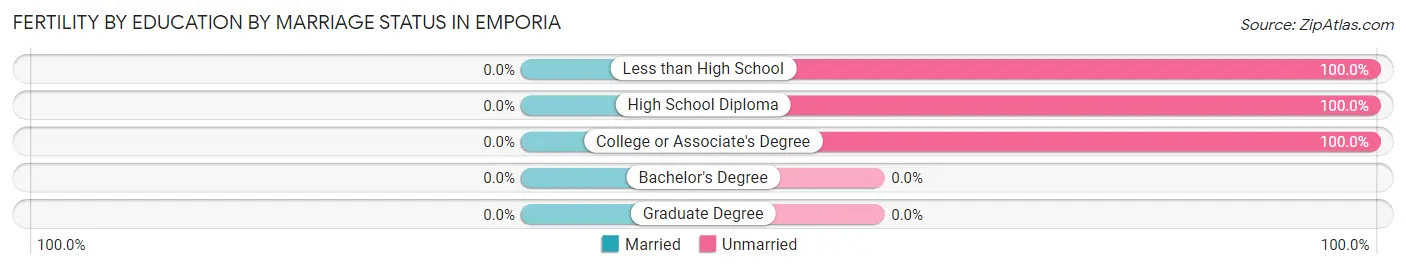
| Educational Attainment | Married | Unmarried |
| Less than High School | 0 (0.0%) | 10 (100.0%) |
| High School Diploma | 0 (0.0%) | 44 (100.0%) |
| College or Associate's Degree | 0 (0.0%) | 36 (100.0%) |
| Bachelor's Degree | 0 (0.0%) | 0 (0.0%) |
| Graduate Degree | 0 (0.0%) | 0 (0.0%) |
| Total | 0 (0.0%) | 90 (100.0%) |
Employment Characteristics in Emporia
Employment by Class of Employer in Emporia
Among the 2,176 employed individuals in Emporia, private company employees (1,691 | 77.7%), local government employees (150 | 6.9%), and state government employees (104 | 4.8%) make up the most common classes of employment.
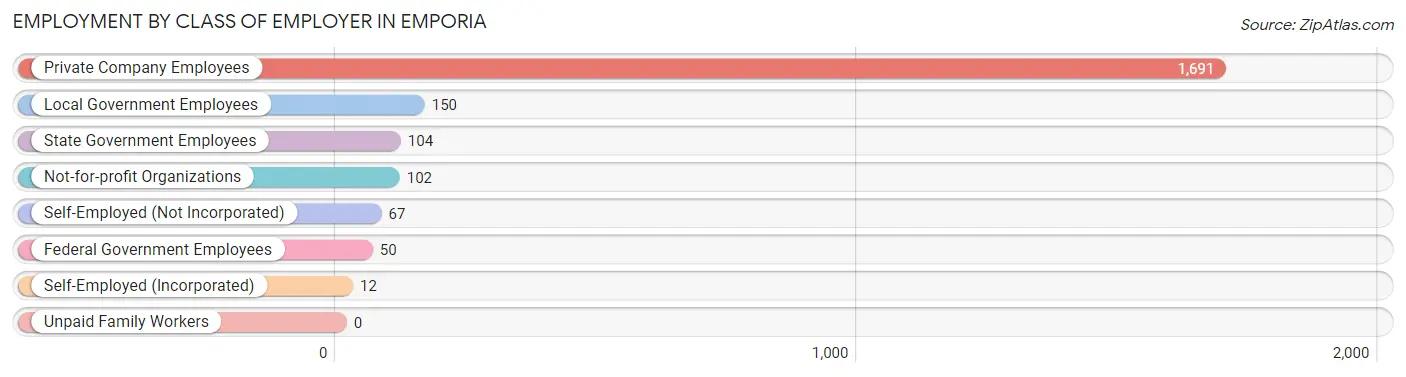
| Employer Class | # Employees | % Employees |
| Private Company Employees | 1,691 | 77.7% |
| Self-Employed (Incorporated) | 12 | 0.5% |
| Self-Employed (Not Incorporated) | 67 | 3.1% |
| Not-for-profit Organizations | 102 | 4.7% |
| Local Government Employees | 150 | 6.9% |
| State Government Employees | 104 | 4.8% |
| Federal Government Employees | 50 | 2.3% |
| Unpaid Family Workers | 0 | 0.0% |
| Total | 2,176 | 100.0% |
Employment Status by Age in Emporia
According to the labor force statistics for Emporia, out of the total population over 16 years of age (4,418), 53.2% or 2,350 individuals are in the labor force, with 7.0% or 165 of them unemployed. The age group with the highest labor force participation rate is 35 to 44 years, with 83.4% or 651 individuals in the labor force. Within the labor force, the 55 to 59 years age range has the highest percentage of unemployed individuals, with 16.7% or 37 of them being unemployed.
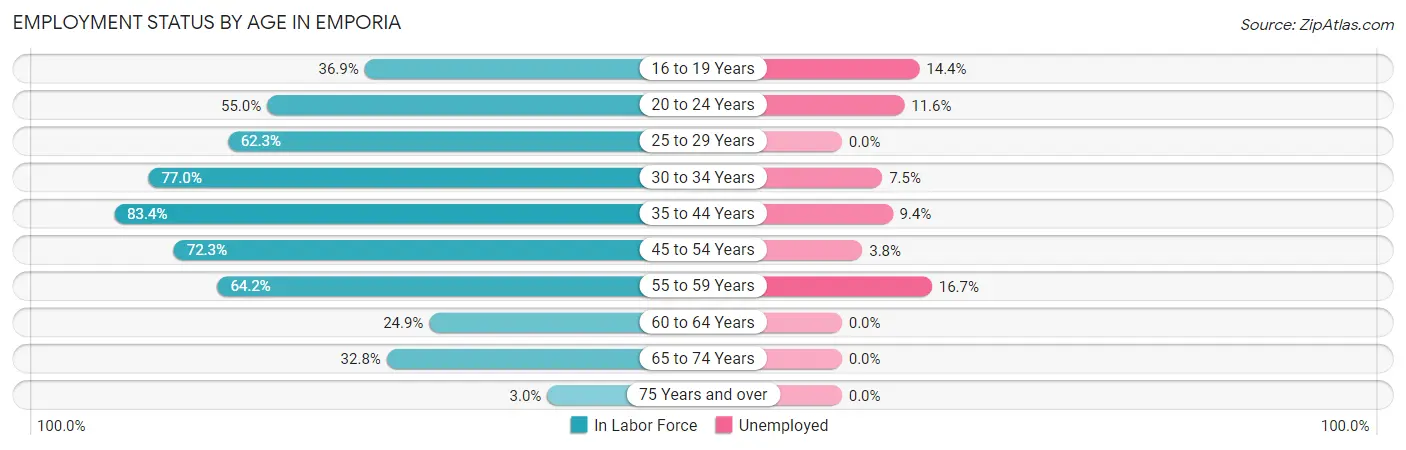
| Age Bracket | In Labor Force | Unemployed |
| 16 to 19 Years | 111 (36.9%) | 16 (14.4%) |
| 20 to 24 Years | 164 (55.0%) | 19 (11.6%) |
| 25 to 29 Years | 269 (62.3%) | 0 (0.0%) |
| 30 to 34 Years | 161 (77.0%) | 12 (7.5%) |
| 35 to 44 Years | 651 (83.4%) | 61 (9.4%) |
| 45 to 54 Years | 506 (72.3%) | 19 (3.8%) |
| 55 to 59 Years | 221 (64.2%) | 37 (16.7%) |
| 60 to 64 Years | 86 (24.9%) | 0 (0.0%) |
| 65 to 74 Years | 165 (32.8%) | 0 (0.0%) |
| 75 Years and over | 15 (3.0%) | 0 (0.0%) |
| Total | 2,350 (53.2%) | 164 (7.0%) |
Employment Status by Educational Attainment in Emporia
According to labor force statistics for Emporia, 67.4% of individuals (1,895) out of the total population between 25 and 64 years of age (2,812) are in the labor force, with 6.8% or 129 of them being unemployed. The group with the highest labor force participation rate are those with the educational attainment of bachelor's degree or higher, with 82.7% or 422 individuals in the labor force. Within the labor force, individuals with high school diploma education have the highest percentage of unemployment, with 11.6% or 80 of them being unemployed.
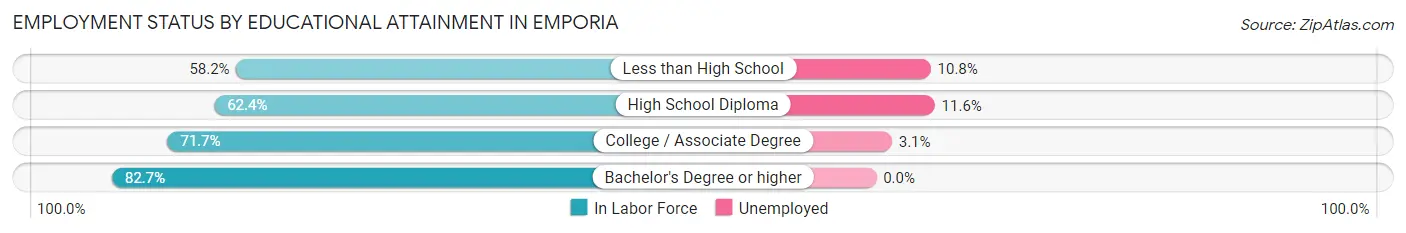
| Educational Attainment | In Labor Force | Unemployed |
| Less than High School | 324 (58.2%) | 60 (10.8%) |
| High School Diploma | 690 (62.4%) | 128 (11.6%) |
| College / Associate Degree | 458 (71.7%) | 20 (3.1%) |
| Bachelor's Degree or higher | 422 (82.7%) | 0 (0.0%) |
| Total | 1,895 (67.4%) | 191 (6.8%) |
Employment Occupations by Sex in Emporia
Management, Business, Science and Arts Occupations
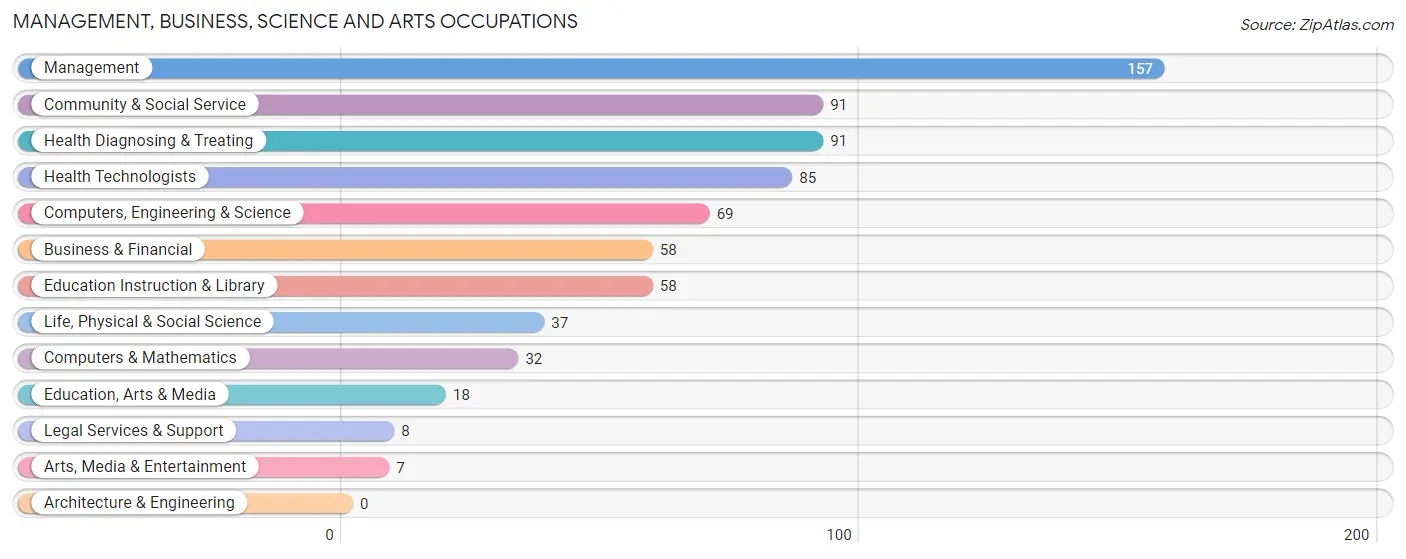
The most common Management, Business, Science and Arts occupations in Emporia are Management (157 | 7.2%), Community & Social Service (91 | 4.2%), Health Diagnosing & Treating (91 | 4.2%), Health Technologists (85 | 3.9%), and Computers, Engineering & Science (69 | 3.2%).
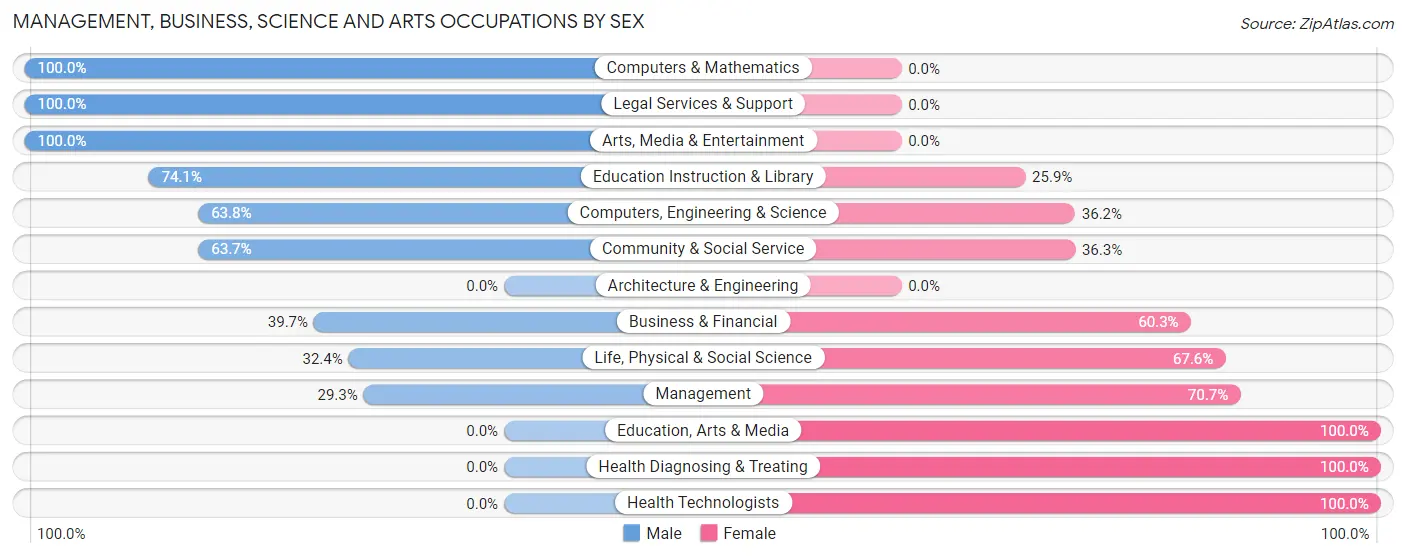
Management, Business, Science and Arts Occupations by Sex
Within the Management, Business, Science and Arts occupations in Emporia, the most male-oriented occupations are Computers & Mathematics (100.0%), Legal Services & Support (100.0%), and Arts, Media & Entertainment (100.0%), while the most female-oriented occupations are Education, Arts & Media (100.0%), Health Diagnosing & Treating (100.0%), and Health Technologists (100.0%).
| Occupation | Male | Female |
| Management | 46 (29.3%) | 111 (70.7%) |
| Business & Financial | 23 (39.7%) | 35 (60.3%) |
| Computers, Engineering & Science | 44 (63.8%) | 25 (36.2%) |
| Computers & Mathematics | 32 (100.0%) | 0 (0.0%) |
| Architecture & Engineering | 0 (0.0%) | 0 (0.0%) |
| Life, Physical & Social Science | 12 (32.4%) | 25 (67.6%) |
| Community & Social Service | 58 (63.7%) | 33 (36.3%) |
| Education, Arts & Media | 0 (0.0%) | 18 (100.0%) |
| Legal Services & Support | 8 (100.0%) | 0 (0.0%) |
| Education Instruction & Library | 43 (74.1%) | 15 (25.9%) |
| Arts, Media & Entertainment | 7 (100.0%) | 0 (0.0%) |
| Health Diagnosing & Treating | 0 (0.0%) | 91 (100.0%) |
| Health Technologists | 0 (0.0%) | 85 (100.0%) |
| Total (Category) | 171 (36.7%) | 295 (63.3%) |
| Total (Overall) | 1,032 (47.2%) | 1,153 (52.8%) |
Services Occupations
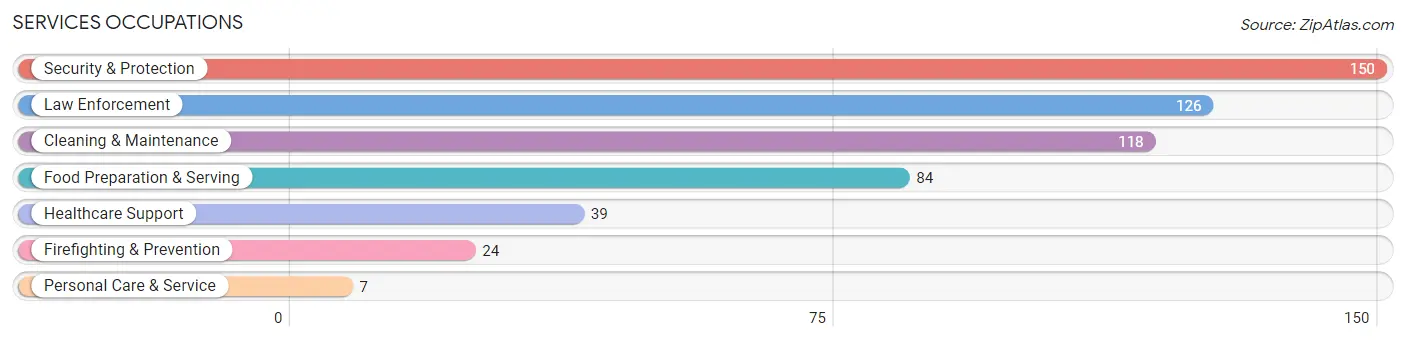
The most common Services occupations in Emporia are Security & Protection (150 | 6.9%), Law Enforcement (126 | 5.8%), Cleaning & Maintenance (118 | 5.4%), Food Preparation & Serving (84 | 3.8%), and Healthcare Support (39 | 1.8%).
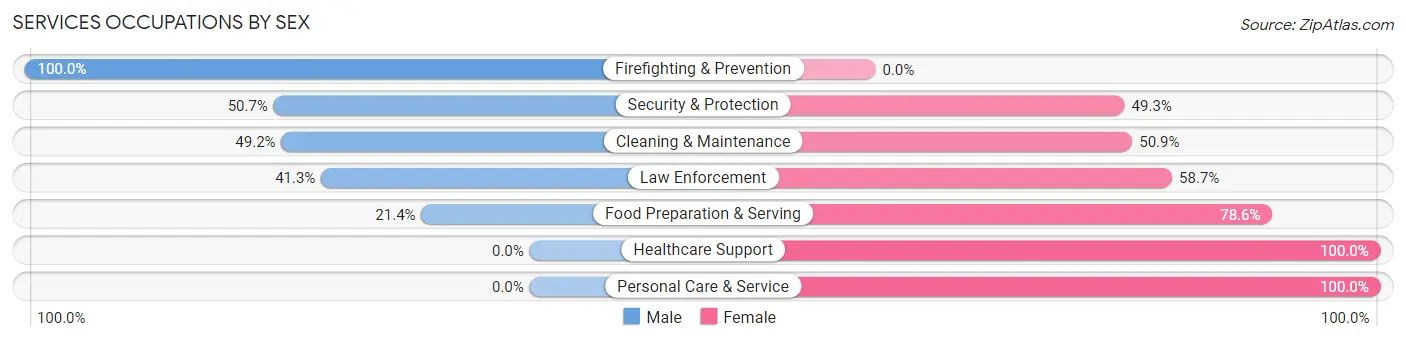
Services Occupations by Sex
Within the Services occupations in Emporia, the most male-oriented occupations are Firefighting & Prevention (100.0%), Security & Protection (50.7%), and Cleaning & Maintenance (49.1%), while the most female-oriented occupations are Healthcare Support (100.0%), Personal Care & Service (100.0%), and Food Preparation & Serving (78.6%).
| Occupation | Male | Female |
| Healthcare Support | 0 (0.0%) | 39 (100.0%) |
| Security & Protection | 76 (50.7%) | 74 (49.3%) |
| Firefighting & Prevention | 24 (100.0%) | 0 (0.0%) |
| Law Enforcement | 52 (41.3%) | 74 (58.7%) |
| Food Preparation & Serving | 18 (21.4%) | 66 (78.6%) |
| Cleaning & Maintenance | 58 (49.1%) | 60 (50.8%) |
| Personal Care & Service | 0 (0.0%) | 7 (100.0%) |
| Total (Category) | 152 (38.2%) | 246 (61.8%) |
| Total (Overall) | 1,032 (47.2%) | 1,153 (52.8%) |
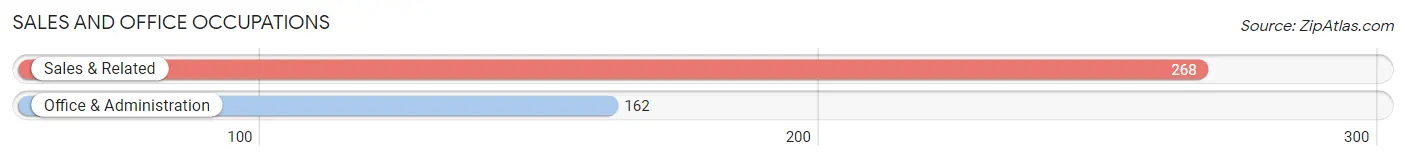
Sales and Office Occupations
The most common Sales and Office occupations in Emporia are Sales & Related (268 | 12.3%), and Office & Administration (162 | 7.4%).
Sales and Office Occupations by Sex

| Occupation | Male | Female |
| Sales & Related | 45 (16.8%) | 223 (83.2%) |
| Office & Administration | 17 (10.5%) | 145 (89.5%) |
| Total (Category) | 62 (14.4%) | 368 (85.6%) |
| Total (Overall) | 1,032 (47.2%) | 1,153 (52.8%) |
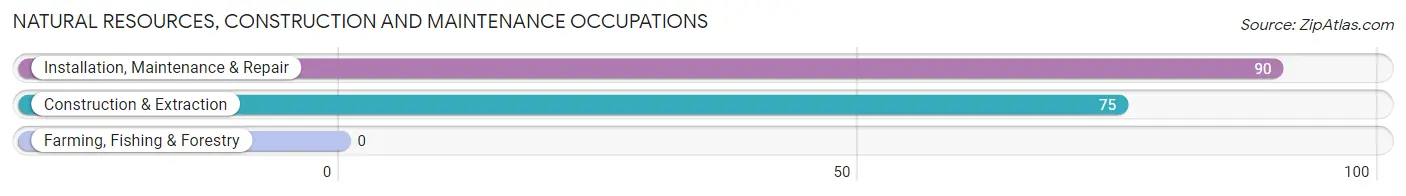
Natural Resources, Construction and Maintenance Occupations
The most common Natural Resources, Construction and Maintenance occupations in Emporia are Installation, Maintenance & Repair (90 | 4.1%), and Construction & Extraction (75 | 3.4%).
Natural Resources, Construction and Maintenance Occupations by Sex
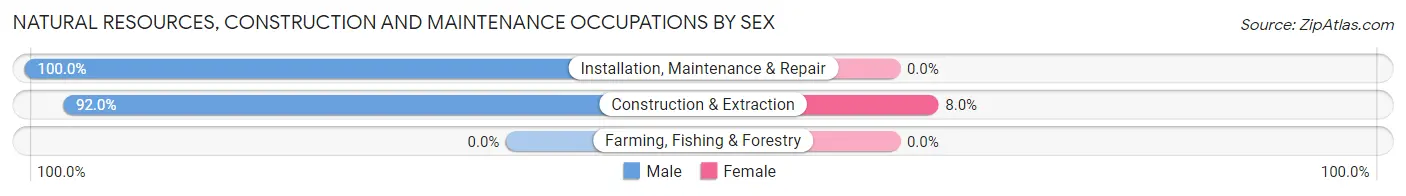
| Occupation | Male | Female |
| Farming, Fishing & Forestry | 0 (0.0%) | 0 (0.0%) |
| Construction & Extraction | 69 (92.0%) | 6 (8.0%) |
| Installation, Maintenance & Repair | 90 (100.0%) | 0 (0.0%) |
| Total (Category) | 159 (96.4%) | 6 (3.6%) |
| Total (Overall) | 1,032 (47.2%) | 1,153 (52.8%) |
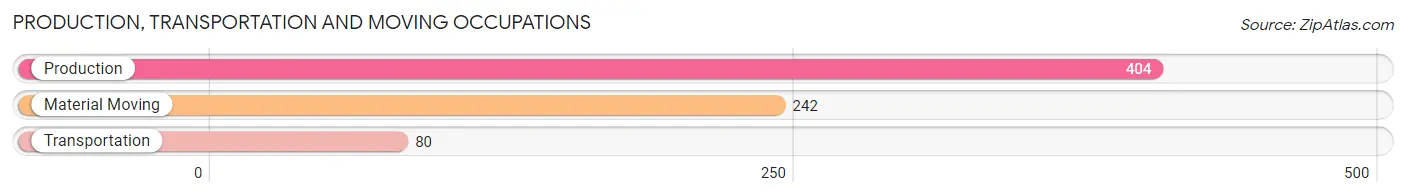
Production, Transportation and Moving Occupations
The most common Production, Transportation and Moving occupations in Emporia are Production (404 | 18.5%), Material Moving (242 | 11.1%), and Transportation (80 | 3.7%).
Production, Transportation and Moving Occupations by Sex
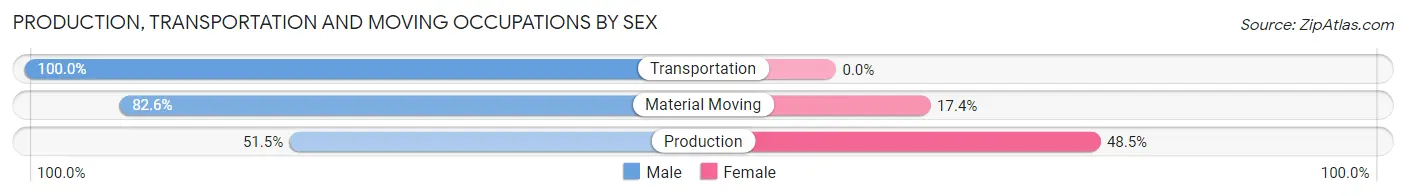
| Occupation | Male | Female |
| Production | 208 (51.5%) | 196 (48.5%) |
| Transportation | 80 (100.0%) | 0 (0.0%) |
| Material Moving | 200 (82.6%) | 42 (17.4%) |
| Total (Category) | 488 (67.2%) | 238 (32.8%) |
| Total (Overall) | 1,032 (47.2%) | 1,153 (52.8%) |
Employment Industries by Sex in Emporia
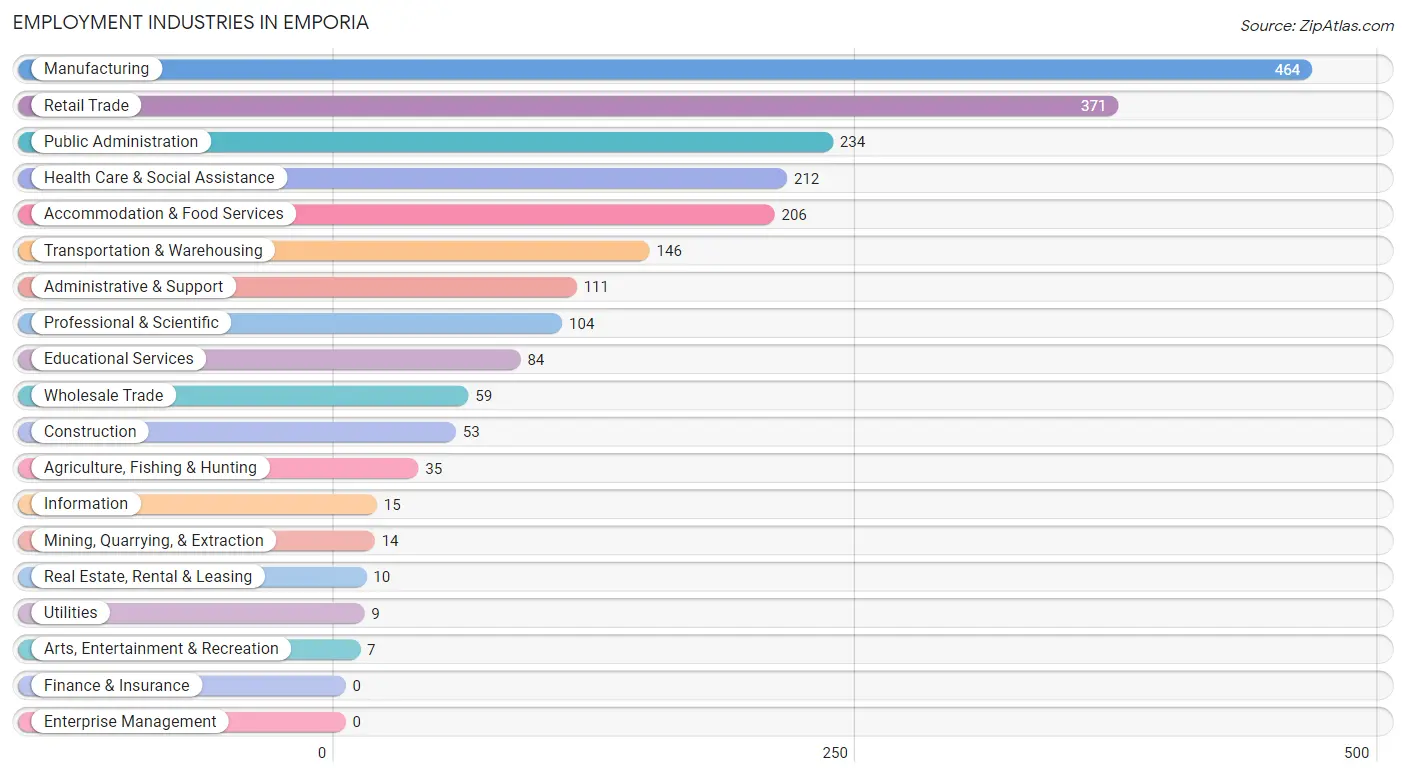
Employment Industries in Emporia
The major employment industries in Emporia include Manufacturing (464 | 21.2%), Retail Trade (371 | 17.0%), Public Administration (234 | 10.7%), Health Care & Social Assistance (212 | 9.7%), and Accommodation & Food Services (206 | 9.4%).
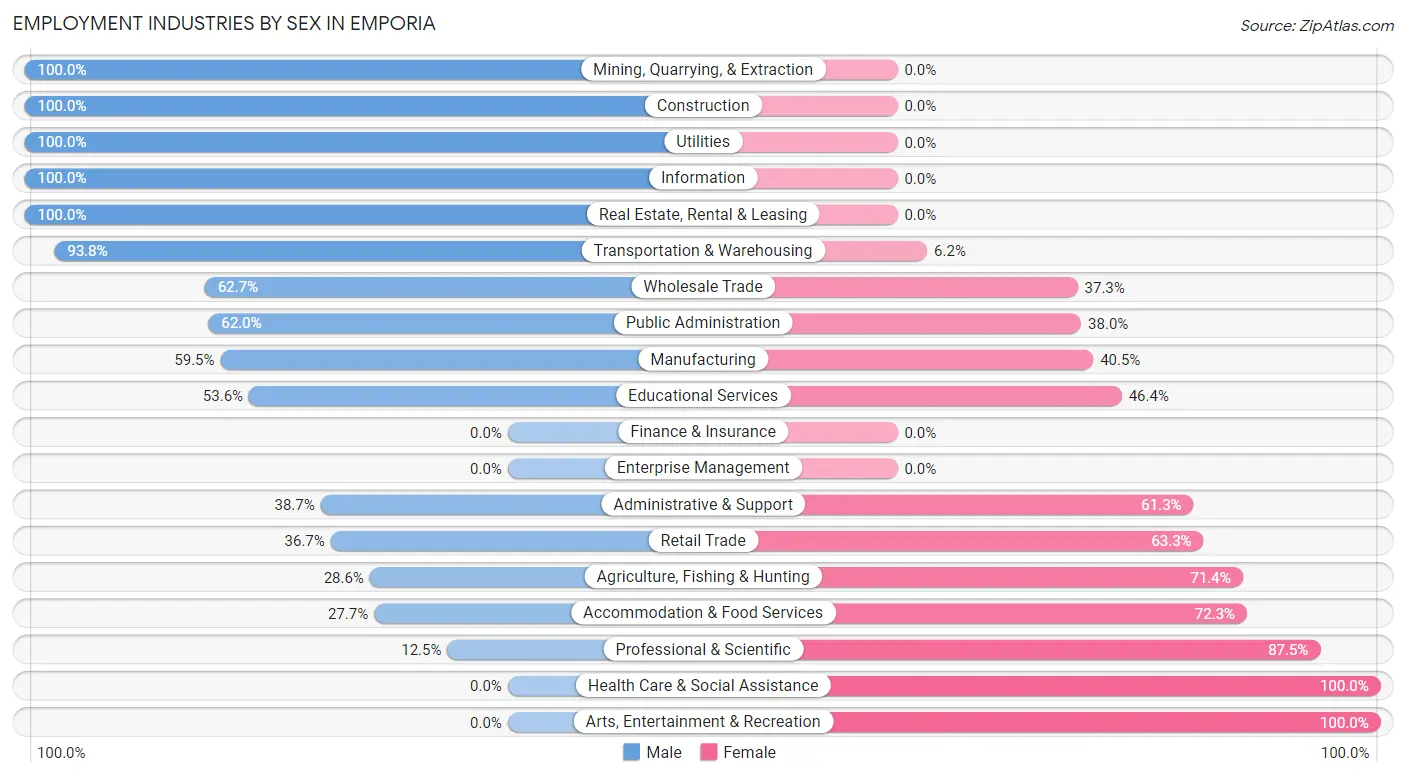
Employment Industries by Sex in Emporia
The Emporia industries that see more men than women are Mining, Quarrying, & Extraction (100.0%), Construction (100.0%), and Utilities (100.0%), whereas the industries that tend to have a higher number of women are Health Care & Social Assistance (100.0%), Arts, Entertainment & Recreation (100.0%), and Professional & Scientific (87.5%).
| Industry | Male | Female |
| Agriculture, Fishing & Hunting | 10 (28.6%) | 25 (71.4%) |
| Mining, Quarrying, & Extraction | 14 (100.0%) | 0 (0.0%) |
| Construction | 53 (100.0%) | 0 (0.0%) |
| Manufacturing | 276 (59.5%) | 188 (40.5%) |
| Wholesale Trade | 37 (62.7%) | 22 (37.3%) |
| Retail Trade | 136 (36.7%) | 235 (63.3%) |
| Transportation & Warehousing | 137 (93.8%) | 9 (6.2%) |
| Utilities | 9 (100.0%) | 0 (0.0%) |
| Information | 15 (100.0%) | 0 (0.0%) |
| Finance & Insurance | 0 (0.0%) | 0 (0.0%) |
| Real Estate, Rental & Leasing | 10 (100.0%) | 0 (0.0%) |
| Professional & Scientific | 13 (12.5%) | 91 (87.5%) |
| Enterprise Management | 0 (0.0%) | 0 (0.0%) |
| Administrative & Support | 43 (38.7%) | 68 (61.3%) |
| Educational Services | 45 (53.6%) | 39 (46.4%) |
| Health Care & Social Assistance | 0 (0.0%) | 212 (100.0%) |
| Arts, Entertainment & Recreation | 0 (0.0%) | 7 (100.0%) |
| Accommodation & Food Services | 57 (27.7%) | 149 (72.3%) |
| Public Administration | 145 (62.0%) | 89 (38.0%) |
| Total | 1,032 (47.2%) | 1,153 (52.8%) |
Education in Emporia
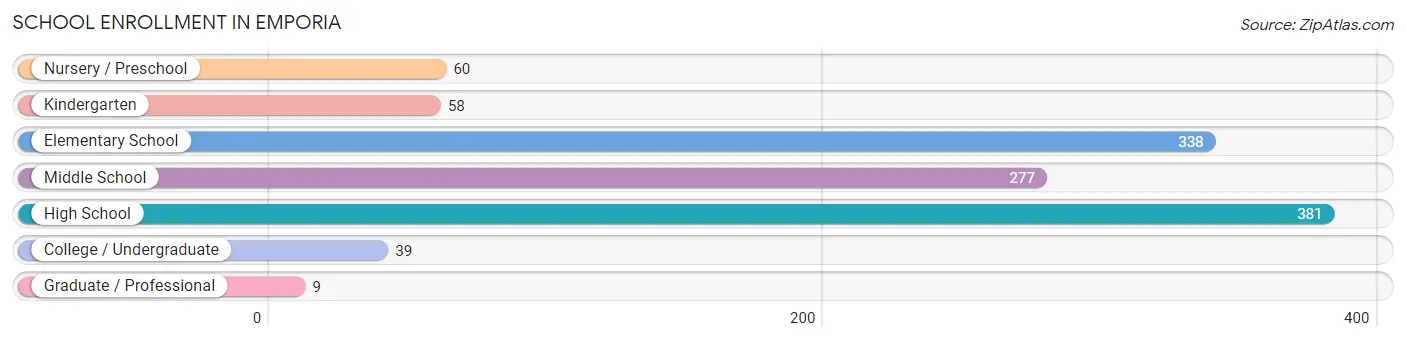
School Enrollment in Emporia
The most common levels of schooling among the 1,162 students in Emporia are high school (381 | 32.8%), elementary school (338 | 29.1%), and middle school (277 | 23.8%).
| School Level | # Students | % Students |
| Nursery / Preschool | 60 | 5.2% |
| Kindergarten | 58 | 5.0% |
| Elementary School | 338 | 29.1% |
| Middle School | 277 | 23.8% |
| High School | 381 | 32.8% |
| College / Undergraduate | 39 | 3.4% |
| Graduate / Professional | 9 | 0.8% |
| Total | 1,162 | 100.0% |
School Enrollment by Age by Funding Source in Emporia
Out of a total of 1,162 students who are enrolled in schools in Emporia, 121 (10.4%) attend a private institution, while the remaining 1,041 (89.6%) are enrolled in public schools. The age group of 25 to 34 year olds has the highest likelihood of being enrolled in private schools, with 2 (100.0% in the age bracket) enrolled. Conversely, the age group of 3 to 4 year olds has the lowest likelihood of being enrolled in a private school, with 60 (100.0% in the age bracket) attending a public institution.
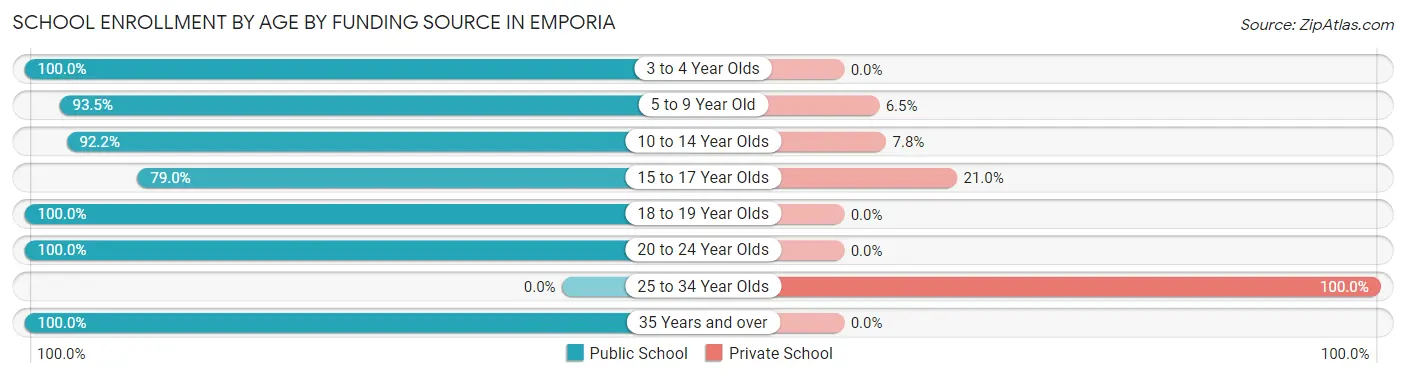
| Age Bracket | Public School | Private School |
| 3 to 4 Year Olds | 60 (100.0%) | 0 (0.0%) |
| 5 to 9 Year Old | 330 (93.5%) | 23 (6.5%) |
| 10 to 14 Year Olds | 354 (92.2%) | 30 (7.8%) |
| 15 to 17 Year Olds | 248 (79.0%) | 66 (21.0%) |
| 18 to 19 Year Olds | 3 (100.0%) | 0 (0.0%) |
| 20 to 24 Year Olds | 37 (100.0%) | 0 (0.0%) |
| 25 to 34 Year Olds | 0 (0.0%) | 2 (100.0%) |
| 35 Years and over | 9 (100.0%) | 0 (0.0%) |
| Total | 1,041 (89.6%) | 121 (10.4%) |
Educational Attainment by Field of Study in Emporia
Liberal arts & history (122 | 17.3%), education (108 | 15.3%), business (101 | 14.3%), arts & humanities (94 | 13.3%), and science & technology (78 | 11.1%) are the most common fields of study among 705 individuals in Emporia who have obtained a bachelor's degree or higher.
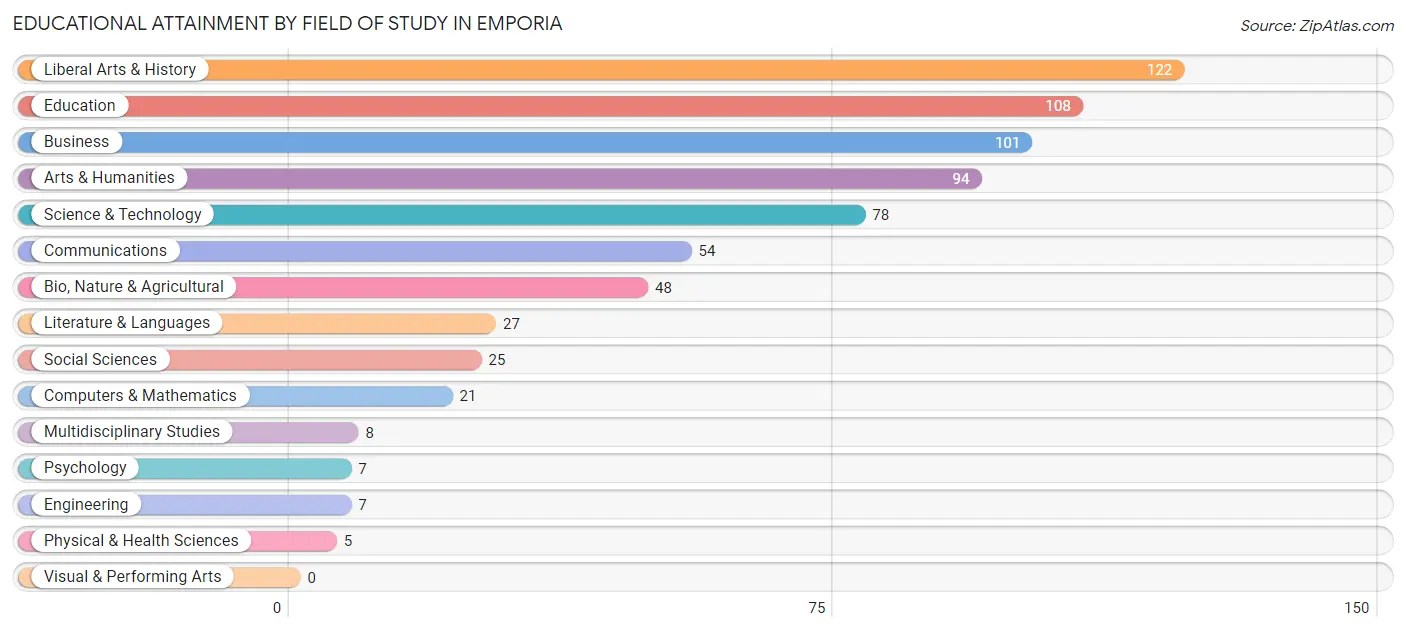
| Field of Study | # Graduates | % Graduates |
| Computers & Mathematics | 21 | 3.0% |
| Bio, Nature & Agricultural | 48 | 6.8% |
| Physical & Health Sciences | 5 | 0.7% |
| Psychology | 7 | 1.0% |
| Social Sciences | 25 | 3.5% |
| Engineering | 7 | 1.0% |
| Multidisciplinary Studies | 8 | 1.1% |
| Science & Technology | 78 | 11.1% |
| Business | 101 | 14.3% |
| Education | 108 | 15.3% |
| Literature & Languages | 27 | 3.8% |
| Liberal Arts & History | 122 | 17.3% |
| Visual & Performing Arts | 0 | 0.0% |
| Communications | 54 | 7.7% |
| Arts & Humanities | 94 | 13.3% |
| Total | 705 | 100.0% |
Transportation & Commute in Emporia
Vehicle Availability by Sex in Emporia
The most prevalent vehicle ownership categories in Emporia are males with 2 vehicles (346, accounting for 33.6%) and females with 2 vehicles (310, making up 30.3%).
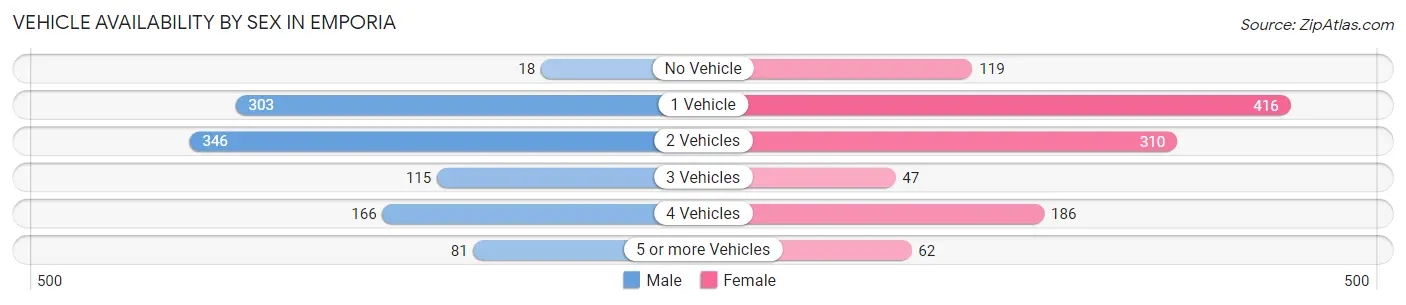
| Vehicles Available | Male | Female |
| No Vehicle | 18 (1.8%) | 119 (10.4%) |
| 1 Vehicle | 303 (29.4%) | 416 (36.5%) |
| 2 Vehicles | 346 (33.6%) | 310 (27.2%) |
| 3 Vehicles | 115 (11.2%) | 47 (4.1%) |
| 4 Vehicles | 166 (16.1%) | 186 (16.3%) |
| 5 or more Vehicles | 81 (7.9%) | 62 (5.4%) |
| Total | 1,029 (100.0%) | 1,140 (100.0%) |
Commute Time in Emporia
The most frequently occuring commute durations in Emporia are 5 to 9 minutes (414 commuters, 19.5%), 10 to 14 minutes (372 commuters, 17.5%), and 30 to 34 minutes (305 commuters, 14.3%).
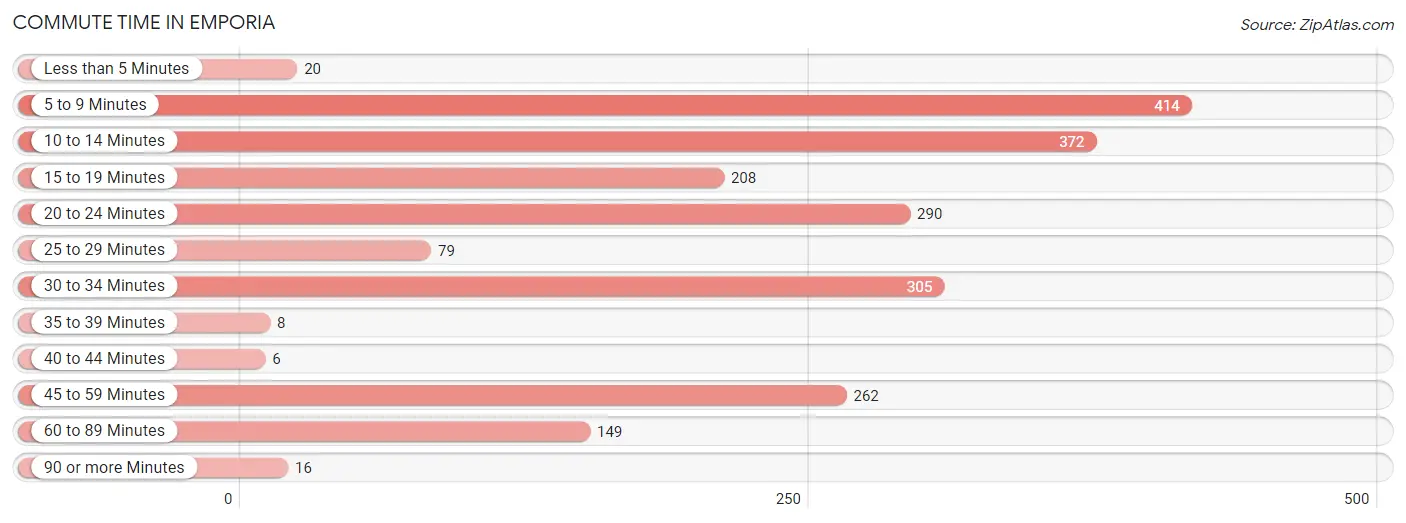
| Commute Time | # Commuters | % Commuters |
| Less than 5 Minutes | 20 | 0.9% |
| 5 to 9 Minutes | 414 | 19.5% |
| 10 to 14 Minutes | 372 | 17.5% |
| 15 to 19 Minutes | 208 | 9.8% |
| 20 to 24 Minutes | 290 | 13.6% |
| 25 to 29 Minutes | 79 | 3.7% |
| 30 to 34 Minutes | 305 | 14.3% |
| 35 to 39 Minutes | 8 | 0.4% |
| 40 to 44 Minutes | 6 | 0.3% |
| 45 to 59 Minutes | 262 | 12.3% |
| 60 to 89 Minutes | 149 | 7.0% |
| 90 or more Minutes | 16 | 0.7% |
Commute Time by Sex in Emporia
The most common commute times in Emporia are 5 to 9 minutes (223 commuters, 21.6%) for males and 10 to 14 minutes (251 commuters, 22.9%) for females.
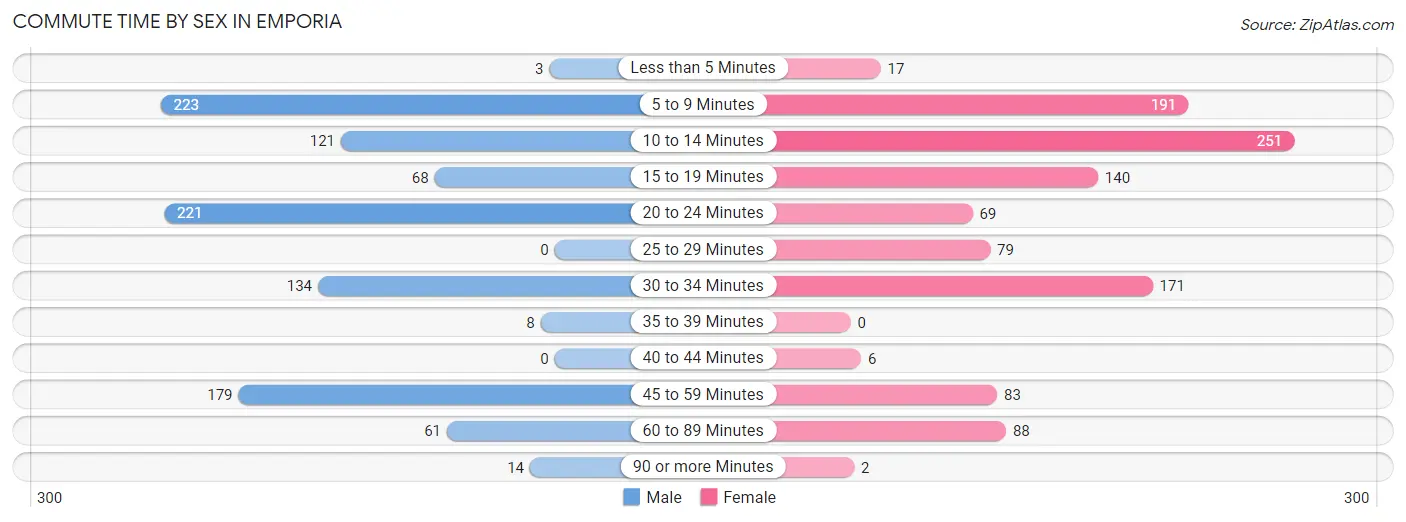
| Commute Time | Male | Female |
| Less than 5 Minutes | 3 (0.3%) | 17 (1.5%) |
| 5 to 9 Minutes | 223 (21.6%) | 191 (17.4%) |
| 10 to 14 Minutes | 121 (11.7%) | 251 (22.9%) |
| 15 to 19 Minutes | 68 (6.6%) | 140 (12.8%) |
| 20 to 24 Minutes | 221 (21.4%) | 69 (6.3%) |
| 25 to 29 Minutes | 0 (0.0%) | 79 (7.2%) |
| 30 to 34 Minutes | 134 (13.0%) | 171 (15.6%) |
| 35 to 39 Minutes | 8 (0.8%) | 0 (0.0%) |
| 40 to 44 Minutes | 0 (0.0%) | 6 (0.5%) |
| 45 to 59 Minutes | 179 (17.3%) | 83 (7.6%) |
| 60 to 89 Minutes | 61 (5.9%) | 88 (8.0%) |
| 90 or more Minutes | 14 (1.4%) | 2 (0.2%) |
Time of Departure to Work by Sex in Emporia
The most frequent times of departure to work in Emporia are 7:30 AM to 7:59 AM (132, 12.8%) for males and 8:00 AM to 8:29 AM (240, 21.9%) for females.
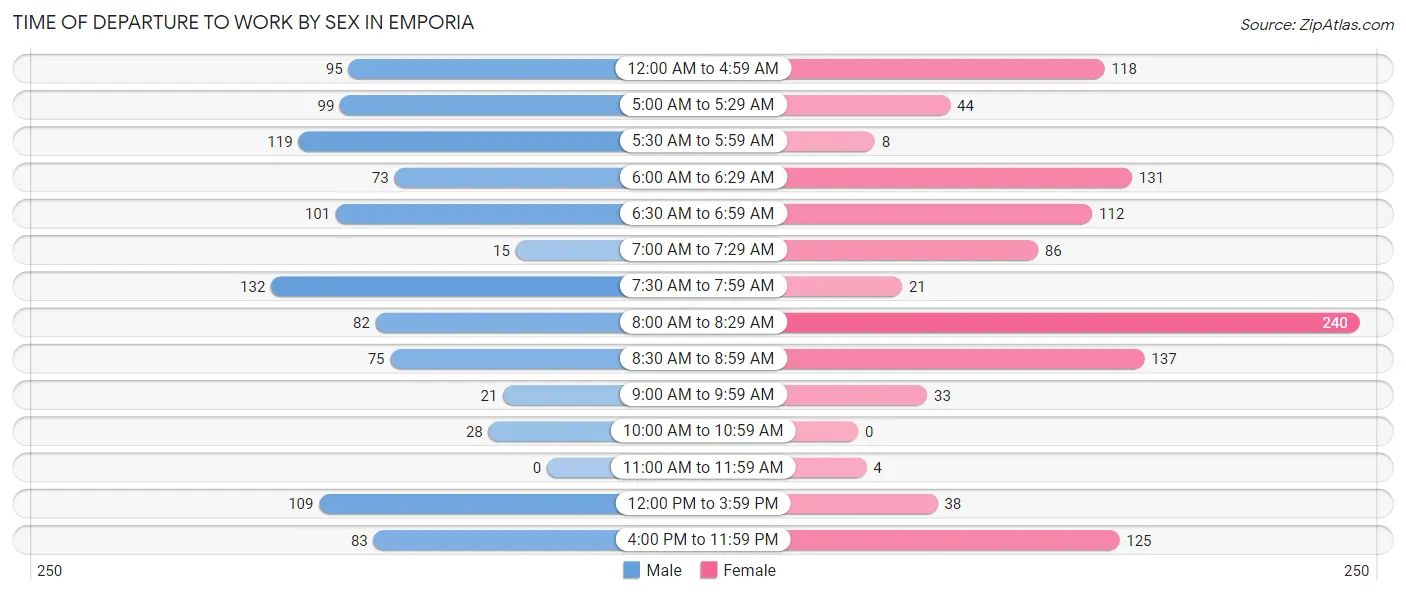
| Time of Departure | Male | Female |
| 12:00 AM to 4:59 AM | 95 (9.2%) | 118 (10.8%) |
| 5:00 AM to 5:29 AM | 99 (9.6%) | 44 (4.0%) |
| 5:30 AM to 5:59 AM | 119 (11.5%) | 8 (0.7%) |
| 6:00 AM to 6:29 AM | 73 (7.1%) | 131 (11.9%) |
| 6:30 AM to 6:59 AM | 101 (9.8%) | 112 (10.2%) |
| 7:00 AM to 7:29 AM | 15 (1.5%) | 86 (7.8%) |
| 7:30 AM to 7:59 AM | 132 (12.8%) | 21 (1.9%) |
| 8:00 AM to 8:29 AM | 82 (8.0%) | 240 (21.9%) |
| 8:30 AM to 8:59 AM | 75 (7.3%) | 137 (12.5%) |
| 9:00 AM to 9:59 AM | 21 (2.0%) | 33 (3.0%) |
| 10:00 AM to 10:59 AM | 28 (2.7%) | 0 (0.0%) |
| 11:00 AM to 11:59 AM | 0 (0.0%) | 4 (0.4%) |
| 12:00 PM to 3:59 PM | 109 (10.6%) | 38 (3.5%) |
| 4:00 PM to 11:59 PM | 83 (8.0%) | 125 (11.4%) |
| Total | 1,032 (100.0%) | 1,097 (100.0%) |
Housing Occupancy in Emporia
Occupancy by Ownership in Emporia
Of the total 2,245 dwellings in Emporia, owner-occupied units account for 899 (40.0%), while renter-occupied units make up 1,346 (60.0%).
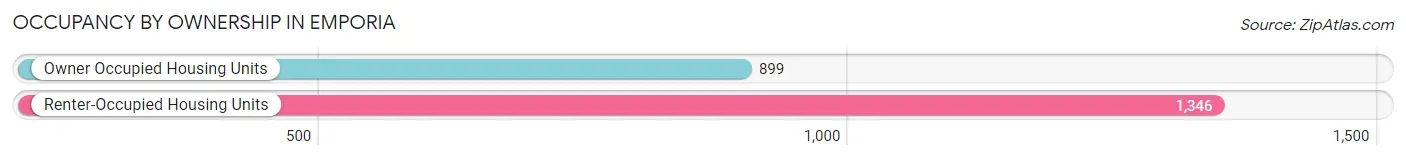
| Occupancy | # Housing Units | % Housing Units |
| Owner Occupied Housing Units | 899 | 40.0% |
| Renter-Occupied Housing Units | 1,346 | 60.0% |
| Total Occupied Housing Units | 2,245 | 100.0% |
Occupancy by Household Size in Emporia
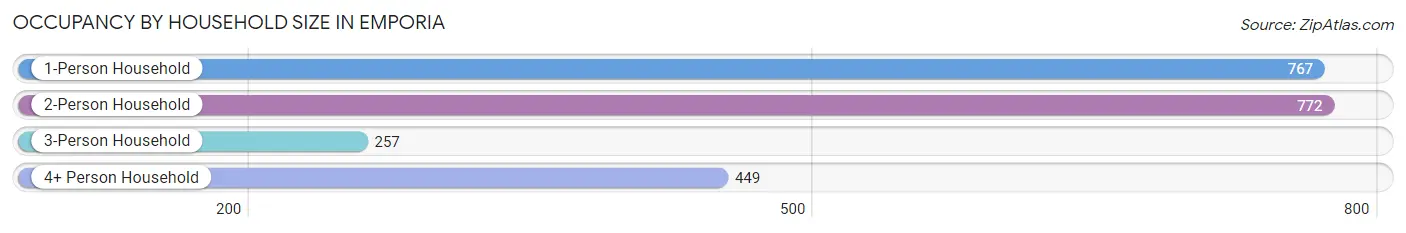
| Household Size | # Housing Units | % Housing Units |
| 1-Person Household | 767 | 34.2% |
| 2-Person Household | 772 | 34.4% |
| 3-Person Household | 257 | 11.5% |
| 4+ Person Household | 449 | 20.0% |
| Total Housing Units | 2,245 | 100.0% |
Occupancy by Ownership by Household Size in Emporia
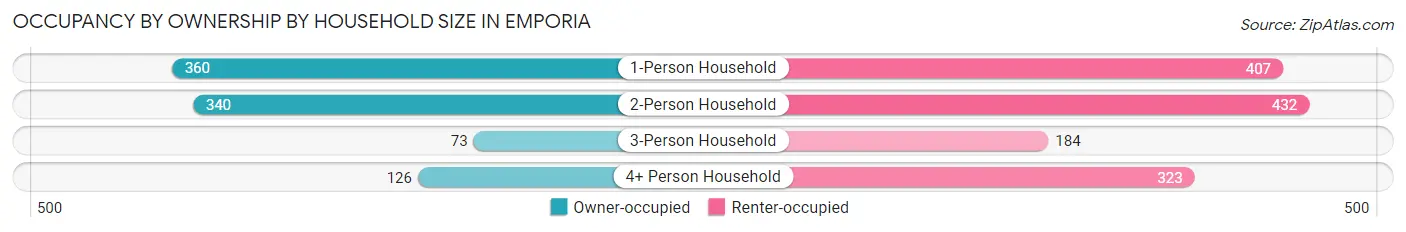
| Household Size | Owner-occupied | Renter-occupied |
| 1-Person Household | 360 (46.9%) | 407 (53.1%) |
| 2-Person Household | 340 (44.0%) | 432 (56.0%) |
| 3-Person Household | 73 (28.4%) | 184 (71.6%) |
| 4+ Person Household | 126 (28.1%) | 323 (71.9%) |
| Total Housing Units | 899 (40.0%) | 1,346 (60.0%) |
Occupancy by Educational Attainment in Emporia
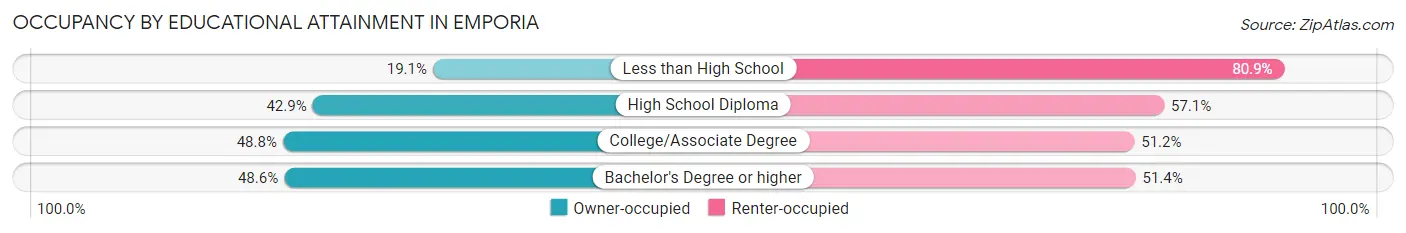
| Household Size | Owner-occupied | Renter-occupied |
| Less than High School | 101 (19.1%) | 429 (80.9%) |
| High School Diploma | 279 (42.9%) | 371 (57.1%) |
| College/Associate Degree | 332 (48.8%) | 348 (51.2%) |
| Bachelor's Degree or higher | 187 (48.6%) | 198 (51.4%) |
Occupancy by Age of Householder in Emporia
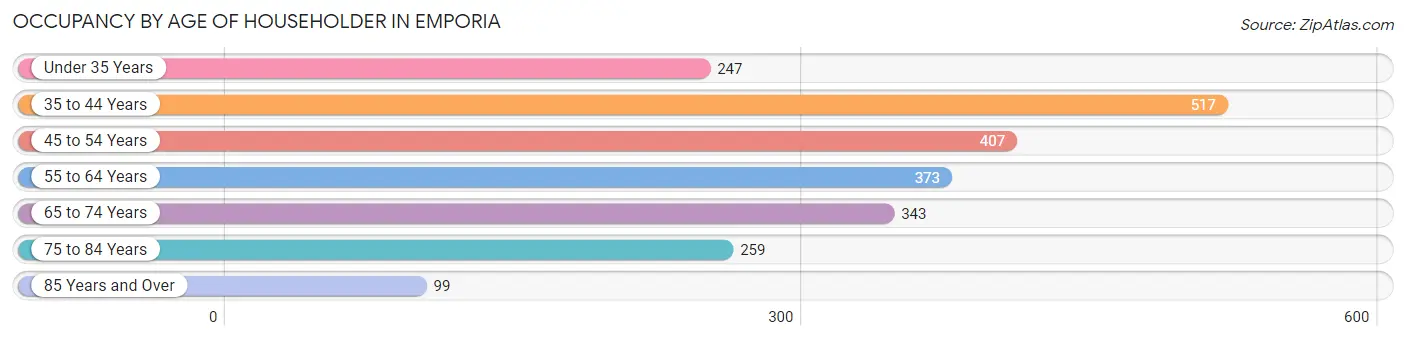
| Age Bracket | # Households | % Households |
| Under 35 Years | 247 | 11.0% |
| 35 to 44 Years | 517 | 23.0% |
| 45 to 54 Years | 407 | 18.1% |
| 55 to 64 Years | 373 | 16.6% |
| 65 to 74 Years | 343 | 15.3% |
| 75 to 84 Years | 259 | 11.5% |
| 85 Years and Over | 99 | 4.4% |
| Total | 2,245 | 100.0% |
Housing Finances in Emporia
Median Income by Occupancy in Emporia
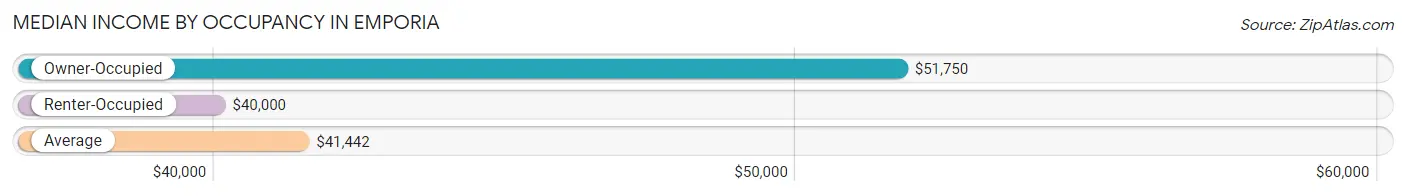
| Occupancy Type | # Households | Median Income |
| Owner-Occupied | 899 (40.0%) | $51,750 |
| Renter-Occupied | 1,346 (60.0%) | $40,000 |
| Average | 2,245 (100.0%) | $41,442 |
Occupancy by Householder Income Bracket in Emporia
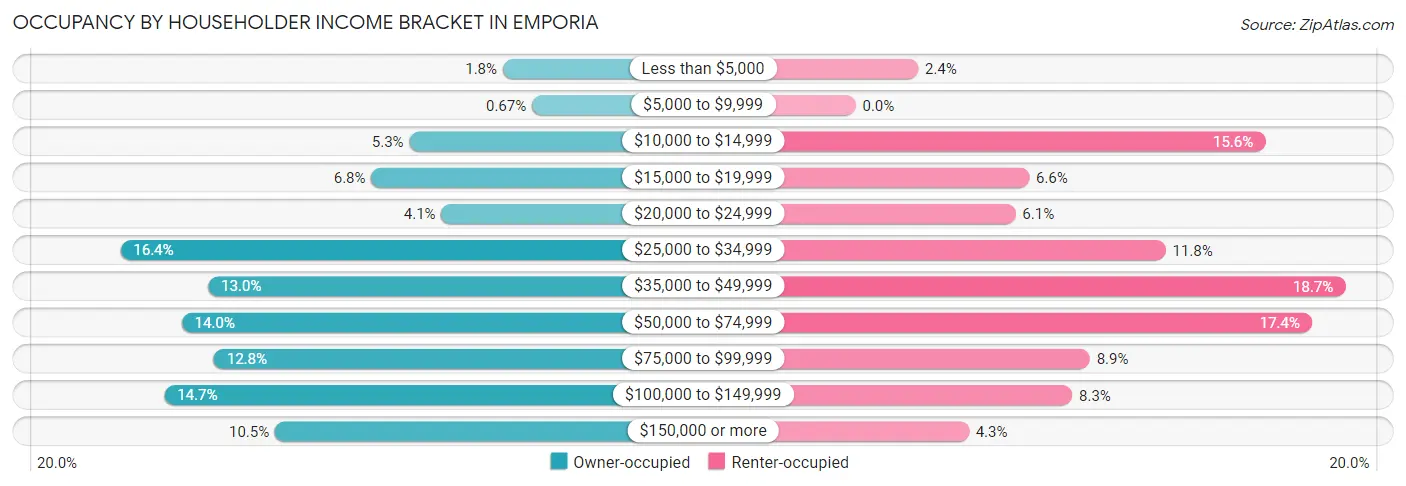
| Income Bracket | Owner-occupied | Renter-occupied |
| Less than $5,000 | 16 (1.8%) | 32 (2.4%) |
| $5,000 to $9,999 | 6 (0.7%) | 0 (0.0%) |
| $10,000 to $14,999 | 48 (5.3%) | 210 (15.6%) |
| $15,000 to $19,999 | 61 (6.8%) | 89 (6.6%) |
| $20,000 to $24,999 | 37 (4.1%) | 82 (6.1%) |
| $25,000 to $34,999 | 147 (16.4%) | 159 (11.8%) |
| $35,000 to $49,999 | 117 (13.0%) | 251 (18.6%) |
| $50,000 to $74,999 | 126 (14.0%) | 234 (17.4%) |
| $75,000 to $99,999 | 115 (12.8%) | 120 (8.9%) |
| $100,000 to $149,999 | 132 (14.7%) | 111 (8.3%) |
| $150,000 or more | 94 (10.5%) | 58 (4.3%) |
| Total | 899 (100.0%) | 1,346 (100.0%) |
Monthly Housing Cost Tiers in Emporia
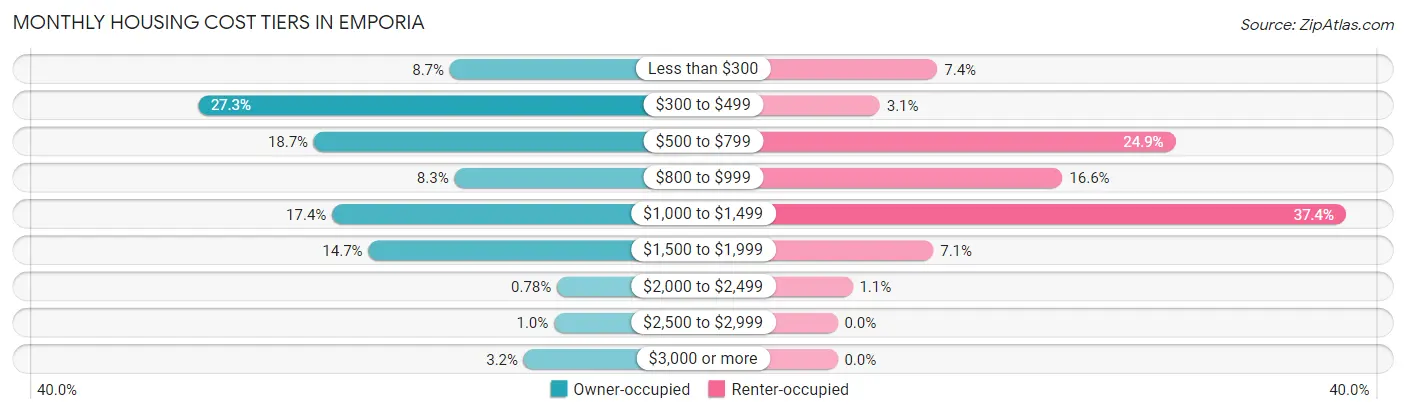
| Monthly Cost | Owner-occupied | Renter-occupied |
| Less than $300 | 78 (8.7%) | 99 (7.4%) |
| $300 to $499 | 245 (27.3%) | 42 (3.1%) |
| $500 to $799 | 168 (18.7%) | 335 (24.9%) |
| $800 to $999 | 75 (8.3%) | 223 (16.6%) |
| $1,000 to $1,499 | 156 (17.3%) | 504 (37.4%) |
| $1,500 to $1,999 | 132 (14.7%) | 95 (7.1%) |
| $2,000 to $2,499 | 7 (0.8%) | 15 (1.1%) |
| $2,500 to $2,999 | 9 (1.0%) | 0 (0.0%) |
| $3,000 or more | 29 (3.2%) | 0 (0.0%) |
| Total | 899 (100.0%) | 1,346 (100.0%) |
Physical Housing Characteristics in Emporia
Housing Structures in Emporia
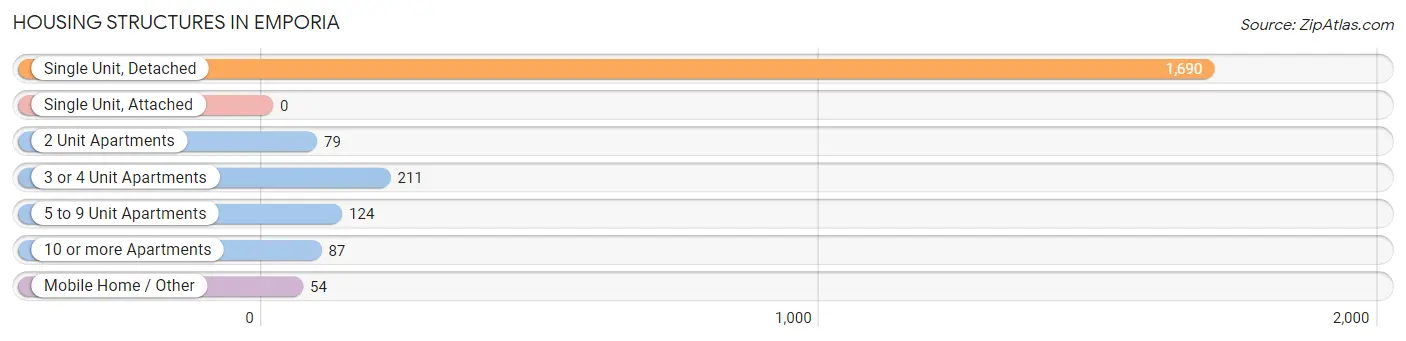
| Structure Type | # Housing Units | % Housing Units |
| Single Unit, Detached | 1,690 | 75.3% |
| Single Unit, Attached | 0 | 0.0% |
| 2 Unit Apartments | 79 | 3.5% |
| 3 or 4 Unit Apartments | 211 | 9.4% |
| 5 to 9 Unit Apartments | 124 | 5.5% |
| 10 or more Apartments | 87 | 3.9% |
| Mobile Home / Other | 54 | 2.4% |
| Total | 2,245 | 100.0% |
Housing Structures by Occupancy in Emporia
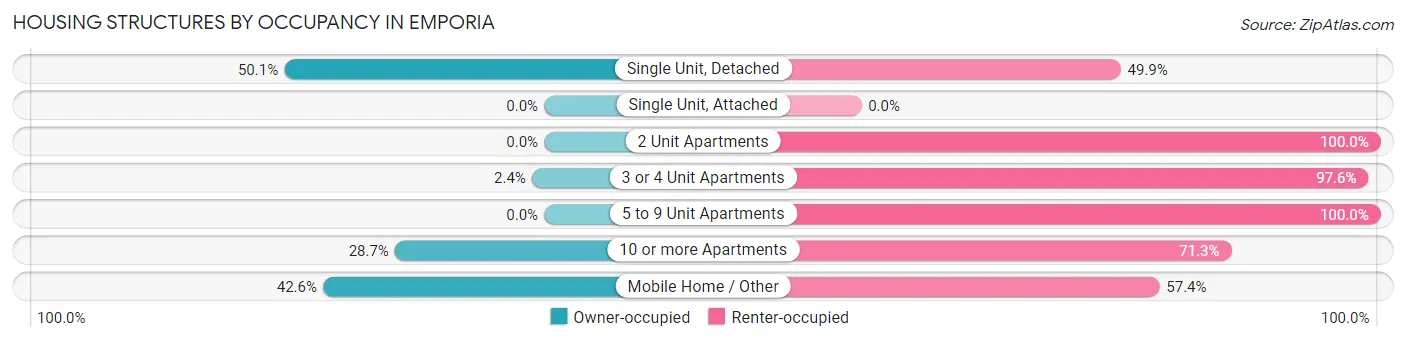
| Structure Type | Owner-occupied | Renter-occupied |
| Single Unit, Detached | 846 (50.1%) | 844 (49.9%) |
| Single Unit, Attached | 0 (0.0%) | 0 (0.0%) |
| 2 Unit Apartments | 0 (0.0%) | 79 (100.0%) |
| 3 or 4 Unit Apartments | 5 (2.4%) | 206 (97.6%) |
| 5 to 9 Unit Apartments | 0 (0.0%) | 124 (100.0%) |
| 10 or more Apartments | 25 (28.7%) | 62 (71.3%) |
| Mobile Home / Other | 23 (42.6%) | 31 (57.4%) |
| Total | 899 (40.0%) | 1,346 (60.0%) |
Housing Structures by Number of Rooms in Emporia
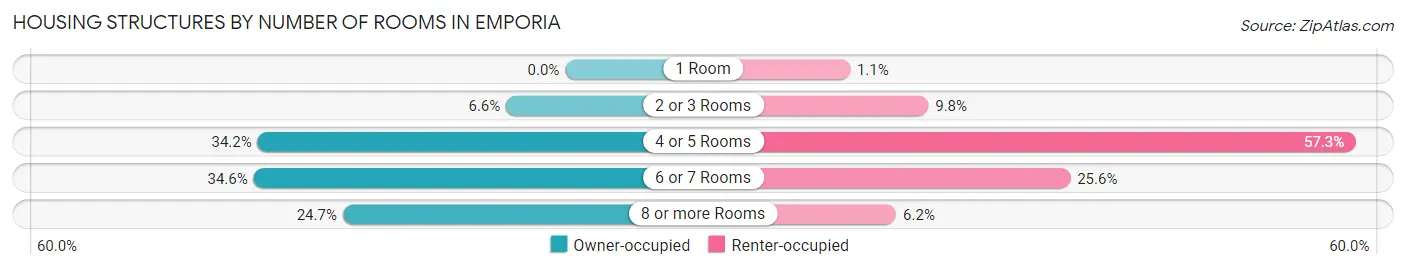
| Number of Rooms | Owner-occupied | Renter-occupied |
| 1 Room | 0 (0.0%) | 15 (1.1%) |
| 2 or 3 Rooms | 59 (6.6%) | 132 (9.8%) |
| 4 or 5 Rooms | 307 (34.2%) | 771 (57.3%) |
| 6 or 7 Rooms | 311 (34.6%) | 344 (25.6%) |
| 8 or more Rooms | 222 (24.7%) | 84 (6.2%) |
| Total | 899 (100.0%) | 1,346 (100.0%) |
Housing Structure by Heating Type in Emporia
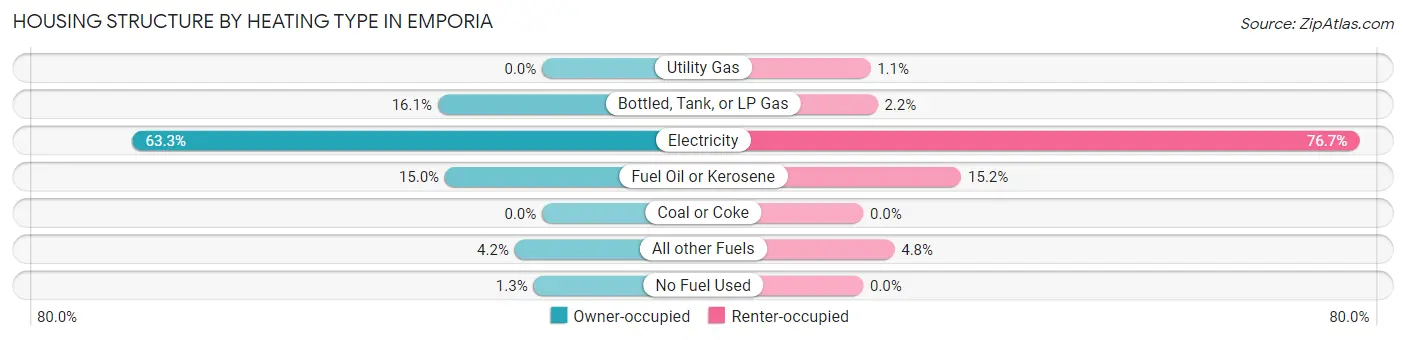
| Heating Type | Owner-occupied | Renter-occupied |
| Utility Gas | 0 (0.0%) | 15 (1.1%) |
| Bottled, Tank, or LP Gas | 145 (16.1%) | 30 (2.2%) |
| Electricity | 569 (63.3%) | 1,032 (76.7%) |
| Fuel Oil or Kerosene | 135 (15.0%) | 204 (15.2%) |
| Coal or Coke | 0 (0.0%) | 0 (0.0%) |
| All other Fuels | 38 (4.2%) | 65 (4.8%) |
| No Fuel Used | 12 (1.3%) | 0 (0.0%) |
| Total | 899 (100.0%) | 1,346 (100.0%) |
Household Vehicle Usage in Emporia
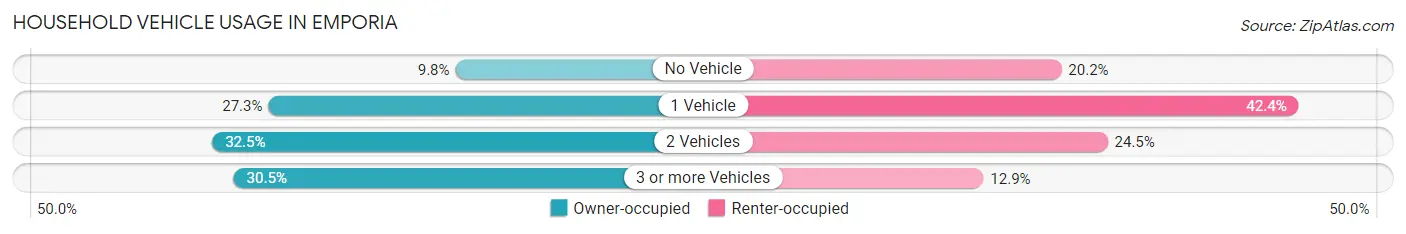
| Vehicles per Household | Owner-occupied | Renter-occupied |
| No Vehicle | 88 (9.8%) | 272 (20.2%) |
| 1 Vehicle | 245 (27.3%) | 570 (42.3%) |
| 2 Vehicles | 292 (32.5%) | 330 (24.5%) |
| 3 or more Vehicles | 274 (30.5%) | 174 (12.9%) |
| Total | 899 (100.0%) | 1,346 (100.0%) |
Real Estate & Mortgages in Emporia
Real Estate and Mortgage Overview in Emporia
| Characteristic | Without Mortgage | With Mortgage |
| Housing Units | 495 | 404 |
| Median Property Value | $90,900 | $207,600 |
| Median Household Income | $40,179 | $74 |
| Monthly Housing Costs | $444 | $29 |
| Real Estate Taxes | $789 | $0 |
Property Value by Mortgage Status in Emporia
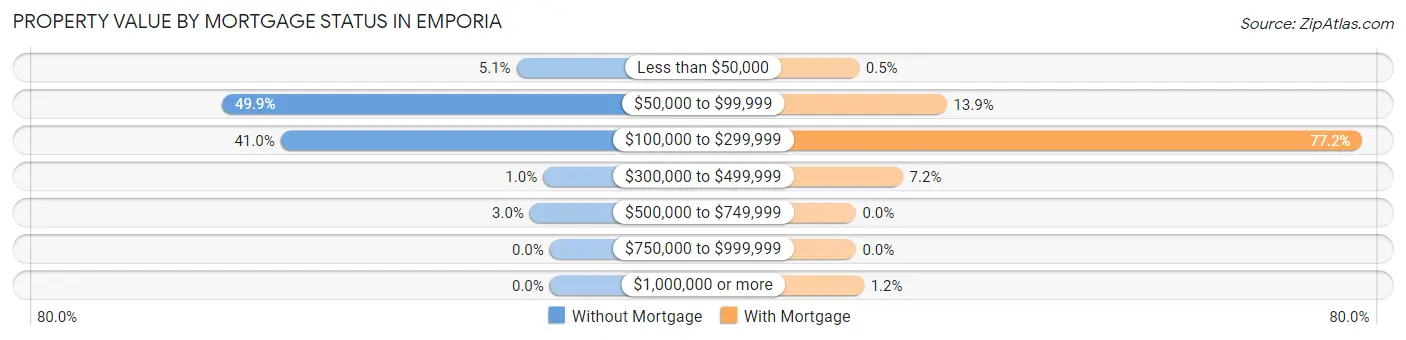
| Property Value | Without Mortgage | With Mortgage |
| Less than $50,000 | 25 (5.1%) | 2 (0.5%) |
| $50,000 to $99,999 | 247 (49.9%) | 56 (13.9%) |
| $100,000 to $299,999 | 203 (41.0%) | 312 (77.2%) |
| $300,000 to $499,999 | 5 (1.0%) | 29 (7.2%) |
| $500,000 to $749,999 | 15 (3.0%) | 0 (0.0%) |
| $750,000 to $999,999 | 0 (0.0%) | 0 (0.0%) |
| $1,000,000 or more | 0 (0.0%) | 5 (1.2%) |
| Total | 495 (100.0%) | 404 (100.0%) |
Household Income by Mortgage Status in Emporia
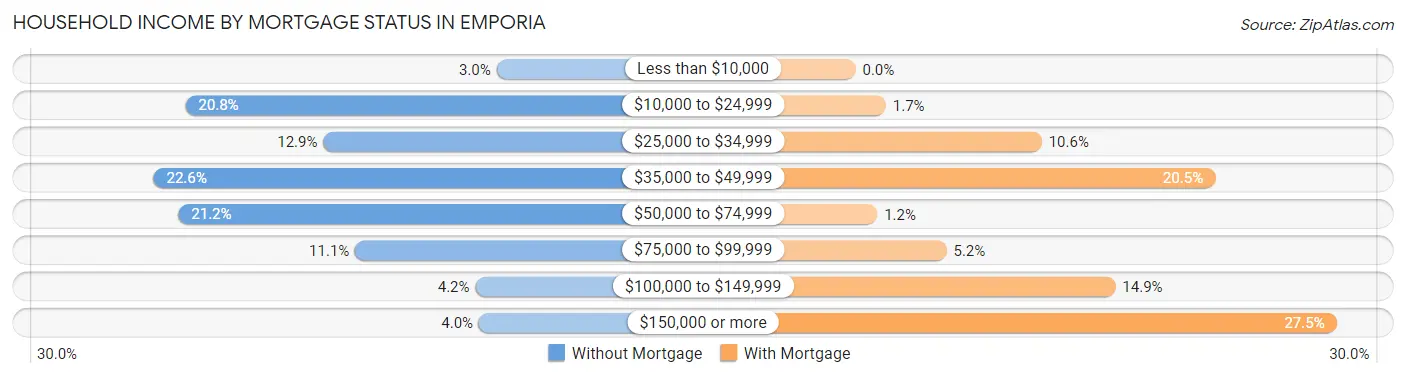
| Household Income | Without Mortgage | With Mortgage |
| Less than $10,000 | 15 (3.0%) | 0 (0.0%) |
| $10,000 to $24,999 | 103 (20.8%) | 7 (1.7%) |
| $25,000 to $34,999 | 64 (12.9%) | 43 (10.6%) |
| $35,000 to $49,999 | 112 (22.6%) | 83 (20.5%) |
| $50,000 to $74,999 | 105 (21.2%) | 5 (1.2%) |
| $75,000 to $99,999 | 55 (11.1%) | 21 (5.2%) |
| $100,000 to $149,999 | 21 (4.2%) | 60 (14.8%) |
| $150,000 or more | 20 (4.0%) | 111 (27.5%) |
| Total | 495 (100.0%) | 404 (100.0%) |
Property Value to Household Income Ratio in Emporia
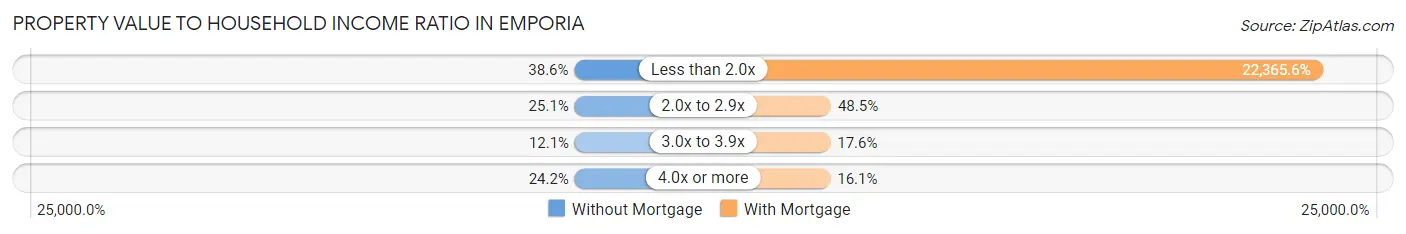
| Value-to-Income Ratio | Without Mortgage | With Mortgage |
| Less than 2.0x | 191 (38.6%) | 90,357 (22,365.6%) |
| 2.0x to 2.9x | 124 (25.1%) | 196 (48.5%) |
| 3.0x to 3.9x | 60 (12.1%) | 71 (17.6%) |
| 4.0x or more | 120 (24.2%) | 65 (16.1%) |
| Total | 495 (100.0%) | 404 (100.0%) |
Real Estate Taxes by Mortgage Status in Emporia
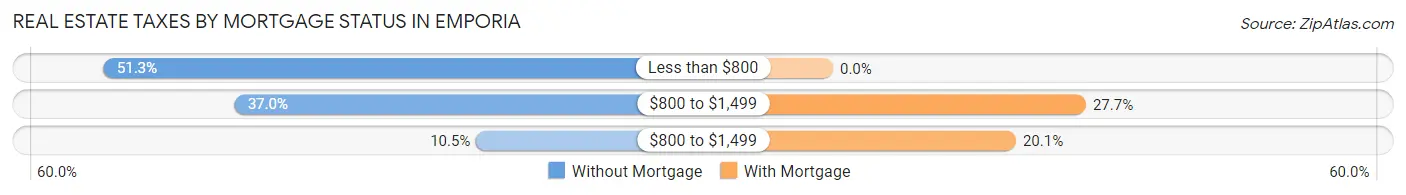
| Property Taxes | Without Mortgage | With Mortgage |
| Less than $800 | 254 (51.3%) | 0 (0.0%) |
| $800 to $1,499 | 183 (37.0%) | 112 (27.7%) |
| $800 to $1,499 | 52 (10.5%) | 81 (20.1%) |
| Total | 495 (100.0%) | 404 (100.0%) |
Health & Disability in Emporia
Health Insurance Coverage by Age in Emporia
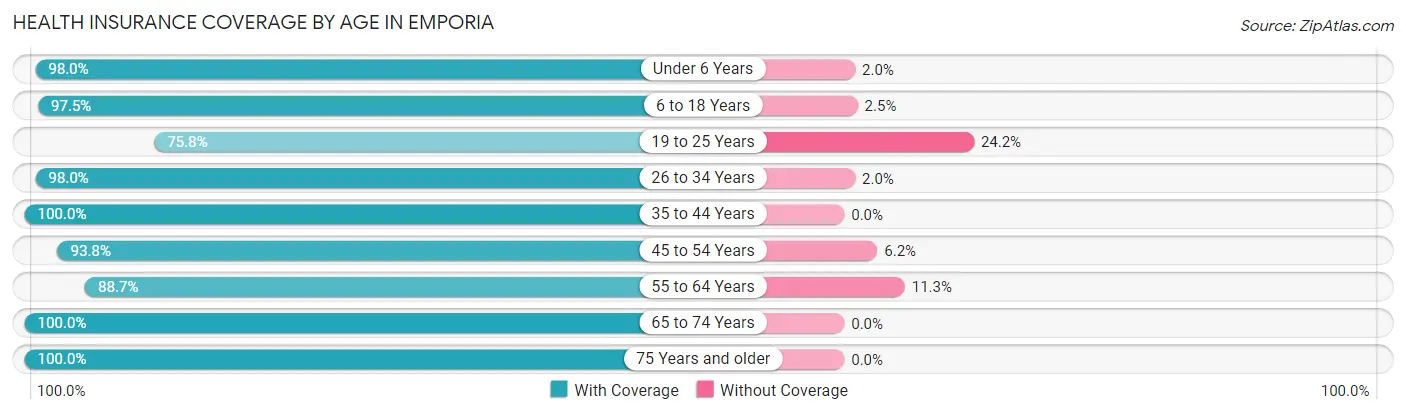
| Age Bracket | With Coverage | Without Coverage |
| Under 6 Years | 342 (98.0%) | 7 (2.0%) |
| 6 to 18 Years | 1,134 (97.5%) | 29 (2.5%) |
| 19 to 25 Years | 301 (75.8%) | 96 (24.2%) |
| 26 to 34 Years | 581 (98.0%) | 12 (2.0%) |
| 35 to 44 Years | 781 (100.0%) | 0 (0.0%) |
| 45 to 54 Years | 609 (93.8%) | 40 (6.2%) |
| 55 to 64 Years | 582 (88.7%) | 74 (11.3%) |
| 65 to 74 Years | 473 (100.0%) | 0 (0.0%) |
| 75 Years and older | 403 (100.0%) | 0 (0.0%) |
| Total | 5,206 (95.3%) | 258 (4.7%) |
Health Insurance Coverage by Citizenship Status in Emporia
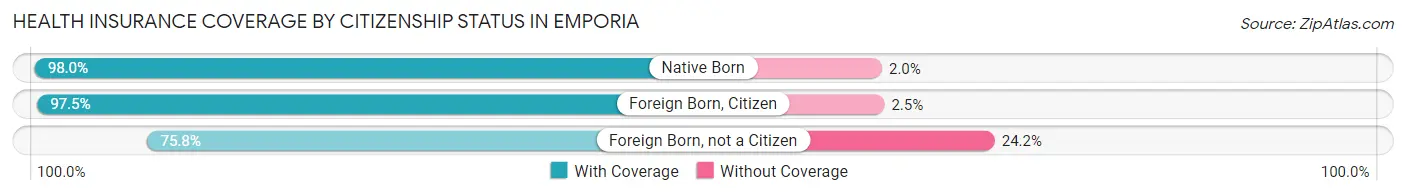
| Citizenship Status | With Coverage | Without Coverage |
| Native Born | 342 (98.0%) | 7 (2.0%) |
| Foreign Born, Citizen | 1,134 (97.5%) | 29 (2.5%) |
| Foreign Born, not a Citizen | 301 (75.8%) | 96 (24.2%) |
Health Insurance Coverage by Household Income in Emporia
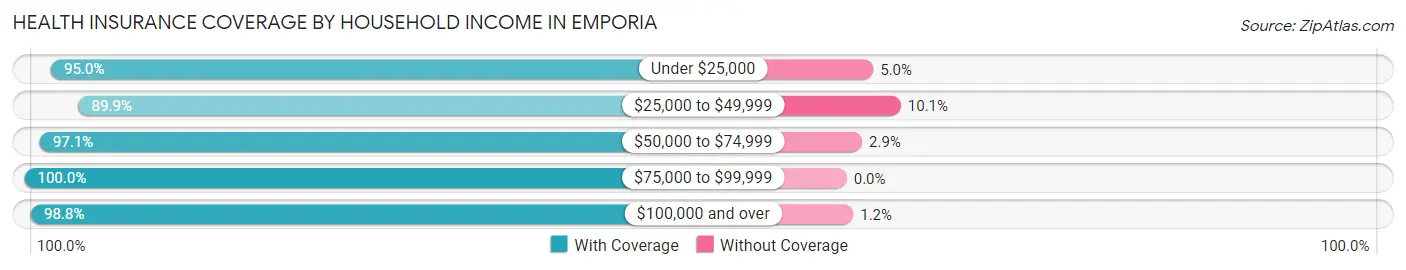
| Household Income | With Coverage | Without Coverage |
| Under $25,000 | 785 (95.0%) | 41 (5.0%) |
| $25,000 to $49,999 | 1,464 (89.9%) | 165 (10.1%) |
| $50,000 to $74,999 | 1,150 (97.1%) | 34 (2.9%) |
| $75,000 to $99,999 | 575 (100.0%) | 0 (0.0%) |
| $100,000 and over | 1,218 (98.8%) | 15 (1.2%) |
Public vs Private Health Insurance Coverage by Age in Emporia
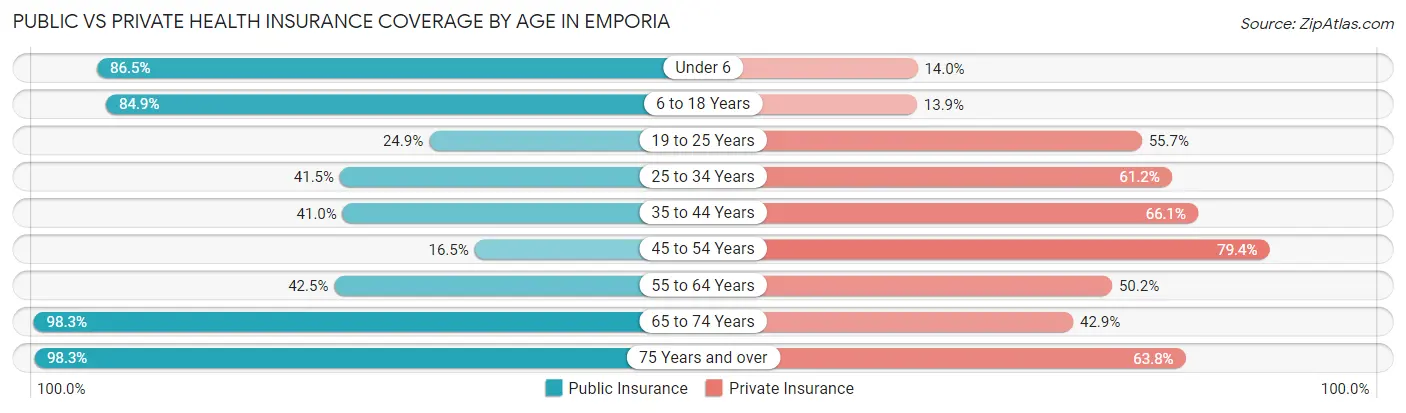
| Age Bracket | Public Insurance | Private Insurance |
| Under 6 | 302 (86.5%) | 49 (14.0%) |
| 6 to 18 Years | 987 (84.9%) | 162 (13.9%) |
| 19 to 25 Years | 99 (24.9%) | 221 (55.7%) |
| 25 to 34 Years | 246 (41.5%) | 363 (61.2%) |
| 35 to 44 Years | 320 (41.0%) | 516 (66.1%) |
| 45 to 54 Years | 107 (16.5%) | 515 (79.3%) |
| 55 to 64 Years | 279 (42.5%) | 329 (50.1%) |
| 65 to 74 Years | 465 (98.3%) | 203 (42.9%) |
| 75 Years and over | 396 (98.3%) | 257 (63.8%) |
| Total | 3,201 (58.6%) | 2,615 (47.9%) |
Disability Status by Sex by Age in Emporia
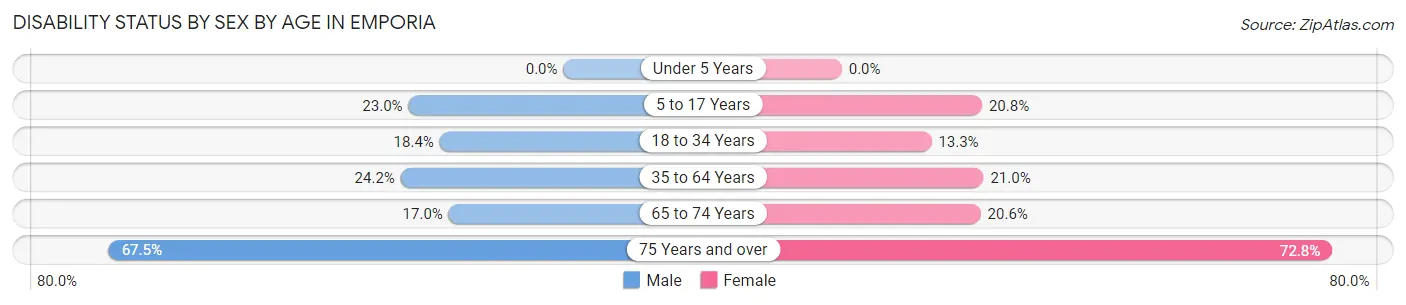
| Age Bracket | Male | Female |
| Under 5 Years | 0 (0.0%) | 0 (0.0%) |
| 5 to 17 Years | 165 (23.0%) | 102 (20.8%) |
| 18 to 34 Years | 61 (18.4%) | 88 (13.3%) |
| 35 to 64 Years | 217 (24.2%) | 250 (21.0%) |
| 65 to 74 Years | 31 (17.0%) | 60 (20.6%) |
| 75 Years and over | 81 (67.5%) | 206 (72.8%) |
Disability Class by Sex by Age in Emporia
Disability Class: Hearing Difficulty
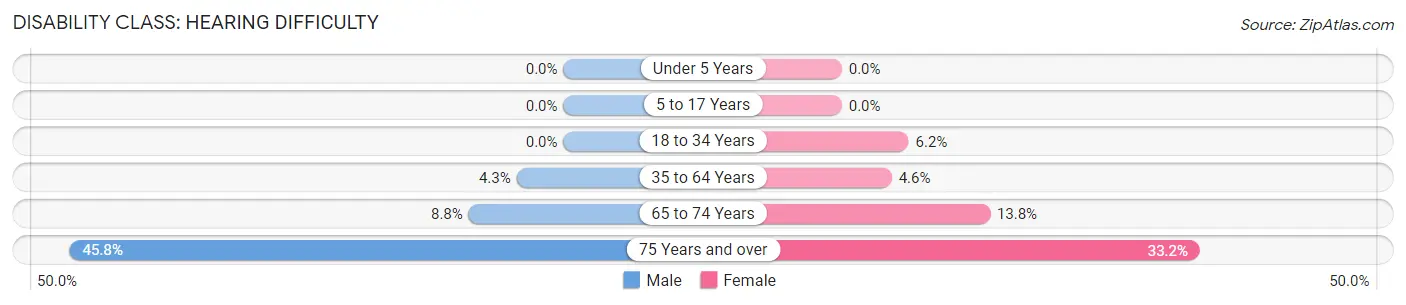
| Age Bracket | Male | Female |
| Under 5 Years | 0 (0.0%) | 0 (0.0%) |
| 5 to 17 Years | 0 (0.0%) | 0 (0.0%) |
| 18 to 34 Years | 0 (0.0%) | 41 (6.2%) |
| 35 to 64 Years | 39 (4.3%) | 55 (4.6%) |
| 65 to 74 Years | 16 (8.8%) | 40 (13.8%) |
| 75 Years and over | 55 (45.8%) | 94 (33.2%) |
Disability Class: Vision Difficulty
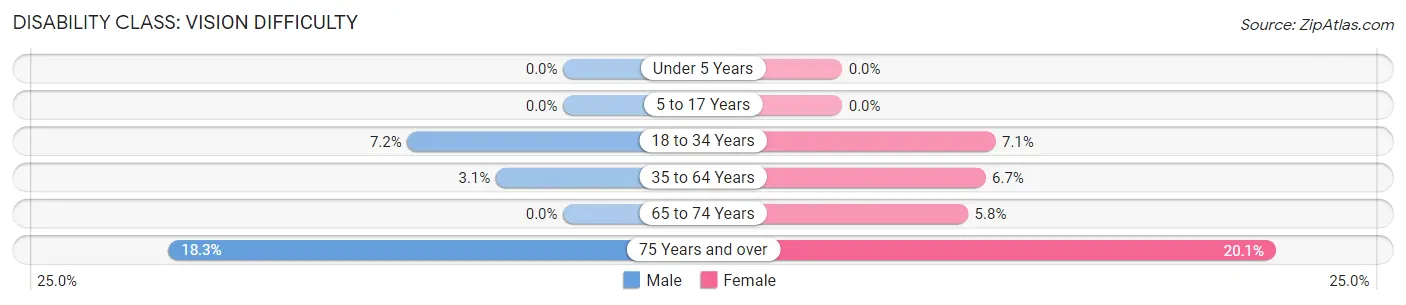
| Age Bracket | Male | Female |
| Under 5 Years | 0 (0.0%) | 0 (0.0%) |
| 5 to 17 Years | 0 (0.0%) | 0 (0.0%) |
| 18 to 34 Years | 24 (7.2%) | 47 (7.1%) |
| 35 to 64 Years | 28 (3.1%) | 79 (6.7%) |
| 65 to 74 Years | 0 (0.0%) | 17 (5.8%) |
| 75 Years and over | 22 (18.3%) | 57 (20.1%) |
Disability Class: Cognitive Difficulty
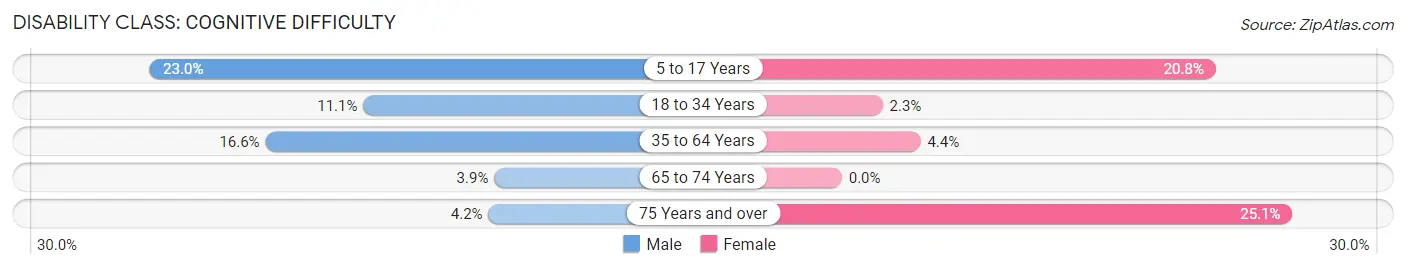
| Age Bracket | Male | Female |
| 5 to 17 Years | 165 (23.0%) | 102 (20.8%) |
| 18 to 34 Years | 37 (11.1%) | 15 (2.3%) |
| 35 to 64 Years | 149 (16.6%) | 52 (4.4%) |
| 65 to 74 Years | 7 (3.8%) | 0 (0.0%) |
| 75 Years and over | 5 (4.2%) | 71 (25.1%) |
Disability Class: Ambulatory Difficulty
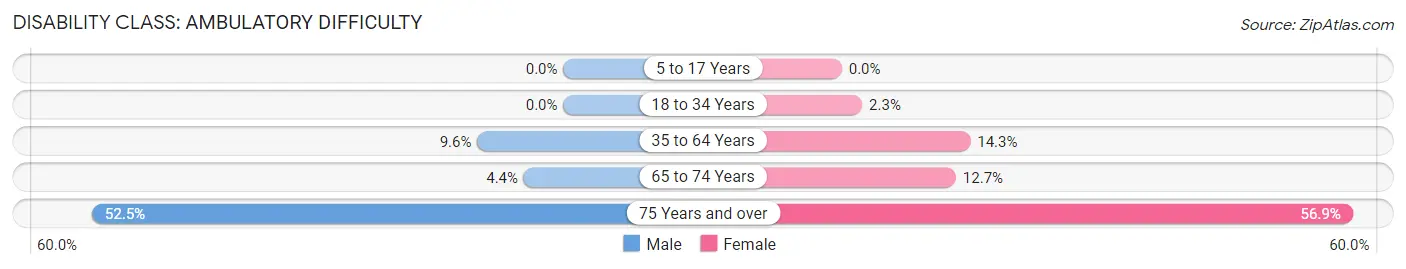
| Age Bracket | Male | Female |
| 5 to 17 Years | 0 (0.0%) | 0 (0.0%) |
| 18 to 34 Years | 0 (0.0%) | 15 (2.3%) |
| 35 to 64 Years | 86 (9.6%) | 170 (14.3%) |
| 65 to 74 Years | 8 (4.4%) | 37 (12.7%) |
| 75 Years and over | 63 (52.5%) | 161 (56.9%) |
Disability Class: Self-Care Difficulty
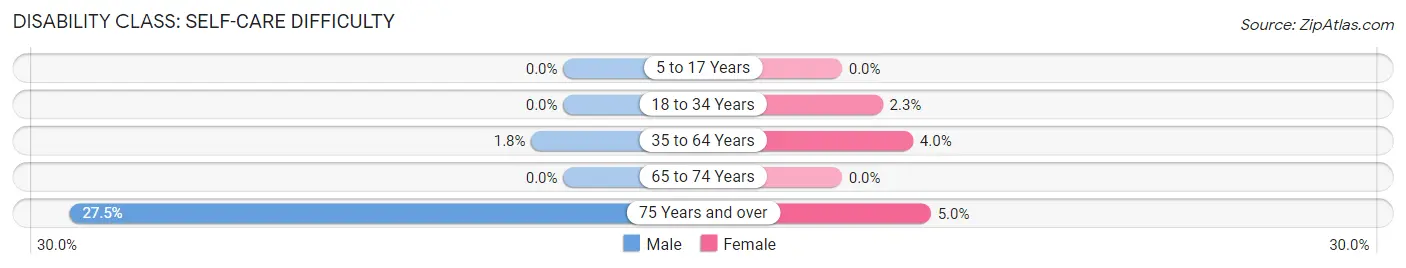
| Age Bracket | Male | Female |
| 5 to 17 Years | 0 (0.0%) | 0 (0.0%) |
| 18 to 34 Years | 0 (0.0%) | 15 (2.3%) |
| 35 to 64 Years | 16 (1.8%) | 47 (4.0%) |
| 65 to 74 Years | 0 (0.0%) | 0 (0.0%) |
| 75 Years and over | 33 (27.5%) | 14 (5.0%) |
Technology Access in Emporia
Computing Device Access in Emporia
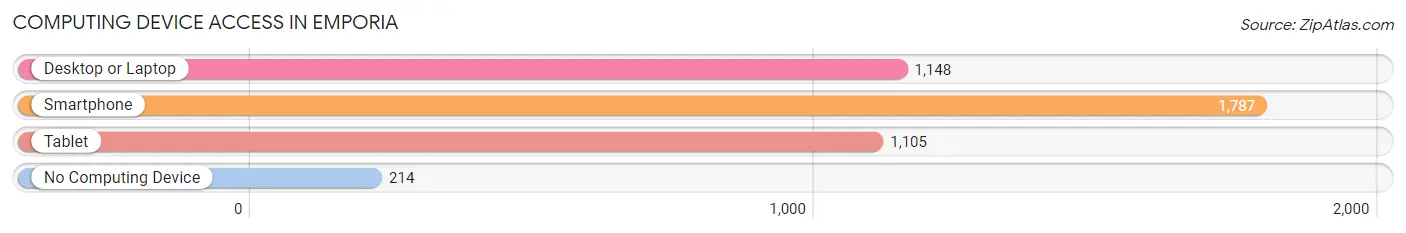
| Device Type | # Households | % Households |
| Desktop or Laptop | 1,148 | 51.1% |
| Smartphone | 1,787 | 79.6% |
| Tablet | 1,105 | 49.2% |
| No Computing Device | 214 | 9.5% |
| Total | 2,245 | 100.0% |
Internet Access in Emporia
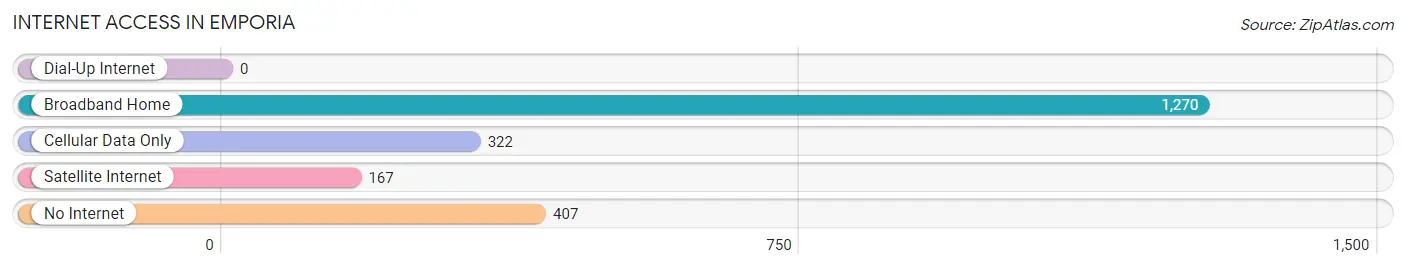
| Internet Type | # Households | % Households |
| Dial-Up Internet | 0 | 0.0% |
| Broadband Home | 1,270 | 56.6% |
| Cellular Data Only | 322 | 14.3% |
| Satellite Internet | 167 | 7.4% |
| No Internet | 407 | 18.1% |
| Total | 2,245 | 100.0% |
Emporia Summary
Emporia, Virginia is a small city located in the south-central part of the state, in Greensville County. It is situated on the banks of the Meherrin River, and is part of the Hampton Roads metropolitan area. The city has a population of approximately 5,500 people, and is the county seat of Greensville County.
History
The area that is now Emporia was first settled in the early 1700s by English colonists. The town was originally known as Belfield, and was established in 1752. The town was renamed Emporia in 1887, after the Latin word for “marketplace”. The town was an important trading center for the surrounding area, and was the site of the first railroad station in Greensville County.
The town was also the site of the Battle of Emporia during the Civil War. The battle was fought on April 5, 1865, and was a Confederate victory. The town was also the site of the Emporia Riot of 1883, which was a race riot that resulted in the death of one African American man.
Geography
Emporia is located in south-central Virginia, in Greensville County. The city is situated on the banks of the Meherrin River, and is part of the Hampton Roads metropolitan area. The city has a total area of 4.2 square miles, all of which is land. The city is located approximately 50 miles south of Richmond, and is about an hour and a half drive from the state capital.
Economy
The economy of Emporia is largely based on agriculture and manufacturing. The city is home to several large manufacturing plants, including a paper mill, a furniture factory, and a textile mill. The city is also home to several large farms, which produce a variety of crops, including corn, soybeans, and cotton.
The city is also home to several retail stores, restaurants, and other businesses. The city is also home to several educational institutions, including a community college and a technical school.
Demographics
As of the 2010 census, the population of Emporia was 5,500 people. The racial makeup of the city was 57.3% White, 37.2% African American, 0.3% Native American, 0.7% Asian, 0.1% Pacific Islander, and 4.4% from other races. The median household income in the city was $30,938, and the median family income was $37,938.
Conclusion
Emporia, Virginia is a small city located in the south-central part of the state, in Greensville County. It is situated on the banks of the Meherrin River, and is part of the Hampton Roads metropolitan area. The city has a population of approximately 5,500 people, and is the county seat of Greensville County. The economy of Emporia is largely based on agriculture and manufacturing, and the city is home to several large farms, manufacturing plants, retail stores, restaurants, and other businesses. The racial makeup of the city is 57.3% White, 37.2% African American, 0.3% Native American, 0.7% Asian, 0.1% Pacific Islander, and 4.4% from other races. The median household income in the city was $30,938, and the median family income was $37,938.
Common Questions
What is Per Capita Income in Emporia?
Per Capita income in Emporia is $24,915.
What is the Median Family Income in Emporia?
Median Family Income in Emporia is $54,091.
What is the Median Household income in Emporia?
Median Household Income in Emporia is $41,442.
What is Income or Wage Gap in Emporia?
Income or Wage Gap in Emporia is 21.3%.
Women in Emporia earn 78.7 cents for every dollar earned by a man.
What is Inequality or Gini Index in Emporia?
Inequality or Gini Index in Emporia is 0.45.
What is the Total Population of Emporia?
Total Population of Emporia is 5,680.
What is the Total Male Population of Emporia?
Total Male Population of Emporia is 2,531.
What is the Total Female Population of Emporia?
Total Female Population of Emporia is 3,149.
What is the Ratio of Males per 100 Females in Emporia?
There are 80.37 Males per 100 Females in Emporia.
What is the Ratio of Females per 100 Males in Emporia?
There are 124.42 Females per 100 Males in Emporia.
What is the Median Population Age in Emporia?
Median Population Age in Emporia is 39.9 Years.
What is the Average Family Size in Emporia
Average Family Size in Emporia is 3.0 People.
What is the Average Household Size in Emporia
Average Household Size in Emporia is 2.4 People.
How Large is the Labor Force in Emporia?
There are 2,350 People in the Labor Forcein in Emporia.
What is the Percentage of People in the Labor Force in Emporia?
53.2% of People are in the Labor Force in Emporia.
What is the Unemployment Rate in Emporia?
Unemployment Rate in Emporia is 7.0%.