Emory, VA Map & Demographics
Emory Map

Emory Overview
$20,631
PER CAPITA INCOME
$64,688
AVG FAMILY INCOME
$61,667
AVG HOUSEHOLD INCOME
37.6%
WAGE / INCOME GAP [ % ]
62.4¢/ $1
WAGE / INCOME GAP [ $ ]
0.57
INEQUALITY / GINI INDEX
1,052
TOTAL POPULATION
525
MALE POPULATION
527
FEMALE POPULATION
99.62
MALES / 100 FEMALES
100.38
FEMALES / 100 MALES
20.9
MEDIAN AGE
2.6
AVG FAMILY SIZE
2.3
AVG HOUSEHOLD SIZE
563
LABOR FORCE [ PEOPLE ]
55.6%
PERCENT IN LABOR FORCE
8.0%
UNEMPLOYMENT RATE
Emory Zip Codes
Emory Area Codes
Income in Emory
Income Overview in Emory
Per Capita Income in Emory is $20,631, while median incomes of families and households are $64,688 and $61,667 respectively.
| Characteristic | Number | Measure |
| Per Capita Income | 1,052 | $20,631 |
| Median Family Income | 115 | $64,688 |
| Mean Family Income | 115 | $136,182 |
| Median Household Income | 154 | $61,667 |
| Mean Household Income | 154 | $115,724 |
| Income Deficit | 115 | $0 |
| Wage / Income Gap (%) | 1,052 | 37.64% |
| Wage / Income Gap ($) | 1,052 | 62.36¢ per $1 |
| Gini / Inequality Index | 1,052 | 0.57 |
Earnings by Sex in Emory
Average Earnings in Emory are $5,273, $6,546 for men and $4,082 for women, a difference of 37.6%.
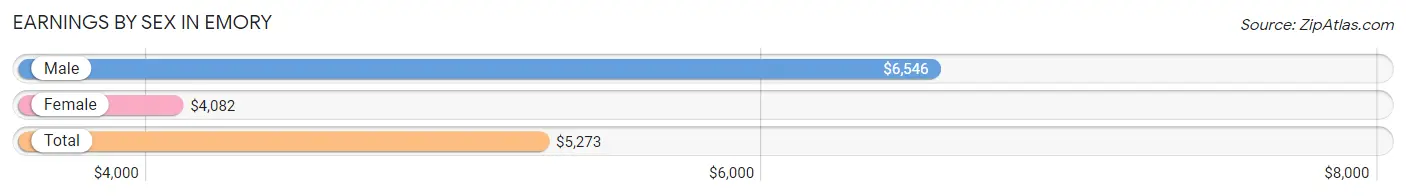
| Sex | Number | Average Earnings |
| Male | 352 (47.8%) | $6,546 |
| Female | 384 (52.2%) | $4,082 |
| Total | 736 (100.0%) | $5,273 |
Earnings by Sex by Income Bracket in Emory
The most common earnings brackets in Emory are $5,000 to $7,499 for men (97 | 27.6%) and $2,500 to $4,999 for women (128 | 33.3%).
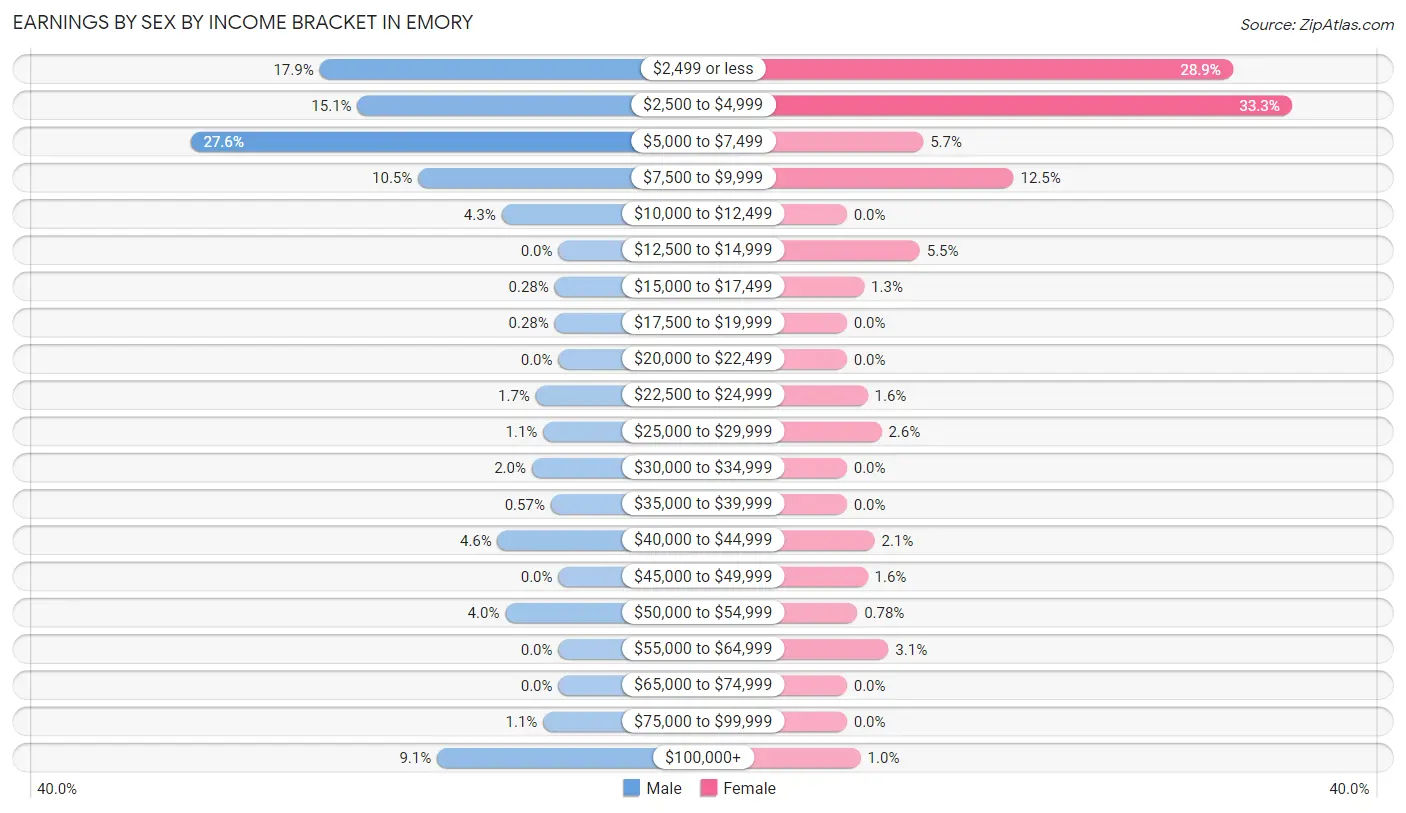
| Income | Male | Female |
| $2,499 or less | 63 (17.9%) | 111 (28.9%) |
| $2,500 to $4,999 | 53 (15.1%) | 128 (33.3%) |
| $5,000 to $7,499 | 97 (27.6%) | 22 (5.7%) |
| $7,500 to $9,999 | 37 (10.5%) | 48 (12.5%) |
| $10,000 to $12,499 | 15 (4.3%) | 0 (0.0%) |
| $12,500 to $14,999 | 0 (0.0%) | 21 (5.5%) |
| $15,000 to $17,499 | 1 (0.3%) | 5 (1.3%) |
| $17,500 to $19,999 | 1 (0.3%) | 0 (0.0%) |
| $20,000 to $22,499 | 0 (0.0%) | 0 (0.0%) |
| $22,500 to $24,999 | 6 (1.7%) | 6 (1.6%) |
| $25,000 to $29,999 | 4 (1.1%) | 10 (2.6%) |
| $30,000 to $34,999 | 7 (2.0%) | 0 (0.0%) |
| $35,000 to $39,999 | 2 (0.6%) | 0 (0.0%) |
| $40,000 to $44,999 | 16 (4.5%) | 8 (2.1%) |
| $45,000 to $49,999 | 0 (0.0%) | 6 (1.6%) |
| $50,000 to $54,999 | 14 (4.0%) | 3 (0.8%) |
| $55,000 to $64,999 | 0 (0.0%) | 12 (3.1%) |
| $65,000 to $74,999 | 0 (0.0%) | 0 (0.0%) |
| $75,000 to $99,999 | 4 (1.1%) | 0 (0.0%) |
| $100,000+ | 32 (9.1%) | 4 (1.0%) |
| Total | 352 (100.0%) | 384 (100.0%) |
Earnings by Sex by Educational Attainment in Emory
Average earnings in Emory are $43,750 for men and $35,000 for women, a difference of 20.0%. Men with an educational attainment of high school diploma enjoy the highest average annual earnings of $43,125, while those with bachelor's degree education earn the least with $32,500. Women with an educational attainment of college or associate's degree earn the most with the average annual earnings of $43,594, while those with college or associate's degree education have the smallest earnings of $43,594.
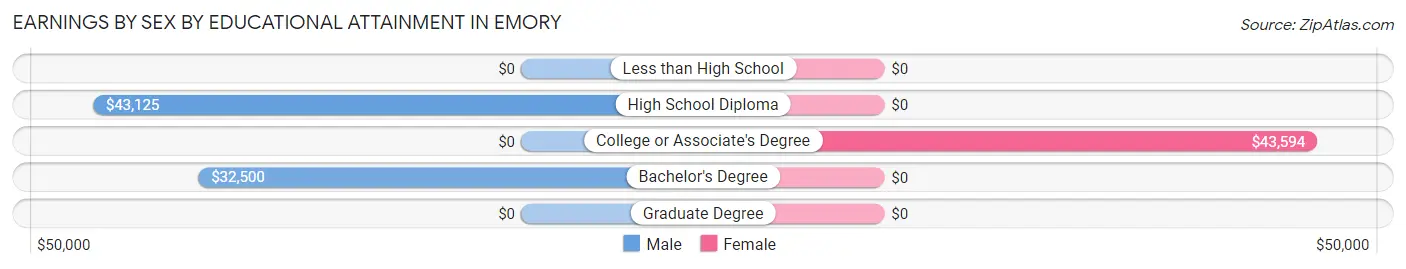
| Educational Attainment | Male Income | Female Income |
| Less than High School | - | - |
| High School Diploma | $43,125 | $0 |
| College or Associate's Degree | - | - |
| Bachelor's Degree | $32,500 | $0 |
| Graduate Degree | - | - |
| Total | $43,750 | $35,000 |
Family Income in Emory
Family Income Brackets in Emory
According to the Emory family income data, there are 30 families falling into the $100,000 to $149,999 income range, which is the most common income bracket and makes up 26.1% of all families.
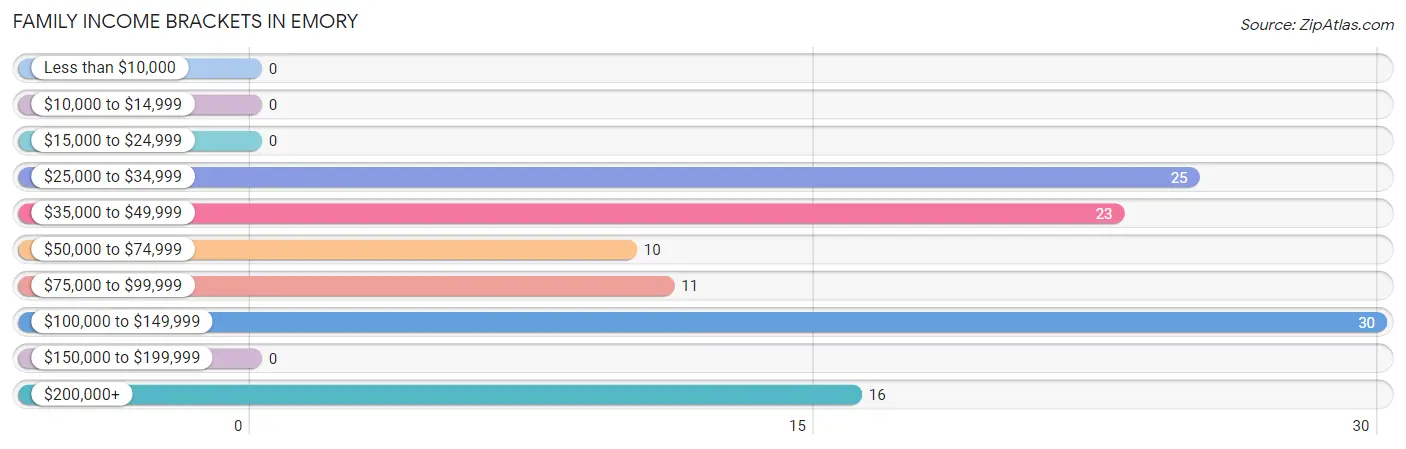
| Income Bracket | # Families | % Families |
| Less than $10,000 | 0 | 0.0% |
| $10,000 to $14,999 | 0 | 0.0% |
| $15,000 to $24,999 | 0 | 0.0% |
| $25,000 to $34,999 | 25 | 21.7% |
| $35,000 to $49,999 | 23 | 20.0% |
| $50,000 to $74,999 | 10 | 8.7% |
| $75,000 to $99,999 | 11 | 9.6% |
| $100,000 to $149,999 | 30 | 26.1% |
| $150,000 to $199,999 | 0 | 0.0% |
| $200,000+ | 16 | 13.9% |
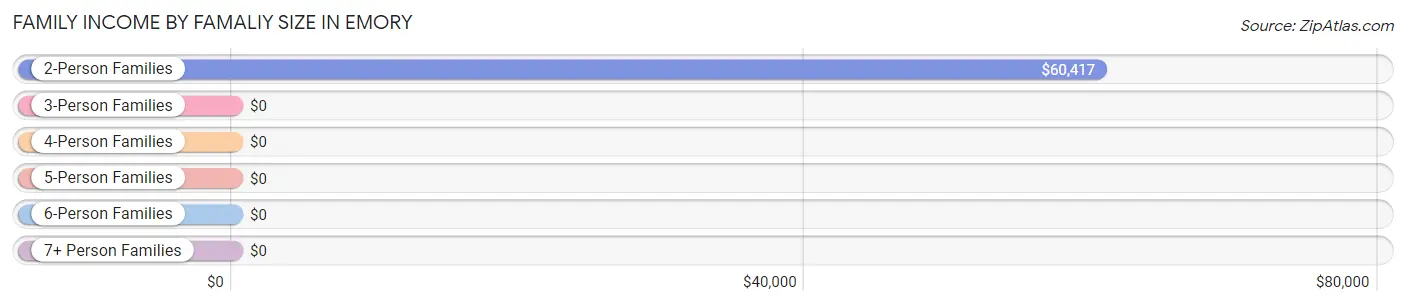
Family Income by Famaliy Size in Emory
2-person families (80 | 69.6%) account for the highest median family income in Emory with $60,417 per family, while 2-person families (80 | 69.6%) have the highest median income of $30,208 per family member.
| Income Bracket | # Families | Median Income |
| 2-Person Families | 80 (69.6%) | $60,417 |
| 3-Person Families | 21 (18.3%) | $0 |
| 4-Person Families | 10 (8.7%) | $0 |
| 5-Person Families | 4 (3.5%) | $0 |
| 6-Person Families | 0 (0.0%) | $0 |
| 7+ Person Families | 0 (0.0%) | $0 |
| Total | 115 (100.0%) | $64,688 |
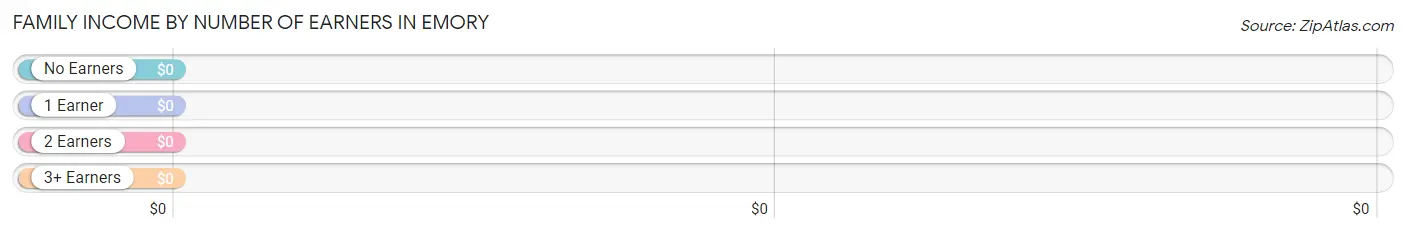
Family Income by Number of Earners in Emory
| Number of Earners | # Families | Median Income |
| No Earners | 40 (34.8%) | $0 |
| 1 Earner | 39 (33.9%) | $0 |
| 2 Earners | 31 (27.0%) | $0 |
| 3+ Earners | 5 (4.3%) | $0 |
| Total | 115 (100.0%) | $64,688 |
Household Income in Emory
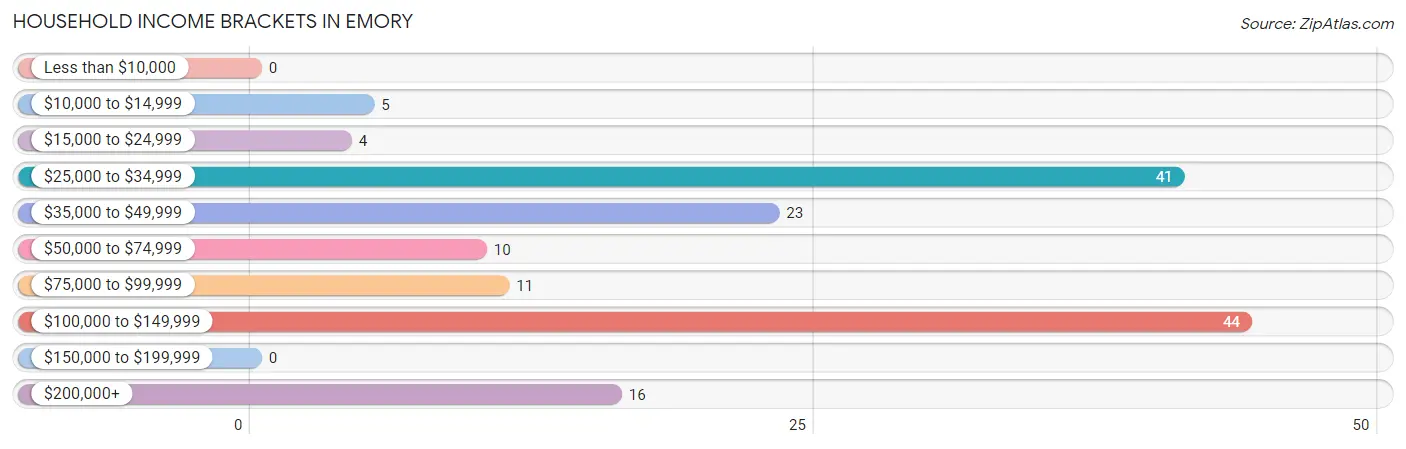
Household Income Brackets in Emory
With 44 households falling in the category, the $100,000 to $149,999 income range is the most frequent in Emory, accounting for 28.6% of all households.
| Income Bracket | # Households | % Households |
| Less than $10,000 | 0 | 0.0% |
| $10,000 to $14,999 | 5 | 3.2% |
| $15,000 to $24,999 | 4 | 2.6% |
| $25,000 to $34,999 | 41 | 26.6% |
| $35,000 to $49,999 | 23 | 14.9% |
| $50,000 to $74,999 | 10 | 6.5% |
| $75,000 to $99,999 | 11 | 7.1% |
| $100,000 to $149,999 | 44 | 28.6% |
| $150,000 to $199,999 | 0 | 0.0% |
| $200,000+ | 16 | 10.4% |
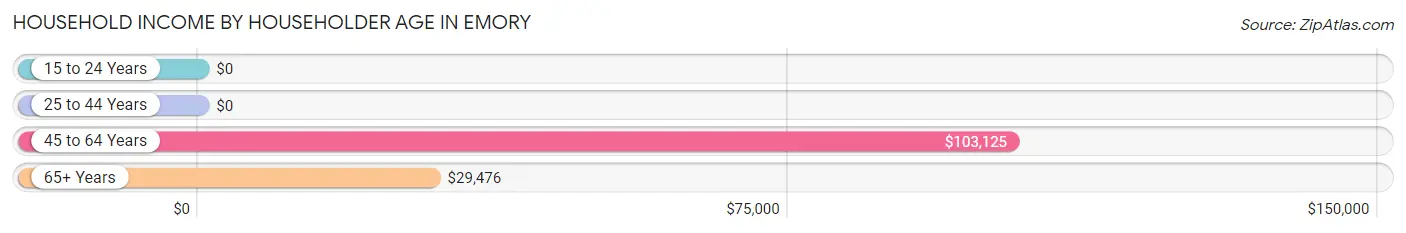
Household Income by Householder Age in Emory
The median household income in Emory is $61,667, with the highest median household income of $103,125 found in the 45 to 64 years age bracket for the primary householder. A total of 70 households (45.5%) fall into this category.
| Income Bracket | # Households | Median Income |
| 15 to 24 Years | 0 (0.0%) | $0 |
| 25 to 44 Years | 5 (3.3%) | $0 |
| 45 to 64 Years | 70 (45.5%) | $103,125 |
| 65+ Years | 79 (51.3%) | $29,476 |
| Total | 154 (100.0%) | $61,667 |
Poverty in Emory
Income Below Poverty by Sex and Age in Emory
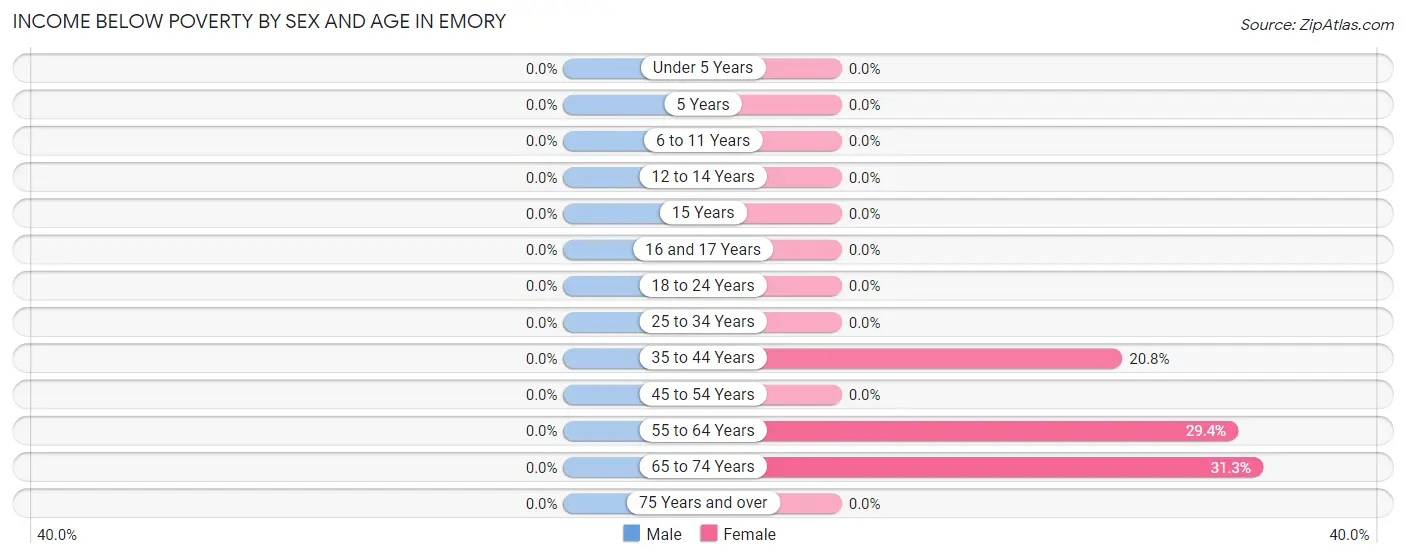
| Age Bracket | Male | Female |
| Under 5 Years | 0 (0.0%) | 0 (0.0%) |
| 5 Years | 0 (0.0%) | 0 (0.0%) |
| 6 to 11 Years | 0 (0.0%) | 0 (0.0%) |
| 12 to 14 Years | 0 (0.0%) | 0 (0.0%) |
| 15 Years | 0 (0.0%) | 0 (0.0%) |
| 16 and 17 Years | 0 (0.0%) | 0 (0.0%) |
| 18 to 24 Years | 0 (0.0%) | 0 (0.0%) |
| 25 to 34 Years | 0 (0.0%) | 0 (0.0%) |
| 35 to 44 Years | 0 (0.0%) | 5 (20.8%) |
| 45 to 54 Years | 0 (0.0%) | 0 (0.0%) |
| 55 to 64 Years | 0 (0.0%) | 5 (29.4%) |
| 65 to 74 Years | 0 (0.0%) | 5 (31.2%) |
| 75 Years and over | 0 (0.0%) | 0 (0.0%) |
| Total | 0 (0.0%) | 15 (7.6%) |
Income Above Poverty by Sex and Age in Emory
According to the poverty statistics in Emory, males aged 6 to 11 years and females aged 6 to 11 years are the age groups that are most secure financially, with 100.0% of males and 100.0% of females in these age groups living above the poverty line.
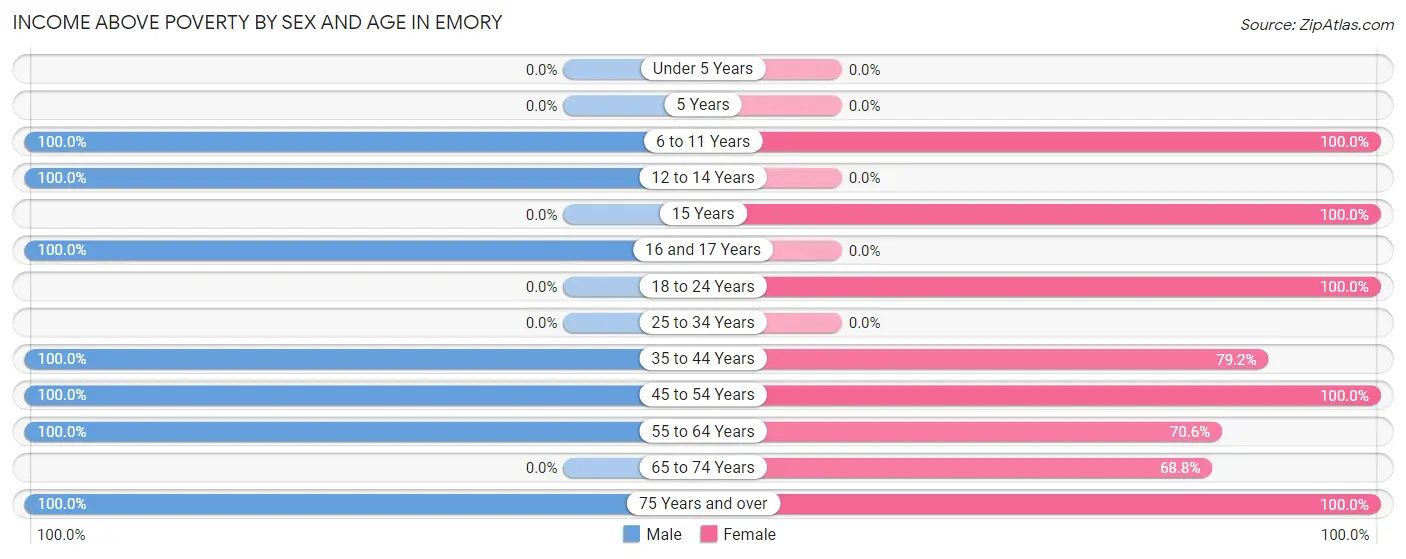
| Age Bracket | Male | Female |
| Under 5 Years | 0 (0.0%) | 0 (0.0%) |
| 5 Years | 0 (0.0%) | 0 (0.0%) |
| 6 to 11 Years | 5 (100.0%) | 25 (100.0%) |
| 12 to 14 Years | 4 (100.0%) | 0 (0.0%) |
| 15 Years | 0 (0.0%) | 6 (100.0%) |
| 16 and 17 Years | 7 (100.0%) | 0 (0.0%) |
| 18 to 24 Years | 0 (0.0%) | 20 (100.0%) |
| 25 to 34 Years | 0 (0.0%) | 0 (0.0%) |
| 35 to 44 Years | 16 (100.0%) | 19 (79.2%) |
| 45 to 54 Years | 33 (100.0%) | 38 (100.0%) |
| 55 to 64 Years | 29 (100.0%) | 12 (70.6%) |
| 65 to 74 Years | 0 (0.0%) | 11 (68.8%) |
| 75 Years and over | 73 (100.0%) | 50 (100.0%) |
| Total | 167 (100.0%) | 181 (92.3%) |
Income Below Poverty Among Married-Couple Families in Emory
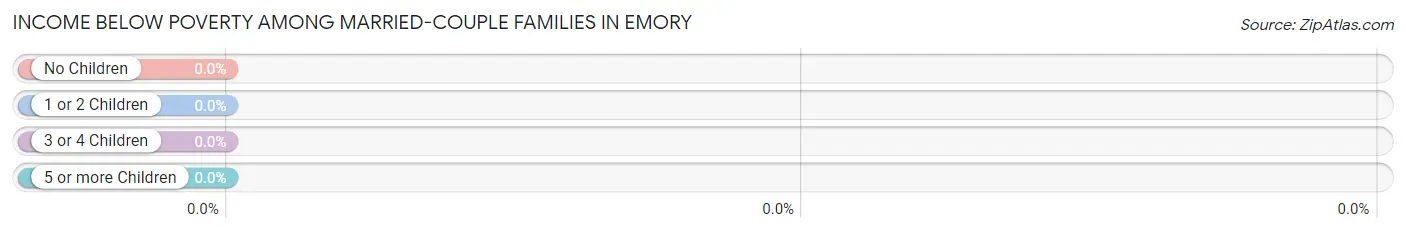
| Children | Above Poverty | Below Poverty |
| No Children | 83 (100.0%) | 0 (0.0%) |
| 1 or 2 Children | 26 (100.0%) | 0 (0.0%) |
| 3 or 4 Children | 0 (0.0%) | 0 (0.0%) |
| 5 or more Children | 0 (0.0%) | 0 (0.0%) |
| Total | 109 (100.0%) | 0 (0.0%) |
Income Below Poverty Among Single-Parent Households in Emory
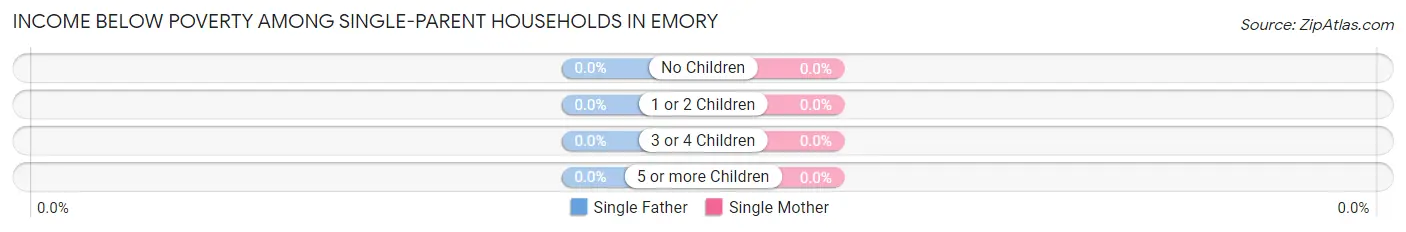
| Children | Single Father | Single Mother |
| No Children | 0 (0.0%) | 0 (0.0%) |
| 1 or 2 Children | 0 (0.0%) | 0 (0.0%) |
| 3 or 4 Children | 0 (0.0%) | 0 (0.0%) |
| 5 or more Children | 0 (0.0%) | 0 (0.0%) |
| Total | 0 (0.0%) | 0 (0.0%) |
Income Below Poverty Among Married-Couple vs Single-Parent Households in Emory
| Children | Married-Couple Families | Single-Parent Households |
| No Children | 0 (0.0%) | 0 (0.0%) |
| 1 or 2 Children | 0 (0.0%) | 0 (0.0%) |
| 3 or 4 Children | 0 (0.0%) | 0 (0.0%) |
| 5 or more Children | 0 (0.0%) | 0 (0.0%) |
| Total | 0 (0.0%) | 0 (0.0%) |
Race in Emory
The most populous races in Emory are White / Caucasian (793 | 75.4%), Black / African American (191 | 18.2%), and Two or more Races (35 | 3.3%).
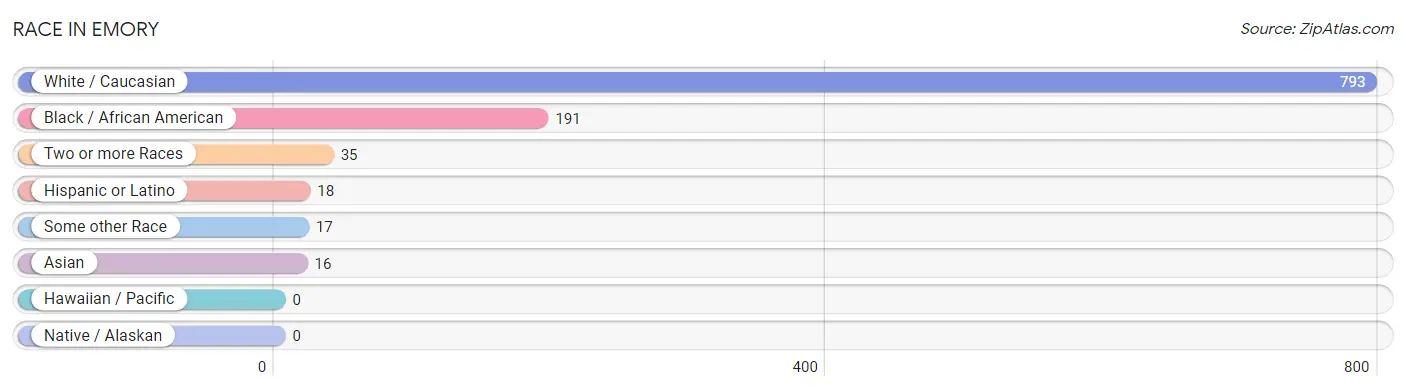
| Race | # Population | % Population |
| Asian | 16 | 1.5% |
| Black / African American | 191 | 18.2% |
| Hawaiian / Pacific | 0 | 0.0% |
| Hispanic or Latino | 18 | 1.7% |
| Native / Alaskan | 0 | 0.0% |
| White / Caucasian | 793 | 75.4% |
| Two or more Races | 35 | 3.3% |
| Some other Race | 17 | 1.6% |
| Total | 1,052 | 100.0% |
Ancestry in Emory
The most populous ancestries reported in Emory are American (201 | 19.1%), English (158 | 15.0%), Irish (95 | 9.0%), German (87 | 8.3%), and Subsaharan African (54 | 5.1%), together accounting for 56.6% of all Emory residents.
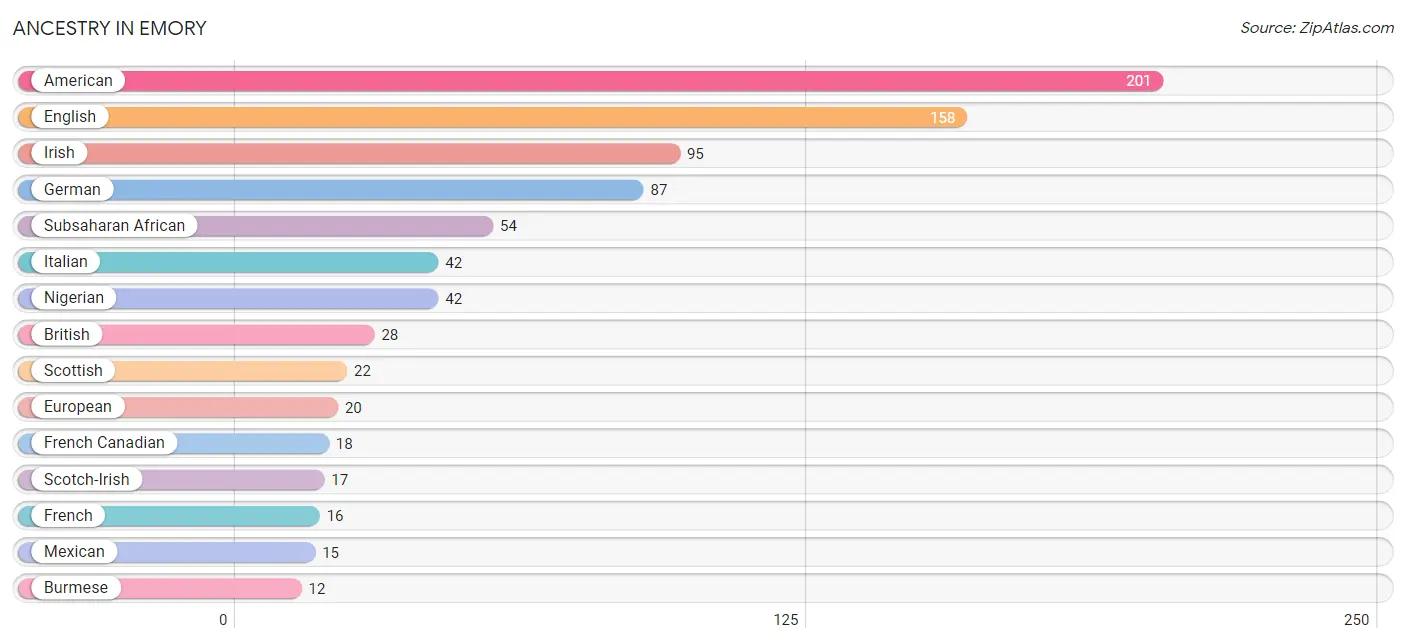
| Ancestry | # Population | % Population |
| American | 201 | 19.1% |
| British | 28 | 2.7% |
| Burmese | 12 | 1.1% |
| Central American | 3 | 0.3% |
| Cherokee | 1 | 0.1% |
| English | 158 | 15.0% |
| European | 20 | 1.9% |
| French | 16 | 1.5% |
| French Canadian | 18 | 1.7% |
| German | 87 | 8.3% |
| Ghanaian | 12 | 1.1% |
| Haitian | 6 | 0.6% |
| Honduran | 3 | 0.3% |
| Irish | 95 | 9.0% |
| Italian | 42 | 4.0% |
| Mexican | 15 | 1.4% |
| Native Hawaiian | 12 | 1.1% |
| Nigerian | 42 | 4.0% |
| Scotch-Irish | 17 | 1.6% |
| Scottish | 22 | 2.1% |
| Sri Lankan | 9 | 0.9% |
| Subsaharan African | 54 | 5.1% |
| Welsh | 12 | 1.1% | View All 23 Rows |
Immigrants in Emory
The most numerous immigrant groups reported in Emory came from Europe (10 | 0.9%), Northern Europe (10 | 0.9%), Central America (8 | 0.8%), Latin America (8 | 0.8%), and Mexico (8 | 0.8%), together accounting for 4.2% of all Emory residents.
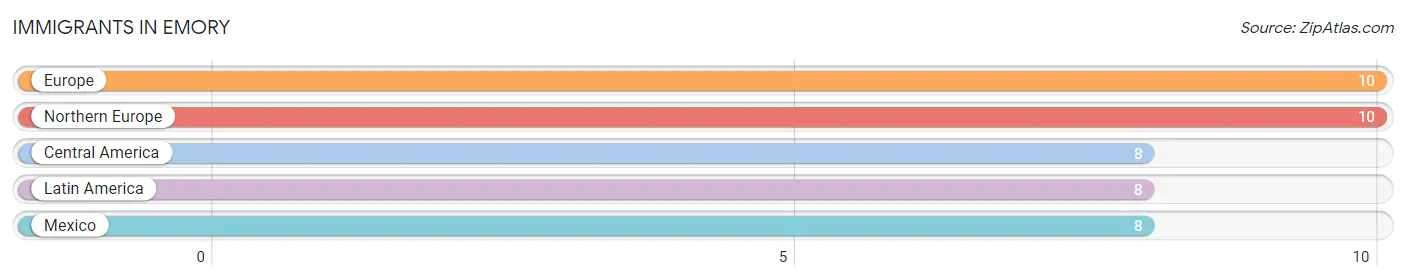
| Immigration Origin | # Population | % Population |
| Central America | 8 | 0.8% |
| Europe | 10 | 0.9% |
| Latin America | 8 | 0.8% |
| Mexico | 8 | 0.8% |
| Northern Europe | 10 | 0.9% | View All 5 Rows |
Sex and Age in Emory
Sex and Age in Emory
The most populous age groups in Emory are 15 to 19 Years (187 | 35.6%) for men and 15 to 19 Years (180 | 34.2%) for women.
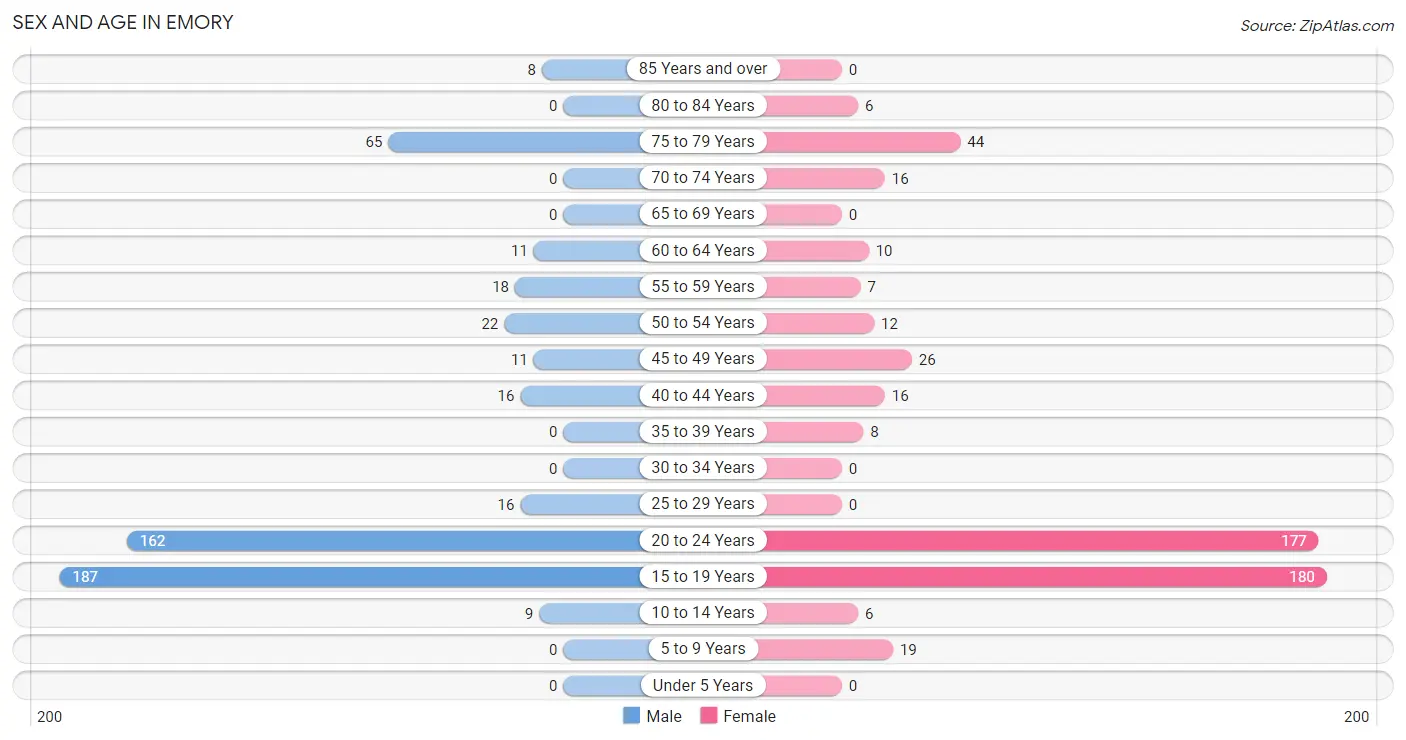
| Age Bracket | Male | Female |
| Under 5 Years | 0 (0.0%) | 0 (0.0%) |
| 5 to 9 Years | 0 (0.0%) | 19 (3.6%) |
| 10 to 14 Years | 9 (1.7%) | 6 (1.1%) |
| 15 to 19 Years | 187 (35.6%) | 180 (34.2%) |
| 20 to 24 Years | 162 (30.9%) | 177 (33.6%) |
| 25 to 29 Years | 16 (3.0%) | 0 (0.0%) |
| 30 to 34 Years | 0 (0.0%) | 0 (0.0%) |
| 35 to 39 Years | 0 (0.0%) | 8 (1.5%) |
| 40 to 44 Years | 16 (3.0%) | 16 (3.0%) |
| 45 to 49 Years | 11 (2.1%) | 26 (4.9%) |
| 50 to 54 Years | 22 (4.2%) | 12 (2.3%) |
| 55 to 59 Years | 18 (3.4%) | 7 (1.3%) |
| 60 to 64 Years | 11 (2.1%) | 10 (1.9%) |
| 65 to 69 Years | 0 (0.0%) | 0 (0.0%) |
| 70 to 74 Years | 0 (0.0%) | 16 (3.0%) |
| 75 to 79 Years | 65 (12.4%) | 44 (8.4%) |
| 80 to 84 Years | 0 (0.0%) | 6 (1.1%) |
| 85 Years and over | 8 (1.5%) | 0 (0.0%) |
| Total | 525 (100.0%) | 527 (100.0%) |
Families and Households in Emory
Median Family Size in Emory
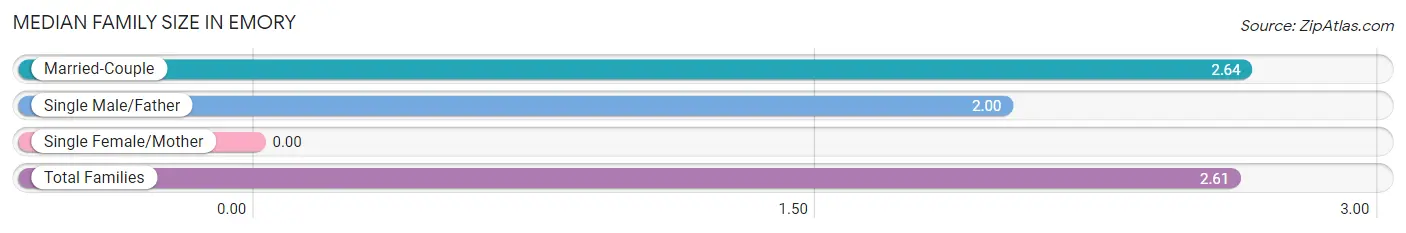
| Family Type | # Families | Family Size |
| Married-Couple | 109 (94.8%) | 2.64 |
| Single Male/Father | 6 (5.2%) | 2.00 |
| Single Female/Mother | 0 (0.0%) | - |
| Total Families | 115 (100.0%) | 2.61 |
Median Household Size in Emory
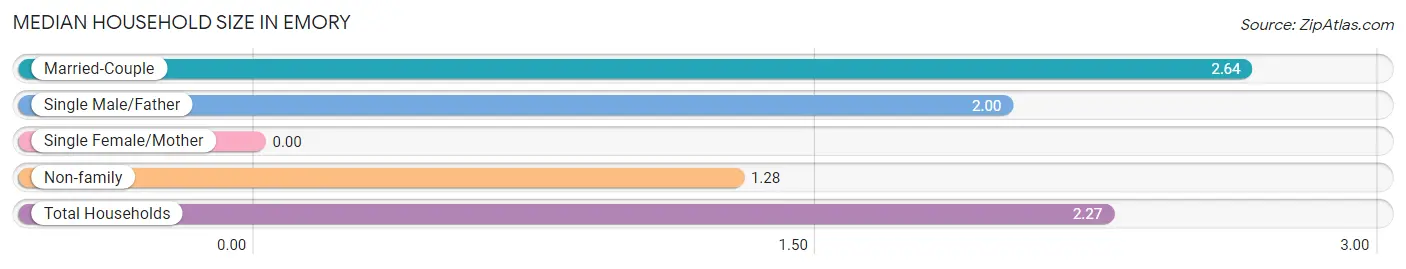
| Household Type | # Households | Household Size |
| Married-Couple | 109 (70.8%) | 2.64 |
| Single Male/Father | 6 (3.9%) | 2.00 |
| Single Female/Mother | 0 (0.0%) | - |
| Non-family | 39 (25.3%) | 1.28 |
| Total Households | 154 (100.0%) | 2.27 |
Household Size by Marriage Status in Emory
Out of a total of 154 households in Emory, 115 (74.7%) are family households, while 39 (25.3%) are nonfamily households. The most numerous type of family households are 2-person households, comprising 80, and the most common type of nonfamily households are 1-person households, comprising 25.
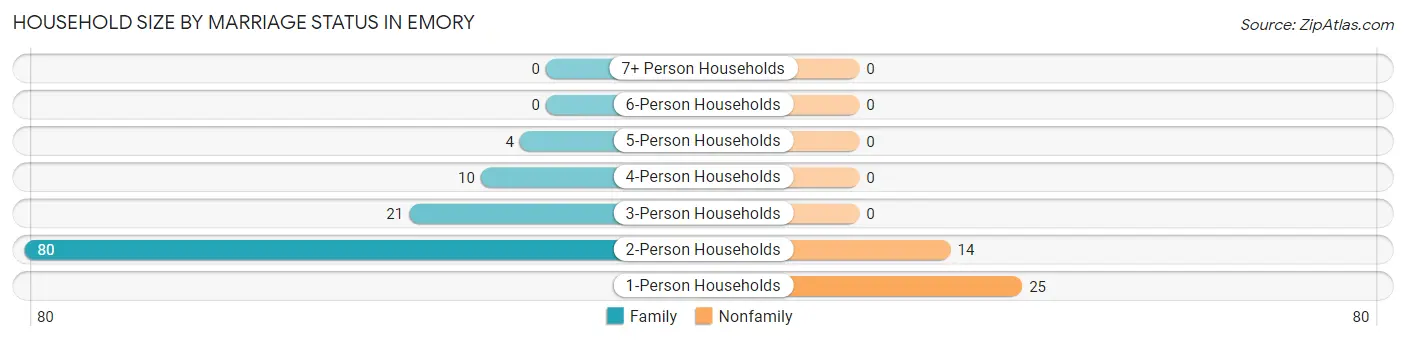
| Household Size | Family Households | Nonfamily Households |
| 1-Person Households | - | 25 (16.2%) |
| 2-Person Households | 80 (51.9%) | 14 (9.1%) |
| 3-Person Households | 21 (13.6%) | 0 (0.0%) |
| 4-Person Households | 10 (6.5%) | 0 (0.0%) |
| 5-Person Households | 4 (2.6%) | 0 (0.0%) |
| 6-Person Households | 0 (0.0%) | 0 (0.0%) |
| 7+ Person Households | 0 (0.0%) | 0 (0.0%) |
| Total | 115 (74.7%) | 39 (25.3%) |
Female Fertility in Emory
Fertility by Age in Emory
| Age Bracket | Women with Births | Births / 1,000 Women |
| 15 to 19 years | 0 (0.0%) | 0.0 |
| 20 to 34 years | 0 (0.0%) | 0.0 |
| 35 to 50 years | 0 (0.0%) | 0.0 |
| Total | 0 (0.0%) | 0.0 |
Fertility by Age by Marriage Status in Emory
| Age Bracket | Married | Unmarried |
| 15 to 19 years | 0 (0.0%) | 0 (0.0%) |
| 20 to 34 years | 0 (0.0%) | 0 (0.0%) |
| 35 to 50 years | 0 (0.0%) | 0 (0.0%) |
| Total | 0 (0.0%) | 0 (0.0%) |
Fertility by Education in Emory
| Educational Attainment | Women with Births | Births / 1,000 Women |
| Less than High School | 0 (0.0%) | 0.0 |
| High School Diploma | 0 (0.0%) | 0.0 |
| College or Associate's Degree | 0 (0.0%) | 0.0 |
| Bachelor's Degree | 0 (0.0%) | 0.0 |
| Graduate Degree | 0 (0.0%) | 0.0 |
| Total | 0 (0.0%) | 0.0 |
Fertility by Education by Marriage Status in Emory
| Educational Attainment | Married | Unmarried |
| Less than High School | 0 (0.0%) | 0 (0.0%) |
| High School Diploma | 0 (0.0%) | 0 (0.0%) |
| College or Associate's Degree | 0 (0.0%) | 0 (0.0%) |
| Bachelor's Degree | 0 (0.0%) | 0 (0.0%) |
| Graduate Degree | 0 (0.0%) | 0 (0.0%) |
| Total | 0 (0.0%) | 0 (0.0%) |
Employment Characteristics in Emory
Employment by Class of Employer in Emory
Among the 460 employed individuals in Emory, private company employees (336 | 73.0%), not-for-profit organizations (75 | 16.3%), and local government employees (29 | 6.3%) make up the most common classes of employment.
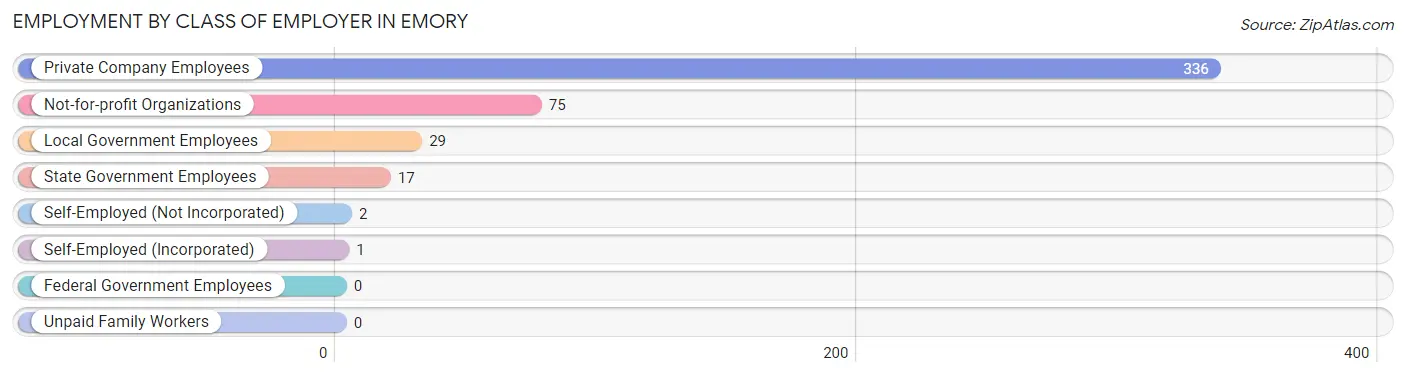
| Employer Class | # Employees | % Employees |
| Private Company Employees | 336 | 73.0% |
| Self-Employed (Incorporated) | 1 | 0.2% |
| Self-Employed (Not Incorporated) | 2 | 0.4% |
| Not-for-profit Organizations | 75 | 16.3% |
| Local Government Employees | 29 | 6.3% |
| State Government Employees | 17 | 3.7% |
| Federal Government Employees | 0 | 0.0% |
| Unpaid Family Workers | 0 | 0.0% |
| Total | 460 | 100.0% |
Employment Status by Age in Emory
According to the labor force statistics for Emory, out of the total population over 16 years of age (1,012), 55.6% or 563 individuals are in the labor force, with 8.0% or 45 of them unemployed. The age group with the highest labor force participation rate is 25 to 29 years, with 100.0% or 16 individuals in the labor force. Within the labor force, the 55 to 59 years age range has the highest percentage of unemployed individuals, with 40.0% or 6 of them being unemployed.
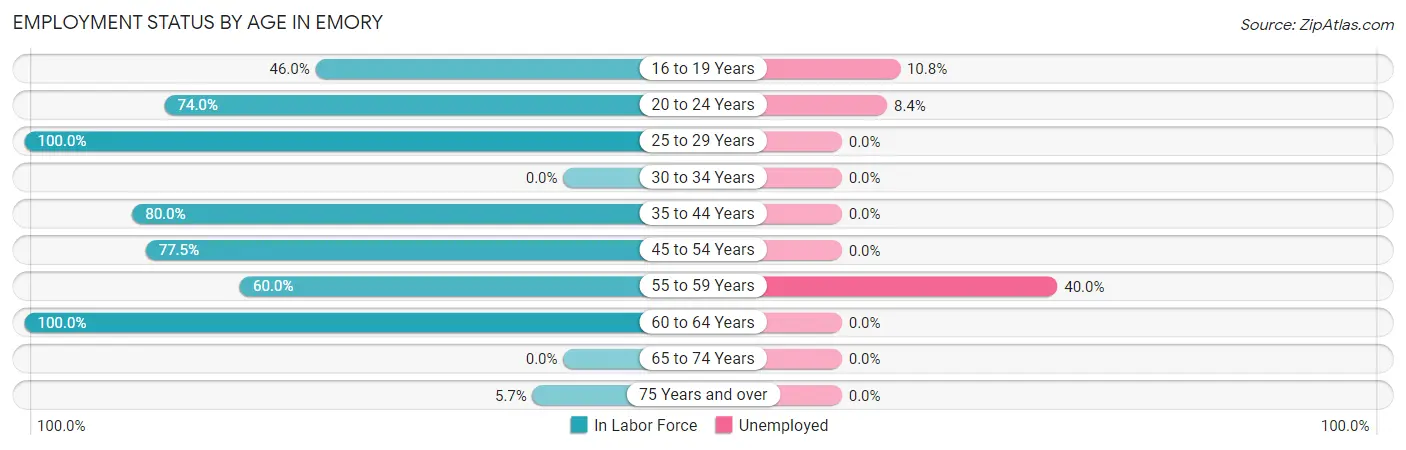
| Age Bracket | In Labor Force | Unemployed |
| 16 to 19 Years | 166 (46.0%) | 18 (10.8%) |
| 20 to 24 Years | 251 (74.0%) | 21 (8.4%) |
| 25 to 29 Years | 16 (100.0%) | 0 (0.0%) |
| 30 to 34 Years | 0 (0.0%) | 0 (0.0%) |
| 35 to 44 Years | 32 (80.0%) | 0 (0.0%) |
| 45 to 54 Years | 55 (77.5%) | 0 (0.0%) |
| 55 to 59 Years | 15 (60.0%) | 6 (40.0%) |
| 60 to 64 Years | 21 (100.0%) | 0 (0.0%) |
| 65 to 74 Years | 0 (0.0%) | 0 (0.0%) |
| 75 Years and over | 7 (5.7%) | 0 (0.0%) |
| Total | 563 (55.6%) | 45 (8.0%) |
Employment Status by Educational Attainment in Emory
According to labor force statistics for Emory, 80.3% of individuals (139) out of the total population between 25 and 64 years of age (173) are in the labor force, with 4.3% or 6 of them being unemployed. The group with the highest labor force participation rate are those with the educational attainment of high school diploma, with 100.0% or 15 individuals in the labor force. Within the labor force, individuals with bachelor's degree or higher education have the highest percentage of unemployment, with 10.7% or 6 of them being unemployed.
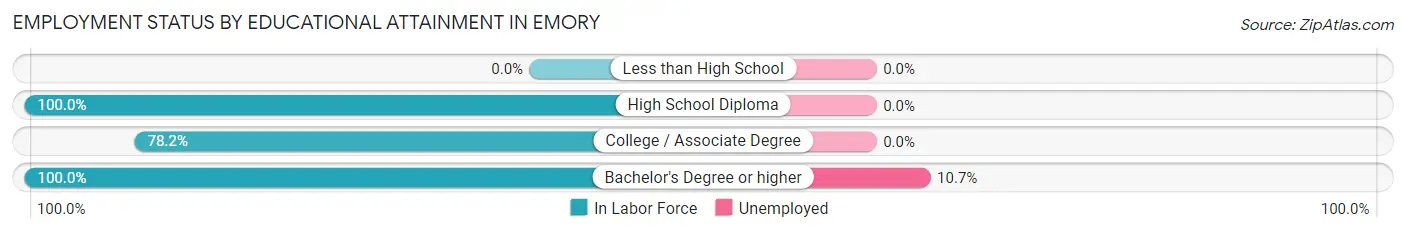
| Educational Attainment | In Labor Force | Unemployed |
| Less than High School | 0 (0.0%) | 0 (0.0%) |
| High School Diploma | 15 (100.0%) | 0 (0.0%) |
| College / Associate Degree | 68 (78.2%) | 0 (0.0%) |
| Bachelor's Degree or higher | 56 (100.0%) | 6 (10.7%) |
| Total | 139 (80.3%) | 7 (4.3%) |
Employment Occupations by Sex in Emory
Management, Business, Science and Arts Occupations
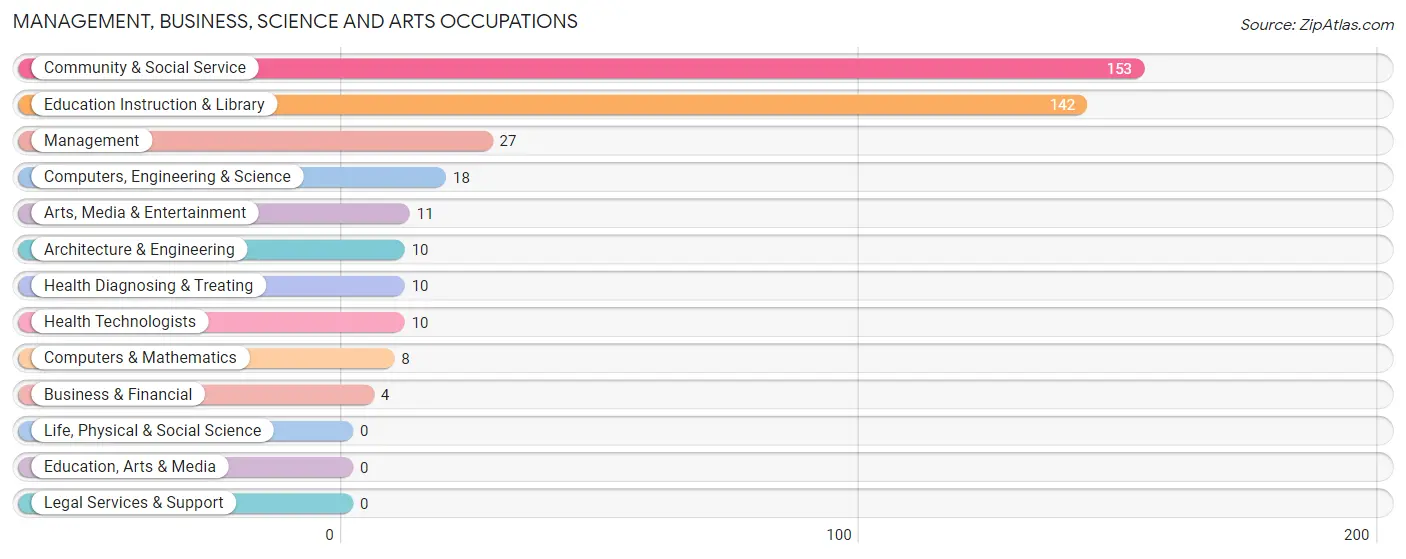
The most common Management, Business, Science and Arts occupations in Emory are Community & Social Service (153 | 29.5%), Education Instruction & Library (142 | 27.4%), Management (27 | 5.2%), Computers, Engineering & Science (18 | 3.5%), and Arts, Media & Entertainment (11 | 2.1%).
Management, Business, Science and Arts Occupations by Sex
Within the Management, Business, Science and Arts occupations in Emory, the most male-oriented occupations are Management (100.0%), Architecture & Engineering (100.0%), and Arts, Media & Entertainment (100.0%), while the most female-oriented occupations are Business & Financial (100.0%), Computers & Mathematics (100.0%), and Health Diagnosing & Treating (100.0%).
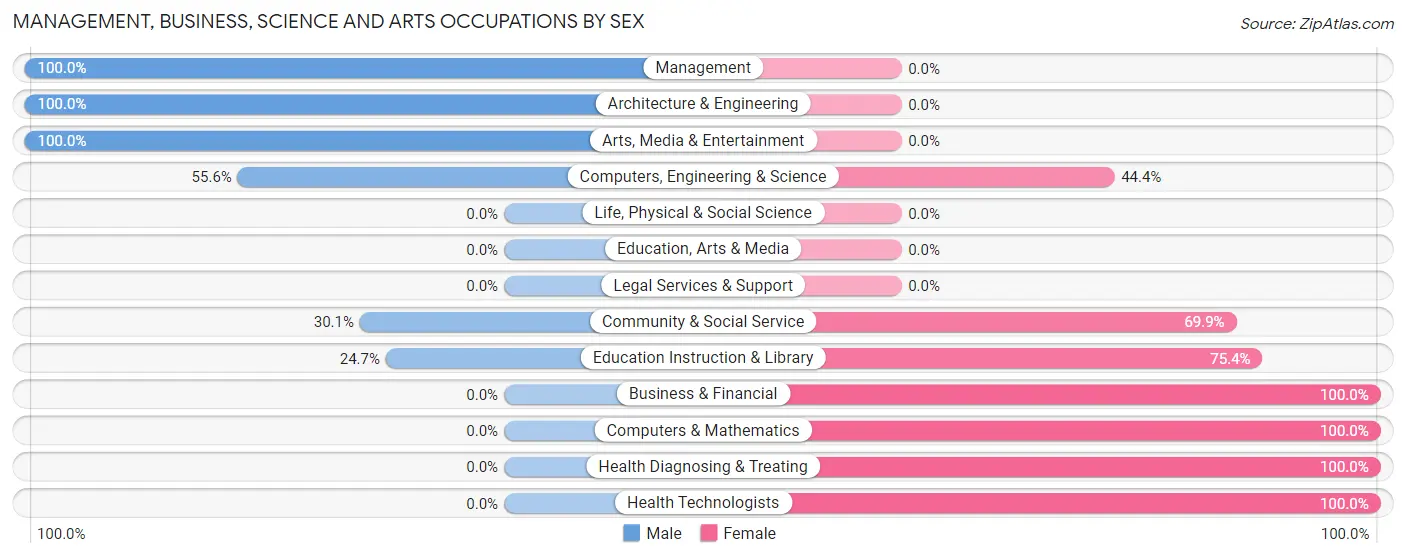
| Occupation | Male | Female |
| Management | 27 (100.0%) | 0 (0.0%) |
| Business & Financial | 0 (0.0%) | 4 (100.0%) |
| Computers, Engineering & Science | 10 (55.6%) | 8 (44.4%) |
| Computers & Mathematics | 0 (0.0%) | 8 (100.0%) |
| Architecture & Engineering | 10 (100.0%) | 0 (0.0%) |
| Life, Physical & Social Science | 0 (0.0%) | 0 (0.0%) |
| Community & Social Service | 46 (30.1%) | 107 (69.9%) |
| Education, Arts & Media | 0 (0.0%) | 0 (0.0%) |
| Legal Services & Support | 0 (0.0%) | 0 (0.0%) |
| Education Instruction & Library | 35 (24.6%) | 107 (75.3%) |
| Arts, Media & Entertainment | 11 (100.0%) | 0 (0.0%) |
| Health Diagnosing & Treating | 0 (0.0%) | 10 (100.0%) |
| Health Technologists | 0 (0.0%) | 10 (100.0%) |
| Total (Category) | 83 (39.2%) | 129 (60.9%) |
| Total (Overall) | 251 (48.5%) | 267 (51.5%) |
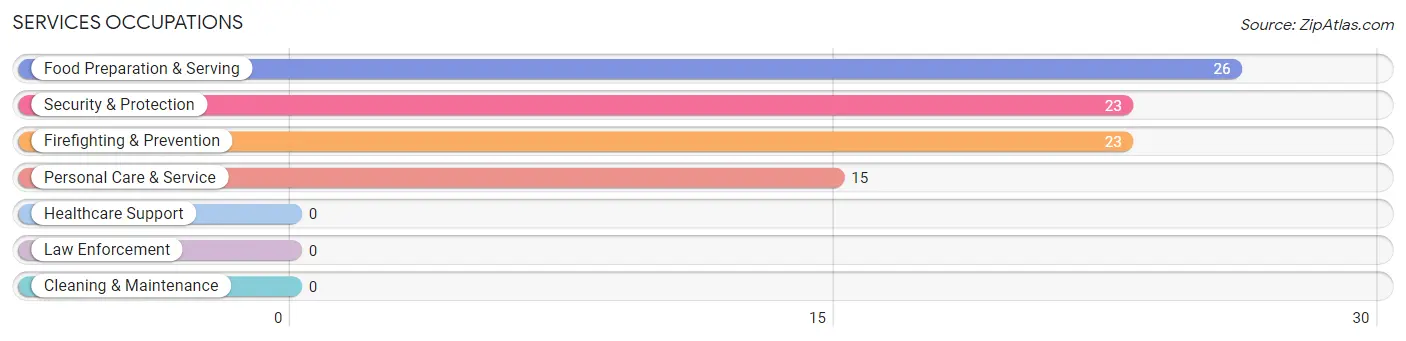
Services Occupations
The most common Services occupations in Emory are Food Preparation & Serving (26 | 5.0%), Security & Protection (23 | 4.4%), Firefighting & Prevention (23 | 4.4%), and Personal Care & Service (15 | 2.9%).
Services Occupations by Sex
Within the Services occupations in Emory, the most male-oriented occupations are Security & Protection (100.0%), Firefighting & Prevention (100.0%), and Personal Care & Service (13.3%), while the most female-oriented occupations are Food Preparation & Serving (100.0%), and Personal Care & Service (86.7%).
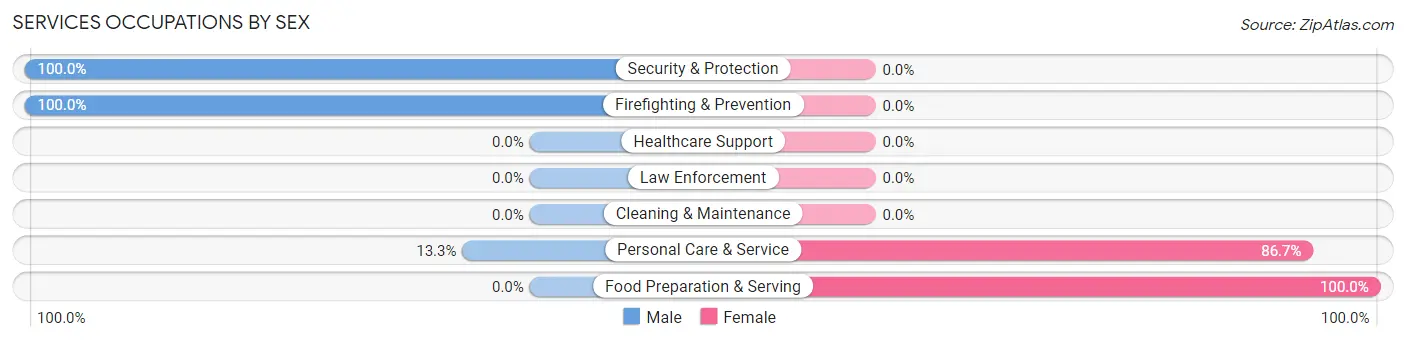
| Occupation | Male | Female |
| Healthcare Support | 0 (0.0%) | 0 (0.0%) |
| Security & Protection | 23 (100.0%) | 0 (0.0%) |
| Firefighting & Prevention | 23 (100.0%) | 0 (0.0%) |
| Law Enforcement | 0 (0.0%) | 0 (0.0%) |
| Food Preparation & Serving | 0 (0.0%) | 26 (100.0%) |
| Cleaning & Maintenance | 0 (0.0%) | 0 (0.0%) |
| Personal Care & Service | 2 (13.3%) | 13 (86.7%) |
| Total (Category) | 25 (39.1%) | 39 (60.9%) |
| Total (Overall) | 251 (48.5%) | 267 (51.5%) |
Sales and Office Occupations
The most common Sales and Office occupations in Emory are Office & Administration (144 | 27.8%), and Sales & Related (44 | 8.5%).
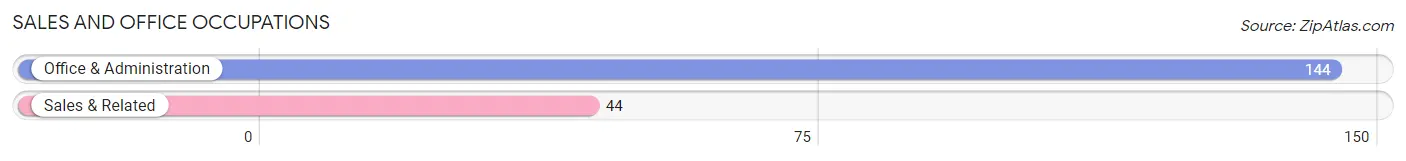
Sales and Office Occupations by Sex
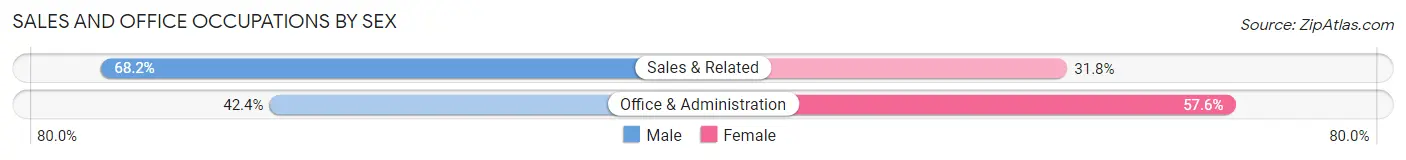
| Occupation | Male | Female |
| Sales & Related | 30 (68.2%) | 14 (31.8%) |
| Office & Administration | 61 (42.4%) | 83 (57.6%) |
| Total (Category) | 91 (48.4%) | 97 (51.6%) |
| Total (Overall) | 251 (48.5%) | 267 (51.5%) |
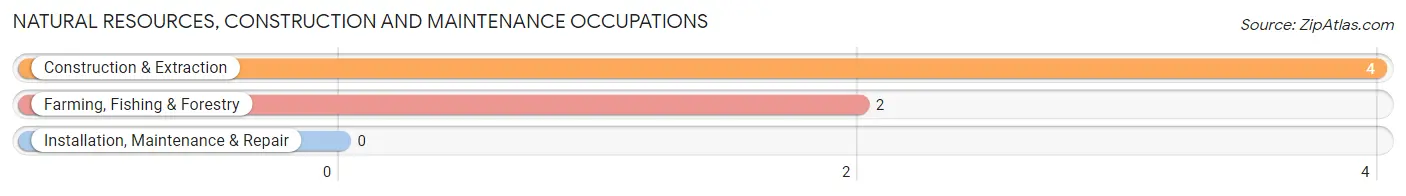
Natural Resources, Construction and Maintenance Occupations
The most common Natural Resources, Construction and Maintenance occupations in Emory are Construction & Extraction (4 | 0.8%), and Farming, Fishing & Forestry (2 | 0.4%).
Natural Resources, Construction and Maintenance Occupations by Sex
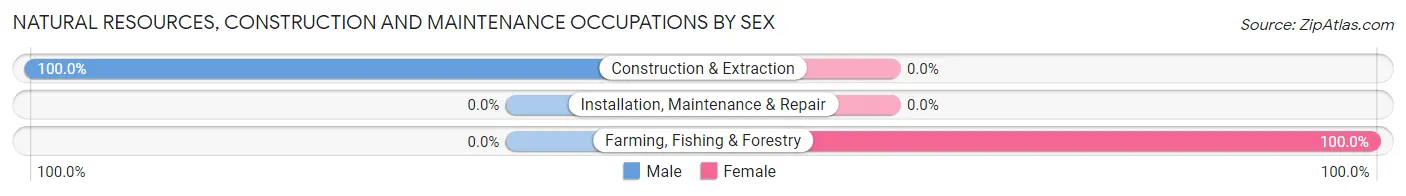
| Occupation | Male | Female |
| Farming, Fishing & Forestry | 0 (0.0%) | 2 (100.0%) |
| Construction & Extraction | 4 (100.0%) | 0 (0.0%) |
| Installation, Maintenance & Repair | 0 (0.0%) | 0 (0.0%) |
| Total (Category) | 4 (66.7%) | 2 (33.3%) |
| Total (Overall) | 251 (48.5%) | 267 (51.5%) |
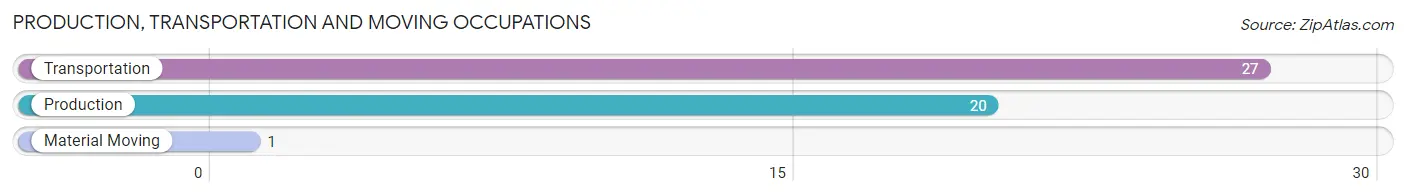
Production, Transportation and Moving Occupations
The most common Production, Transportation and Moving occupations in Emory are Transportation (27 | 5.2%), Production (20 | 3.9%), and Material Moving (1 | 0.2%).
Production, Transportation and Moving Occupations by Sex
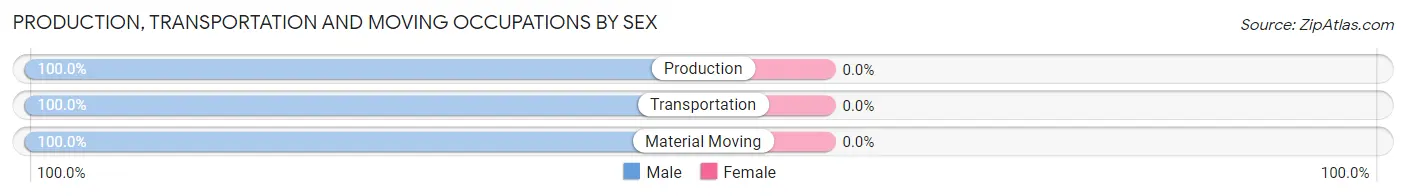
| Occupation | Male | Female |
| Production | 20 (100.0%) | 0 (0.0%) |
| Transportation | 27 (100.0%) | 0 (0.0%) |
| Material Moving | 1 (100.0%) | 0 (0.0%) |
| Total (Category) | 48 (100.0%) | 0 (0.0%) |
| Total (Overall) | 251 (48.5%) | 267 (51.5%) |
Employment Industries by Sex in Emory
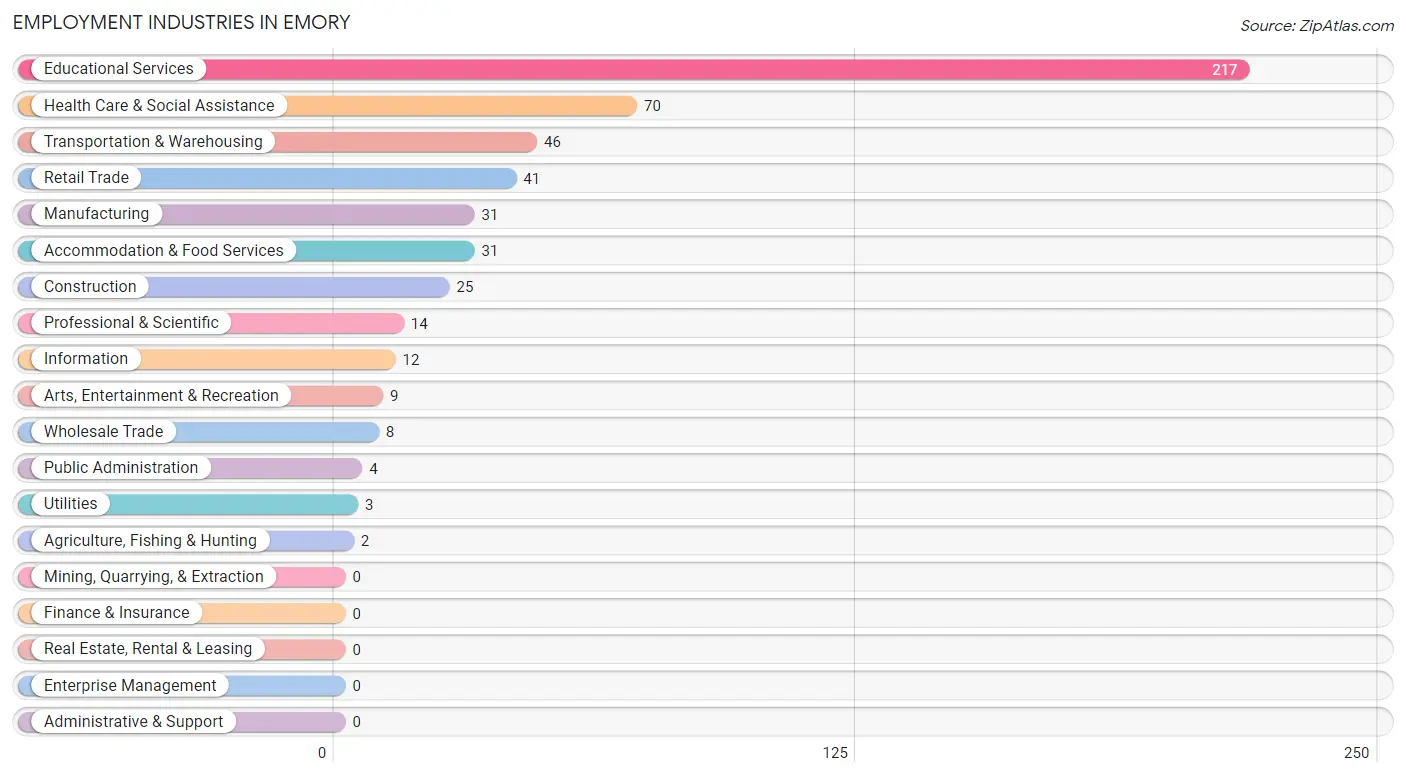
Employment Industries in Emory
The major employment industries in Emory include Educational Services (217 | 41.9%), Health Care & Social Assistance (70 | 13.5%), Transportation & Warehousing (46 | 8.9%), Retail Trade (41 | 7.9%), and Manufacturing (31 | 6.0%).
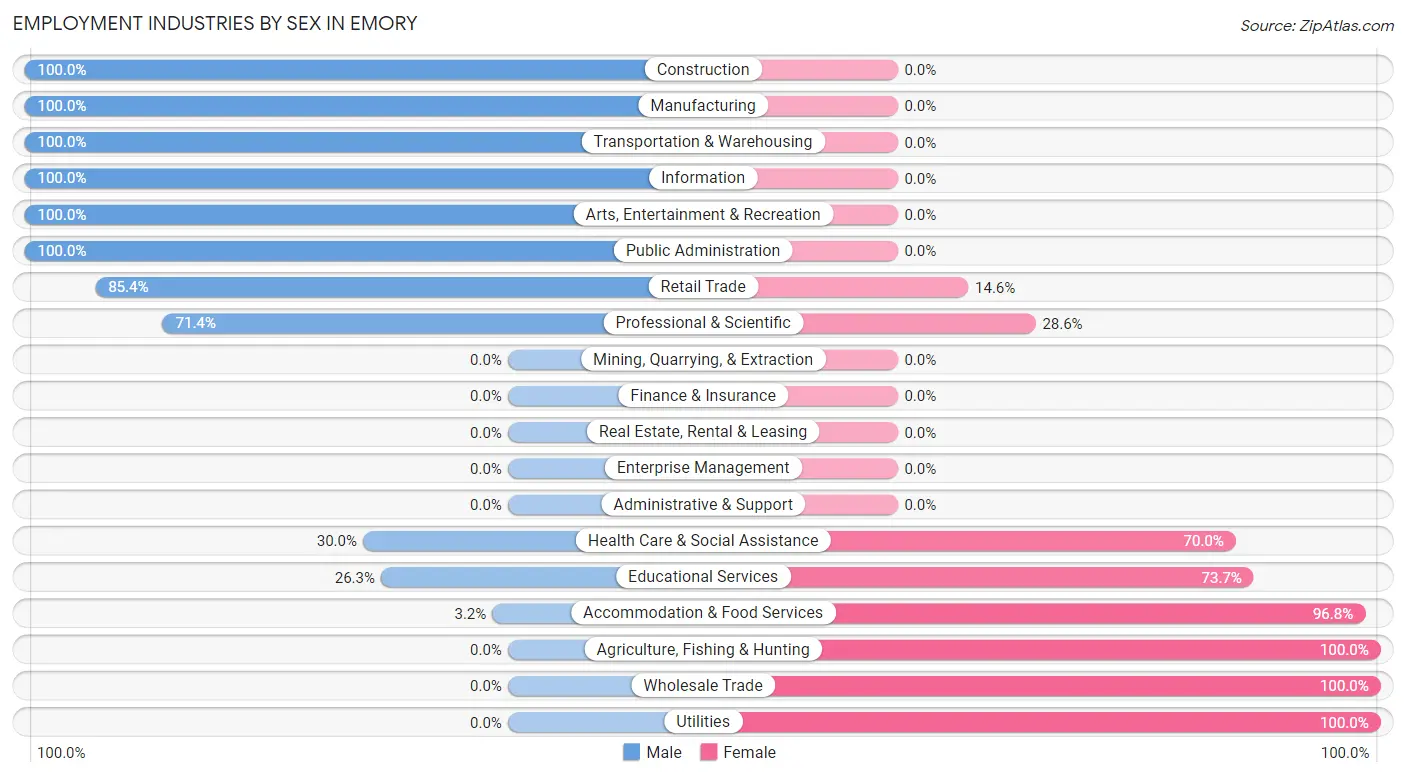
Employment Industries by Sex in Emory
The Emory industries that see more men than women are Construction (100.0%), Manufacturing (100.0%), and Transportation & Warehousing (100.0%), whereas the industries that tend to have a higher number of women are Agriculture, Fishing & Hunting (100.0%), Wholesale Trade (100.0%), and Utilities (100.0%).
| Industry | Male | Female |
| Agriculture, Fishing & Hunting | 0 (0.0%) | 2 (100.0%) |
| Mining, Quarrying, & Extraction | 0 (0.0%) | 0 (0.0%) |
| Construction | 25 (100.0%) | 0 (0.0%) |
| Manufacturing | 31 (100.0%) | 0 (0.0%) |
| Wholesale Trade | 0 (0.0%) | 8 (100.0%) |
| Retail Trade | 35 (85.4%) | 6 (14.6%) |
| Transportation & Warehousing | 46 (100.0%) | 0 (0.0%) |
| Utilities | 0 (0.0%) | 3 (100.0%) |
| Information | 12 (100.0%) | 0 (0.0%) |
| Finance & Insurance | 0 (0.0%) | 0 (0.0%) |
| Real Estate, Rental & Leasing | 0 (0.0%) | 0 (0.0%) |
| Professional & Scientific | 10 (71.4%) | 4 (28.6%) |
| Enterprise Management | 0 (0.0%) | 0 (0.0%) |
| Administrative & Support | 0 (0.0%) | 0 (0.0%) |
| Educational Services | 57 (26.3%) | 160 (73.7%) |
| Health Care & Social Assistance | 21 (30.0%) | 49 (70.0%) |
| Arts, Entertainment & Recreation | 9 (100.0%) | 0 (0.0%) |
| Accommodation & Food Services | 1 (3.2%) | 30 (96.8%) |
| Public Administration | 4 (100.0%) | 0 (0.0%) |
| Total | 251 (48.5%) | 267 (51.5%) |
Education in Emory
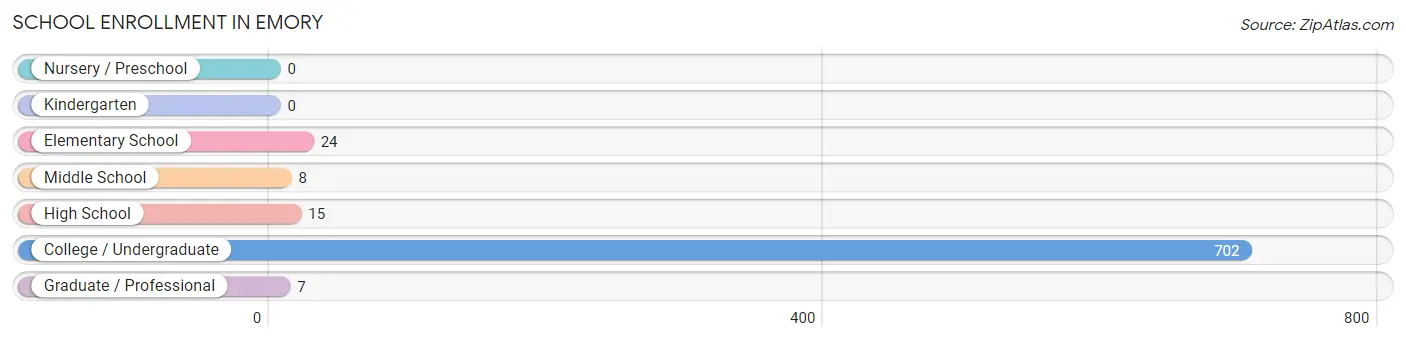
School Enrollment in Emory
The most common levels of schooling among the 756 students in Emory are college / undergraduate (702 | 92.9%), elementary school (24 | 3.2%), and high school (15 | 2.0%).
| School Level | # Students | % Students |
| Nursery / Preschool | 0 | 0.0% |
| Kindergarten | 0 | 0.0% |
| Elementary School | 24 | 3.2% |
| Middle School | 8 | 1.1% |
| High School | 15 | 2.0% |
| College / Undergraduate | 702 | 92.9% |
| Graduate / Professional | 7 | 0.9% |
| Total | 756 | 100.0% |
School Enrollment by Age by Funding Source in Emory
Out of a total of 756 students who are enrolled in schools in Emory, 570 (75.4%) attend a private institution, while the remaining 186 (24.6%) are enrolled in public schools. The age group of 5 to 9 year old has the highest likelihood of being enrolled in private schools, with 19 (100.0% in the age bracket) enrolled. Conversely, the age group of 15 to 17 year olds has the lowest likelihood of being enrolled in a private school, with 13 (100.0% in the age bracket) attending a public institution.
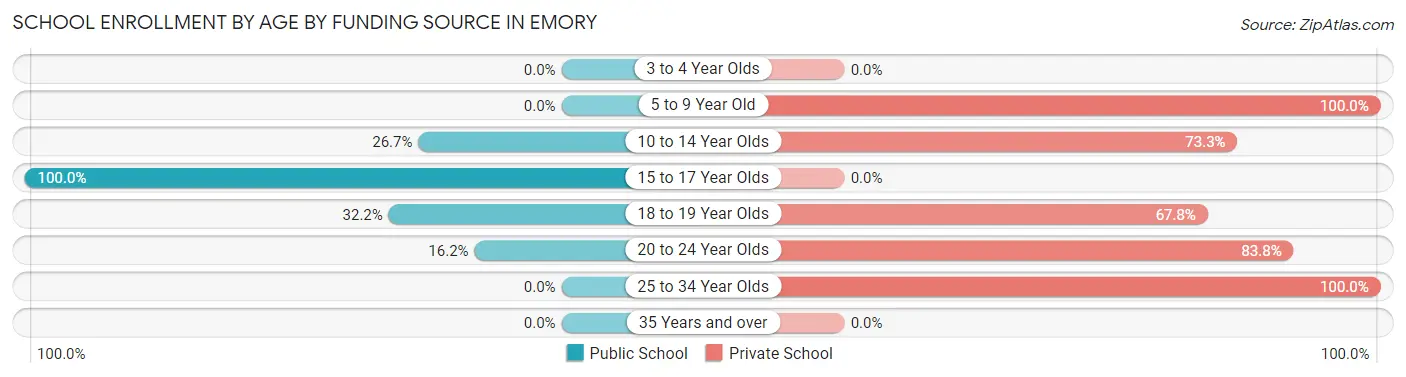
| Age Bracket | Public School | Private School |
| 3 to 4 Year Olds | 0 (0.0%) | 0 (0.0%) |
| 5 to 9 Year Old | 0 (0.0%) | 19 (100.0%) |
| 10 to 14 Year Olds | 4 (26.7%) | 11 (73.3%) |
| 15 to 17 Year Olds | 13 (100.0%) | 0 (0.0%) |
| 18 to 19 Year Olds | 114 (32.2%) | 240 (67.8%) |
| 20 to 24 Year Olds | 55 (16.2%) | 284 (83.8%) |
| 25 to 34 Year Olds | 0 (0.0%) | 16 (100.0%) |
| 35 Years and over | 0 (0.0%) | 0 (0.0%) |
| Total | 186 (24.6%) | 570 (75.4%) |
Educational Attainment by Field of Study in Emory
Science & technology (30 | 24.6%), education (21 | 17.2%), literature & languages (13 | 10.7%), social sciences (11 | 9.0%), and business (10 | 8.2%) are the most common fields of study among 122 individuals in Emory who have obtained a bachelor's degree or higher.
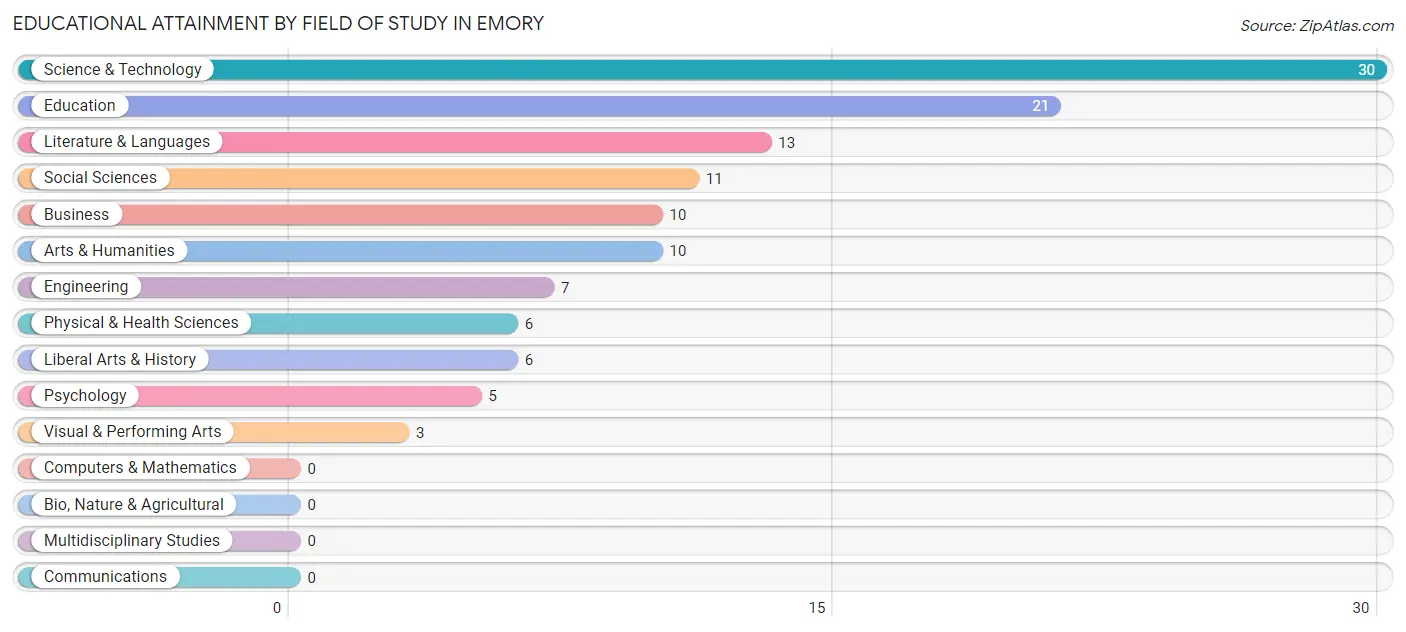
| Field of Study | # Graduates | % Graduates |
| Computers & Mathematics | 0 | 0.0% |
| Bio, Nature & Agricultural | 0 | 0.0% |
| Physical & Health Sciences | 6 | 4.9% |
| Psychology | 5 | 4.1% |
| Social Sciences | 11 | 9.0% |
| Engineering | 7 | 5.7% |
| Multidisciplinary Studies | 0 | 0.0% |
| Science & Technology | 30 | 24.6% |
| Business | 10 | 8.2% |
| Education | 21 | 17.2% |
| Literature & Languages | 13 | 10.7% |
| Liberal Arts & History | 6 | 4.9% |
| Visual & Performing Arts | 3 | 2.5% |
| Communications | 0 | 0.0% |
| Arts & Humanities | 10 | 8.2% |
| Total | 122 | 100.0% |
Transportation & Commute in Emory
Vehicle Availability by Sex in Emory
The most prevalent vehicle ownership categories in Emory are males with 2 vehicles (31, accounting for 47.0%) and females with 2 vehicles (26, making up 50.8%).
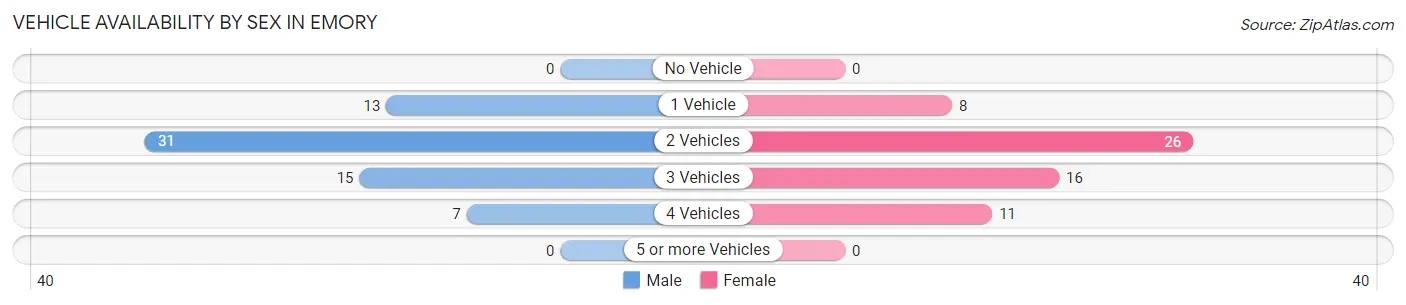
| Vehicles Available | Male | Female |
| No Vehicle | 0 (0.0%) | 0 (0.0%) |
| 1 Vehicle | 13 (19.7%) | 8 (13.1%) |
| 2 Vehicles | 31 (47.0%) | 26 (42.6%) |
| 3 Vehicles | 15 (22.7%) | 16 (26.2%) |
| 4 Vehicles | 7 (10.6%) | 11 (18.0%) |
| 5 or more Vehicles | 0 (0.0%) | 0 (0.0%) |
| Total | 66 (100.0%) | 61 (100.0%) |
Commute Time in Emory
The most frequently occuring commute durations in Emory are 5 to 9 minutes (167 commuters, 43.4%), less than 5 minutes (60 commuters, 15.6%), and 10 to 14 minutes (57 commuters, 14.8%).
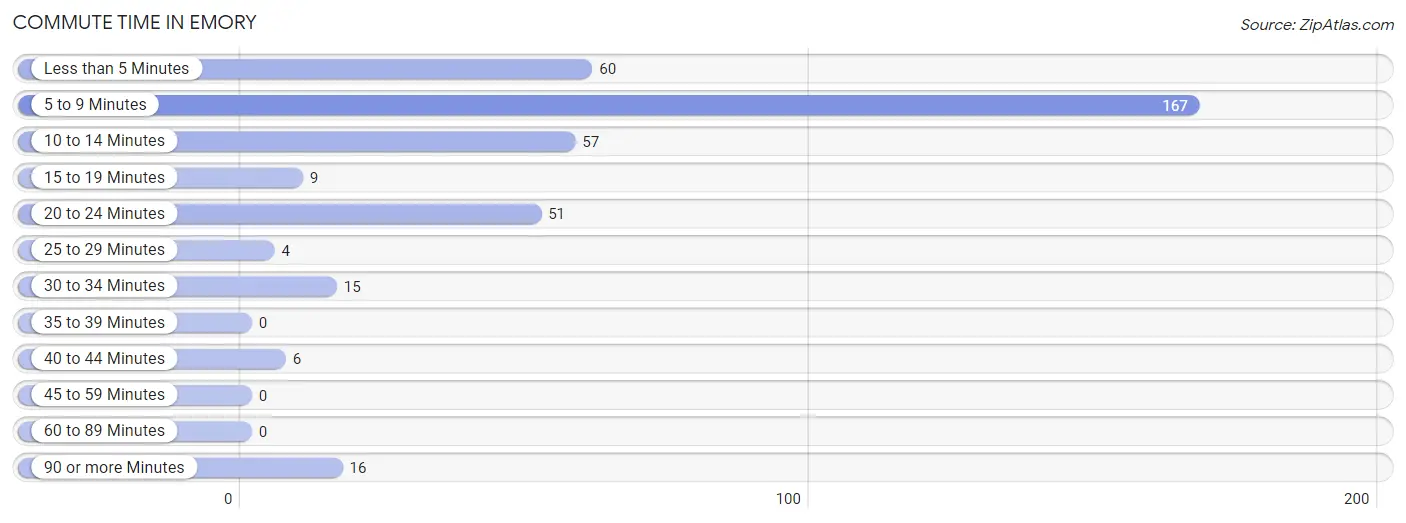
| Commute Time | # Commuters | % Commuters |
| Less than 5 Minutes | 60 | 15.6% |
| 5 to 9 Minutes | 167 | 43.4% |
| 10 to 14 Minutes | 57 | 14.8% |
| 15 to 19 Minutes | 9 | 2.3% |
| 20 to 24 Minutes | 51 | 13.3% |
| 25 to 29 Minutes | 4 | 1.0% |
| 30 to 34 Minutes | 15 | 3.9% |
| 35 to 39 Minutes | 0 | 0.0% |
| 40 to 44 Minutes | 6 | 1.6% |
| 45 to 59 Minutes | 0 | 0.0% |
| 60 to 89 Minutes | 0 | 0.0% |
| 90 or more Minutes | 16 | 4.2% |
Commute Time by Sex in Emory
The most common commute times in Emory are 5 to 9 minutes (67 commuters, 34.9%) for males and 5 to 9 minutes (100 commuters, 51.8%) for females.
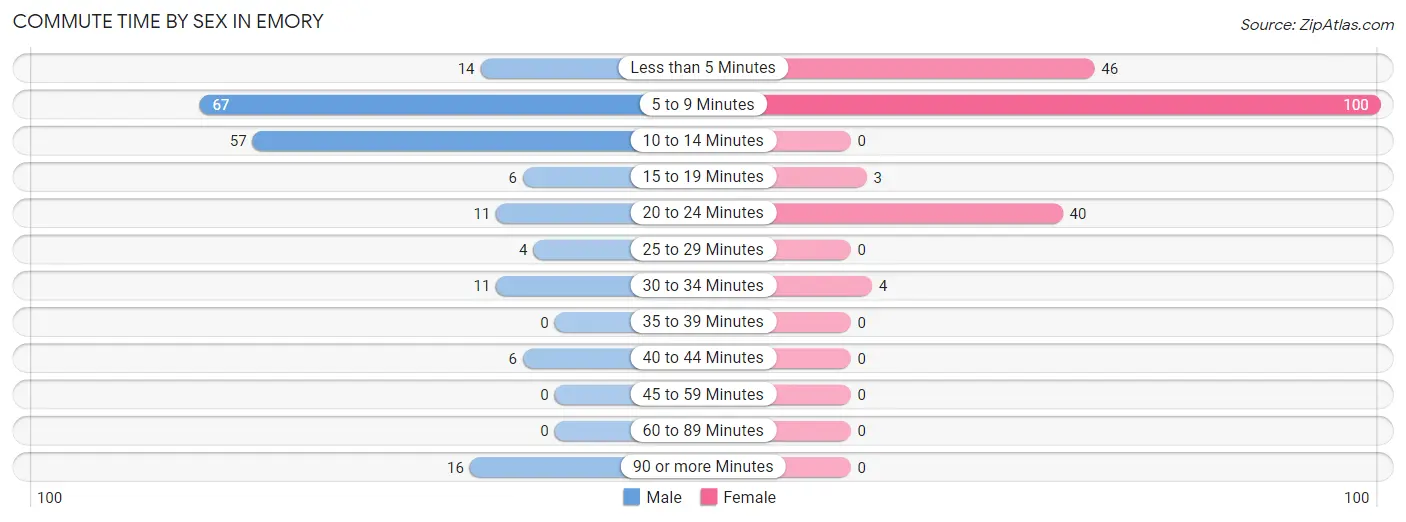
| Commute Time | Male | Female |
| Less than 5 Minutes | 14 (7.3%) | 46 (23.8%) |
| 5 to 9 Minutes | 67 (34.9%) | 100 (51.8%) |
| 10 to 14 Minutes | 57 (29.7%) | 0 (0.0%) |
| 15 to 19 Minutes | 6 (3.1%) | 3 (1.5%) |
| 20 to 24 Minutes | 11 (5.7%) | 40 (20.7%) |
| 25 to 29 Minutes | 4 (2.1%) | 0 (0.0%) |
| 30 to 34 Minutes | 11 (5.7%) | 4 (2.1%) |
| 35 to 39 Minutes | 0 (0.0%) | 0 (0.0%) |
| 40 to 44 Minutes | 6 (3.1%) | 0 (0.0%) |
| 45 to 59 Minutes | 0 (0.0%) | 0 (0.0%) |
| 60 to 89 Minutes | 0 (0.0%) | 0 (0.0%) |
| 90 or more Minutes | 16 (8.3%) | 0 (0.0%) |
Time of Departure to Work by Sex in Emory
The most frequent times of departure to work in Emory are 12:00 PM to 3:59 PM (55, 28.6%) for males and 4:00 PM to 11:59 PM (70, 36.3%) for females.
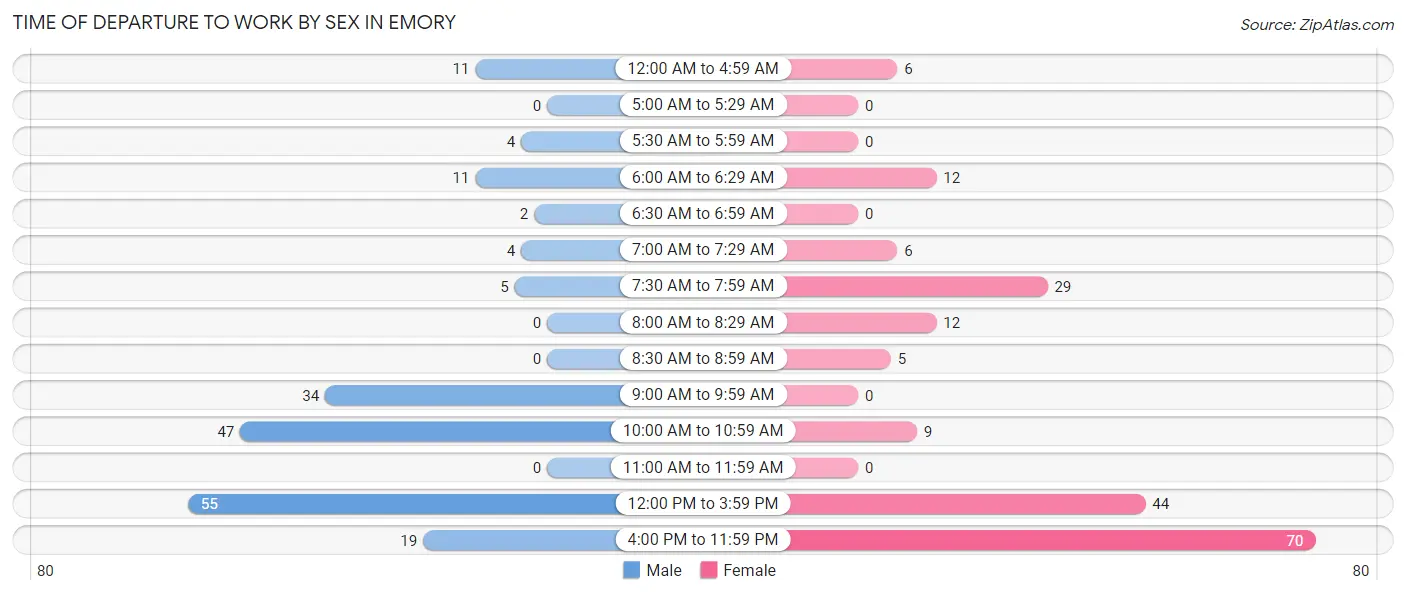
| Time of Departure | Male | Female |
| 12:00 AM to 4:59 AM | 11 (5.7%) | 6 (3.1%) |
| 5:00 AM to 5:29 AM | 0 (0.0%) | 0 (0.0%) |
| 5:30 AM to 5:59 AM | 4 (2.1%) | 0 (0.0%) |
| 6:00 AM to 6:29 AM | 11 (5.7%) | 12 (6.2%) |
| 6:30 AM to 6:59 AM | 2 (1.0%) | 0 (0.0%) |
| 7:00 AM to 7:29 AM | 4 (2.1%) | 6 (3.1%) |
| 7:30 AM to 7:59 AM | 5 (2.6%) | 29 (15.0%) |
| 8:00 AM to 8:29 AM | 0 (0.0%) | 12 (6.2%) |
| 8:30 AM to 8:59 AM | 0 (0.0%) | 5 (2.6%) |
| 9:00 AM to 9:59 AM | 34 (17.7%) | 0 (0.0%) |
| 10:00 AM to 10:59 AM | 47 (24.5%) | 9 (4.7%) |
| 11:00 AM to 11:59 AM | 0 (0.0%) | 0 (0.0%) |
| 12:00 PM to 3:59 PM | 55 (28.6%) | 44 (22.8%) |
| 4:00 PM to 11:59 PM | 19 (9.9%) | 70 (36.3%) |
| Total | 192 (100.0%) | 193 (100.0%) |
Housing Occupancy in Emory
Occupancy by Ownership in Emory
Of the total 154 dwellings in Emory, owner-occupied units account for 149 (96.8%), while renter-occupied units make up 5 (3.3%).
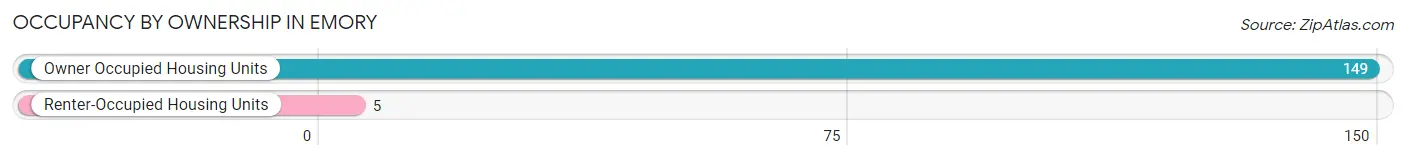
| Occupancy | # Housing Units | % Housing Units |
| Owner Occupied Housing Units | 149 | 96.8% |
| Renter-Occupied Housing Units | 5 | 3.3% |
| Total Occupied Housing Units | 154 | 100.0% |
Occupancy by Household Size in Emory
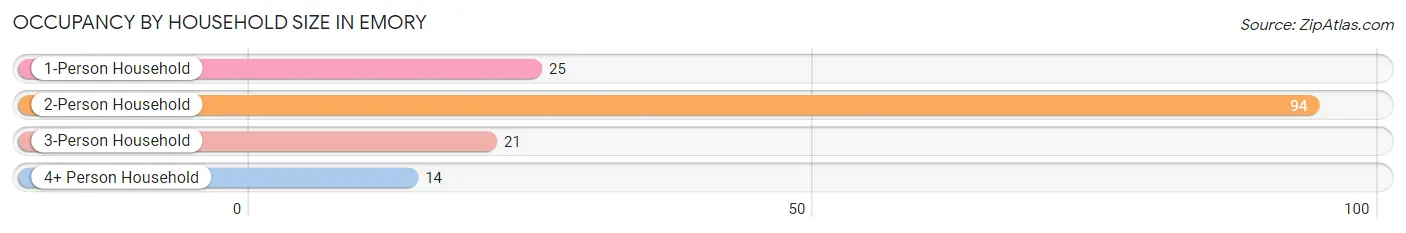
| Household Size | # Housing Units | % Housing Units |
| 1-Person Household | 25 | 16.2% |
| 2-Person Household | 94 | 61.0% |
| 3-Person Household | 21 | 13.6% |
| 4+ Person Household | 14 | 9.1% |
| Total Housing Units | 154 | 100.0% |
Occupancy by Ownership by Household Size in Emory
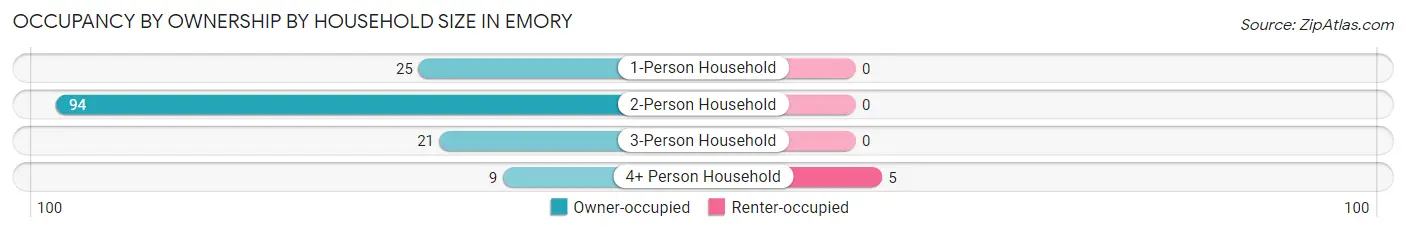
| Household Size | Owner-occupied | Renter-occupied |
| 1-Person Household | 25 (100.0%) | 0 (0.0%) |
| 2-Person Household | 94 (100.0%) | 0 (0.0%) |
| 3-Person Household | 21 (100.0%) | 0 (0.0%) |
| 4+ Person Household | 9 (64.3%) | 5 (35.7%) |
| Total Housing Units | 149 (96.8%) | 5 (3.3%) |
Occupancy by Educational Attainment in Emory
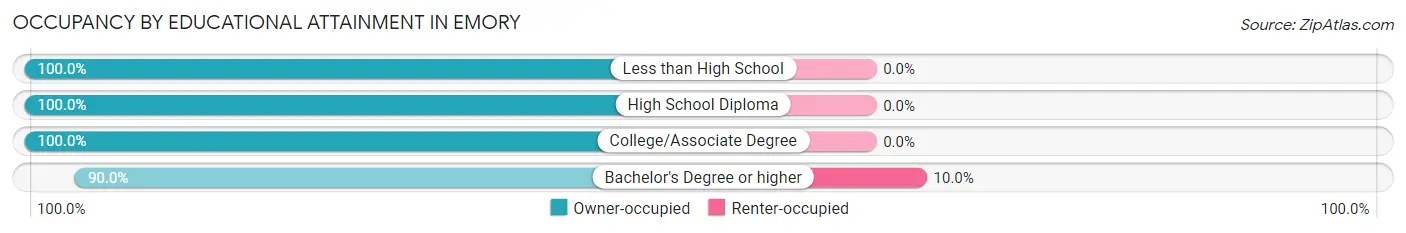
| Household Size | Owner-occupied | Renter-occupied |
| Less than High School | 3 (100.0%) | 0 (0.0%) |
| High School Diploma | 29 (100.0%) | 0 (0.0%) |
| College/Associate Degree | 72 (100.0%) | 0 (0.0%) |
| Bachelor's Degree or higher | 45 (90.0%) | 5 (10.0%) |
Occupancy by Age of Householder in Emory
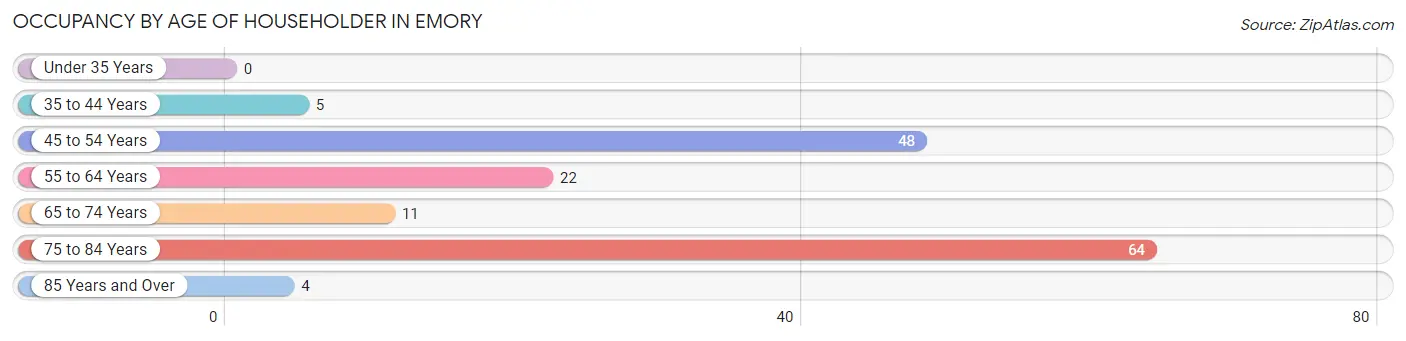
| Age Bracket | # Households | % Households |
| Under 35 Years | 0 | 0.0% |
| 35 to 44 Years | 5 | 3.3% |
| 45 to 54 Years | 48 | 31.2% |
| 55 to 64 Years | 22 | 14.3% |
| 65 to 74 Years | 11 | 7.1% |
| 75 to 84 Years | 64 | 41.6% |
| 85 Years and Over | 4 | 2.6% |
| Total | 154 | 100.0% |
Housing Finances in Emory
Median Income by Occupancy in Emory
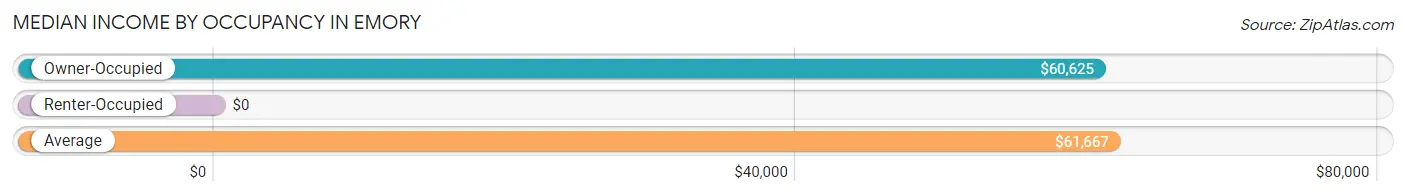
| Occupancy Type | # Households | Median Income |
| Owner-Occupied | 149 (96.8%) | $60,625 |
| Renter-Occupied | 5 (3.3%) | $0 |
| Average | 154 (100.0%) | $61,667 |
Occupancy by Householder Income Bracket in Emory
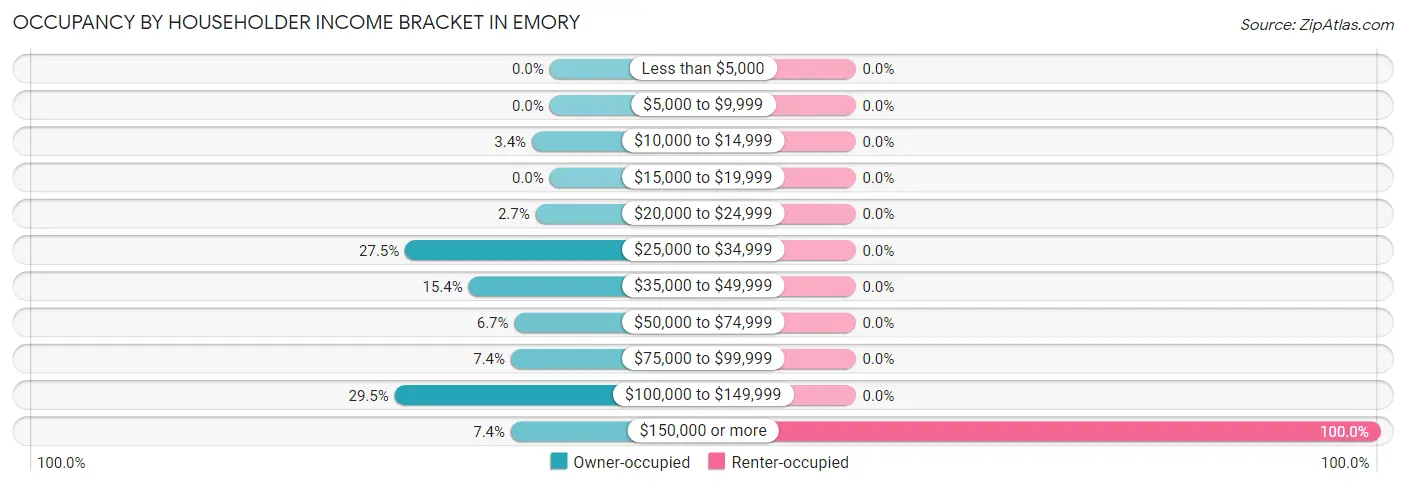
| Income Bracket | Owner-occupied | Renter-occupied |
| Less than $5,000 | 0 (0.0%) | 0 (0.0%) |
| $5,000 to $9,999 | 0 (0.0%) | 0 (0.0%) |
| $10,000 to $14,999 | 5 (3.4%) | 0 (0.0%) |
| $15,000 to $19,999 | 0 (0.0%) | 0 (0.0%) |
| $20,000 to $24,999 | 4 (2.7%) | 0 (0.0%) |
| $25,000 to $34,999 | 41 (27.5%) | 0 (0.0%) |
| $35,000 to $49,999 | 23 (15.4%) | 0 (0.0%) |
| $50,000 to $74,999 | 10 (6.7%) | 0 (0.0%) |
| $75,000 to $99,999 | 11 (7.4%) | 0 (0.0%) |
| $100,000 to $149,999 | 44 (29.5%) | 0 (0.0%) |
| $150,000 or more | 11 (7.4%) | 5 (100.0%) |
| Total | 149 (100.0%) | 5 (100.0%) |
Monthly Housing Cost Tiers in Emory
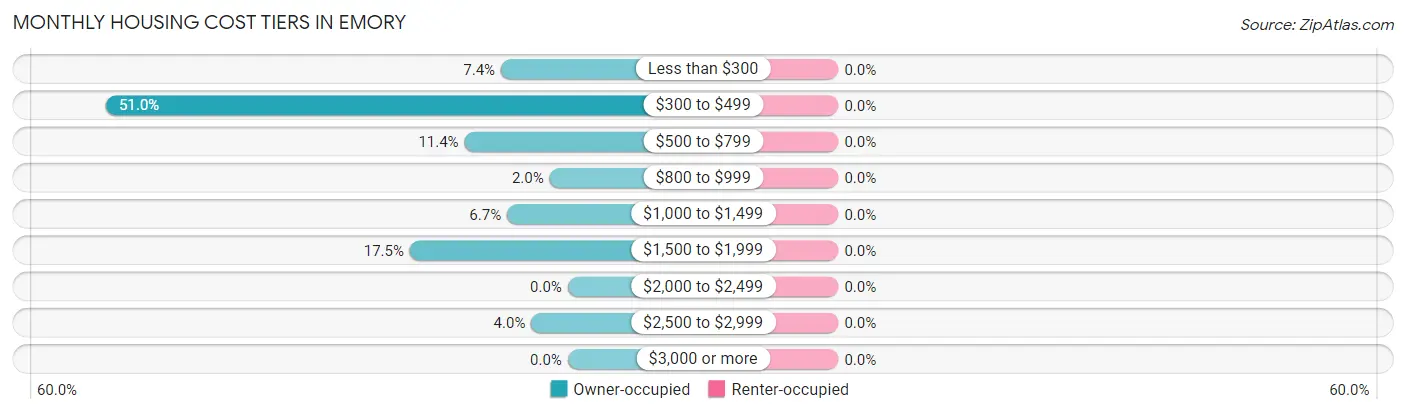
| Monthly Cost | Owner-occupied | Renter-occupied |
| Less than $300 | 11 (7.4%) | 0 (0.0%) |
| $300 to $499 | 76 (51.0%) | 0 (0.0%) |
| $500 to $799 | 17 (11.4%) | 0 (0.0%) |
| $800 to $999 | 3 (2.0%) | 0 (0.0%) |
| $1,000 to $1,499 | 10 (6.7%) | 0 (0.0%) |
| $1,500 to $1,999 | 26 (17.4%) | 0 (0.0%) |
| $2,000 to $2,499 | 0 (0.0%) | 0 (0.0%) |
| $2,500 to $2,999 | 6 (4.0%) | 0 (0.0%) |
| $3,000 or more | 0 (0.0%) | 0 (0.0%) |
| Total | 149 (100.0%) | 5 (100.0%) |
Physical Housing Characteristics in Emory
Housing Structures in Emory
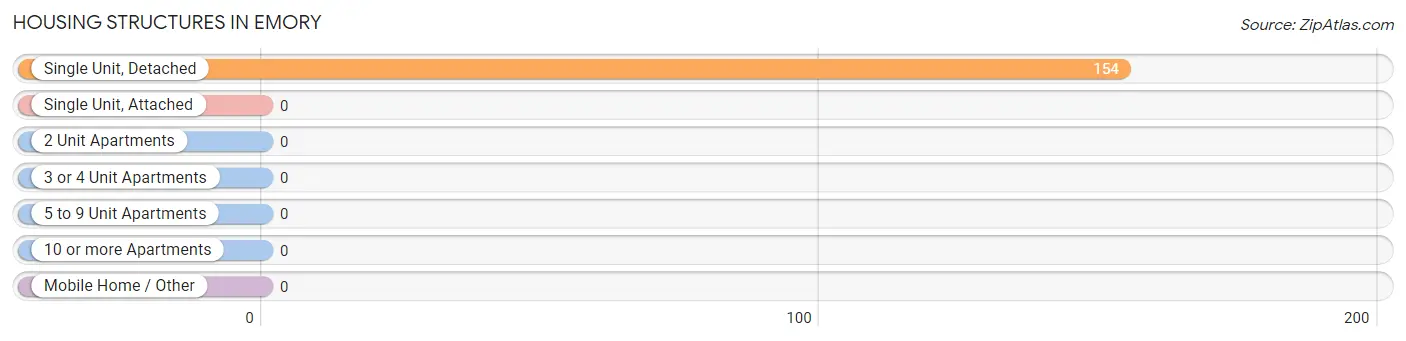
| Structure Type | # Housing Units | % Housing Units |
| Single Unit, Detached | 154 | 100.0% |
| Single Unit, Attached | 0 | 0.0% |
| 2 Unit Apartments | 0 | 0.0% |
| 3 or 4 Unit Apartments | 0 | 0.0% |
| 5 to 9 Unit Apartments | 0 | 0.0% |
| 10 or more Apartments | 0 | 0.0% |
| Mobile Home / Other | 0 | 0.0% |
| Total | 154 | 100.0% |
Housing Structures by Occupancy in Emory
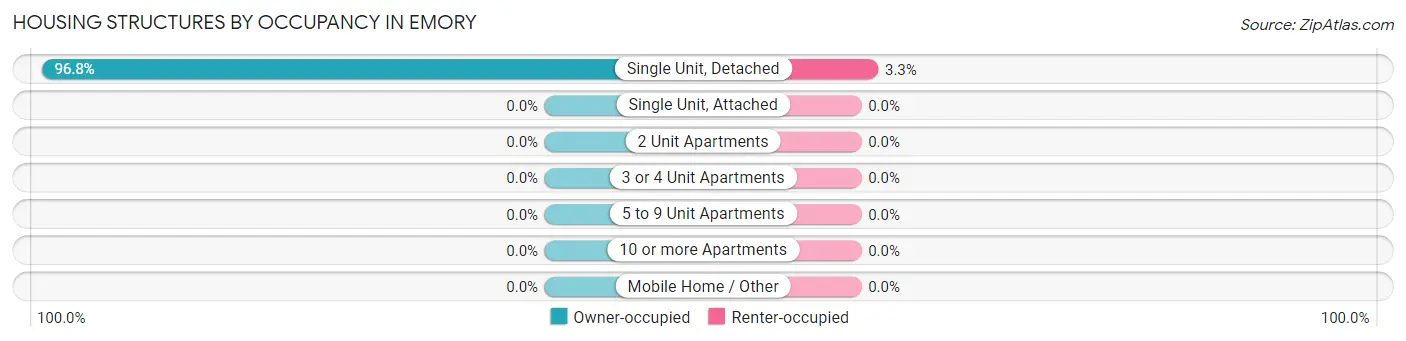
| Structure Type | Owner-occupied | Renter-occupied |
| Single Unit, Detached | 149 (96.8%) | 5 (3.3%) |
| Single Unit, Attached | 0 (0.0%) | 0 (0.0%) |
| 2 Unit Apartments | 0 (0.0%) | 0 (0.0%) |
| 3 or 4 Unit Apartments | 0 (0.0%) | 0 (0.0%) |
| 5 to 9 Unit Apartments | 0 (0.0%) | 0 (0.0%) |
| 10 or more Apartments | 0 (0.0%) | 0 (0.0%) |
| Mobile Home / Other | 0 (0.0%) | 0 (0.0%) |
| Total | 149 (96.8%) | 5 (3.3%) |
Housing Structures by Number of Rooms in Emory
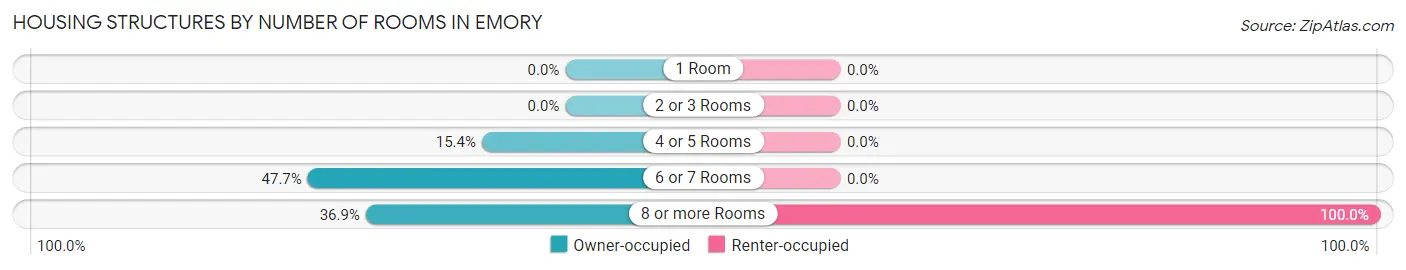
| Number of Rooms | Owner-occupied | Renter-occupied |
| 1 Room | 0 (0.0%) | 0 (0.0%) |
| 2 or 3 Rooms | 0 (0.0%) | 0 (0.0%) |
| 4 or 5 Rooms | 23 (15.4%) | 0 (0.0%) |
| 6 or 7 Rooms | 71 (47.6%) | 0 (0.0%) |
| 8 or more Rooms | 55 (36.9%) | 5 (100.0%) |
| Total | 149 (100.0%) | 5 (100.0%) |
Housing Structure by Heating Type in Emory
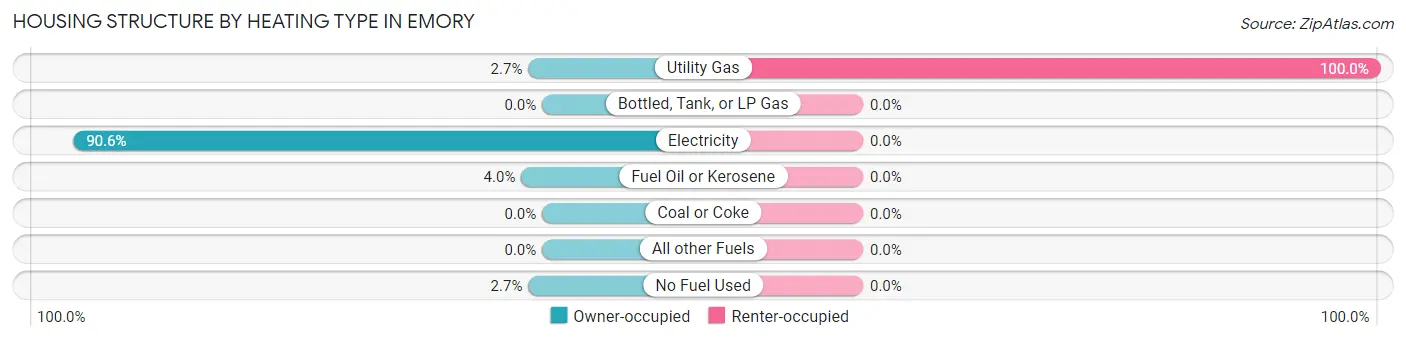
| Heating Type | Owner-occupied | Renter-occupied |
| Utility Gas | 4 (2.7%) | 5 (100.0%) |
| Bottled, Tank, or LP Gas | 0 (0.0%) | 0 (0.0%) |
| Electricity | 135 (90.6%) | 0 (0.0%) |
| Fuel Oil or Kerosene | 6 (4.0%) | 0 (0.0%) |
| Coal or Coke | 0 (0.0%) | 0 (0.0%) |
| All other Fuels | 0 (0.0%) | 0 (0.0%) |
| No Fuel Used | 4 (2.7%) | 0 (0.0%) |
| Total | 149 (100.0%) | 5 (100.0%) |
Household Vehicle Usage in Emory
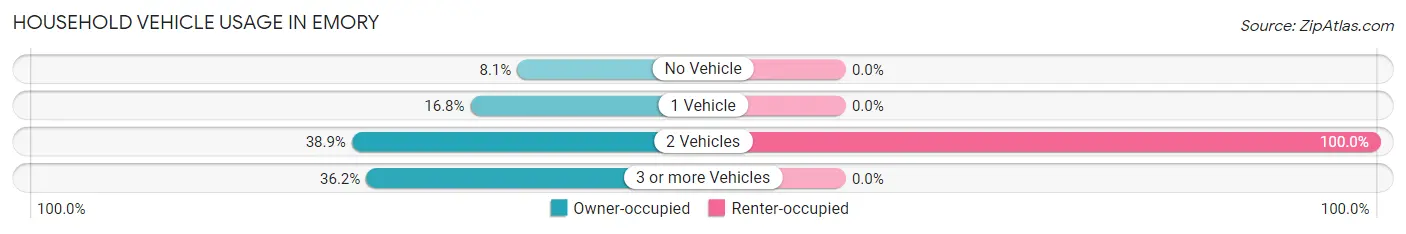
| Vehicles per Household | Owner-occupied | Renter-occupied |
| No Vehicle | 12 (8.1%) | 0 (0.0%) |
| 1 Vehicle | 25 (16.8%) | 0 (0.0%) |
| 2 Vehicles | 58 (38.9%) | 5 (100.0%) |
| 3 or more Vehicles | 54 (36.2%) | 0 (0.0%) |
| Total | 149 (100.0%) | 5 (100.0%) |
Real Estate & Mortgages in Emory
Real Estate and Mortgage Overview in Emory
| Characteristic | Without Mortgage | With Mortgage |
| Housing Units | 104 | 45 |
| Median Property Value | $185,800 | $271,900 |
| Median Household Income | - | - |
| Monthly Housing Costs | $438 | $0 |
| Real Estate Taxes | $1,391 | $0 |
Property Value by Mortgage Status in Emory
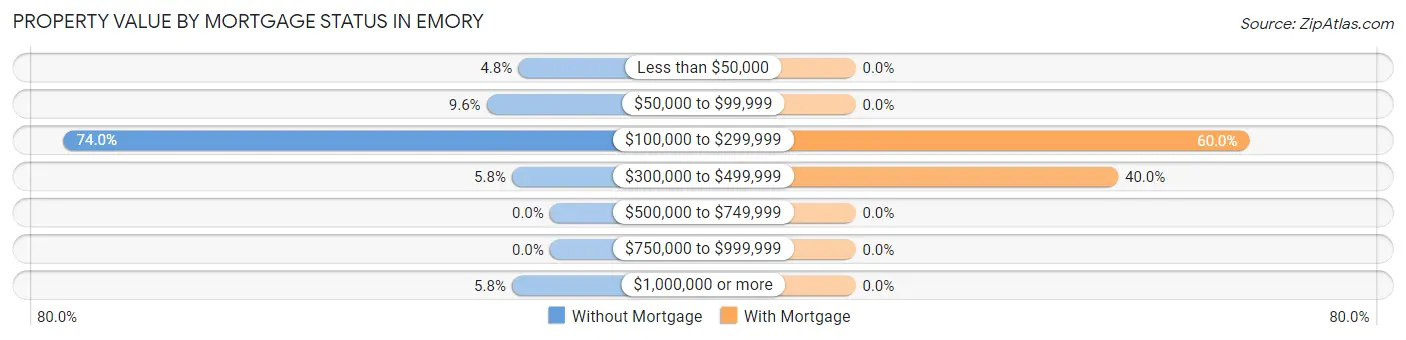
| Property Value | Without Mortgage | With Mortgage |
| Less than $50,000 | 5 (4.8%) | 0 (0.0%) |
| $50,000 to $99,999 | 10 (9.6%) | 0 (0.0%) |
| $100,000 to $299,999 | 77 (74.0%) | 27 (60.0%) |
| $300,000 to $499,999 | 6 (5.8%) | 18 (40.0%) |
| $500,000 to $749,999 | 0 (0.0%) | 0 (0.0%) |
| $750,000 to $999,999 | 0 (0.0%) | 0 (0.0%) |
| $1,000,000 or more | 6 (5.8%) | 0 (0.0%) |
| Total | 104 (100.0%) | 45 (100.0%) |
Household Income by Mortgage Status in Emory
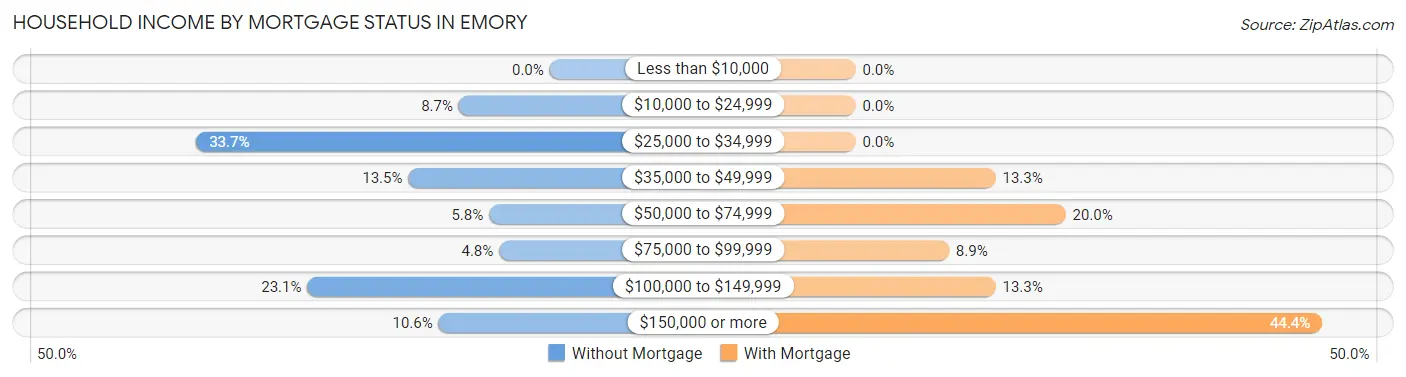
| Household Income | Without Mortgage | With Mortgage |
| Less than $10,000 | 0 (0.0%) | 0 (0.0%) |
| $10,000 to $24,999 | 9 (8.6%) | 0 (0.0%) |
| $25,000 to $34,999 | 35 (33.7%) | 0 (0.0%) |
| $35,000 to $49,999 | 14 (13.5%) | 6 (13.3%) |
| $50,000 to $74,999 | 6 (5.8%) | 9 (20.0%) |
| $75,000 to $99,999 | 5 (4.8%) | 4 (8.9%) |
| $100,000 to $149,999 | 24 (23.1%) | 6 (13.3%) |
| $150,000 or more | 11 (10.6%) | 20 (44.4%) |
| Total | 104 (100.0%) | 45 (100.0%) |
Property Value to Household Income Ratio in Emory
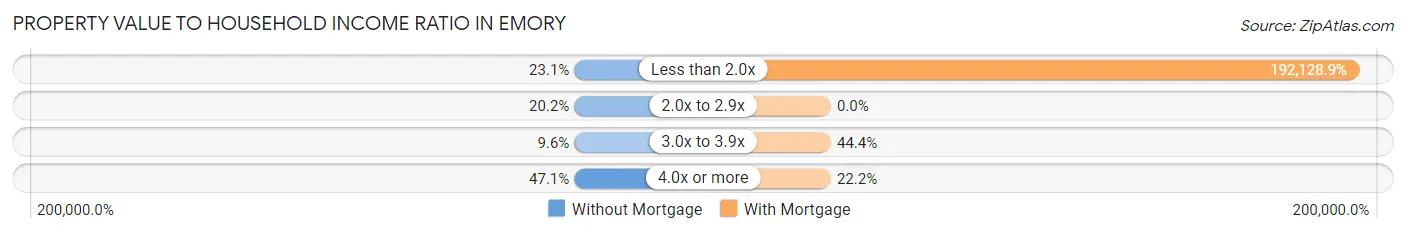
| Value-to-Income Ratio | Without Mortgage | With Mortgage |
| Less than 2.0x | 24 (23.1%) | 86,458 (192,128.9%) |
| 2.0x to 2.9x | 21 (20.2%) | 0 (0.0%) |
| 3.0x to 3.9x | 10 (9.6%) | 20 (44.4%) |
| 4.0x or more | 49 (47.1%) | 10 (22.2%) |
| Total | 104 (100.0%) | 45 (100.0%) |
Real Estate Taxes by Mortgage Status in Emory
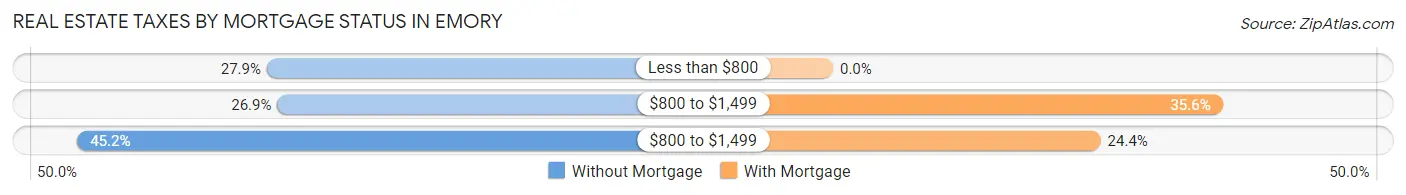
| Property Taxes | Without Mortgage | With Mortgage |
| Less than $800 | 29 (27.9%) | 0 (0.0%) |
| $800 to $1,499 | 28 (26.9%) | 16 (35.6%) |
| $800 to $1,499 | 47 (45.2%) | 11 (24.4%) |
| Total | 104 (100.0%) | 45 (100.0%) |
Health & Disability in Emory
Health Insurance Coverage by Age in Emory
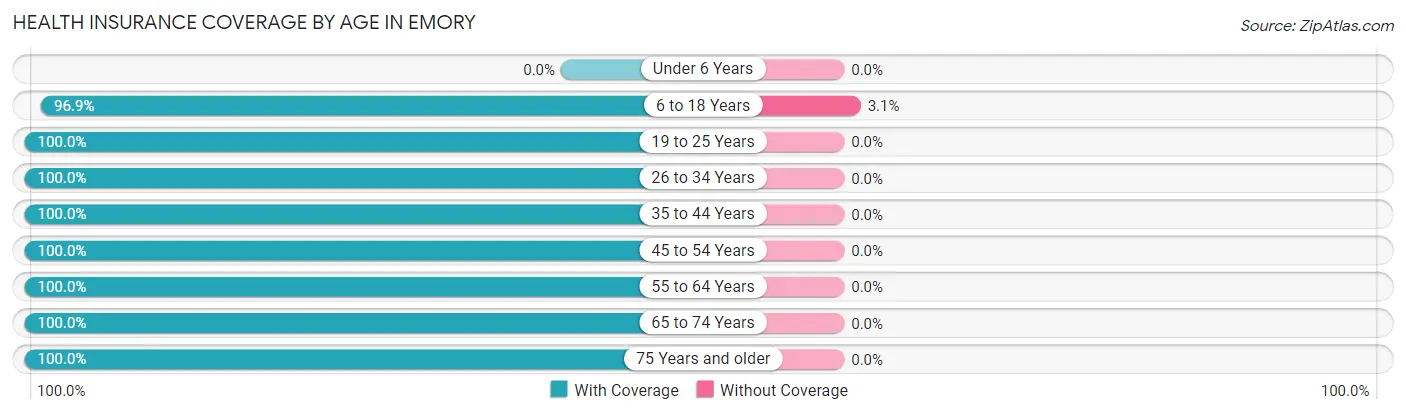
| Age Bracket | With Coverage | Without Coverage |
| Under 6 Years | 0 (0.0%) | 0 (0.0%) |
| 6 to 18 Years | 221 (96.9%) | 7 (3.1%) |
| 19 to 25 Years | 512 (100.0%) | 0 (0.0%) |
| 26 to 34 Years | 16 (100.0%) | 0 (0.0%) |
| 35 to 44 Years | 40 (100.0%) | 0 (0.0%) |
| 45 to 54 Years | 71 (100.0%) | 0 (0.0%) |
| 55 to 64 Years | 46 (100.0%) | 0 (0.0%) |
| 65 to 74 Years | 16 (100.0%) | 0 (0.0%) |
| 75 Years and older | 123 (100.0%) | 0 (0.0%) |
| Total | 1,045 (99.3%) | 7 (0.7%) |
Health Insurance Coverage by Citizenship Status in Emory
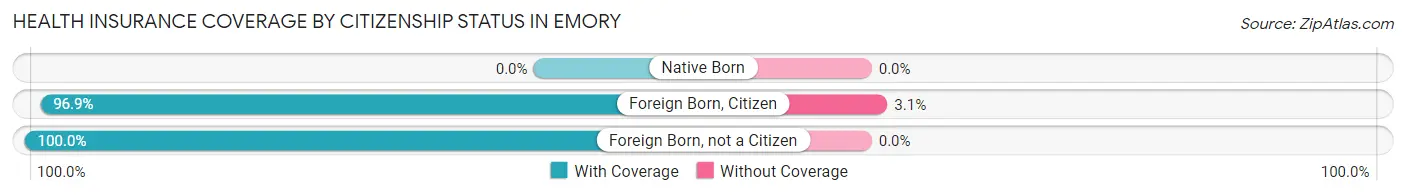
| Citizenship Status | With Coverage | Without Coverage |
| Native Born | 0 (0.0%) | 0 (0.0%) |
| Foreign Born, Citizen | 221 (96.9%) | 7 (3.1%) |
| Foreign Born, not a Citizen | 512 (100.0%) | 0 (0.0%) |
Health Insurance Coverage by Household Income in Emory
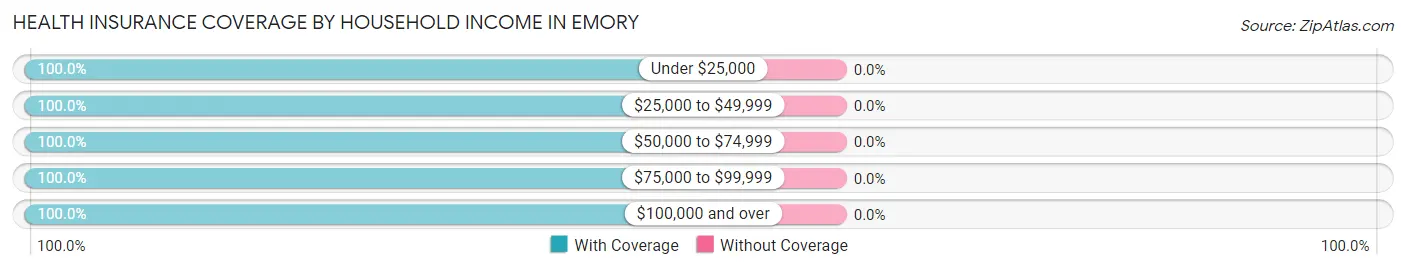
| Household Income | With Coverage | Without Coverage |
| Under $25,000 | 9 (100.0%) | 0 (0.0%) |
| $25,000 to $49,999 | 121 (100.0%) | 0 (0.0%) |
| $50,000 to $74,999 | 21 (100.0%) | 0 (0.0%) |
| $75,000 to $99,999 | 37 (100.0%) | 0 (0.0%) |
| $100,000 and over | 162 (100.0%) | 0 (0.0%) |
Public vs Private Health Insurance Coverage by Age in Emory
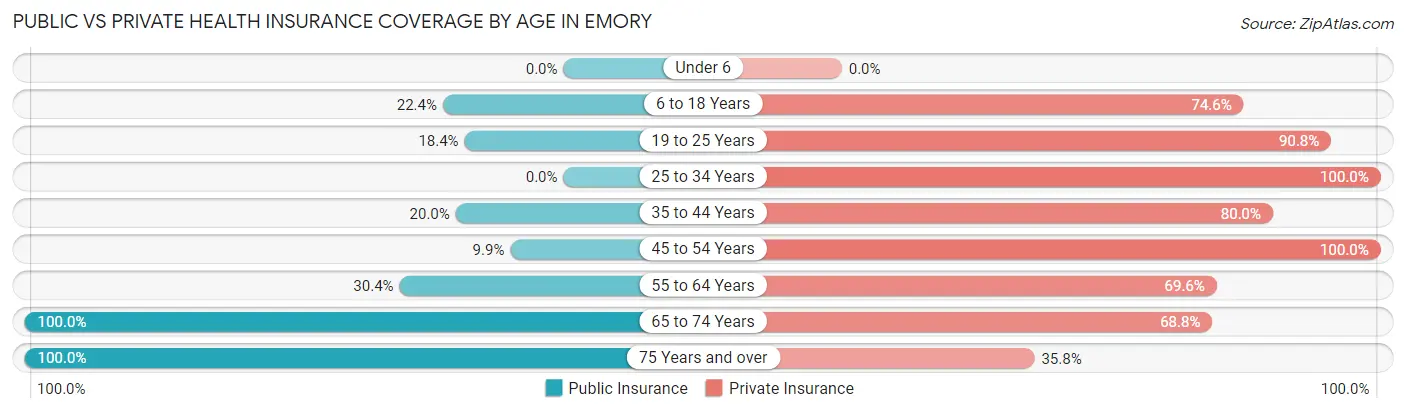
| Age Bracket | Public Insurance | Private Insurance |
| Under 6 | 0 (0.0%) | 0 (0.0%) |
| 6 to 18 Years | 51 (22.4%) | 170 (74.6%) |
| 19 to 25 Years | 94 (18.4%) | 465 (90.8%) |
| 25 to 34 Years | 0 (0.0%) | 16 (100.0%) |
| 35 to 44 Years | 8 (20.0%) | 32 (80.0%) |
| 45 to 54 Years | 7 (9.9%) | 71 (100.0%) |
| 55 to 64 Years | 14 (30.4%) | 32 (69.6%) |
| 65 to 74 Years | 16 (100.0%) | 11 (68.8%) |
| 75 Years and over | 123 (100.0%) | 44 (35.8%) |
| Total | 313 (29.7%) | 841 (79.9%) |
Disability Status by Sex by Age in Emory
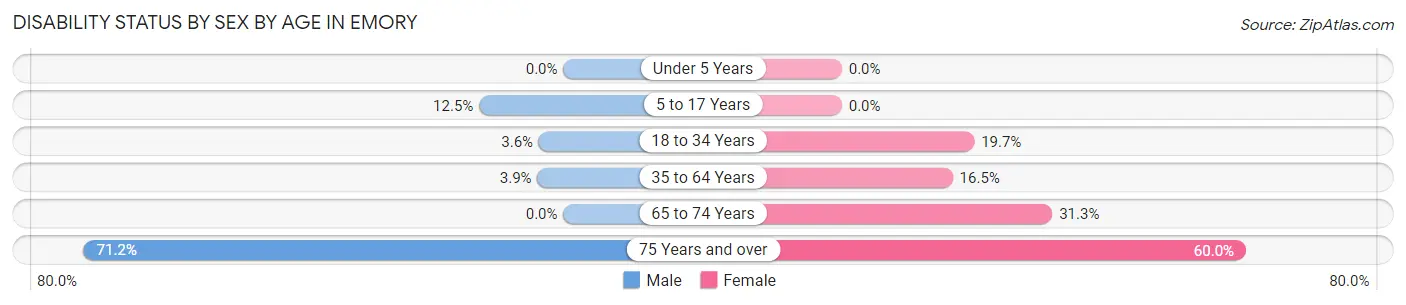
| Age Bracket | Male | Female |
| Under 5 Years | 0 (0.0%) | 0 (0.0%) |
| 5 to 17 Years | 2 (12.5%) | 0 (0.0%) |
| 18 to 34 Years | 13 (3.6%) | 69 (19.7%) |
| 35 to 64 Years | 3 (3.8%) | 13 (16.5%) |
| 65 to 74 Years | 0 (0.0%) | 5 (31.2%) |
| 75 Years and over | 52 (71.2%) | 30 (60.0%) |
Disability Class by Sex by Age in Emory
Disability Class: Hearing Difficulty
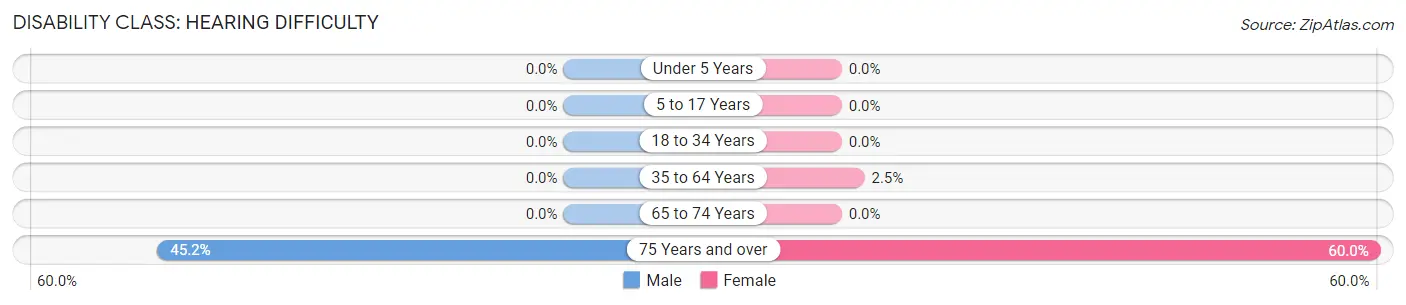
| Age Bracket | Male | Female |
| Under 5 Years | 0 (0.0%) | 0 (0.0%) |
| 5 to 17 Years | 0 (0.0%) | 0 (0.0%) |
| 18 to 34 Years | 0 (0.0%) | 0 (0.0%) |
| 35 to 64 Years | 0 (0.0%) | 2 (2.5%) |
| 65 to 74 Years | 0 (0.0%) | 0 (0.0%) |
| 75 Years and over | 33 (45.2%) | 30 (60.0%) |
Disability Class: Vision Difficulty
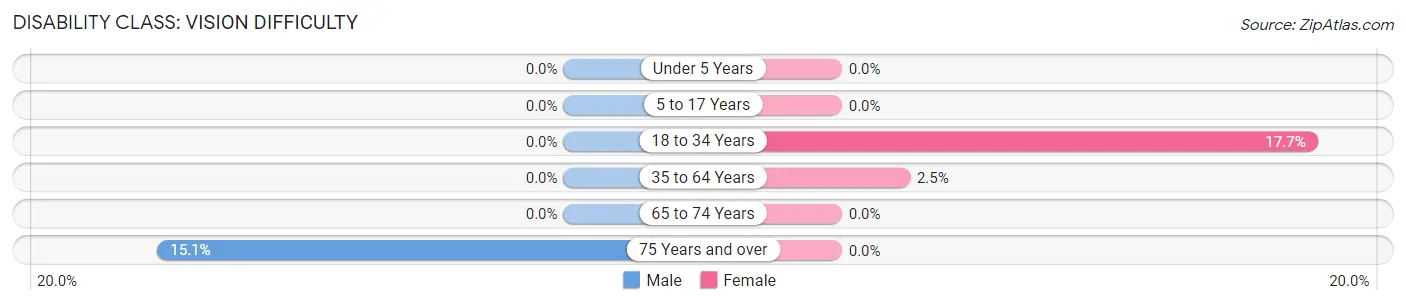
| Age Bracket | Male | Female |
| Under 5 Years | 0 (0.0%) | 0 (0.0%) |
| 5 to 17 Years | 0 (0.0%) | 0 (0.0%) |
| 18 to 34 Years | 0 (0.0%) | 62 (17.7%) |
| 35 to 64 Years | 0 (0.0%) | 2 (2.5%) |
| 65 to 74 Years | 0 (0.0%) | 0 (0.0%) |
| 75 Years and over | 11 (15.1%) | 0 (0.0%) |
Disability Class: Cognitive Difficulty
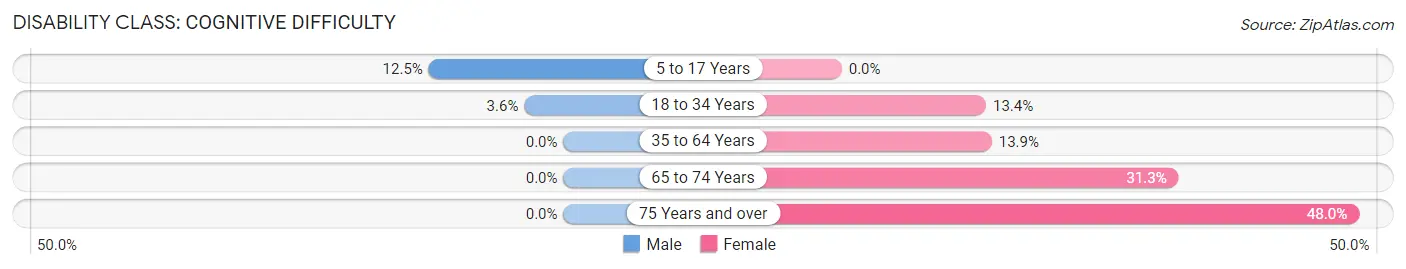
| Age Bracket | Male | Female |
| 5 to 17 Years | 2 (12.5%) | 0 (0.0%) |
| 18 to 34 Years | 13 (3.6%) | 47 (13.4%) |
| 35 to 64 Years | 0 (0.0%) | 11 (13.9%) |
| 65 to 74 Years | 0 (0.0%) | 5 (31.2%) |
| 75 Years and over | 0 (0.0%) | 24 (48.0%) |
Disability Class: Ambulatory Difficulty
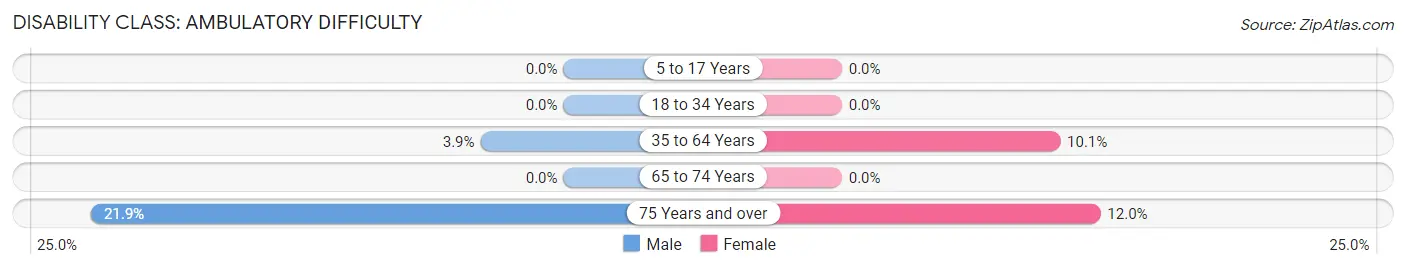
| Age Bracket | Male | Female |
| 5 to 17 Years | 0 (0.0%) | 0 (0.0%) |
| 18 to 34 Years | 0 (0.0%) | 0 (0.0%) |
| 35 to 64 Years | 3 (3.8%) | 8 (10.1%) |
| 65 to 74 Years | 0 (0.0%) | 0 (0.0%) |
| 75 Years and over | 16 (21.9%) | 6 (12.0%) |
Disability Class: Self-Care Difficulty
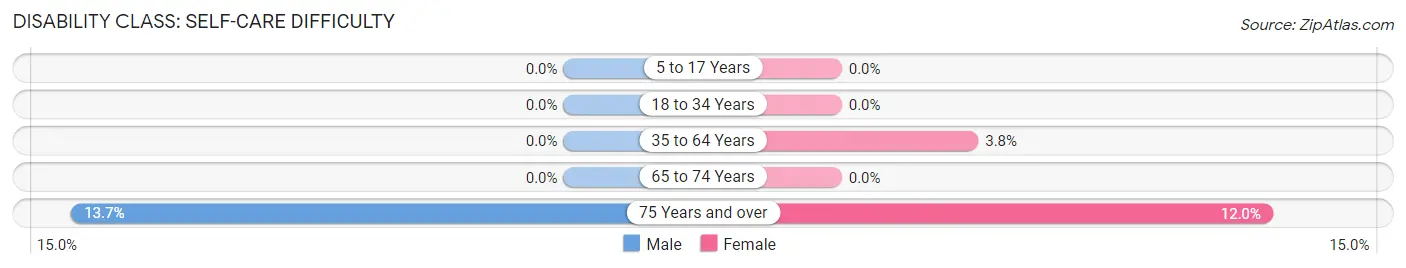
| Age Bracket | Male | Female |
| 5 to 17 Years | 0 (0.0%) | 0 (0.0%) |
| 18 to 34 Years | 0 (0.0%) | 0 (0.0%) |
| 35 to 64 Years | 0 (0.0%) | 3 (3.8%) |
| 65 to 74 Years | 0 (0.0%) | 0 (0.0%) |
| 75 Years and over | 10 (13.7%) | 6 (12.0%) |
Technology Access in Emory
Computing Device Access in Emory
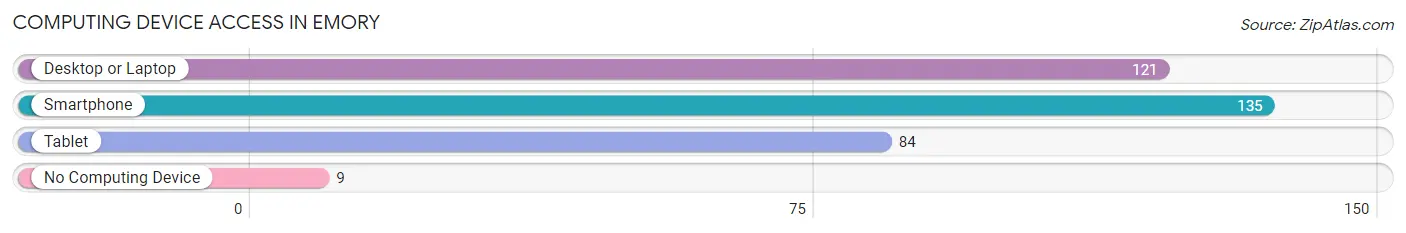
| Device Type | # Households | % Households |
| Desktop or Laptop | 121 | 78.6% |
| Smartphone | 135 | 87.7% |
| Tablet | 84 | 54.5% |
| No Computing Device | 9 | 5.8% |
| Total | 154 | 100.0% |
Internet Access in Emory
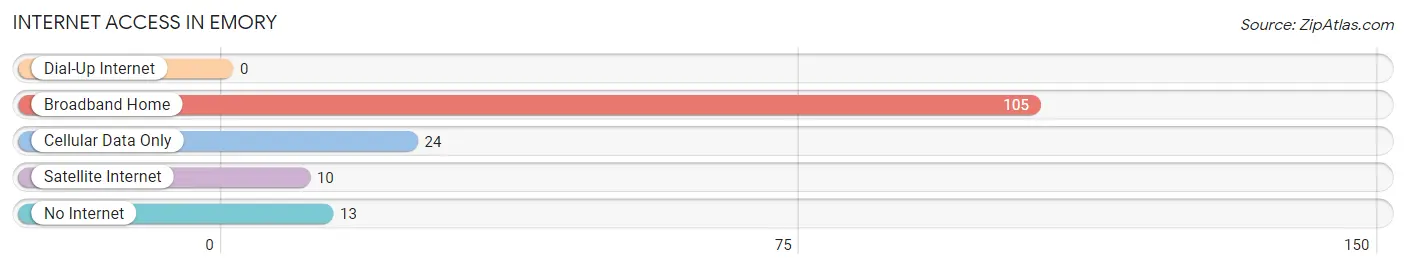
| Internet Type | # Households | % Households |
| Dial-Up Internet | 0 | 0.0% |
| Broadband Home | 105 | 68.2% |
| Cellular Data Only | 24 | 15.6% |
| Satellite Internet | 10 | 6.5% |
| No Internet | 13 | 8.4% |
| Total | 154 | 100.0% |
Emory Summary
Emory, Virginia is a small town located in the southwestern part of the state, in Washington County. It is situated on the banks of the North Fork of the Holston River, and is part of the Appalachian Mountains region. The town has a population of just over 1,000 people, and is known for its rural charm and small-town atmosphere.
History
The area that is now Emory was first settled in the late 1700s by a group of settlers from North Carolina. The town was originally known as “Mountain View”, and was later renamed “Emory” in honor of Bishop John Emory, a prominent Methodist bishop. The town was officially incorporated in 1883.
In the late 1800s, Emory was a thriving agricultural community, with many of its residents working in the local tobacco and cotton industries. The town also had a number of small businesses, including a general store, a blacksmith shop, and a grist mill.
In the early 1900s, the town began to decline as the local industries began to move away. The Great Depression further exacerbated the town’s economic woes, and by the 1940s, the population had dropped to just over 500 people.
In the 1950s, the town began to experience a resurgence, as new businesses began to move into the area. The town’s population began to grow again, and by the 2000 census, the population had grown to over 1,000 people.
Geography
Emory is located in the southwestern part of Virginia, in Washington County. The town is situated on the banks of the North Fork of the Holston River, and is part of the Appalachian Mountains region. The town is surrounded by rolling hills and lush forests, and is located just a few miles from the Virginia-Tennessee border.
The town has a total area of 1.2 square miles, all of which is land. The town is located at an elevation of 1,845 feet above sea level.
Economy
The economy of Emory is largely based on agriculture and tourism. The town is home to a number of small farms, which produce a variety of crops, including corn, soybeans, and hay. The town also has a number of small businesses, including restaurants, antique stores, and gift shops.
The town is also home to a number of tourist attractions, including the Emory & Henry College, the Washington County Museum, and the Emory & Henry National Historic District. The town also hosts a number of annual festivals and events, including the Emory & Henry College Homecoming, the Emory & Henry College Arts & Crafts Festival, and the Emory & Henry College Music Festival.
Demographics
As of the 2010 census, the population of Emory was 1,072 people. The racial makeup of the town was 95.3% White, 1.7% African American, 0.2% Native American, 0.2% Asian, 0.1% Pacific Islander, 0.7% from other races, and 1.9% from two or more races. Hispanic or Latino of any race were 1.7% of the population.
The median household income in Emory was $35,938, and the median family income was $41,250. The per capita income for the town was $17,845. About 15.2% of the population was below the poverty line.
Conclusion
Emory, Virginia is a small town located in the southwestern part of the state, in Washington County. It is situated on the banks of the North Fork of the Holston River, and is part of the Appalachian Mountains region. The town has a population of just over 1,000 people, and is known for its rural charm and small-town atmosphere. The economy of Emory is largely based on agriculture and tourism, and the town is home to a number of small businesses, farms, and tourist attractions. The population of Emory is predominantly white, with a small percentage of African Americans, Native Americans, Asians, and other races. The median household income in Emory is $35,938, and the per capita income is $17,845.
Common Questions
What is Per Capita Income in Emory?
Per Capita income in Emory is $20,631.
What is the Median Family Income in Emory?
Median Family Income in Emory is $64,688.
What is the Median Household income in Emory?
Median Household Income in Emory is $61,667.
What is Income or Wage Gap in Emory?
Income or Wage Gap in Emory is 37.6%.
Women in Emory earn 62.4 cents for every dollar earned by a man.
What is Inequality or Gini Index in Emory?
Inequality or Gini Index in Emory is 0.57.
What is the Total Population of Emory?
Total Population of Emory is 1,052.
What is the Total Male Population of Emory?
Total Male Population of Emory is 525.
What is the Total Female Population of Emory?
Total Female Population of Emory is 527.
What is the Ratio of Males per 100 Females in Emory?
There are 99.62 Males per 100 Females in Emory.
What is the Ratio of Females per 100 Males in Emory?
There are 100.38 Females per 100 Males in Emory.
What is the Median Population Age in Emory?
Median Population Age in Emory is 20.9 Years.
What is the Average Family Size in Emory
Average Family Size in Emory is 2.6 People.
What is the Average Household Size in Emory
Average Household Size in Emory is 2.3 People.
How Large is the Labor Force in Emory?
There are 563 People in the Labor Forcein in Emory.
What is the Percentage of People in the Labor Force in Emory?
55.6% of People are in the Labor Force in Emory.
What is the Unemployment Rate in Emory?
Unemployment Rate in Emory is 8.0%.