Duffield, VA Map & Demographics
Duffield Map
Duffield Overview
$29,712
PER CAPITA INCOME
$58,125
AVG FAMILY INCOME
$46,250
AVG HOUSEHOLD INCOME
35.1%
WAGE / INCOME GAP [ % ]
64.9¢/ $1
WAGE / INCOME GAP [ $ ]
0.36
INEQUALITY / GINI INDEX
65
TOTAL POPULATION
27
MALE POPULATION
38
FEMALE POPULATION
71.05
MALES / 100 FEMALES
140.74
FEMALES / 100 MALES
53.3
MEDIAN AGE
2.6
AVG FAMILY SIZE
2.1
AVG HOUSEHOLD SIZE
25
LABOR FORCE [ PEOPLE ]
39.7%
PERCENT IN LABOR FORCE
4.0%
UNEMPLOYMENT RATE
Duffield Zip Codes
Duffield Area Codes
Income in Duffield
Income Overview in Duffield
Per Capita Income in Duffield is $29,712, while median incomes of families and households are $58,125 and $46,250 respectively.
| Characteristic | Number | Measure |
| Per Capita Income | 65 | $29,712 |
| Median Family Income | 21 | $58,125 |
| Mean Family Income | 21 | $69,162 |
| Median Household Income | 31 | $46,250 |
| Mean Household Income | 31 | $55,135 |
| Income Deficit | 21 | $0 |
| Wage / Income Gap (%) | 65 | 35.14% |
| Wage / Income Gap ($) | 65 | 64.86¢ per $1 |
| Gini / Inequality Index | 65 | 0.36 |
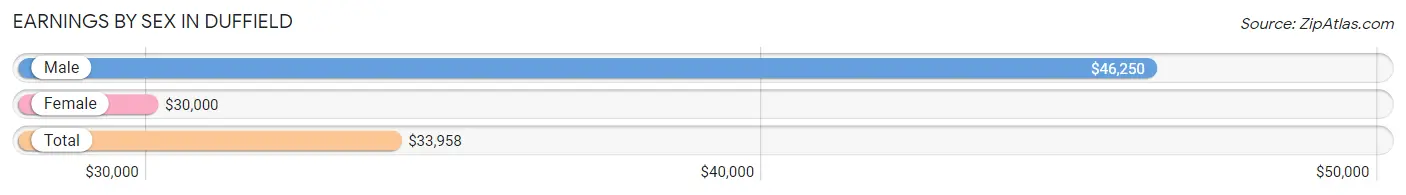
Earnings by Sex in Duffield
Average Earnings in Duffield are $33,958, $46,250 for men and $30,000 for women, a difference of 35.1%.
| Sex | Number | Average Earnings |
| Male | 13 (52.0%) | $46,250 |
| Female | 12 (48.0%) | $30,000 |
| Total | 25 (100.0%) | $33,958 |
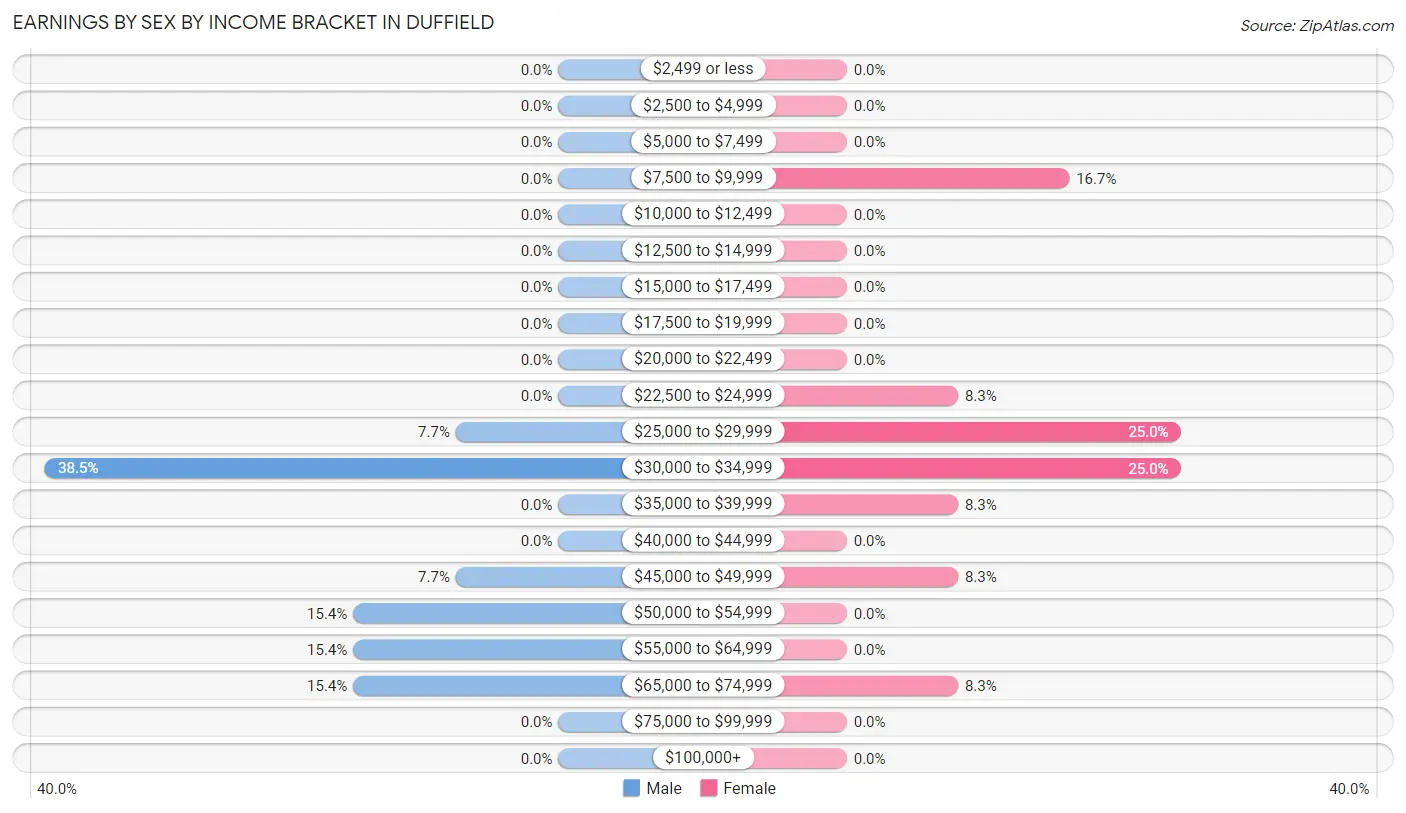
Earnings by Sex by Income Bracket in Duffield
The most common earnings brackets in Duffield are $30,000 to $34,999 for men (5 | 38.5%) and $25,000 to $29,999 for women (3 | 25.0%).
| Income | Male | Female |
| $2,499 or less | 0 (0.0%) | 0 (0.0%) |
| $2,500 to $4,999 | 0 (0.0%) | 0 (0.0%) |
| $5,000 to $7,499 | 0 (0.0%) | 0 (0.0%) |
| $7,500 to $9,999 | 0 (0.0%) | 2 (16.7%) |
| $10,000 to $12,499 | 0 (0.0%) | 0 (0.0%) |
| $12,500 to $14,999 | 0 (0.0%) | 0 (0.0%) |
| $15,000 to $17,499 | 0 (0.0%) | 0 (0.0%) |
| $17,500 to $19,999 | 0 (0.0%) | 0 (0.0%) |
| $20,000 to $22,499 | 0 (0.0%) | 0 (0.0%) |
| $22,500 to $24,999 | 0 (0.0%) | 1 (8.3%) |
| $25,000 to $29,999 | 1 (7.7%) | 3 (25.0%) |
| $30,000 to $34,999 | 5 (38.5%) | 3 (25.0%) |
| $35,000 to $39,999 | 0 (0.0%) | 1 (8.3%) |
| $40,000 to $44,999 | 0 (0.0%) | 0 (0.0%) |
| $45,000 to $49,999 | 1 (7.7%) | 1 (8.3%) |
| $50,000 to $54,999 | 2 (15.4%) | 0 (0.0%) |
| $55,000 to $64,999 | 2 (15.4%) | 0 (0.0%) |
| $65,000 to $74,999 | 2 (15.4%) | 1 (8.3%) |
| $75,000 to $99,999 | 0 (0.0%) | 0 (0.0%) |
| $100,000+ | 0 (0.0%) | 0 (0.0%) |
| Total | 13 (100.0%) | 12 (100.0%) |
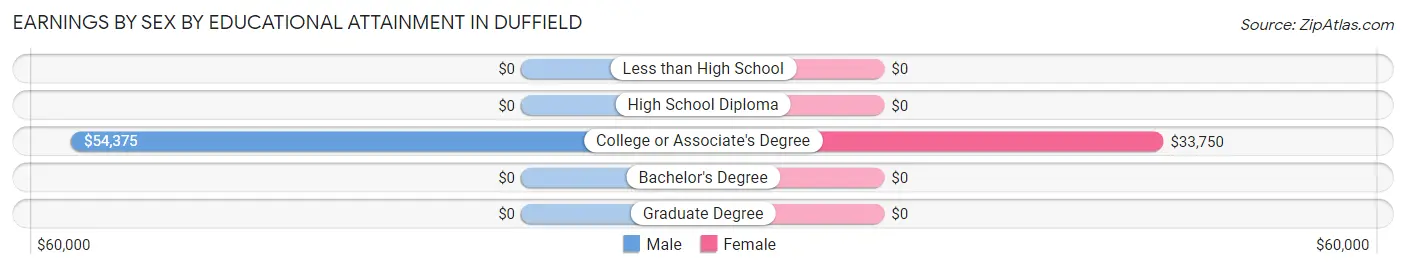
Earnings by Sex by Educational Attainment in Duffield
Average earnings in Duffield are $46,250 for men and $33,750 for women, a difference of 27.0%. Men with an educational attainment of college or associate's degree enjoy the highest average annual earnings of $54,375, while those with college or associate's degree education earn the least with $54,375. Women with an educational attainment of college or associate's degree earn the most with the average annual earnings of $33,750, while those with college or associate's degree education have the smallest earnings of $33,750.
| Educational Attainment | Male Income | Female Income |
| Less than High School | - | - |
| High School Diploma | - | - |
| College or Associate's Degree | $54,375 | $33,750 |
| Bachelor's Degree | - | - |
| Graduate Degree | - | - |
| Total | $46,250 | $33,750 |
Family Income in Duffield
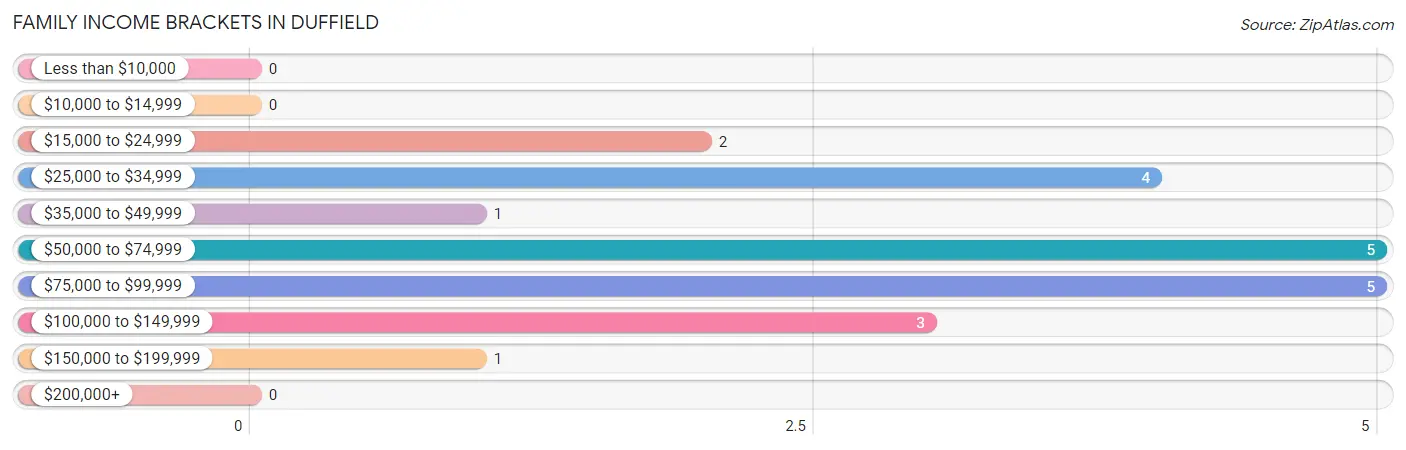
Family Income Brackets in Duffield
According to the Duffield family income data, there are 5 families falling into the $50,000 to $74,999 income range, which is the most common income bracket and makes up 23.8% of all families.
| Income Bracket | # Families | % Families |
| Less than $10,000 | 0 | 0.0% |
| $10,000 to $14,999 | 0 | 0.0% |
| $15,000 to $24,999 | 2 | 9.5% |
| $25,000 to $34,999 | 4 | 19.0% |
| $35,000 to $49,999 | 1 | 4.8% |
| $50,000 to $74,999 | 5 | 23.8% |
| $75,000 to $99,999 | 5 | 23.8% |
| $100,000 to $149,999 | 3 | 14.3% |
| $150,000 to $199,999 | 1 | 4.8% |
| $200,000+ | 0 | 0.0% |
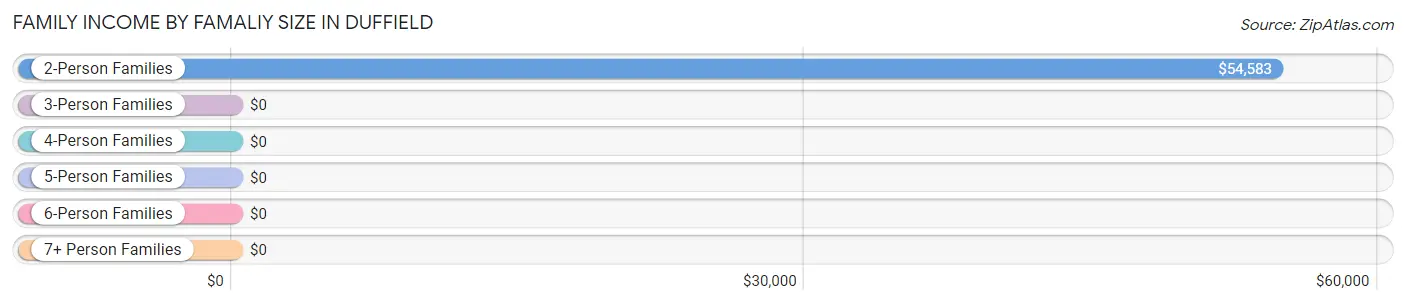
Family Income by Famaliy Size in Duffield
2-person families (15 | 71.4%) account for the highest median family income in Duffield with $54,583 per family, while 2-person families (15 | 71.4%) have the highest median income of $27,292 per family member.
| Income Bracket | # Families | Median Income |
| 2-Person Families | 15 (71.4%) | $54,583 |
| 3-Person Families | 4 (19.1%) | $0 |
| 4-Person Families | 2 (9.5%) | $0 |
| 5-Person Families | 0 (0.0%) | $0 |
| 6-Person Families | 0 (0.0%) | $0 |
| 7+ Person Families | 0 (0.0%) | $0 |
| Total | 21 (100.0%) | $58,125 |
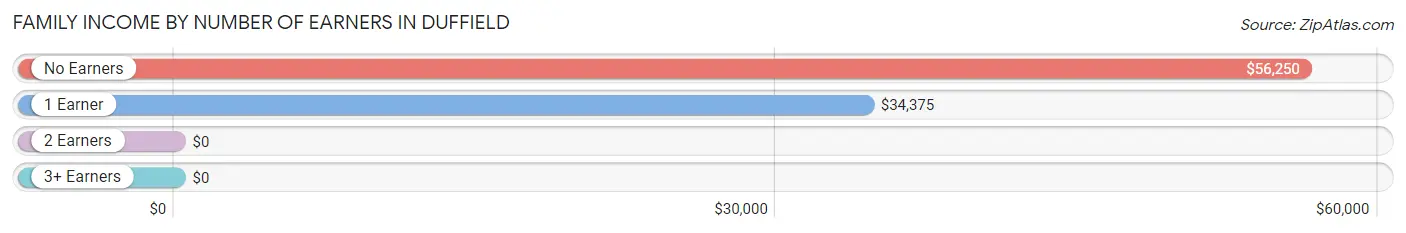
Family Income by Number of Earners in Duffield
| Number of Earners | # Families | Median Income |
| No Earners | 8 (38.1%) | $56,250 |
| 1 Earner | 8 (38.1%) | $34,375 |
| 2 Earners | 3 (14.3%) | $0 |
| 3+ Earners | 2 (9.5%) | $0 |
| Total | 21 (100.0%) | $58,125 |
Household Income in Duffield
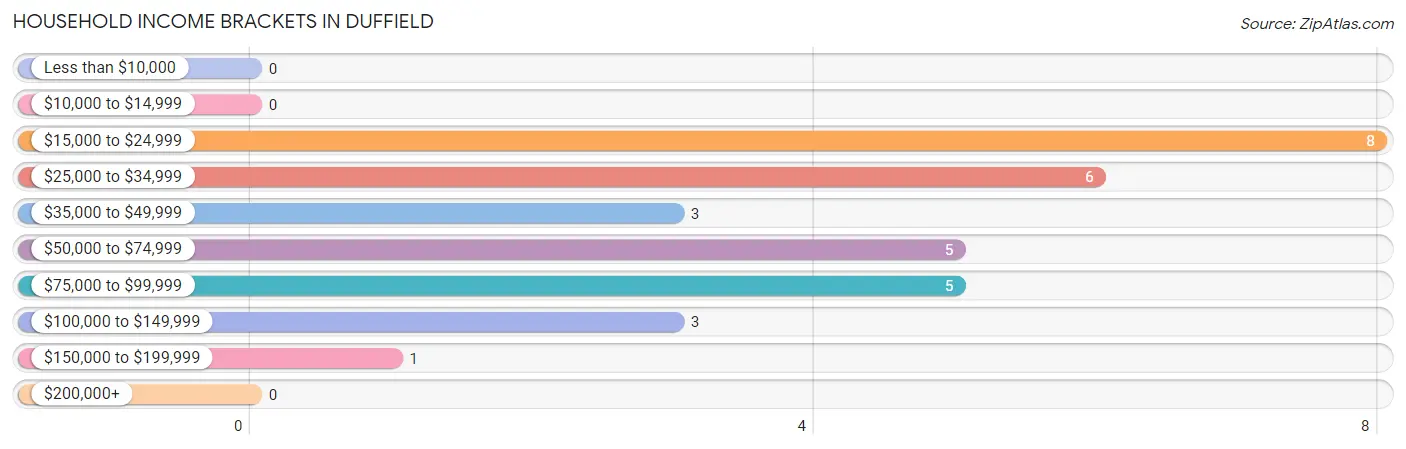
Household Income Brackets in Duffield
With 8 households falling in the category, the $15,000 to $24,999 income range is the most frequent in Duffield, accounting for 25.8% of all households.
| Income Bracket | # Households | % Households |
| Less than $10,000 | 0 | 0.0% |
| $10,000 to $14,999 | 0 | 0.0% |
| $15,000 to $24,999 | 8 | 25.8% |
| $25,000 to $34,999 | 6 | 19.4% |
| $35,000 to $49,999 | 3 | 9.7% |
| $50,000 to $74,999 | 5 | 16.1% |
| $75,000 to $99,999 | 5 | 16.1% |
| $100,000 to $149,999 | 3 | 9.7% |
| $150,000 to $199,999 | 1 | 3.2% |
| $200,000+ | 0 | 0.0% |
Household Income by Householder Age in Duffield
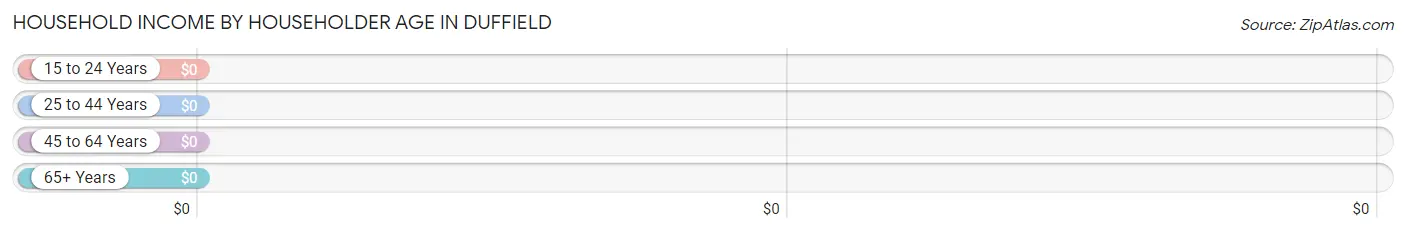
| Income Bracket | # Households | Median Income |
| 15 to 24 Years | 0 (0.0%) | $0 |
| 25 to 44 Years | 4 (12.9%) | $0 |
| 45 to 64 Years | 9 (29.0%) | $0 |
| 65+ Years | 18 (58.1%) | $0 |
| Total | 31 (100.0%) | $46,250 |
Poverty in Duffield
Income Below Poverty by Sex and Age in Duffield
With 3.7% poverty level for males and 7.9% for females among the residents of Duffield, 65 to 74 year old males and 18 to 24 year old females are the most vulnerable to poverty, with 1 males (20.0%) and 2 females (50.0%) in their respective age groups living below the poverty level.
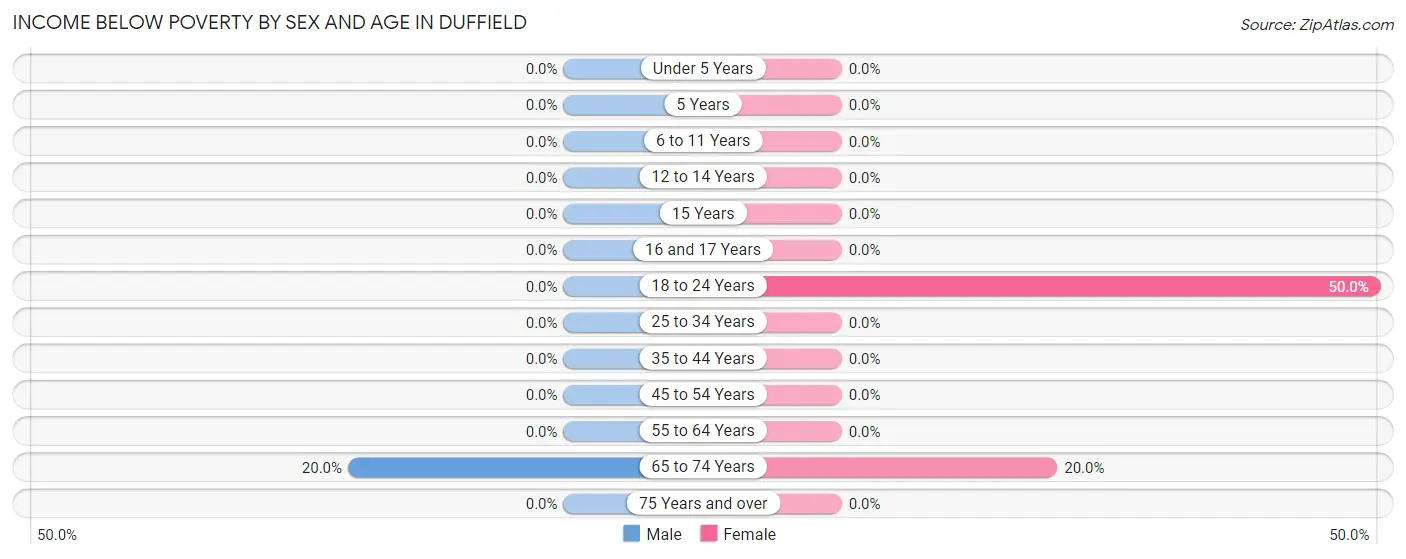
| Age Bracket | Male | Female |
| Under 5 Years | 0 (0.0%) | 0 (0.0%) |
| 5 Years | 0 (0.0%) | 0 (0.0%) |
| 6 to 11 Years | 0 (0.0%) | 0 (0.0%) |
| 12 to 14 Years | 0 (0.0%) | 0 (0.0%) |
| 15 Years | 0 (0.0%) | 0 (0.0%) |
| 16 and 17 Years | 0 (0.0%) | 0 (0.0%) |
| 18 to 24 Years | 0 (0.0%) | 2 (50.0%) |
| 25 to 34 Years | 0 (0.0%) | 0 (0.0%) |
| 35 to 44 Years | 0 (0.0%) | 0 (0.0%) |
| 45 to 54 Years | 0 (0.0%) | 0 (0.0%) |
| 55 to 64 Years | 0 (0.0%) | 0 (0.0%) |
| 65 to 74 Years | 1 (20.0%) | 1 (20.0%) |
| 75 Years and over | 0 (0.0%) | 0 (0.0%) |
| Total | 1 (3.7%) | 3 (7.9%) |
Income Above Poverty by Sex and Age in Duffield
According to the poverty statistics in Duffield, males aged 16 and 17 years and females aged under 5 years are the age groups that are most secure financially, with 100.0% of males and 100.0% of females in these age groups living above the poverty line.
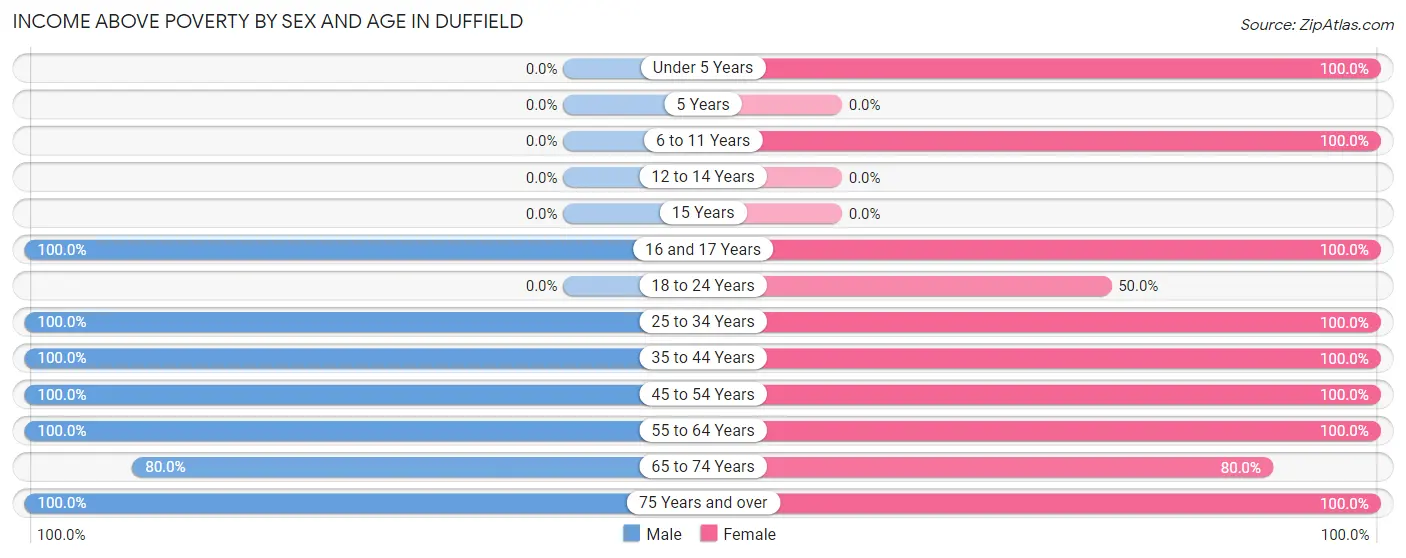
| Age Bracket | Male | Female |
| Under 5 Years | 0 (0.0%) | 1 (100.0%) |
| 5 Years | 0 (0.0%) | 0 (0.0%) |
| 6 to 11 Years | 0 (0.0%) | 1 (100.0%) |
| 12 to 14 Years | 0 (0.0%) | 0 (0.0%) |
| 15 Years | 0 (0.0%) | 0 (0.0%) |
| 16 and 17 Years | 1 (100.0%) | 1 (100.0%) |
| 18 to 24 Years | 0 (0.0%) | 2 (50.0%) |
| 25 to 34 Years | 3 (100.0%) | 2 (100.0%) |
| 35 to 44 Years | 3 (100.0%) | 2 (100.0%) |
| 45 to 54 Years | 8 (100.0%) | 10 (100.0%) |
| 55 to 64 Years | 3 (100.0%) | 1 (100.0%) |
| 65 to 74 Years | 4 (80.0%) | 4 (80.0%) |
| 75 Years and over | 4 (100.0%) | 11 (100.0%) |
| Total | 26 (96.3%) | 35 (92.1%) |
Income Below Poverty Among Married-Couple Families in Duffield
The poverty statistics for married-couple families in Duffield show that 5.3% or 1 of the total 19 families live below the poverty line. Families with no children have the highest poverty rate of 5.9%, comprising of 1 families. On the other hand, families with 1 or 2 children have the lowest poverty rate of 0.0%, which includes 0 families.
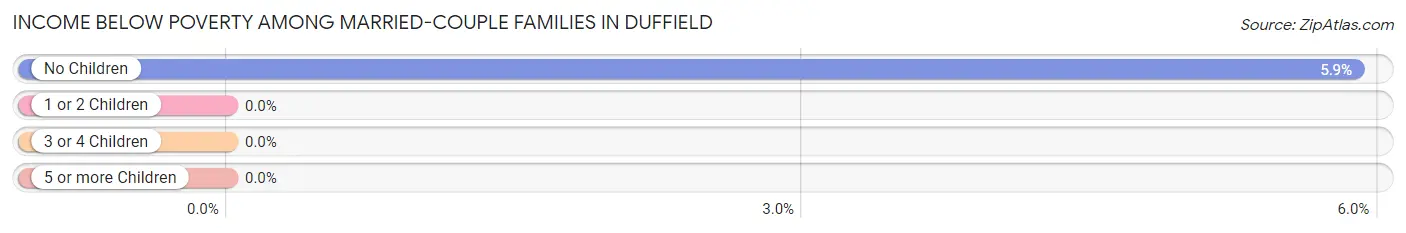
| Children | Above Poverty | Below Poverty |
| No Children | 16 (94.1%) | 1 (5.9%) |
| 1 or 2 Children | 2 (100.0%) | 0 (0.0%) |
| 3 or 4 Children | 0 (0.0%) | 0 (0.0%) |
| 5 or more Children | 0 (0.0%) | 0 (0.0%) |
| Total | 18 (94.7%) | 1 (5.3%) |
Income Below Poverty Among Single-Parent Households in Duffield
| Children | Single Father | Single Mother |
| No Children | 0 (0.0%) | 0 (0.0%) |
| 1 or 2 Children | 0 (0.0%) | 0 (0.0%) |
| 3 or 4 Children | 0 (0.0%) | 0 (0.0%) |
| 5 or more Children | 0 (0.0%) | 0 (0.0%) |
| Total | 0 (0.0%) | 0 (0.0%) |
Income Below Poverty Among Married-Couple vs Single-Parent Households in Duffield
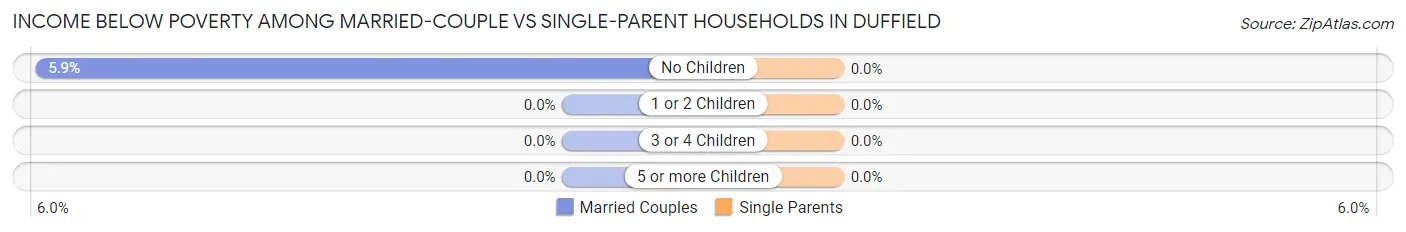
| Children | Married-Couple Families | Single-Parent Households |
| No Children | 1 (5.9%) | 0 (0.0%) |
| 1 or 2 Children | 0 (0.0%) | 0 (0.0%) |
| 3 or 4 Children | 0 (0.0%) | 0 (0.0%) |
| 5 or more Children | 0 (0.0%) | 0 (0.0%) |
| Total | 1 (5.3%) | 0 (0.0%) |
Race in Duffield
The most populous races in Duffield are White / Caucasian (55 | 84.6%), and Two or more Races (10 | 15.4%).
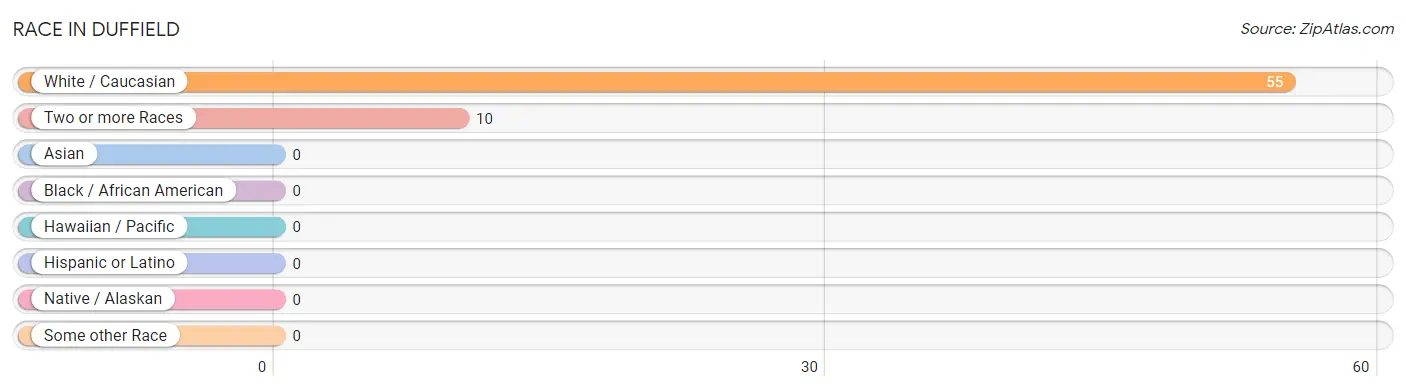
| Race | # Population | % Population |
| Asian | 0 | 0.0% |
| Black / African American | 0 | 0.0% |
| Hawaiian / Pacific | 0 | 0.0% |
| Hispanic or Latino | 0 | 0.0% |
| Native / Alaskan | 0 | 0.0% |
| White / Caucasian | 55 | 84.6% |
| Two or more Races | 10 | 15.4% |
| Some other Race | 0 | 0.0% |
| Total | 65 | 100.0% |
Ancestry in Duffield
The most populous ancestries reported in Duffield are American (23 | 35.4%), Irish (12 | 18.5%), English (11 | 16.9%), Cherokee (6 | 9.2%), and German (5 | 7.7%), together accounting for 87.7% of all Duffield residents.
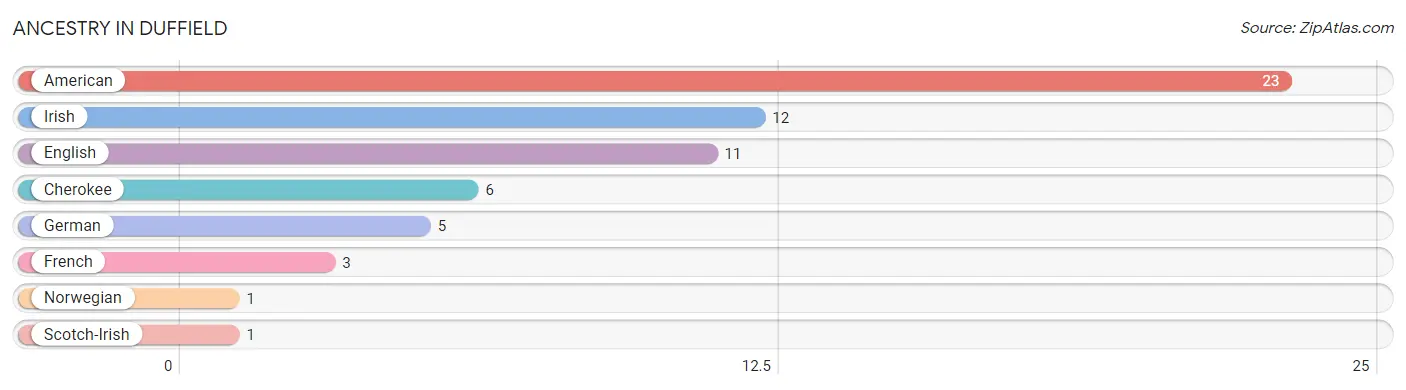
| Ancestry | # Population | % Population |
| American | 23 | 35.4% |
| Cherokee | 6 | 9.2% |
| English | 11 | 16.9% |
| French | 3 | 4.6% |
| German | 5 | 7.7% |
| Irish | 12 | 18.5% |
| Norwegian | 1 | 1.5% |
| Scotch-Irish | 1 | 1.5% | View All 8 Rows |
Immigrants in Duffield

| Immigration Origin | # Population | % Population | View All 0 Rows |
Sex and Age in Duffield
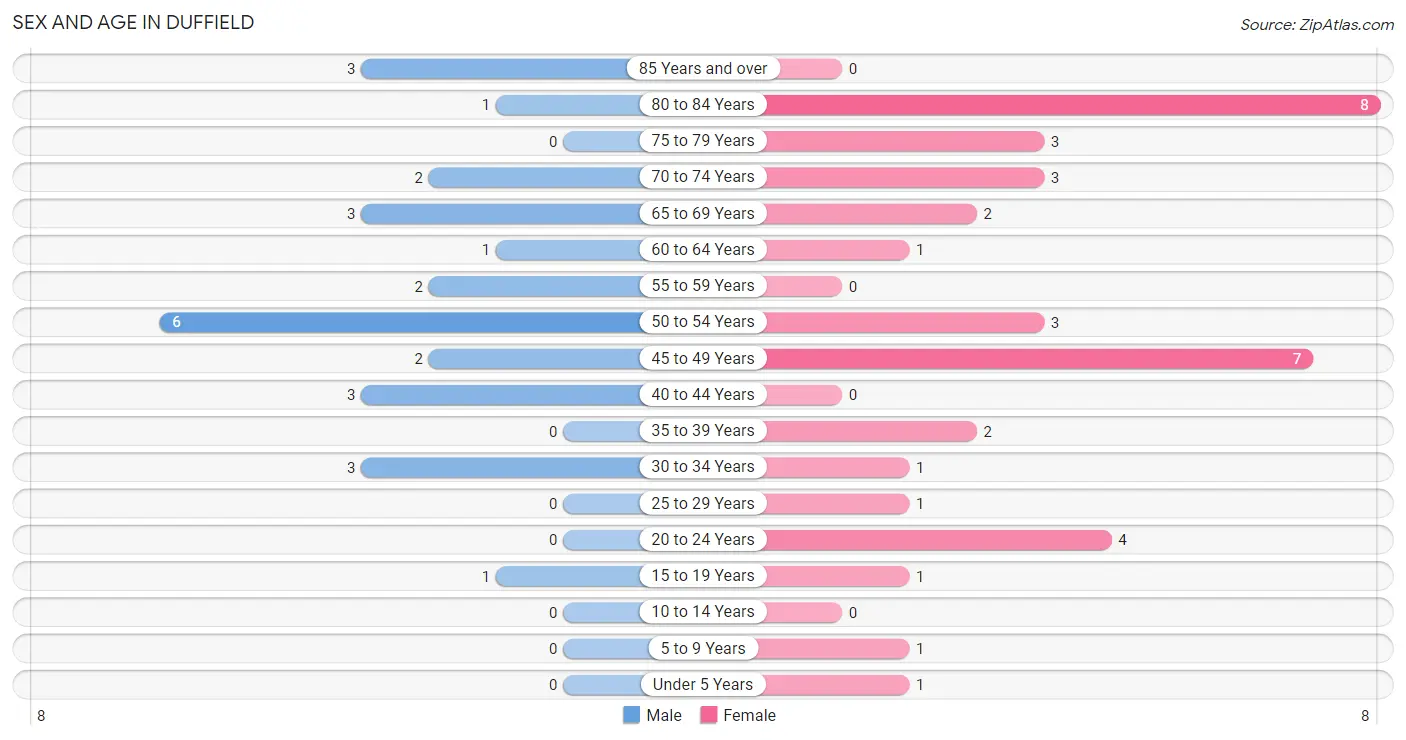
Sex and Age in Duffield
The most populous age groups in Duffield are 50 to 54 Years (6 | 22.2%) for men and 80 to 84 Years (8 | 21.0%) for women.
| Age Bracket | Male | Female |
| Under 5 Years | 0 (0.0%) | 1 (2.6%) |
| 5 to 9 Years | 0 (0.0%) | 1 (2.6%) |
| 10 to 14 Years | 0 (0.0%) | 0 (0.0%) |
| 15 to 19 Years | 1 (3.7%) | 1 (2.6%) |
| 20 to 24 Years | 0 (0.0%) | 4 (10.5%) |
| 25 to 29 Years | 0 (0.0%) | 1 (2.6%) |
| 30 to 34 Years | 3 (11.1%) | 1 (2.6%) |
| 35 to 39 Years | 0 (0.0%) | 2 (5.3%) |
| 40 to 44 Years | 3 (11.1%) | 0 (0.0%) |
| 45 to 49 Years | 2 (7.4%) | 7 (18.4%) |
| 50 to 54 Years | 6 (22.2%) | 3 (7.9%) |
| 55 to 59 Years | 2 (7.4%) | 0 (0.0%) |
| 60 to 64 Years | 1 (3.7%) | 1 (2.6%) |
| 65 to 69 Years | 3 (11.1%) | 2 (5.3%) |
| 70 to 74 Years | 2 (7.4%) | 3 (7.9%) |
| 75 to 79 Years | 0 (0.0%) | 3 (7.9%) |
| 80 to 84 Years | 1 (3.7%) | 8 (21.0%) |
| 85 Years and over | 3 (11.1%) | 0 (0.0%) |
| Total | 27 (100.0%) | 38 (100.0%) |
Families and Households in Duffield
Median Family Size in Duffield
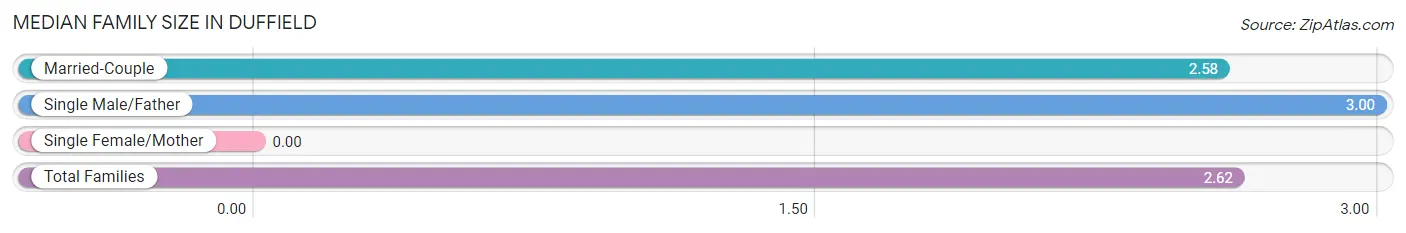
| Family Type | # Families | Family Size |
| Married-Couple | 19 (90.5%) | 2.58 |
| Single Male/Father | 2 (9.5%) | 3.00 |
| Single Female/Mother | 0 (0.0%) | - |
| Total Families | 21 (100.0%) | 2.62 |
Median Household Size in Duffield
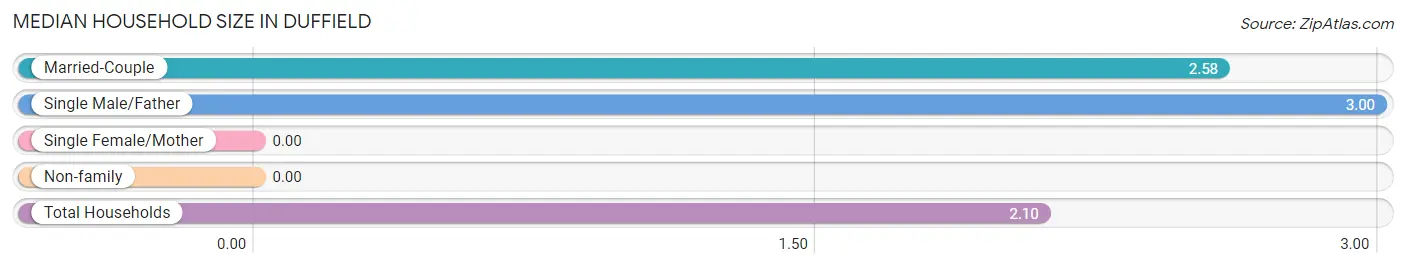
| Household Type | # Households | Household Size |
| Married-Couple | 19 (61.3%) | 2.58 |
| Single Male/Father | 2 (6.5%) | 3.00 |
| Single Female/Mother | 0 (0.0%) | - |
| Non-family | 10 (32.3%) | - |
| Total Households | 31 (100.0%) | 2.10 |
Household Size by Marriage Status in Duffield
Out of a total of 31 households in Duffield, 21 (67.7%) are family households, while 10 (32.3%) are nonfamily households. The most numerous type of family households are 2-person households, comprising 15, and the most common type of nonfamily households are 1-person households, comprising 10.
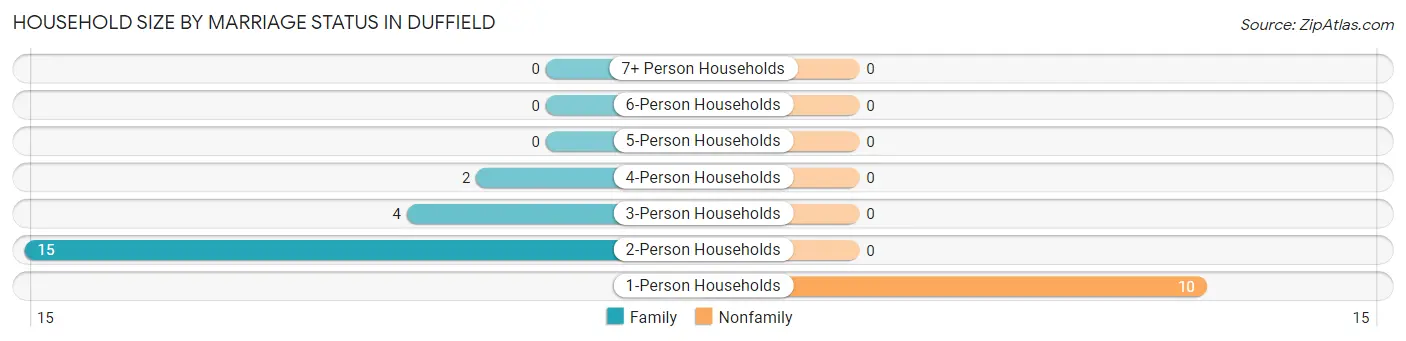
| Household Size | Family Households | Nonfamily Households |
| 1-Person Households | - | 10 (32.3%) |
| 2-Person Households | 15 (48.4%) | 0 (0.0%) |
| 3-Person Households | 4 (12.9%) | 0 (0.0%) |
| 4-Person Households | 2 (6.5%) | 0 (0.0%) |
| 5-Person Households | 0 (0.0%) | 0 (0.0%) |
| 6-Person Households | 0 (0.0%) | 0 (0.0%) |
| 7+ Person Households | 0 (0.0%) | 0 (0.0%) |
| Total | 21 (67.7%) | 10 (32.3%) |
Female Fertility in Duffield
Fertility by Age in Duffield
| Age Bracket | Women with Births | Births / 1,000 Women |
| 15 to 19 years | 0 (0.0%) | 0.0 |
| 20 to 34 years | 0 (0.0%) | 0.0 |
| 35 to 50 years | 0 (0.0%) | 0.0 |
| Total | 0 (0.0%) | 0.0 |
Fertility by Age by Marriage Status in Duffield
| Age Bracket | Married | Unmarried |
| 15 to 19 years | 0 (0.0%) | 0 (0.0%) |
| 20 to 34 years | 0 (0.0%) | 0 (0.0%) |
| 35 to 50 years | 0 (0.0%) | 0 (0.0%) |
| Total | 0 (0.0%) | 0 (0.0%) |
Fertility by Education in Duffield
| Educational Attainment | Women with Births | Births / 1,000 Women |
| Less than High School | 0 (0.0%) | 0.0 |
| High School Diploma | 0 (0.0%) | 0.0 |
| College or Associate's Degree | 0 (0.0%) | 0.0 |
| Bachelor's Degree | 0 (0.0%) | 0.0 |
| Graduate Degree | 0 (0.0%) | 0.0 |
| Total | 0 (0.0%) | 0.0 |
Fertility by Education by Marriage Status in Duffield
| Educational Attainment | Married | Unmarried |
| Less than High School | 0 (0.0%) | 0 (0.0%) |
| High School Diploma | 0 (0.0%) | 0 (0.0%) |
| College or Associate's Degree | 0 (0.0%) | 0 (0.0%) |
| Bachelor's Degree | 0 (0.0%) | 0 (0.0%) |
| Graduate Degree | 0 (0.0%) | 0 (0.0%) |
| Total | 0 (0.0%) | 0 (0.0%) |
Employment Characteristics in Duffield
Employment by Class of Employer in Duffield
Among the 24 employed individuals in Duffield, private company employees (19 | 79.2%), local government employees (3 | 12.5%), and state government employees (1 | 4.2%) make up the most common classes of employment.
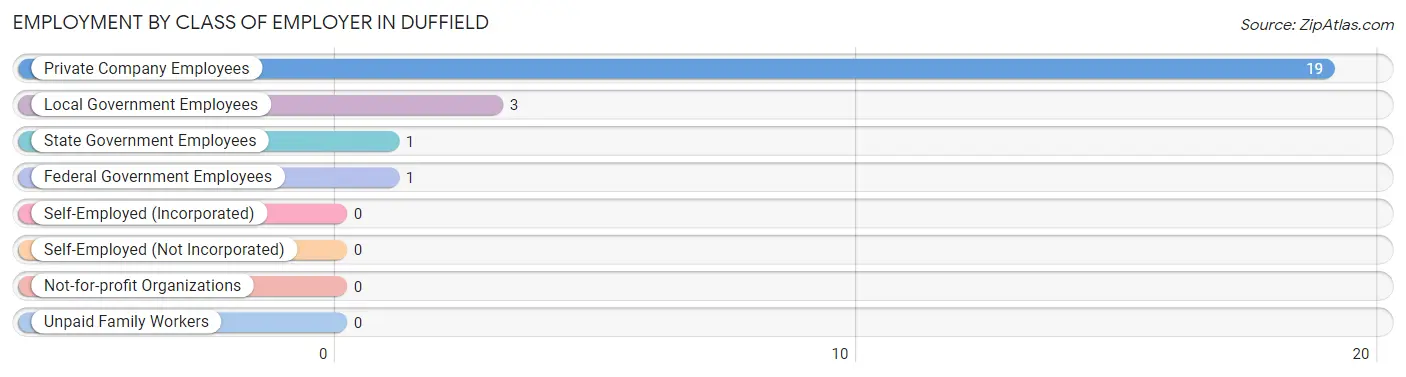
| Employer Class | # Employees | % Employees |
| Private Company Employees | 19 | 79.2% |
| Self-Employed (Incorporated) | 0 | 0.0% |
| Self-Employed (Not Incorporated) | 0 | 0.0% |
| Not-for-profit Organizations | 0 | 0.0% |
| Local Government Employees | 3 | 12.5% |
| State Government Employees | 1 | 4.2% |
| Federal Government Employees | 1 | 4.2% |
| Unpaid Family Workers | 0 | 0.0% |
| Total | 24 | 100.0% |
Employment Status by Age in Duffield
According to the labor force statistics for Duffield, out of the total population over 16 years of age (63), 39.7% or 25 individuals are in the labor force, with 4.0% or 1 of them unemployed. The age group with the highest labor force participation rate is 20 to 24 years, with 100.0% or 4 individuals in the labor force. Within the labor force, the 45 to 54 years age range has the highest percentage of unemployed individuals, with 10.0% or 1 of them being unemployed.
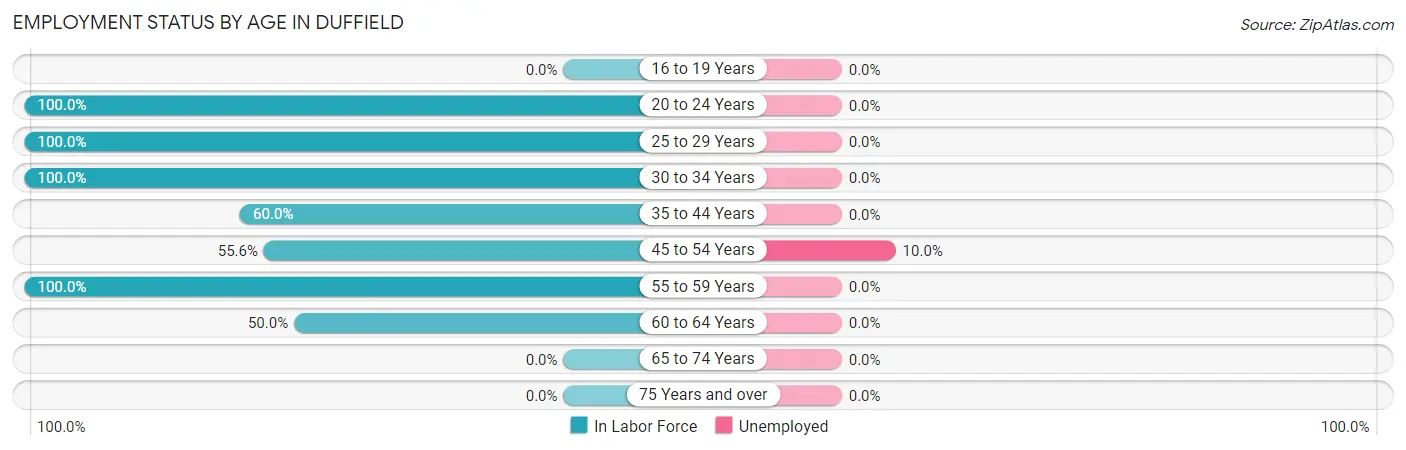
| Age Bracket | In Labor Force | Unemployed |
| 16 to 19 Years | 0 (0.0%) | 0 (0.0%) |
| 20 to 24 Years | 4 (100.0%) | 0 (0.0%) |
| 25 to 29 Years | 1 (100.0%) | 0 (0.0%) |
| 30 to 34 Years | 4 (100.0%) | 0 (0.0%) |
| 35 to 44 Years | 3 (60.0%) | 0 (0.0%) |
| 45 to 54 Years | 10 (55.6%) | 1 (10.0%) |
| 55 to 59 Years | 2 (100.0%) | 0 (0.0%) |
| 60 to 64 Years | 1 (50.0%) | 0 (0.0%) |
| 65 to 74 Years | 0 (0.0%) | 0 (0.0%) |
| 75 Years and over | 0 (0.0%) | 0 (0.0%) |
| Total | 25 (39.7%) | 1 (4.0%) |
Employment Status by Educational Attainment in Duffield
According to labor force statistics for Duffield, 65.6% of individuals (21) out of the total population between 25 and 64 years of age (32) are in the labor force, with 4.8% or 1 of them being unemployed. The group with the highest labor force participation rate are those with the educational attainment of less than high school, with 100.0% or 4 individuals in the labor force. Within the labor force, individuals with high school diploma education have the highest percentage of unemployment, with 33.3% or 1 of them being unemployed.
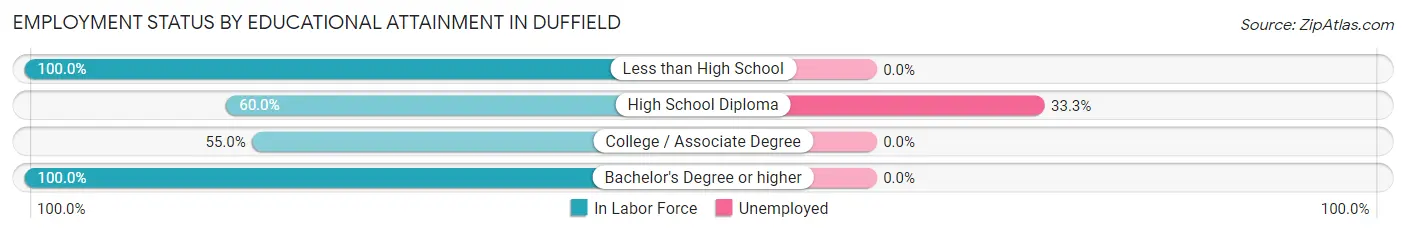
| Educational Attainment | In Labor Force | Unemployed |
| Less than High School | 4 (100.0%) | 0 (0.0%) |
| High School Diploma | 3 (60.0%) | 2 (33.3%) |
| College / Associate Degree | 11 (55.0%) | 0 (0.0%) |
| Bachelor's Degree or higher | 3 (100.0%) | 0 (0.0%) |
| Total | 21 (65.6%) | 2 (4.8%) |
Employment Occupations by Sex in Duffield
Management, Business, Science and Arts Occupations
The most common Management, Business, Science and Arts occupations in Duffield are Health Diagnosing & Treating (3 | 12.5%), Computers, Engineering & Science (1 | 4.2%), Architecture & Engineering (1 | 4.2%), Community & Social Service (1 | 4.2%), and Education Instruction & Library (1 | 4.2%).
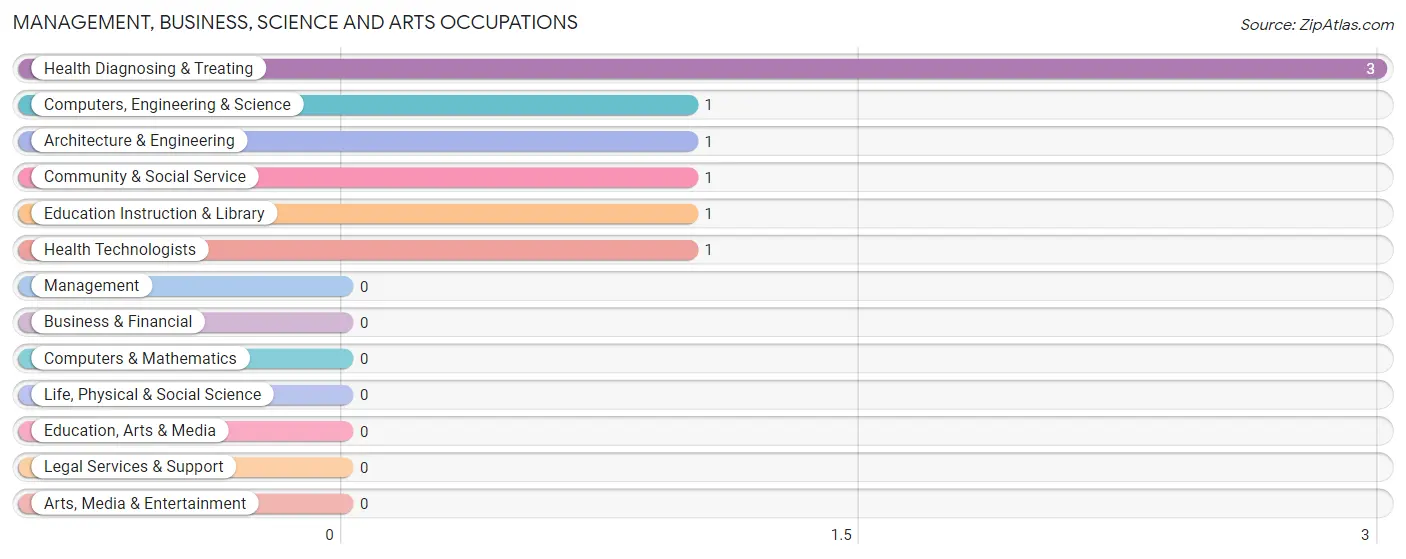
Management, Business, Science and Arts Occupations by Sex
Within the Management, Business, Science and Arts occupations in Duffield, the most male-oriented occupations are Community & Social Service (100.0%), and Education Instruction & Library (100.0%), while the most female-oriented occupations are Computers, Engineering & Science (100.0%), Architecture & Engineering (100.0%), and Health Diagnosing & Treating (100.0%).
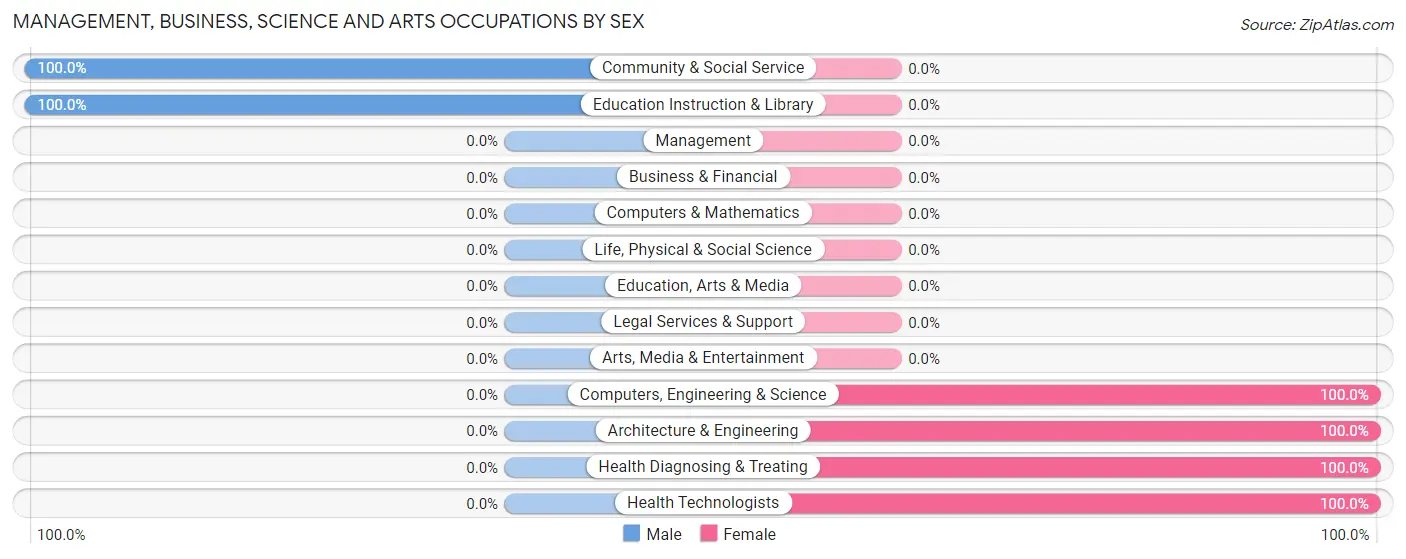
| Occupation | Male | Female |
| Management | 0 (0.0%) | 0 (0.0%) |
| Business & Financial | 0 (0.0%) | 0 (0.0%) |
| Computers, Engineering & Science | 0 (0.0%) | 1 (100.0%) |
| Computers & Mathematics | 0 (0.0%) | 0 (0.0%) |
| Architecture & Engineering | 0 (0.0%) | 1 (100.0%) |
| Life, Physical & Social Science | 0 (0.0%) | 0 (0.0%) |
| Community & Social Service | 1 (100.0%) | 0 (0.0%) |
| Education, Arts & Media | 0 (0.0%) | 0 (0.0%) |
| Legal Services & Support | 0 (0.0%) | 0 (0.0%) |
| Education Instruction & Library | 1 (100.0%) | 0 (0.0%) |
| Arts, Media & Entertainment | 0 (0.0%) | 0 (0.0%) |
| Health Diagnosing & Treating | 0 (0.0%) | 3 (100.0%) |
| Health Technologists | 0 (0.0%) | 1 (100.0%) |
| Total (Category) | 1 (20.0%) | 4 (80.0%) |
| Total (Overall) | 12 (50.0%) | 12 (50.0%) |
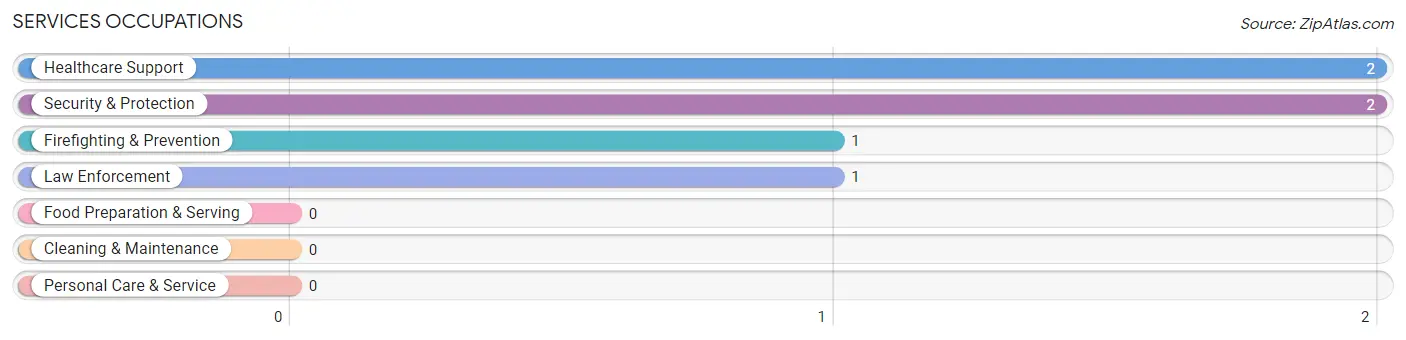
Services Occupations
The most common Services occupations in Duffield are Healthcare Support (2 | 8.3%), Security & Protection (2 | 8.3%), Firefighting & Prevention (1 | 4.2%), and Law Enforcement (1 | 4.2%).
Services Occupations by Sex
Within the Services occupations in Duffield, the most male-oriented occupations are Firefighting & Prevention (100.0%), and Security & Protection (50.0%), while the most female-oriented occupations are Healthcare Support (100.0%), Law Enforcement (100.0%), and Security & Protection (50.0%).
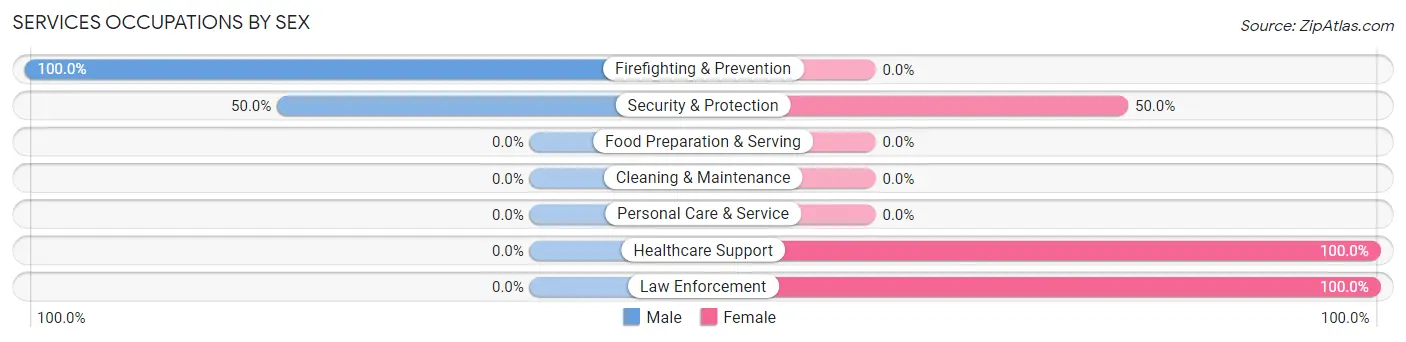
| Occupation | Male | Female |
| Healthcare Support | 0 (0.0%) | 2 (100.0%) |
| Security & Protection | 1 (50.0%) | 1 (50.0%) |
| Firefighting & Prevention | 1 (100.0%) | 0 (0.0%) |
| Law Enforcement | 0 (0.0%) | 1 (100.0%) |
| Food Preparation & Serving | 0 (0.0%) | 0 (0.0%) |
| Cleaning & Maintenance | 0 (0.0%) | 0 (0.0%) |
| Personal Care & Service | 0 (0.0%) | 0 (0.0%) |
| Total (Category) | 1 (25.0%) | 3 (75.0%) |
| Total (Overall) | 12 (50.0%) | 12 (50.0%) |
Sales and Office Occupations
The most common Sales and Office occupations in Duffield are Sales & Related (2 | 8.3%), and Office & Administration (2 | 8.3%).
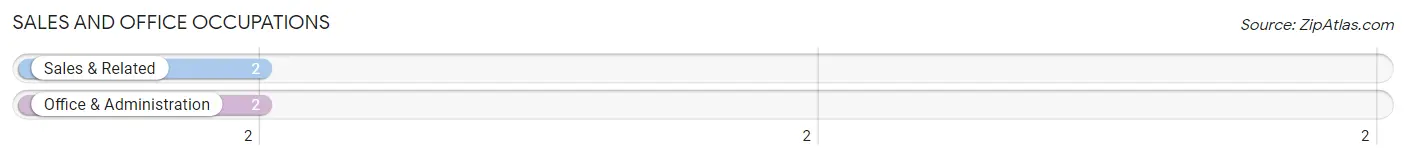
Sales and Office Occupations by Sex
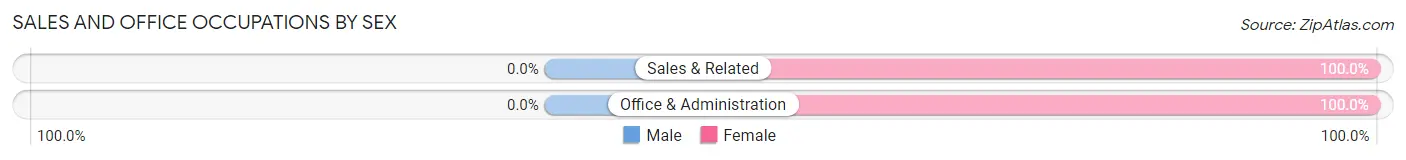
| Occupation | Male | Female |
| Sales & Related | 0 (0.0%) | 2 (100.0%) |
| Office & Administration | 0 (0.0%) | 2 (100.0%) |
| Total (Category) | 0 (0.0%) | 4 (100.0%) |
| Total (Overall) | 12 (50.0%) | 12 (50.0%) |
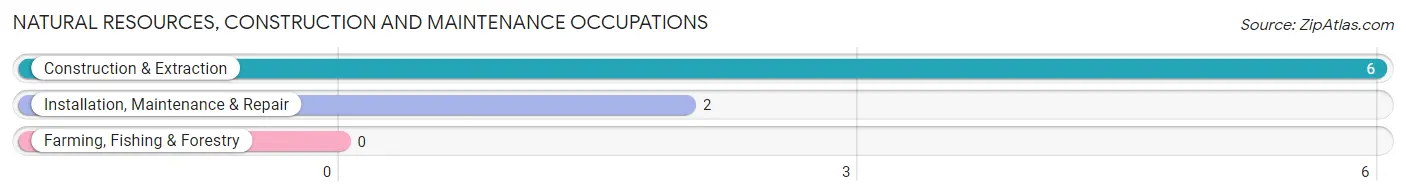
Natural Resources, Construction and Maintenance Occupations
The most common Natural Resources, Construction and Maintenance occupations in Duffield are Construction & Extraction (6 | 25.0%), and Installation, Maintenance & Repair (2 | 8.3%).
Natural Resources, Construction and Maintenance Occupations by Sex
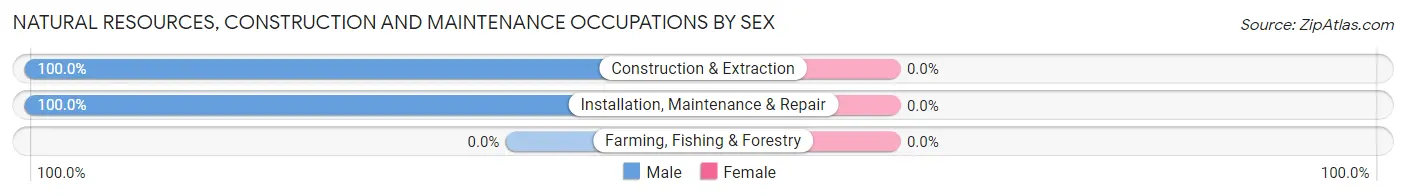
| Occupation | Male | Female |
| Farming, Fishing & Forestry | 0 (0.0%) | 0 (0.0%) |
| Construction & Extraction | 6 (100.0%) | 0 (0.0%) |
| Installation, Maintenance & Repair | 2 (100.0%) | 0 (0.0%) |
| Total (Category) | 8 (100.0%) | 0 (0.0%) |
| Total (Overall) | 12 (50.0%) | 12 (50.0%) |
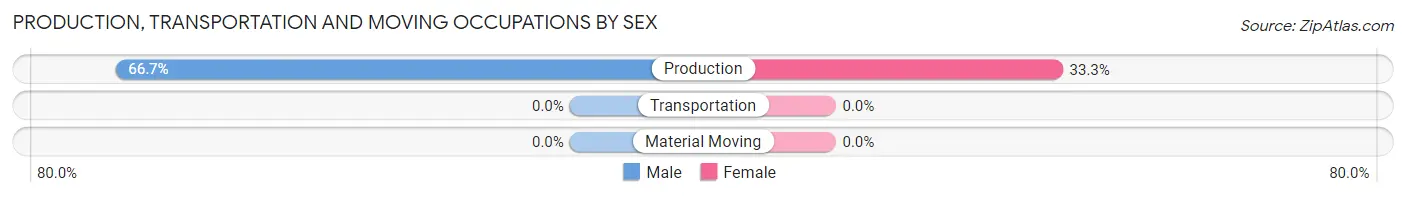
Production, Transportation and Moving Occupations
The most common Production, Transportation and Moving occupations in Duffield are , and Production (3 | 12.5%).
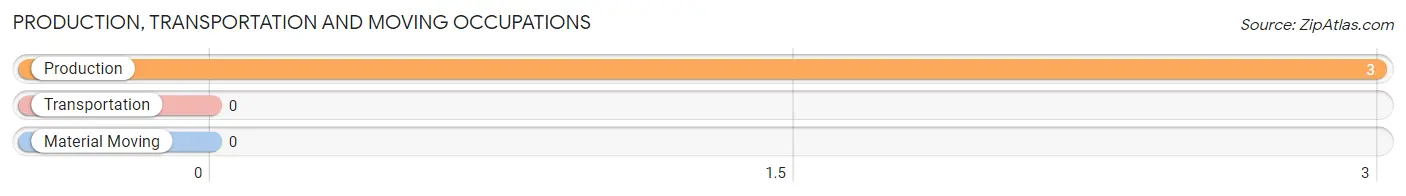
Production, Transportation and Moving Occupations by Sex
| Occupation | Male | Female |
| Production | 2 (66.7%) | 1 (33.3%) |
| Transportation | 0 (0.0%) | 0 (0.0%) |
| Material Moving | 0 (0.0%) | 0 (0.0%) |
| Total (Category) | 2 (66.7%) | 1 (33.3%) |
| Total (Overall) | 12 (50.0%) | 12 (50.0%) |
Employment Industries by Sex in Duffield
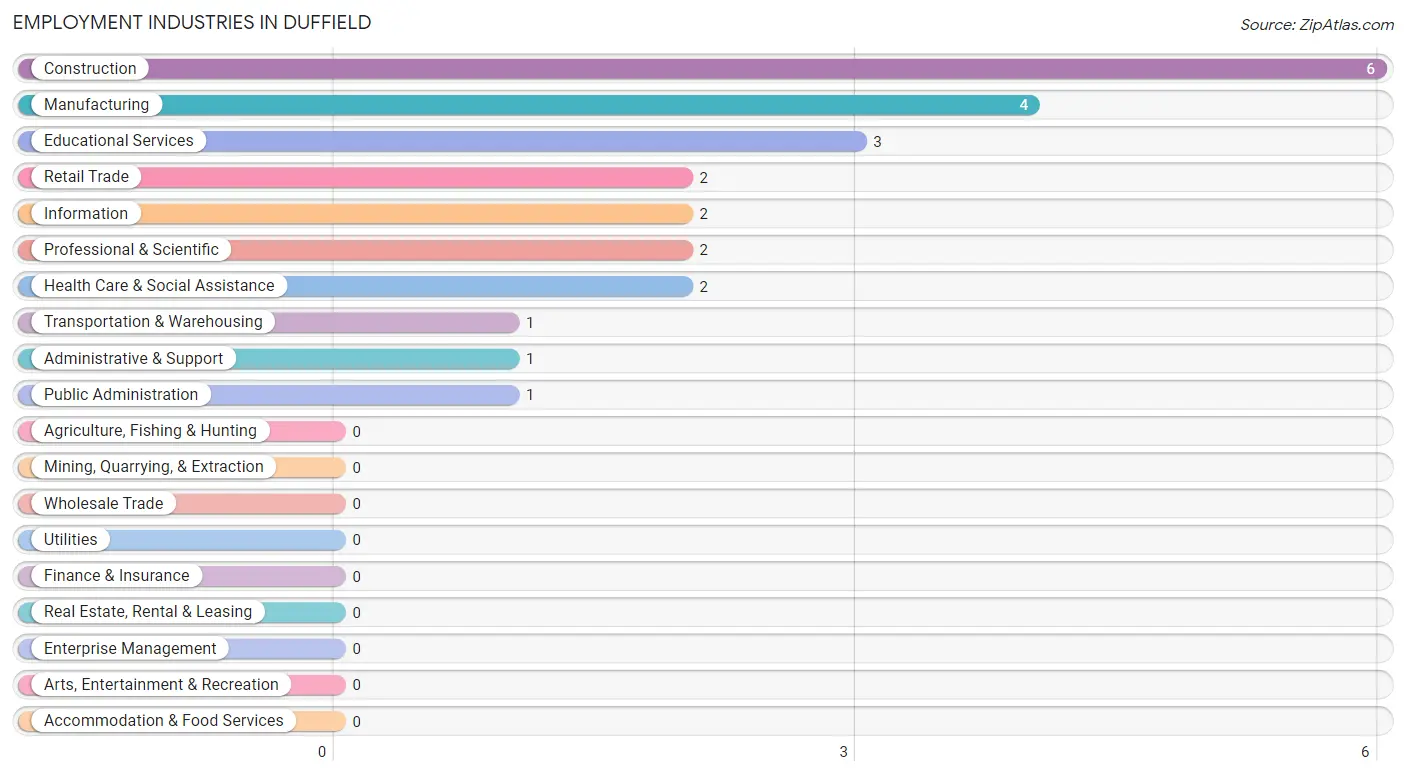
Employment Industries in Duffield
The major employment industries in Duffield include Construction (6 | 25.0%), Manufacturing (4 | 16.7%), Educational Services (3 | 12.5%), Retail Trade (2 | 8.3%), and Information (2 | 8.3%).
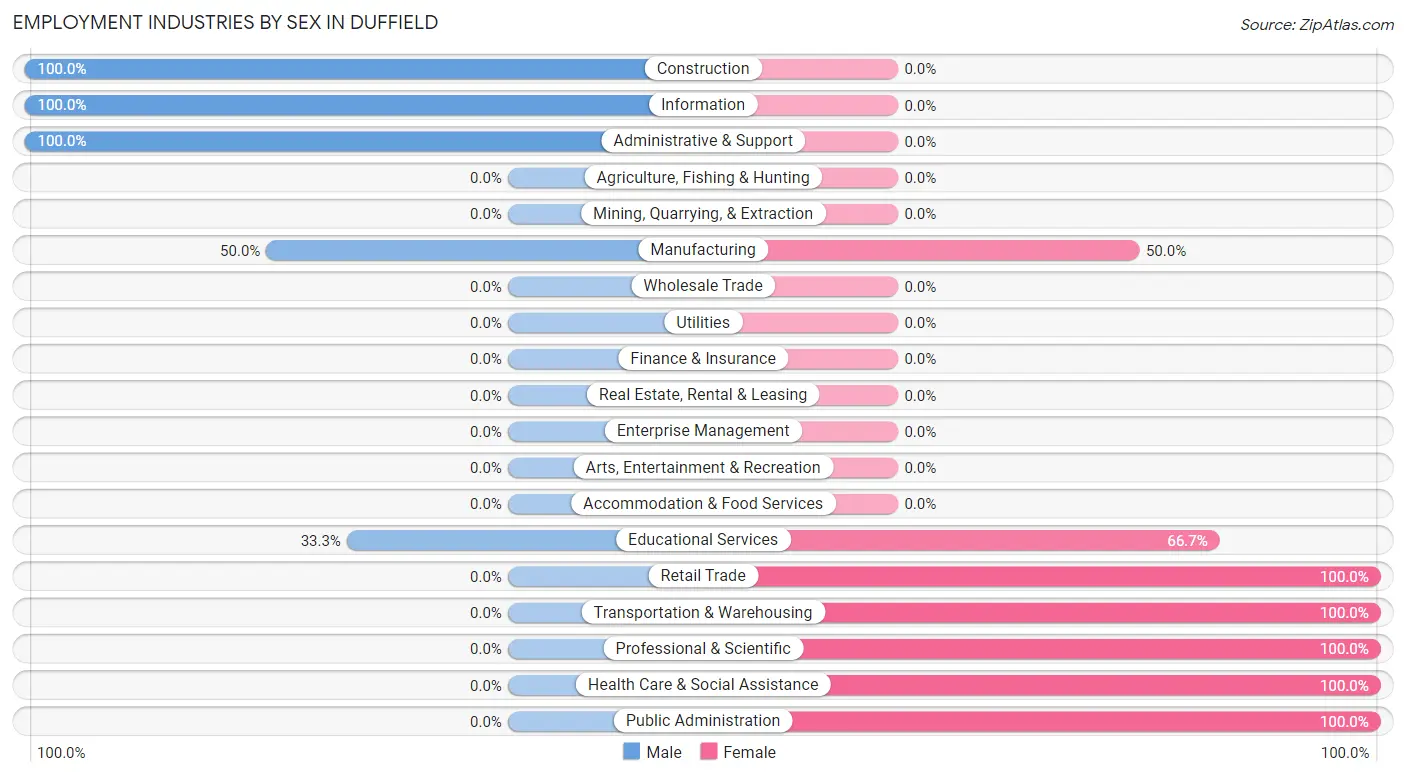
Employment Industries by Sex in Duffield
The Duffield industries that see more men than women are Construction (100.0%), Information (100.0%), and Administrative & Support (100.0%), whereas the industries that tend to have a higher number of women are Retail Trade (100.0%), Transportation & Warehousing (100.0%), and Professional & Scientific (100.0%).
| Industry | Male | Female |
| Agriculture, Fishing & Hunting | 0 (0.0%) | 0 (0.0%) |
| Mining, Quarrying, & Extraction | 0 (0.0%) | 0 (0.0%) |
| Construction | 6 (100.0%) | 0 (0.0%) |
| Manufacturing | 2 (50.0%) | 2 (50.0%) |
| Wholesale Trade | 0 (0.0%) | 0 (0.0%) |
| Retail Trade | 0 (0.0%) | 2 (100.0%) |
| Transportation & Warehousing | 0 (0.0%) | 1 (100.0%) |
| Utilities | 0 (0.0%) | 0 (0.0%) |
| Information | 2 (100.0%) | 0 (0.0%) |
| Finance & Insurance | 0 (0.0%) | 0 (0.0%) |
| Real Estate, Rental & Leasing | 0 (0.0%) | 0 (0.0%) |
| Professional & Scientific | 0 (0.0%) | 2 (100.0%) |
| Enterprise Management | 0 (0.0%) | 0 (0.0%) |
| Administrative & Support | 1 (100.0%) | 0 (0.0%) |
| Educational Services | 1 (33.3%) | 2 (66.7%) |
| Health Care & Social Assistance | 0 (0.0%) | 2 (100.0%) |
| Arts, Entertainment & Recreation | 0 (0.0%) | 0 (0.0%) |
| Accommodation & Food Services | 0 (0.0%) | 0 (0.0%) |
| Public Administration | 0 (0.0%) | 1 (100.0%) |
| Total | 12 (50.0%) | 12 (50.0%) |
Education in Duffield
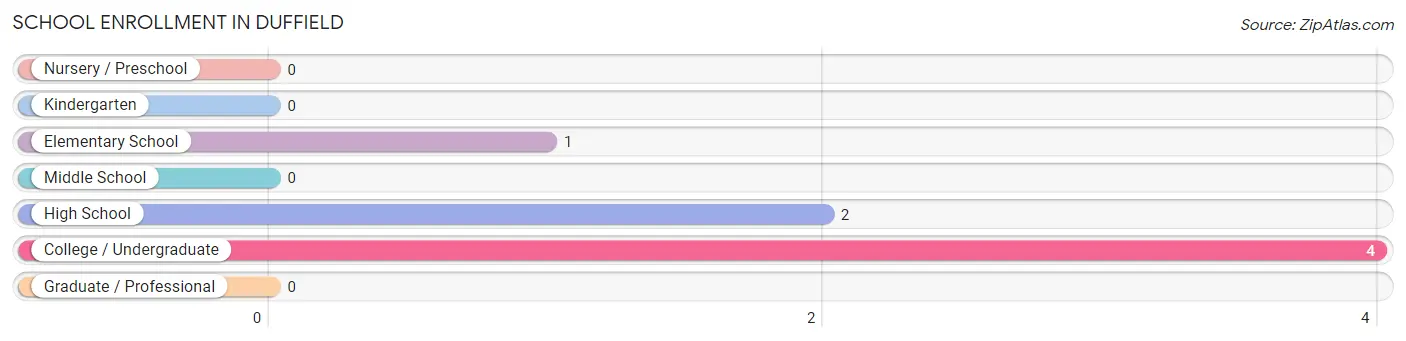
School Enrollment in Duffield
The most common levels of schooling among the 7 students in Duffield are college / undergraduate (4 | 57.1%), high school (2 | 28.6%), and elementary school (1 | 14.3%).
| School Level | # Students | % Students |
| Nursery / Preschool | 0 | 0.0% |
| Kindergarten | 0 | 0.0% |
| Elementary School | 1 | 14.3% |
| Middle School | 0 | 0.0% |
| High School | 2 | 28.6% |
| College / Undergraduate | 4 | 57.1% |
| Graduate / Professional | 0 | 0.0% |
| Total | 7 | 100.0% |
School Enrollment by Age by Funding Source in Duffield
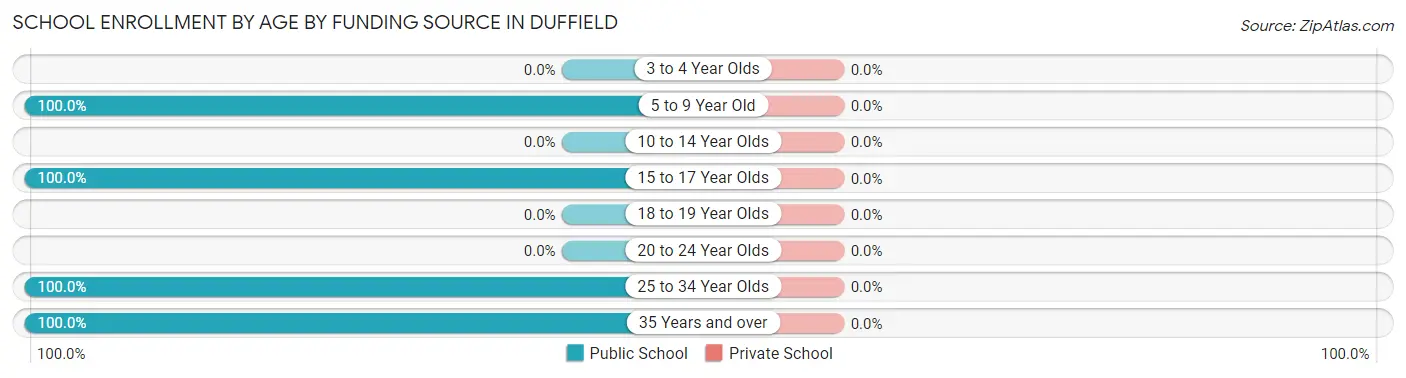
| Age Bracket | Public School | Private School |
| 3 to 4 Year Olds | 0 (0.0%) | 0 (0.0%) |
| 5 to 9 Year Old | 1 (100.0%) | 0 (0.0%) |
| 10 to 14 Year Olds | 0 (0.0%) | 0 (0.0%) |
| 15 to 17 Year Olds | 2 (100.0%) | 0 (0.0%) |
| 18 to 19 Year Olds | 0 (0.0%) | 0 (0.0%) |
| 20 to 24 Year Olds | 0 (0.0%) | 0 (0.0%) |
| 25 to 34 Year Olds | 2 (100.0%) | 0 (0.0%) |
| 35 Years and over | 2 (100.0%) | 0 (0.0%) |
| Total | 7 (100.0%) | 0 (0.0%) |
Educational Attainment by Field of Study in Duffield
Bio, nature & agricultural (1 | 33.3%), science & technology (1 | 33.3%), and business (1 | 33.3%) are the most common fields of study among 3 individuals in Duffield who have obtained a bachelor's degree or higher.
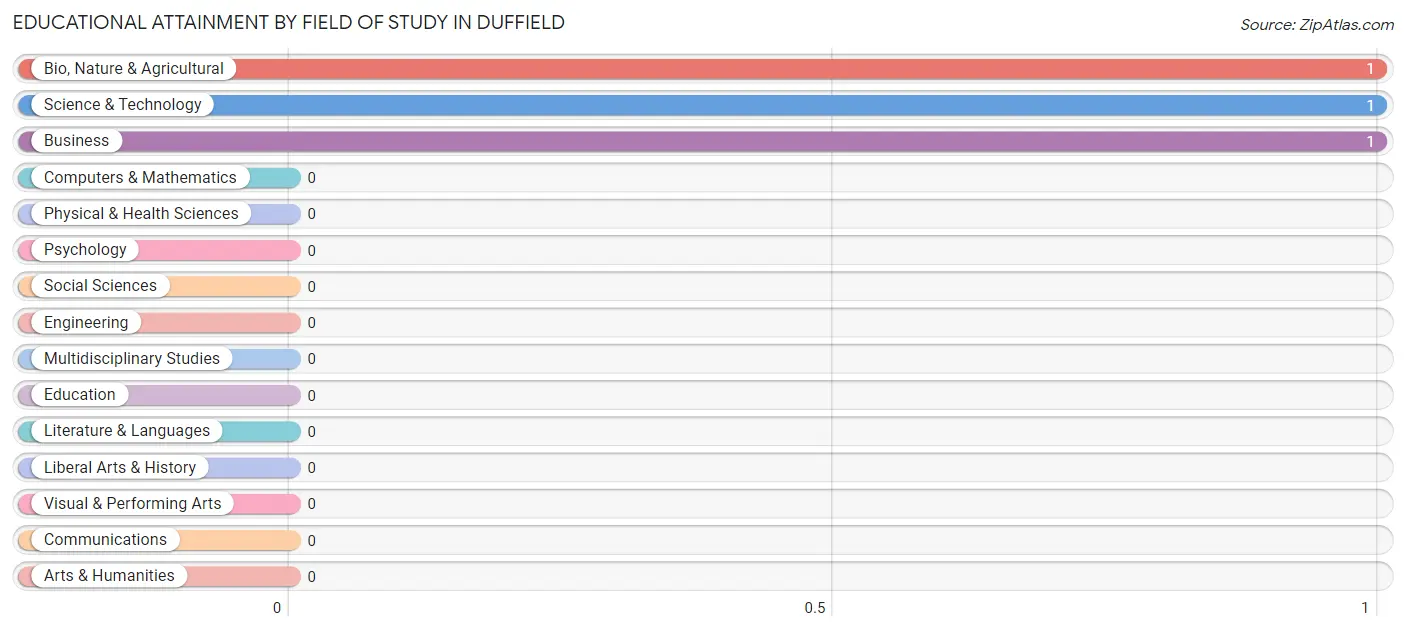
| Field of Study | # Graduates | % Graduates |
| Computers & Mathematics | 0 | 0.0% |
| Bio, Nature & Agricultural | 1 | 33.3% |
| Physical & Health Sciences | 0 | 0.0% |
| Psychology | 0 | 0.0% |
| Social Sciences | 0 | 0.0% |
| Engineering | 0 | 0.0% |
| Multidisciplinary Studies | 0 | 0.0% |
| Science & Technology | 1 | 33.3% |
| Business | 1 | 33.3% |
| Education | 0 | 0.0% |
| Literature & Languages | 0 | 0.0% |
| Liberal Arts & History | 0 | 0.0% |
| Visual & Performing Arts | 0 | 0.0% |
| Communications | 0 | 0.0% |
| Arts & Humanities | 0 | 0.0% |
| Total | 3 | 100.0% |
Transportation & Commute in Duffield
Vehicle Availability by Sex in Duffield
The most prevalent vehicle ownership categories in Duffield are males with 3 vehicles (6, accounting for 50.0%) and females with 3 vehicles (3, making up 50.0%).
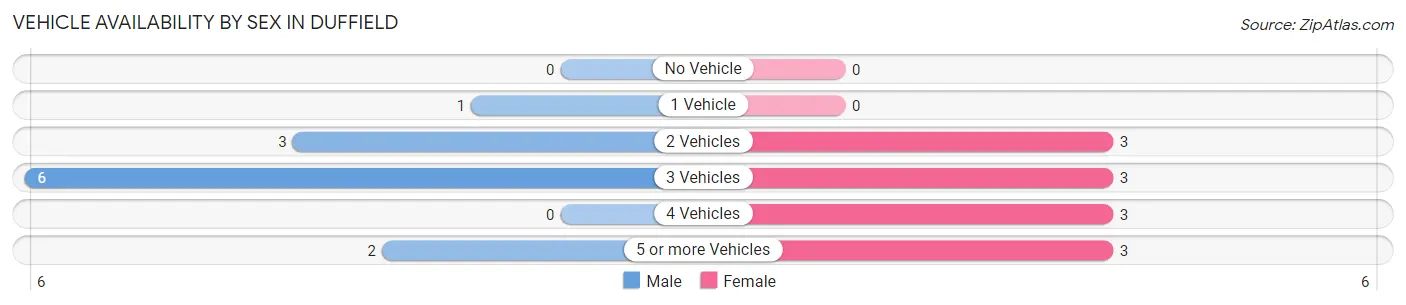
| Vehicles Available | Male | Female |
| No Vehicle | 0 (0.0%) | 0 (0.0%) |
| 1 Vehicle | 1 (8.3%) | 0 (0.0%) |
| 2 Vehicles | 3 (25.0%) | 3 (25.0%) |
| 3 Vehicles | 6 (50.0%) | 3 (25.0%) |
| 4 Vehicles | 0 (0.0%) | 3 (25.0%) |
| 5 or more Vehicles | 2 (16.7%) | 3 (25.0%) |
| Total | 12 (100.0%) | 12 (100.0%) |
Commute Time in Duffield
The most frequently occuring commute durations in Duffield are 45 to 59 minutes (8 commuters, 36.4%), less than 5 minutes (3 commuters, 13.6%), and 20 to 24 minutes (3 commuters, 13.6%).
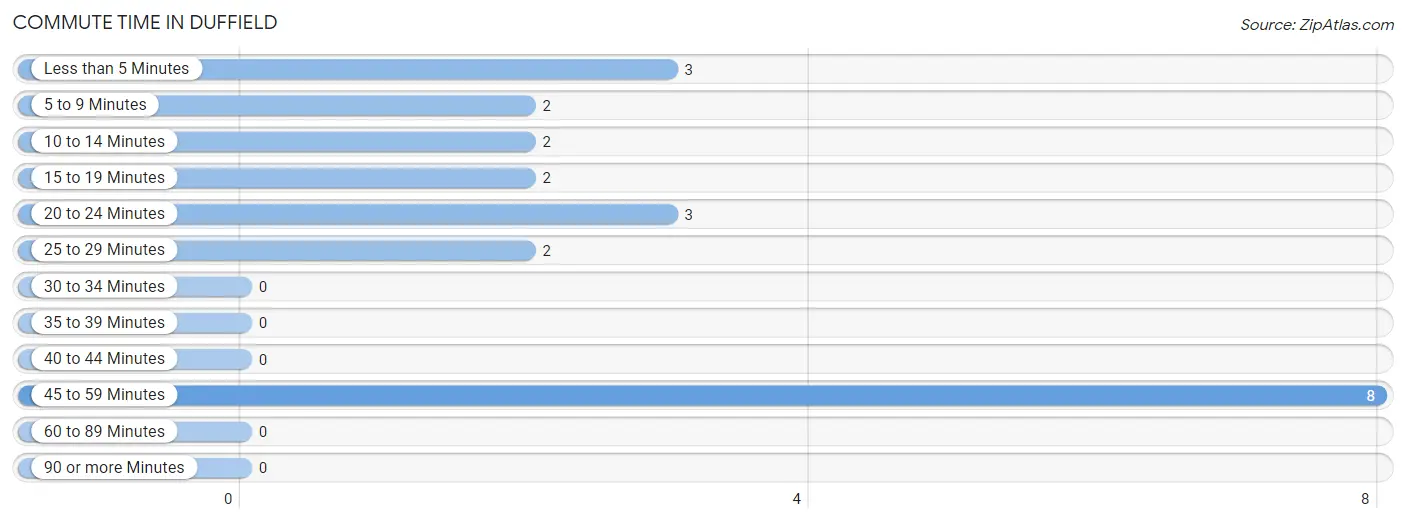
| Commute Time | # Commuters | % Commuters |
| Less than 5 Minutes | 3 | 13.6% |
| 5 to 9 Minutes | 2 | 9.1% |
| 10 to 14 Minutes | 2 | 9.1% |
| 15 to 19 Minutes | 2 | 9.1% |
| 20 to 24 Minutes | 3 | 13.6% |
| 25 to 29 Minutes | 2 | 9.1% |
| 30 to 34 Minutes | 0 | 0.0% |
| 35 to 39 Minutes | 0 | 0.0% |
| 40 to 44 Minutes | 0 | 0.0% |
| 45 to 59 Minutes | 8 | 36.4% |
| 60 to 89 Minutes | 0 | 0.0% |
| 90 or more Minutes | 0 | 0.0% |
Commute Time by Sex in Duffield
The most common commute times in Duffield are 45 to 59 minutes (6 commuters, 50.0%) for males and less than 5 minutes (2 commuters, 20.0%) for females.
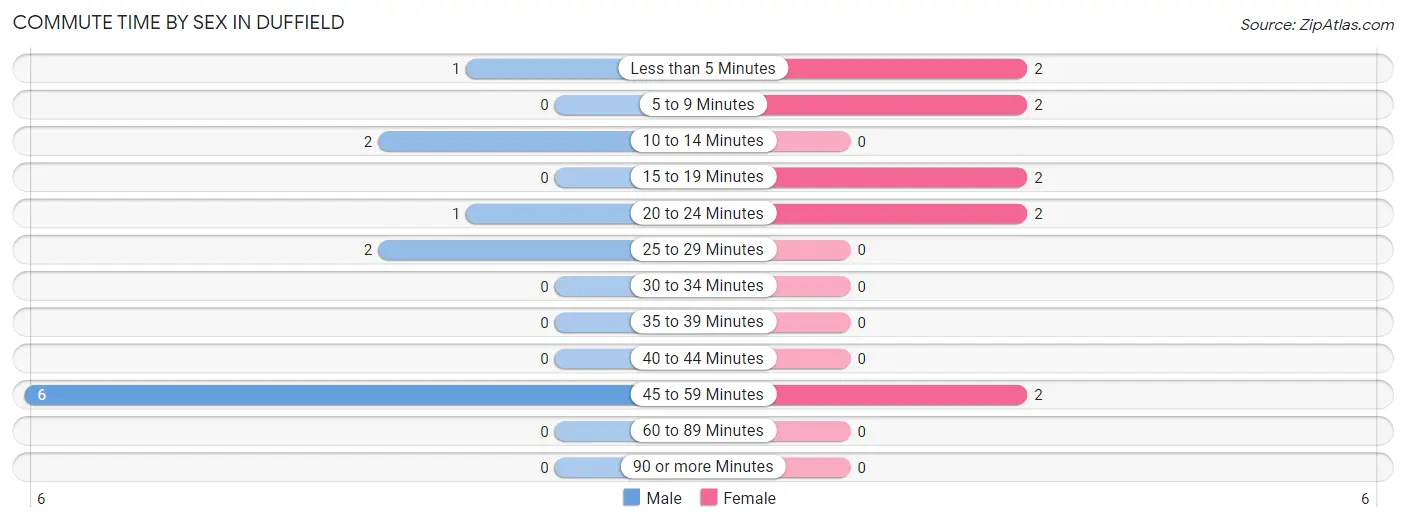
| Commute Time | Male | Female |
| Less than 5 Minutes | 1 (8.3%) | 2 (20.0%) |
| 5 to 9 Minutes | 0 (0.0%) | 2 (20.0%) |
| 10 to 14 Minutes | 2 (16.7%) | 0 (0.0%) |
| 15 to 19 Minutes | 0 (0.0%) | 2 (20.0%) |
| 20 to 24 Minutes | 1 (8.3%) | 2 (20.0%) |
| 25 to 29 Minutes | 2 (16.7%) | 0 (0.0%) |
| 30 to 34 Minutes | 0 (0.0%) | 0 (0.0%) |
| 35 to 39 Minutes | 0 (0.0%) | 0 (0.0%) |
| 40 to 44 Minutes | 0 (0.0%) | 0 (0.0%) |
| 45 to 59 Minutes | 6 (50.0%) | 2 (20.0%) |
| 60 to 89 Minutes | 0 (0.0%) | 0 (0.0%) |
| 90 or more Minutes | 0 (0.0%) | 0 (0.0%) |
Time of Departure to Work by Sex in Duffield
The most frequent times of departure to work in Duffield are 6:30 AM to 6:59 AM (4, 33.3%) for males and 7:30 AM to 7:59 AM (3, 30.0%) for females.
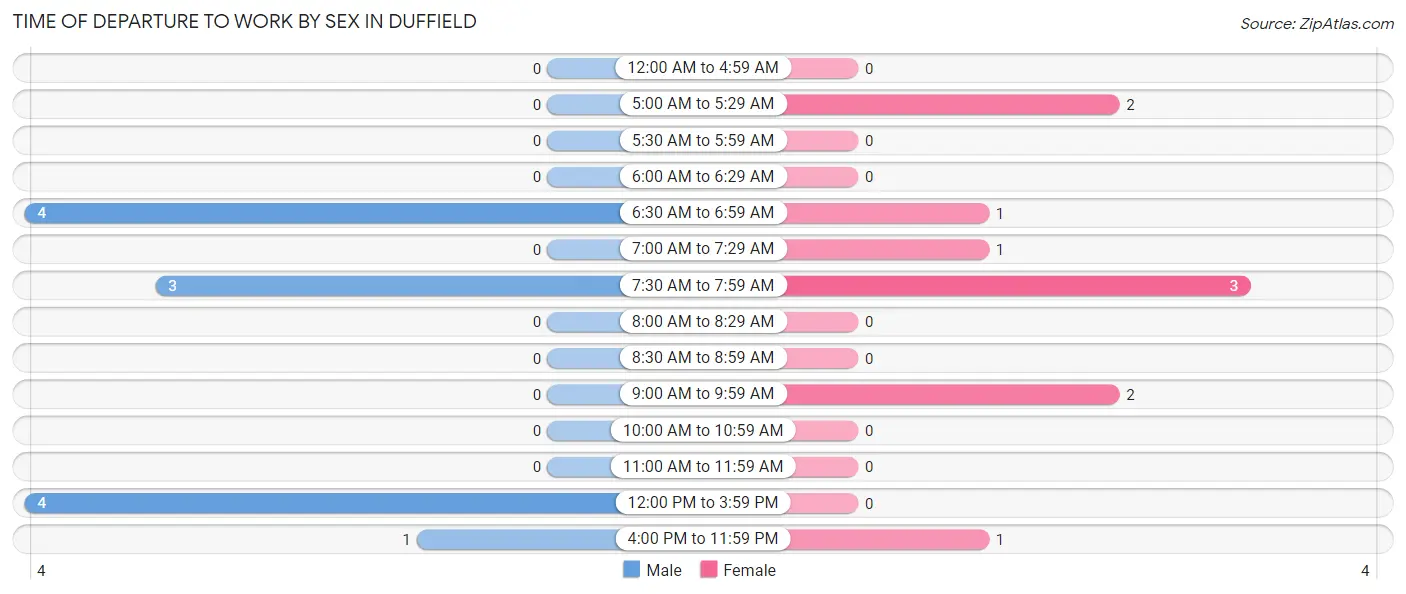
| Time of Departure | Male | Female |
| 12:00 AM to 4:59 AM | 0 (0.0%) | 0 (0.0%) |
| 5:00 AM to 5:29 AM | 0 (0.0%) | 2 (20.0%) |
| 5:30 AM to 5:59 AM | 0 (0.0%) | 0 (0.0%) |
| 6:00 AM to 6:29 AM | 0 (0.0%) | 0 (0.0%) |
| 6:30 AM to 6:59 AM | 4 (33.3%) | 1 (10.0%) |
| 7:00 AM to 7:29 AM | 0 (0.0%) | 1 (10.0%) |
| 7:30 AM to 7:59 AM | 3 (25.0%) | 3 (30.0%) |
| 8:00 AM to 8:29 AM | 0 (0.0%) | 0 (0.0%) |
| 8:30 AM to 8:59 AM | 0 (0.0%) | 0 (0.0%) |
| 9:00 AM to 9:59 AM | 0 (0.0%) | 2 (20.0%) |
| 10:00 AM to 10:59 AM | 0 (0.0%) | 0 (0.0%) |
| 11:00 AM to 11:59 AM | 0 (0.0%) | 0 (0.0%) |
| 12:00 PM to 3:59 PM | 4 (33.3%) | 0 (0.0%) |
| 4:00 PM to 11:59 PM | 1 (8.3%) | 1 (10.0%) |
| Total | 12 (100.0%) | 10 (100.0%) |
Housing Occupancy in Duffield
Occupancy by Ownership in Duffield
Of the total 31 dwellings in Duffield, owner-occupied units account for 24 (77.4%), while renter-occupied units make up 7 (22.6%).
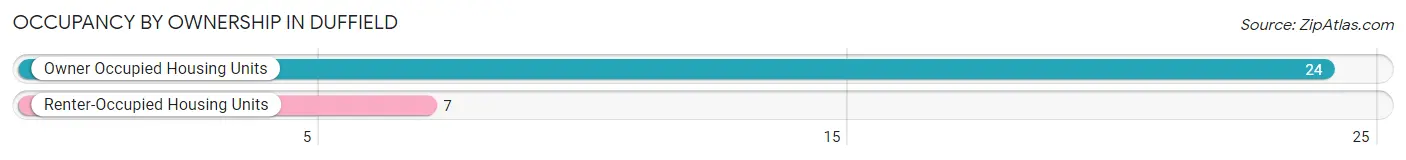
| Occupancy | # Housing Units | % Housing Units |
| Owner Occupied Housing Units | 24 | 77.4% |
| Renter-Occupied Housing Units | 7 | 22.6% |
| Total Occupied Housing Units | 31 | 100.0% |
Occupancy by Household Size in Duffield
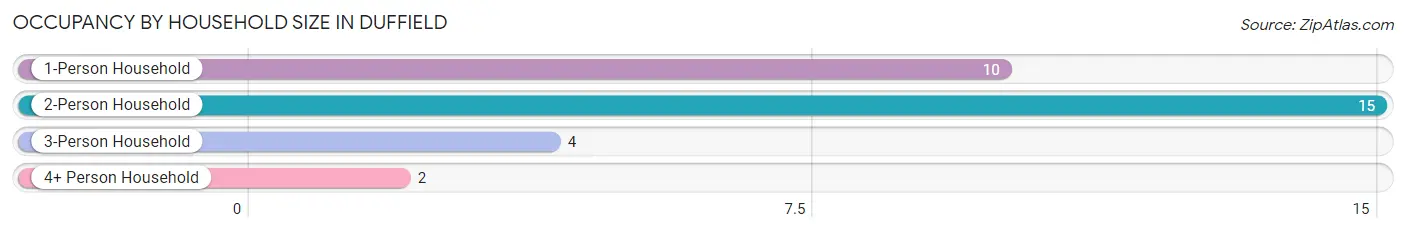
| Household Size | # Housing Units | % Housing Units |
| 1-Person Household | 10 | 32.3% |
| 2-Person Household | 15 | 48.4% |
| 3-Person Household | 4 | 12.9% |
| 4+ Person Household | 2 | 6.5% |
| Total Housing Units | 31 | 100.0% |
Occupancy by Ownership by Household Size in Duffield
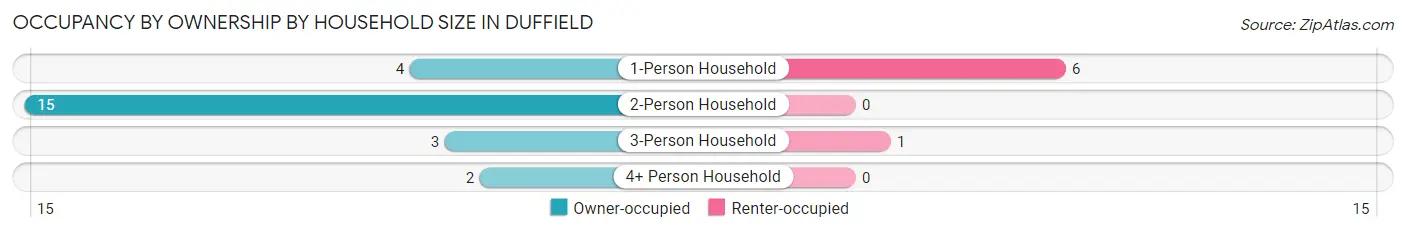
| Household Size | Owner-occupied | Renter-occupied |
| 1-Person Household | 4 (40.0%) | 6 (60.0%) |
| 2-Person Household | 15 (100.0%) | 0 (0.0%) |
| 3-Person Household | 3 (75.0%) | 1 (25.0%) |
| 4+ Person Household | 2 (100.0%) | 0 (0.0%) |
| Total Housing Units | 24 (77.4%) | 7 (22.6%) |
Occupancy by Educational Attainment in Duffield
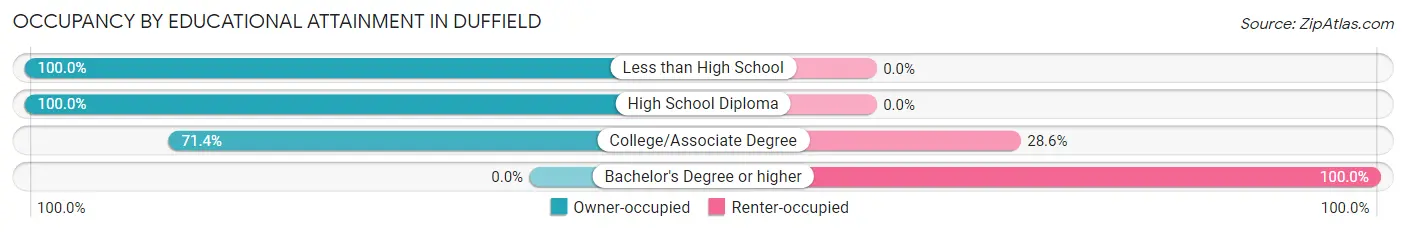
| Household Size | Owner-occupied | Renter-occupied |
| Less than High School | 4 (100.0%) | 0 (0.0%) |
| High School Diploma | 5 (100.0%) | 0 (0.0%) |
| College/Associate Degree | 15 (71.4%) | 6 (28.6%) |
| Bachelor's Degree or higher | 0 (0.0%) | 1 (100.0%) |
Occupancy by Age of Householder in Duffield
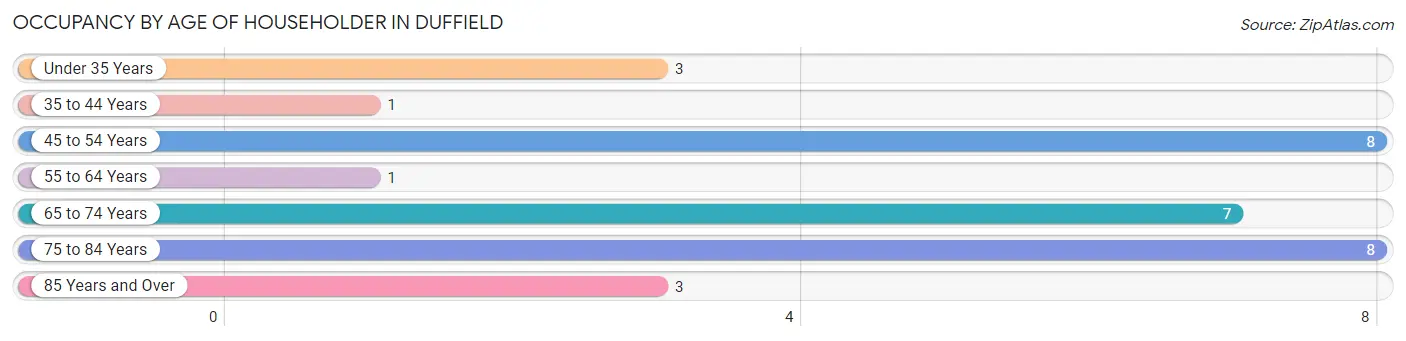
| Age Bracket | # Households | % Households |
| Under 35 Years | 3 | 9.7% |
| 35 to 44 Years | 1 | 3.2% |
| 45 to 54 Years | 8 | 25.8% |
| 55 to 64 Years | 1 | 3.2% |
| 65 to 74 Years | 7 | 22.6% |
| 75 to 84 Years | 8 | 25.8% |
| 85 Years and Over | 3 | 9.7% |
| Total | 31 | 100.0% |
Housing Finances in Duffield
Median Income by Occupancy in Duffield
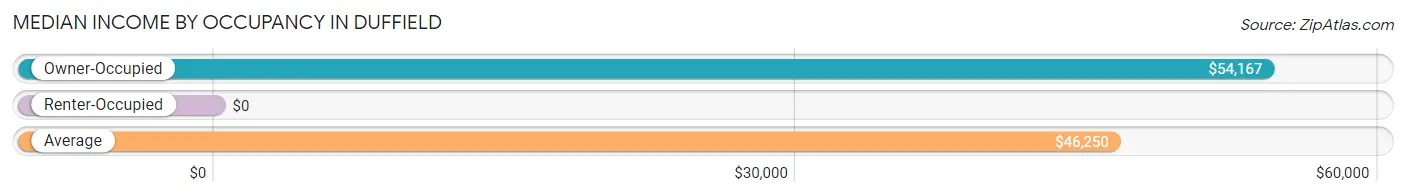
| Occupancy Type | # Households | Median Income |
| Owner-Occupied | 24 (77.4%) | $54,167 |
| Renter-Occupied | 7 (22.6%) | $0 |
| Average | 31 (100.0%) | $46,250 |
Occupancy by Householder Income Bracket in Duffield
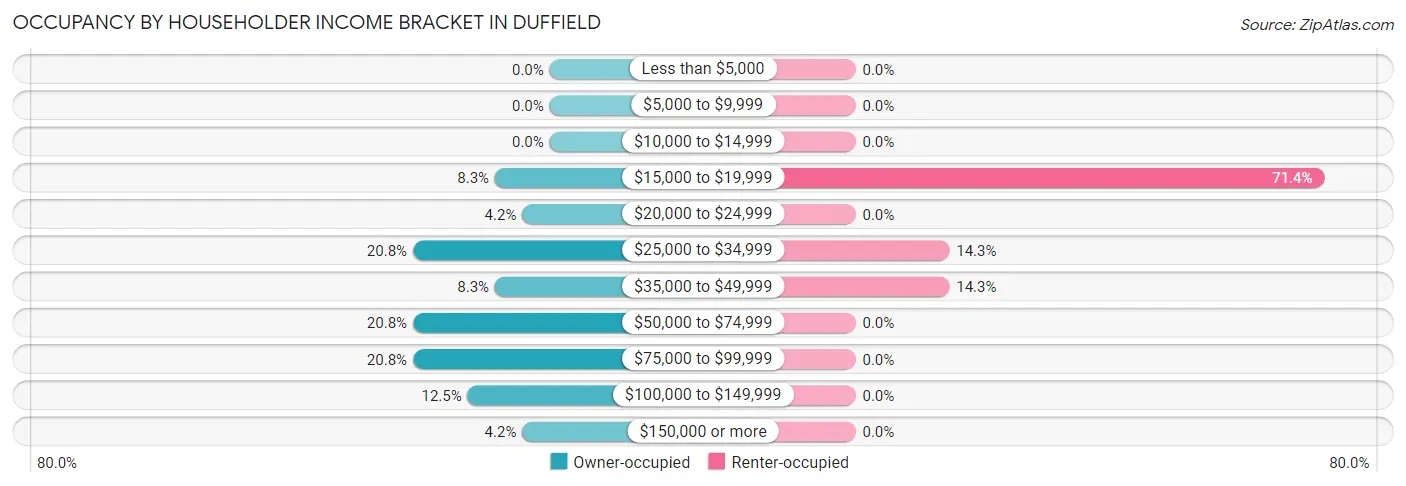
| Income Bracket | Owner-occupied | Renter-occupied |
| Less than $5,000 | 0 (0.0%) | 0 (0.0%) |
| $5,000 to $9,999 | 0 (0.0%) | 0 (0.0%) |
| $10,000 to $14,999 | 0 (0.0%) | 0 (0.0%) |
| $15,000 to $19,999 | 2 (8.3%) | 5 (71.4%) |
| $20,000 to $24,999 | 1 (4.2%) | 0 (0.0%) |
| $25,000 to $34,999 | 5 (20.8%) | 1 (14.3%) |
| $35,000 to $49,999 | 2 (8.3%) | 1 (14.3%) |
| $50,000 to $74,999 | 5 (20.8%) | 0 (0.0%) |
| $75,000 to $99,999 | 5 (20.8%) | 0 (0.0%) |
| $100,000 to $149,999 | 3 (12.5%) | 0 (0.0%) |
| $150,000 or more | 1 (4.2%) | 0 (0.0%) |
| Total | 24 (100.0%) | 7 (100.0%) |
Monthly Housing Cost Tiers in Duffield
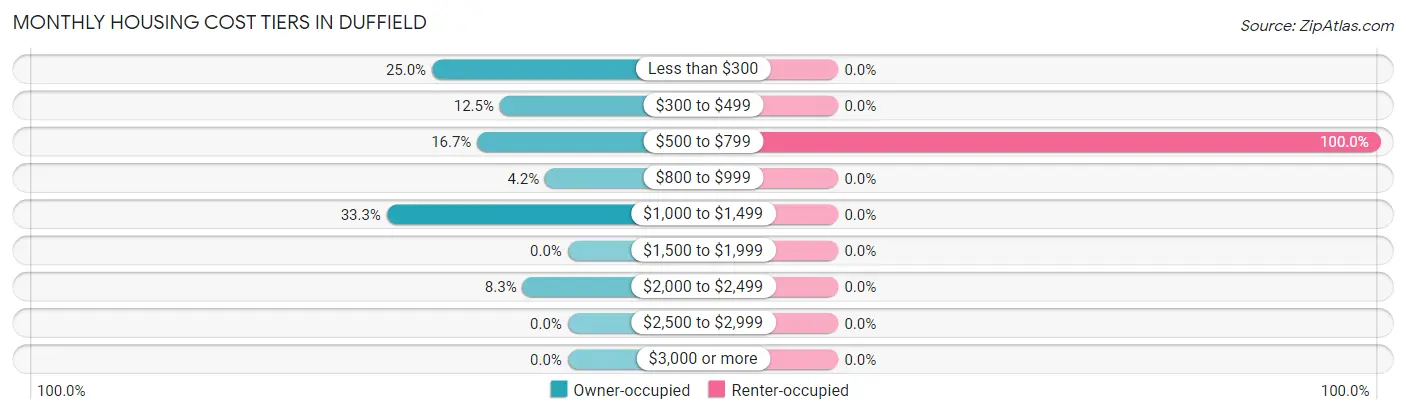
| Monthly Cost | Owner-occupied | Renter-occupied |
| Less than $300 | 6 (25.0%) | 0 (0.0%) |
| $300 to $499 | 3 (12.5%) | 0 (0.0%) |
| $500 to $799 | 4 (16.7%) | 7 (100.0%) |
| $800 to $999 | 1 (4.2%) | 0 (0.0%) |
| $1,000 to $1,499 | 8 (33.3%) | 0 (0.0%) |
| $1,500 to $1,999 | 0 (0.0%) | 0 (0.0%) |
| $2,000 to $2,499 | 2 (8.3%) | 0 (0.0%) |
| $2,500 to $2,999 | 0 (0.0%) | 0 (0.0%) |
| $3,000 or more | 0 (0.0%) | 0 (0.0%) |
| Total | 24 (100.0%) | 7 (100.0%) |
Physical Housing Characteristics in Duffield
Housing Structures in Duffield
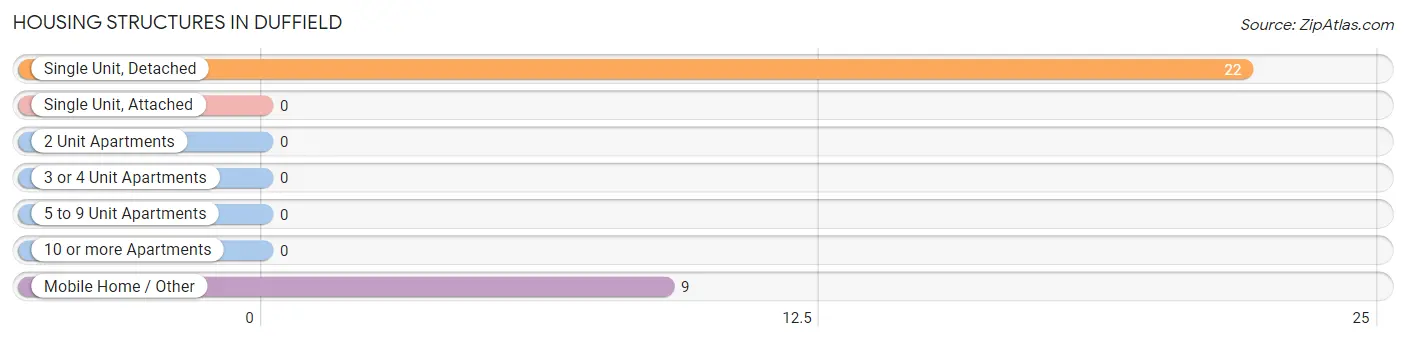
| Structure Type | # Housing Units | % Housing Units |
| Single Unit, Detached | 22 | 71.0% |
| Single Unit, Attached | 0 | 0.0% |
| 2 Unit Apartments | 0 | 0.0% |
| 3 or 4 Unit Apartments | 0 | 0.0% |
| 5 to 9 Unit Apartments | 0 | 0.0% |
| 10 or more Apartments | 0 | 0.0% |
| Mobile Home / Other | 9 | 29.0% |
| Total | 31 | 100.0% |
Housing Structures by Occupancy in Duffield
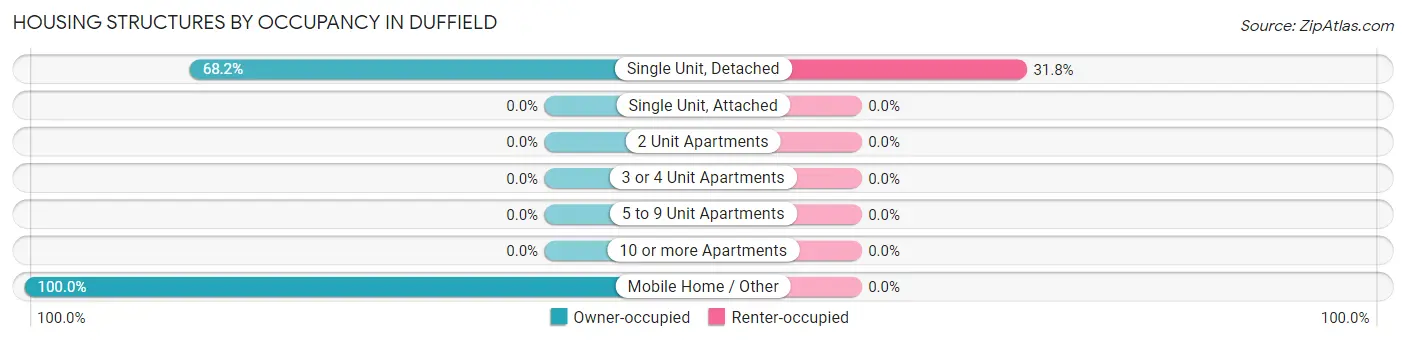
| Structure Type | Owner-occupied | Renter-occupied |
| Single Unit, Detached | 15 (68.2%) | 7 (31.8%) |
| Single Unit, Attached | 0 (0.0%) | 0 (0.0%) |
| 2 Unit Apartments | 0 (0.0%) | 0 (0.0%) |
| 3 or 4 Unit Apartments | 0 (0.0%) | 0 (0.0%) |
| 5 to 9 Unit Apartments | 0 (0.0%) | 0 (0.0%) |
| 10 or more Apartments | 0 (0.0%) | 0 (0.0%) |
| Mobile Home / Other | 9 (100.0%) | 0 (0.0%) |
| Total | 24 (77.4%) | 7 (22.6%) |
Housing Structures by Number of Rooms in Duffield
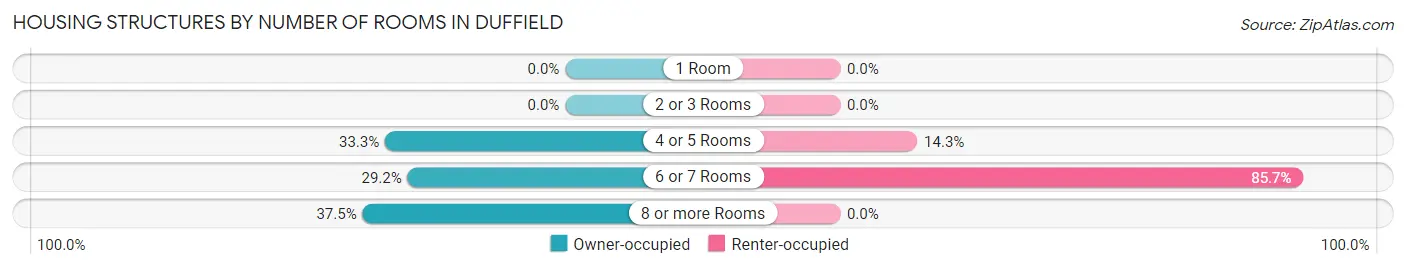
| Number of Rooms | Owner-occupied | Renter-occupied |
| 1 Room | 0 (0.0%) | 0 (0.0%) |
| 2 or 3 Rooms | 0 (0.0%) | 0 (0.0%) |
| 4 or 5 Rooms | 8 (33.3%) | 1 (14.3%) |
| 6 or 7 Rooms | 7 (29.2%) | 6 (85.7%) |
| 8 or more Rooms | 9 (37.5%) | 0 (0.0%) |
| Total | 24 (100.0%) | 7 (100.0%) |
Housing Structure by Heating Type in Duffield
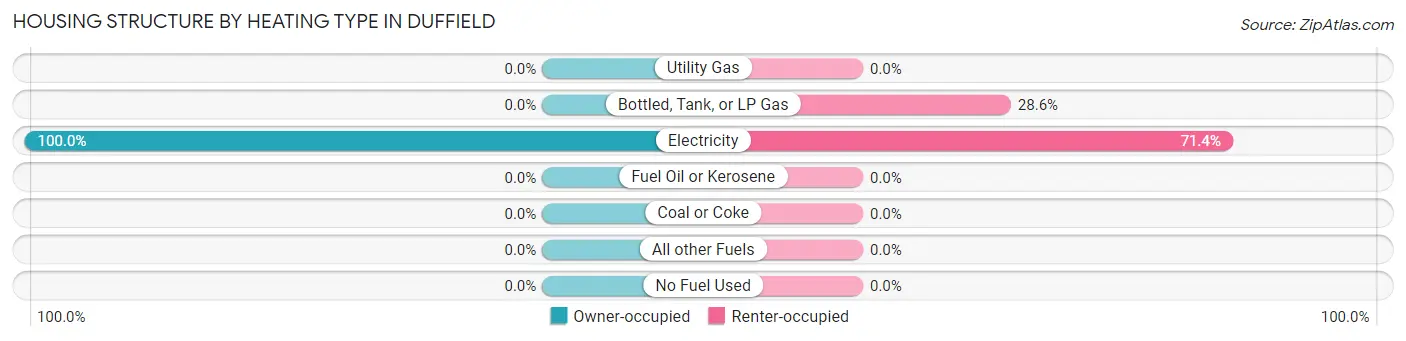
| Heating Type | Owner-occupied | Renter-occupied |
| Utility Gas | 0 (0.0%) | 0 (0.0%) |
| Bottled, Tank, or LP Gas | 0 (0.0%) | 2 (28.6%) |
| Electricity | 24 (100.0%) | 5 (71.4%) |
| Fuel Oil or Kerosene | 0 (0.0%) | 0 (0.0%) |
| Coal or Coke | 0 (0.0%) | 0 (0.0%) |
| All other Fuels | 0 (0.0%) | 0 (0.0%) |
| No Fuel Used | 0 (0.0%) | 0 (0.0%) |
| Total | 24 (100.0%) | 7 (100.0%) |
Household Vehicle Usage in Duffield
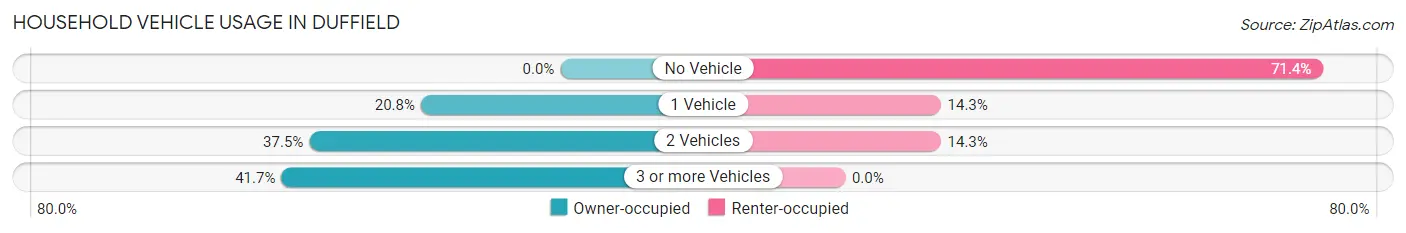
| Vehicles per Household | Owner-occupied | Renter-occupied |
| No Vehicle | 0 (0.0%) | 5 (71.4%) |
| 1 Vehicle | 5 (20.8%) | 1 (14.3%) |
| 2 Vehicles | 9 (37.5%) | 1 (14.3%) |
| 3 or more Vehicles | 10 (41.7%) | 0 (0.0%) |
| Total | 24 (100.0%) | 7 (100.0%) |
Real Estate & Mortgages in Duffield
Real Estate and Mortgage Overview in Duffield
| Characteristic | Without Mortgage | With Mortgage |
| Housing Units | 12 | 12 |
| Median Property Value | $90,000 | $168,800 |
| Median Household Income | $50,000 | $1 |
| Monthly Housing Costs | $300 | $0 |
| Real Estate Taxes | $700 | $1 |
Property Value by Mortgage Status in Duffield
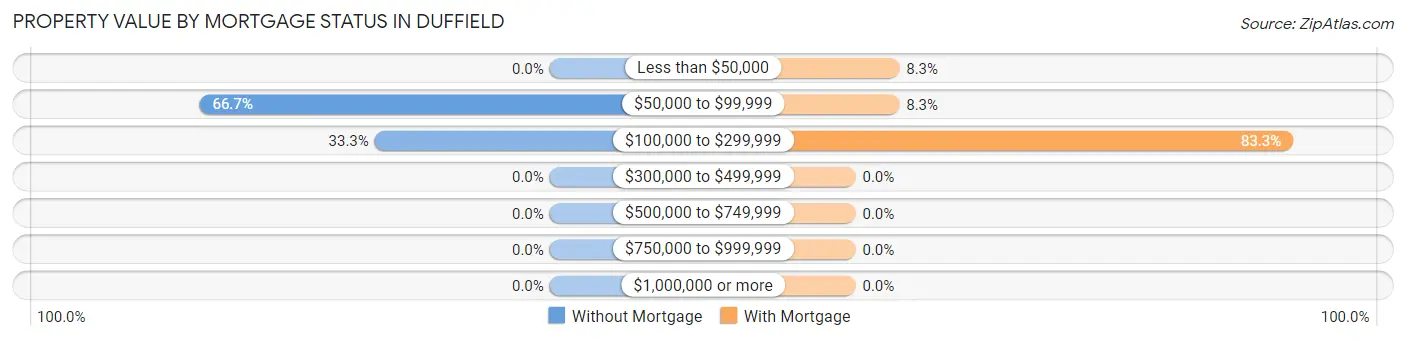
| Property Value | Without Mortgage | With Mortgage |
| Less than $50,000 | 0 (0.0%) | 1 (8.3%) |
| $50,000 to $99,999 | 8 (66.7%) | 1 (8.3%) |
| $100,000 to $299,999 | 4 (33.3%) | 10 (83.3%) |
| $300,000 to $499,999 | 0 (0.0%) | 0 (0.0%) |
| $500,000 to $749,999 | 0 (0.0%) | 0 (0.0%) |
| $750,000 to $999,999 | 0 (0.0%) | 0 (0.0%) |
| $1,000,000 or more | 0 (0.0%) | 0 (0.0%) |
| Total | 12 (100.0%) | 12 (100.0%) |
Household Income by Mortgage Status in Duffield
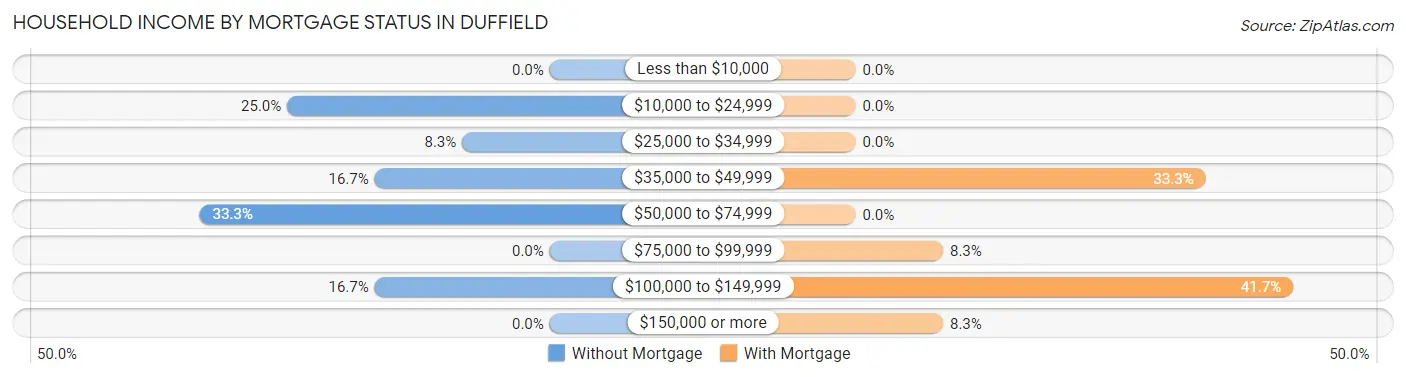
| Household Income | Without Mortgage | With Mortgage |
| Less than $10,000 | 0 (0.0%) | 0 (0.0%) |
| $10,000 to $24,999 | 3 (25.0%) | 0 (0.0%) |
| $25,000 to $34,999 | 1 (8.3%) | 0 (0.0%) |
| $35,000 to $49,999 | 2 (16.7%) | 4 (33.3%) |
| $50,000 to $74,999 | 4 (33.3%) | 0 (0.0%) |
| $75,000 to $99,999 | 0 (0.0%) | 1 (8.3%) |
| $100,000 to $149,999 | 2 (16.7%) | 5 (41.7%) |
| $150,000 or more | 0 (0.0%) | 1 (8.3%) |
| Total | 12 (100.0%) | 12 (100.0%) |
Property Value to Household Income Ratio in Duffield
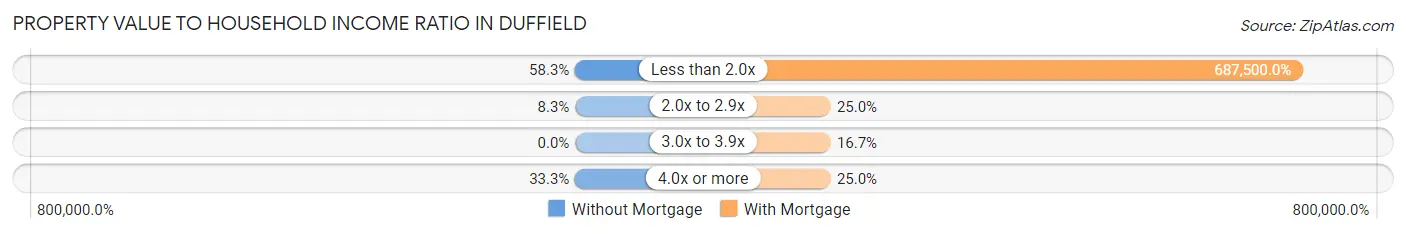
| Value-to-Income Ratio | Without Mortgage | With Mortgage |
| Less than 2.0x | 7 (58.3%) | 82,500 (687,500.0%) |
| 2.0x to 2.9x | 1 (8.3%) | 3 (25.0%) |
| 3.0x to 3.9x | 0 (0.0%) | 2 (16.7%) |
| 4.0x or more | 4 (33.3%) | 3 (25.0%) |
| Total | 12 (100.0%) | 12 (100.0%) |
Real Estate Taxes by Mortgage Status in Duffield
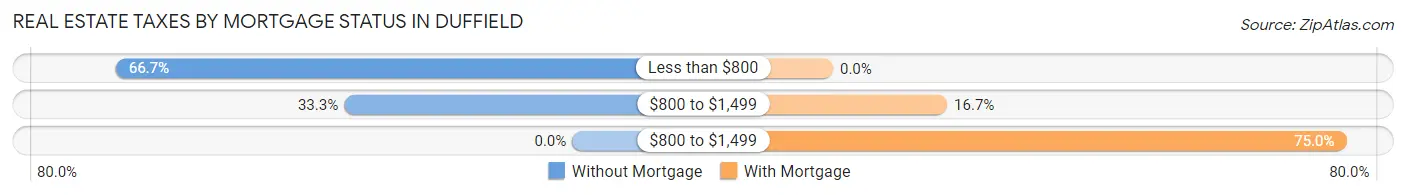
| Property Taxes | Without Mortgage | With Mortgage |
| Less than $800 | 8 (66.7%) | 0 (0.0%) |
| $800 to $1,499 | 4 (33.3%) | 2 (16.7%) |
| $800 to $1,499 | 0 (0.0%) | 9 (75.0%) |
| Total | 12 (100.0%) | 12 (100.0%) |
Health & Disability in Duffield
Health Insurance Coverage by Age in Duffield
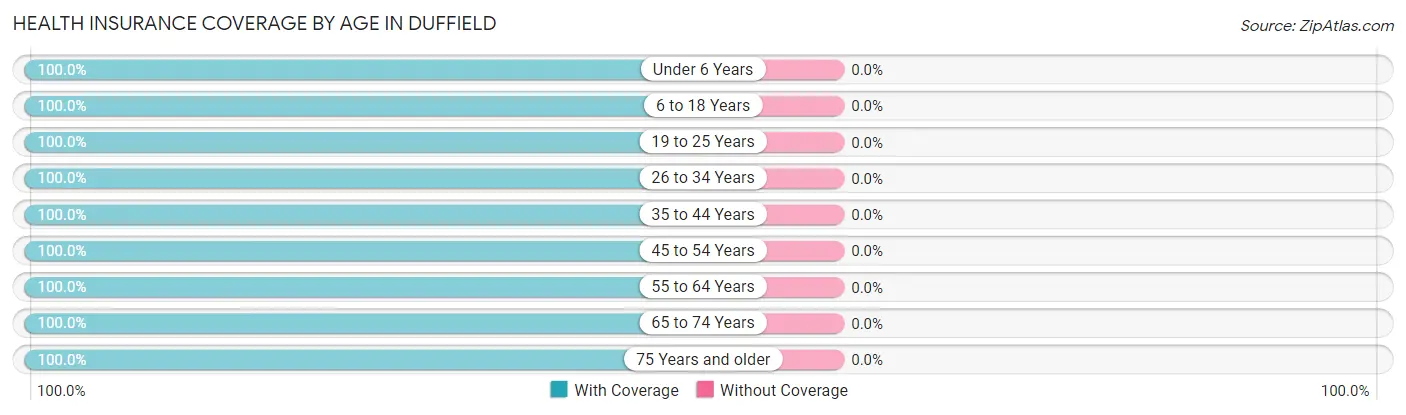
| Age Bracket | With Coverage | Without Coverage |
| Under 6 Years | 1 (100.0%) | 0 (0.0%) |
| 6 to 18 Years | 3 (100.0%) | 0 (0.0%) |
| 19 to 25 Years | 4 (100.0%) | 0 (0.0%) |
| 26 to 34 Years | 5 (100.0%) | 0 (0.0%) |
| 35 to 44 Years | 5 (100.0%) | 0 (0.0%) |
| 45 to 54 Years | 18 (100.0%) | 0 (0.0%) |
| 55 to 64 Years | 4 (100.0%) | 0 (0.0%) |
| 65 to 74 Years | 10 (100.0%) | 0 (0.0%) |
| 75 Years and older | 15 (100.0%) | 0 (0.0%) |
| Total | 65 (100.0%) | 0 (0.0%) |
Health Insurance Coverage by Citizenship Status in Duffield
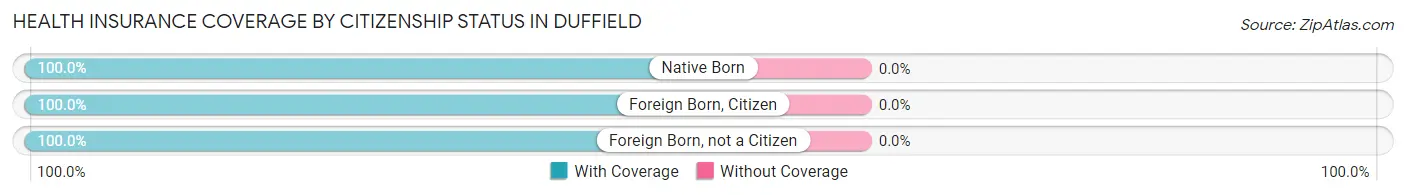
| Citizenship Status | With Coverage | Without Coverage |
| Native Born | 1 (100.0%) | 0 (0.0%) |
| Foreign Born, Citizen | 3 (100.0%) | 0 (0.0%) |
| Foreign Born, not a Citizen | 4 (100.0%) | 0 (0.0%) |
Health Insurance Coverage by Household Income in Duffield
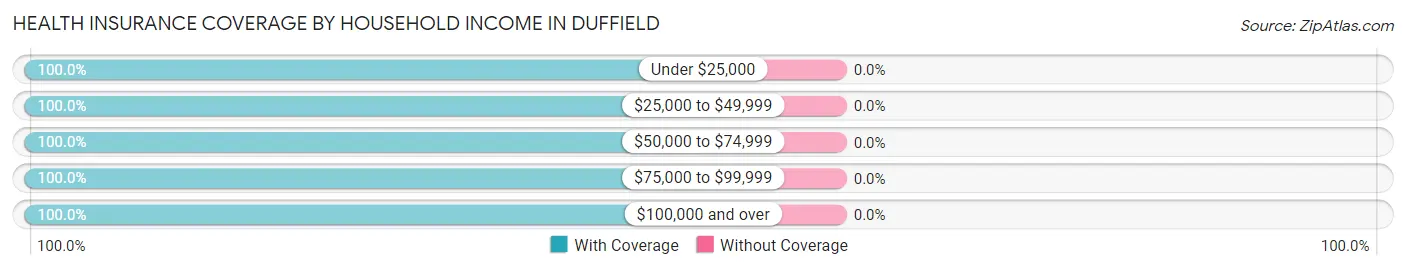
| Household Income | With Coverage | Without Coverage |
| Under $25,000 | 13 (100.0%) | 0 (0.0%) |
| $25,000 to $49,999 | 15 (100.0%) | 0 (0.0%) |
| $50,000 to $74,999 | 11 (100.0%) | 0 (0.0%) |
| $75,000 to $99,999 | 8 (100.0%) | 0 (0.0%) |
| $100,000 and over | 18 (100.0%) | 0 (0.0%) |
Public vs Private Health Insurance Coverage by Age in Duffield
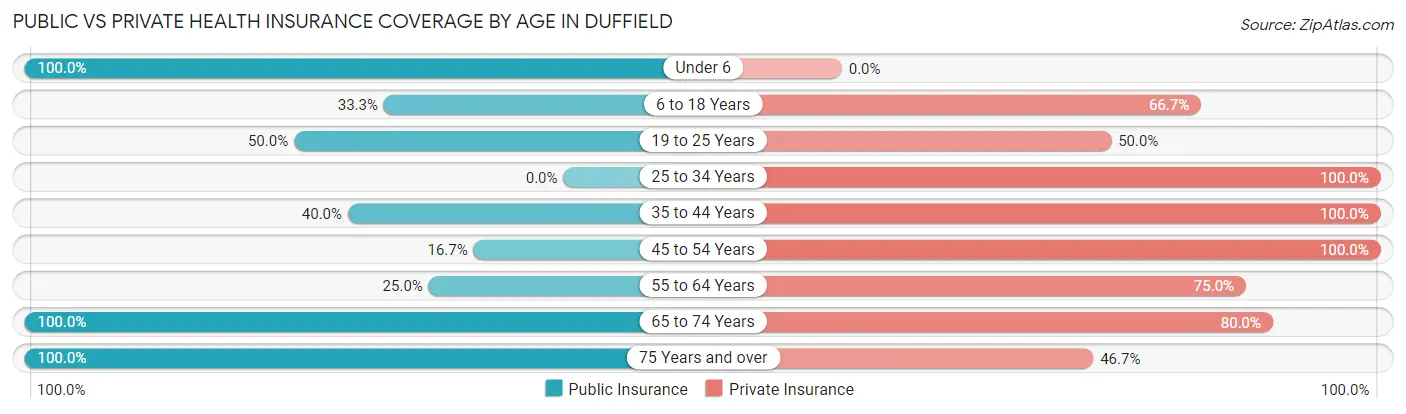
| Age Bracket | Public Insurance | Private Insurance |
| Under 6 | 1 (100.0%) | 0 (0.0%) |
| 6 to 18 Years | 1 (33.3%) | 2 (66.7%) |
| 19 to 25 Years | 2 (50.0%) | 2 (50.0%) |
| 25 to 34 Years | 0 (0.0%) | 5 (100.0%) |
| 35 to 44 Years | 2 (40.0%) | 5 (100.0%) |
| 45 to 54 Years | 3 (16.7%) | 18 (100.0%) |
| 55 to 64 Years | 1 (25.0%) | 3 (75.0%) |
| 65 to 74 Years | 10 (100.0%) | 8 (80.0%) |
| 75 Years and over | 15 (100.0%) | 7 (46.7%) |
| Total | 35 (53.8%) | 50 (76.9%) |
Disability Status by Sex by Age in Duffield
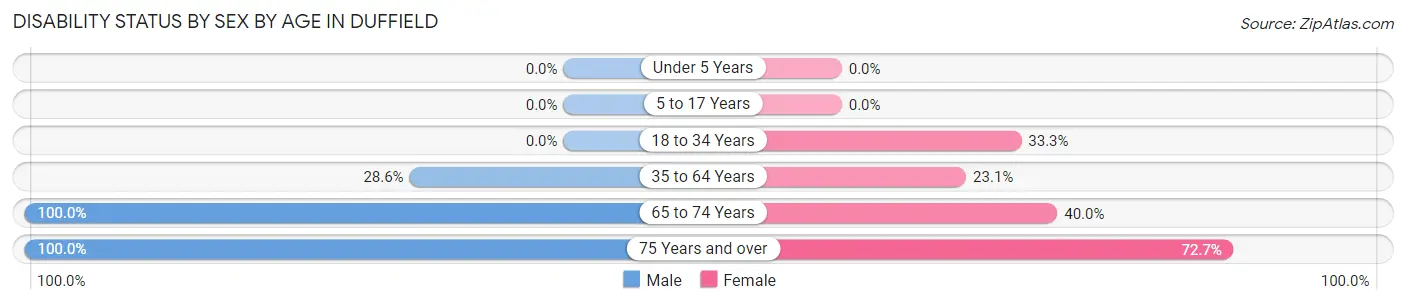
| Age Bracket | Male | Female |
| Under 5 Years | 0 (0.0%) | 0 (0.0%) |
| 5 to 17 Years | 0 (0.0%) | 0 (0.0%) |
| 18 to 34 Years | 0 (0.0%) | 2 (33.3%) |
| 35 to 64 Years | 4 (28.6%) | 3 (23.1%) |
| 65 to 74 Years | 5 (100.0%) | 2 (40.0%) |
| 75 Years and over | 4 (100.0%) | 8 (72.7%) |
Disability Class by Sex by Age in Duffield
Disability Class: Hearing Difficulty
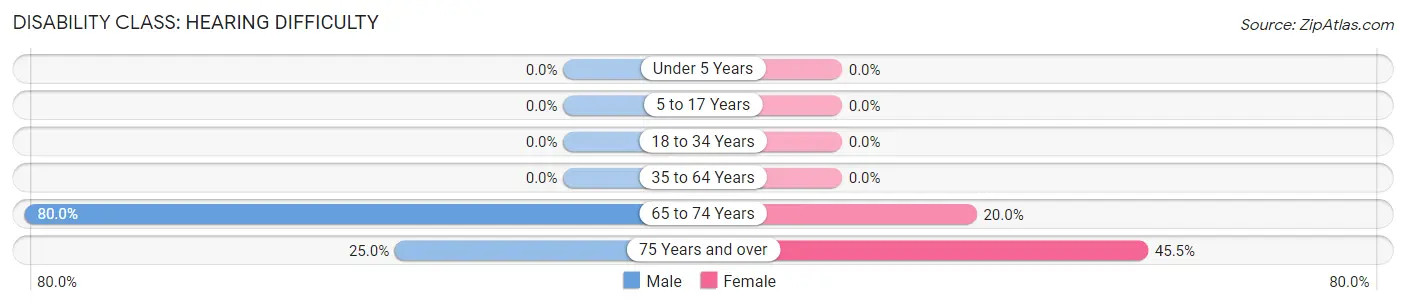
| Age Bracket | Male | Female |
| Under 5 Years | 0 (0.0%) | 0 (0.0%) |
| 5 to 17 Years | 0 (0.0%) | 0 (0.0%) |
| 18 to 34 Years | 0 (0.0%) | 0 (0.0%) |
| 35 to 64 Years | 0 (0.0%) | 0 (0.0%) |
| 65 to 74 Years | 4 (80.0%) | 1 (20.0%) |
| 75 Years and over | 1 (25.0%) | 5 (45.5%) |
Disability Class: Vision Difficulty
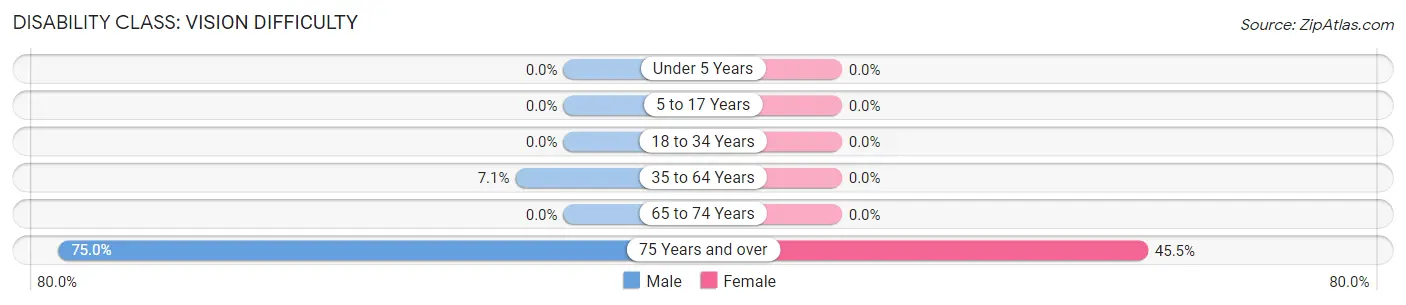
| Age Bracket | Male | Female |
| Under 5 Years | 0 (0.0%) | 0 (0.0%) |
| 5 to 17 Years | 0 (0.0%) | 0 (0.0%) |
| 18 to 34 Years | 0 (0.0%) | 0 (0.0%) |
| 35 to 64 Years | 1 (7.1%) | 0 (0.0%) |
| 65 to 74 Years | 0 (0.0%) | 0 (0.0%) |
| 75 Years and over | 3 (75.0%) | 5 (45.5%) |
Disability Class: Cognitive Difficulty
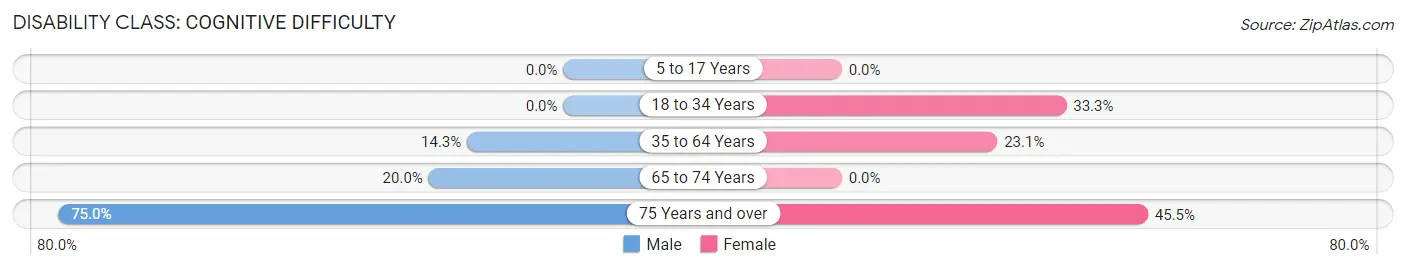
| Age Bracket | Male | Female |
| 5 to 17 Years | 0 (0.0%) | 0 (0.0%) |
| 18 to 34 Years | 0 (0.0%) | 2 (33.3%) |
| 35 to 64 Years | 2 (14.3%) | 3 (23.1%) |
| 65 to 74 Years | 1 (20.0%) | 0 (0.0%) |
| 75 Years and over | 3 (75.0%) | 5 (45.5%) |
Disability Class: Ambulatory Difficulty
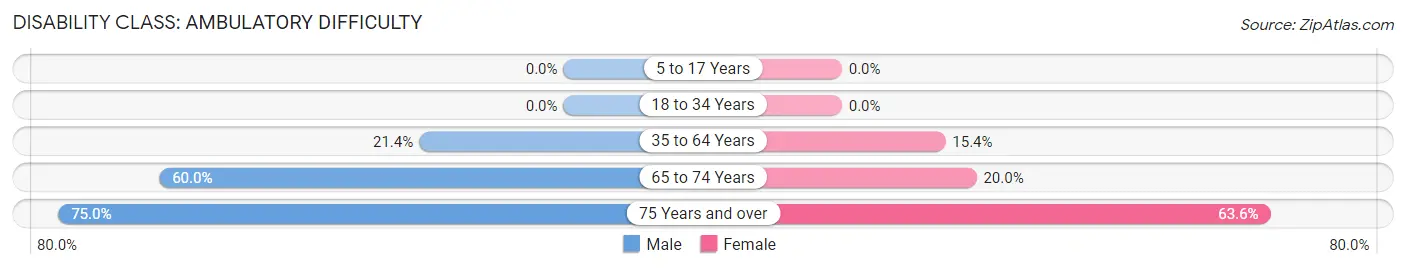
| Age Bracket | Male | Female |
| 5 to 17 Years | 0 (0.0%) | 0 (0.0%) |
| 18 to 34 Years | 0 (0.0%) | 0 (0.0%) |
| 35 to 64 Years | 3 (21.4%) | 2 (15.4%) |
| 65 to 74 Years | 3 (60.0%) | 1 (20.0%) |
| 75 Years and over | 3 (75.0%) | 7 (63.6%) |
Disability Class: Self-Care Difficulty
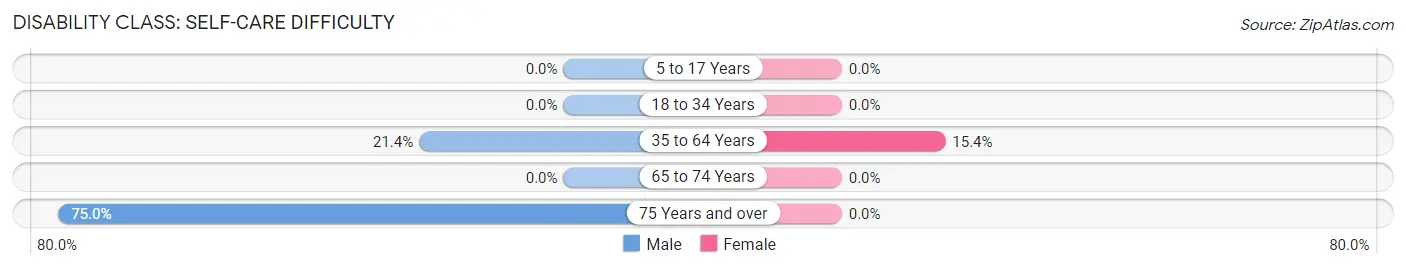
| Age Bracket | Male | Female |
| 5 to 17 Years | 0 (0.0%) | 0 (0.0%) |
| 18 to 34 Years | 0 (0.0%) | 0 (0.0%) |
| 35 to 64 Years | 3 (21.4%) | 2 (15.4%) |
| 65 to 74 Years | 0 (0.0%) | 0 (0.0%) |
| 75 Years and over | 3 (75.0%) | 0 (0.0%) |
Technology Access in Duffield
Computing Device Access in Duffield
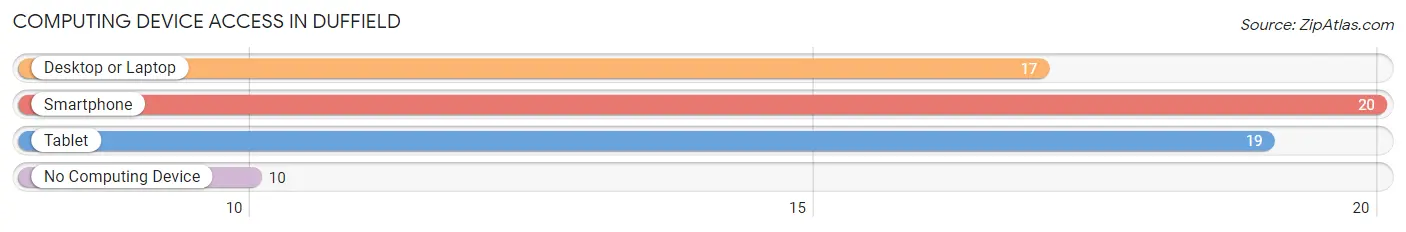
| Device Type | # Households | % Households |
| Desktop or Laptop | 17 | 54.8% |
| Smartphone | 20 | 64.5% |
| Tablet | 19 | 61.3% |
| No Computing Device | 10 | 32.3% |
| Total | 31 | 100.0% |
Internet Access in Duffield
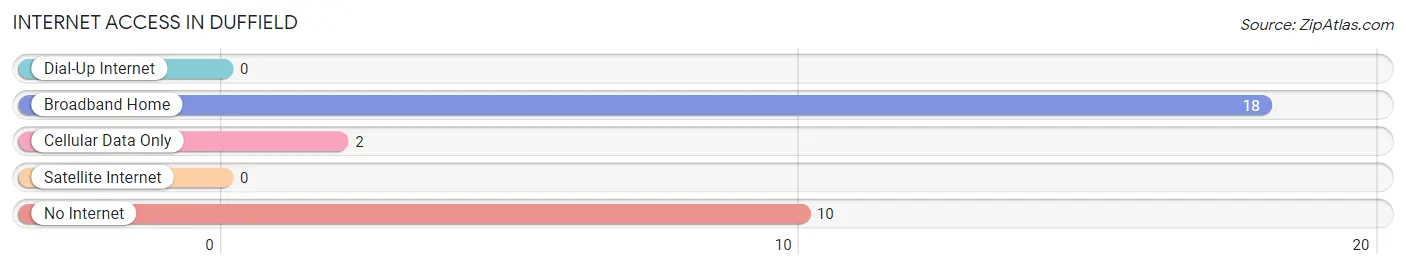
| Internet Type | # Households | % Households |
| Dial-Up Internet | 0 | 0.0% |
| Broadband Home | 18 | 58.1% |
| Cellular Data Only | 2 | 6.5% |
| Satellite Internet | 0 | 0.0% |
| No Internet | 10 | 32.3% |
| Total | 31 | 100.0% |
Duffield Summary
Duffield is a small town located in Scott County, Virginia. It is situated in the Appalachian Mountains and is part of the Appalachian Regional Commission. The town has a population of approximately 1,000 people and is located near the Tennessee border.
Geography
Duffield is located in the Appalachian Mountains of southwestern Virginia. It is situated in the Clinch River Valley, which is part of the Appalachian Plateau. The town is located at an elevation of 1,400 feet above sea level. The town is surrounded by the Clinch Mountain range to the east and the Cumberland Mountains to the west. The town is located near the Tennessee border and is approximately 30 miles from the city of Kingsport, Tennessee.
Economy
The economy of Duffield is largely based on agriculture and forestry. The town is home to several farms and timber companies. The town is also home to several small businesses, including a grocery store, a hardware store, and a restaurant. The town is also home to a small manufacturing plant that produces furniture and other wood products.
Demographics
As of the 2010 census, the population of Duffield was 1,000 people. The racial makeup of the town was 97.2% White, 0.7% African American, 0.3% Native American, 0.2% Asian, 0.1% Pacific Islander, and 1.5% from two or more races. The median household income in Duffield was $30,000, and the median family income was $35,000.
History
Duffield was founded in 1883 by a group of settlers from North Carolina. The town was named after the Duffield family, who were among the first settlers. The town was originally a farming community, but it soon became a center for timber production. The town was also home to several coal mines, which provided employment for many of the town's residents. The town was incorporated in 1891 and has remained a small, rural community ever since.
Duffield has a rich history and is home to several historic sites. The town is home to the Duffield Historic District, which is listed on the National Register of Historic Places. The district includes several historic buildings, including the Duffield Presbyterian Church, the Duffield School, and the Duffield Post Office. The town is also home to the Duffield Museum, which houses artifacts from the town's history.
Common Questions
What is Per Capita Income in Duffield?
Per Capita income in Duffield is $29,712.
What is the Median Family Income in Duffield?
Median Family Income in Duffield is $58,125.
What is the Median Household income in Duffield?
Median Household Income in Duffield is $46,250.
What is Income or Wage Gap in Duffield?
Income or Wage Gap in Duffield is 35.1%.
Women in Duffield earn 64.9 cents for every dollar earned by a man.
What is Inequality or Gini Index in Duffield?
Inequality or Gini Index in Duffield is 0.36.
What is the Total Population of Duffield?
Total Population of Duffield is 65.
What is the Total Male Population of Duffield?
Total Male Population of Duffield is 27.
What is the Total Female Population of Duffield?
Total Female Population of Duffield is 38.
What is the Ratio of Males per 100 Females in Duffield?
There are 71.05 Males per 100 Females in Duffield.
What is the Ratio of Females per 100 Males in Duffield?
There are 140.74 Females per 100 Males in Duffield.
What is the Median Population Age in Duffield?
Median Population Age in Duffield is 53.3 Years.
What is the Average Family Size in Duffield
Average Family Size in Duffield is 2.6 People.
What is the Average Household Size in Duffield
Average Household Size in Duffield is 2.1 People.
How Large is the Labor Force in Duffield?
There are 25 People in the Labor Forcein in Duffield.
What is the Percentage of People in the Labor Force in Duffield?
39.7% of People are in the Labor Force in Duffield.
What is the Unemployment Rate in Duffield?
Unemployment Rate in Duffield is 4.0%.