Deltaville, VA Map & Demographics
Deltaville Map
Deltaville Overview
$42,755
PER CAPITA INCOME
$87,946
AVG FAMILY INCOME
$66,905
AVG HOUSEHOLD INCOME
0.41
INEQUALITY / GINI INDEX
809
TOTAL POPULATION
373
MALE POPULATION
436
FEMALE POPULATION
85.55
MALES / 100 FEMALES
116.89
FEMALES / 100 MALES
58.1
MEDIAN AGE
2.5
AVG FAMILY SIZE
2.0
AVG HOUSEHOLD SIZE
314
LABOR FORCE [ PEOPLE ]
46.3%
PERCENT IN LABOR FORCE
7.3%
UNEMPLOYMENT RATE
Deltaville Zip Codes
Deltaville Area Codes
Income in Deltaville
Income Overview in Deltaville
Per Capita Income in Deltaville is $42,755, while median incomes of families and households are $87,946 and $66,905 respectively.
| Characteristic | Number | Measure |
| Per Capita Income | 809 | $42,755 |
| Median Family Income | 242 | $87,946 |
| Mean Family Income | 242 | $99,128 |
| Median Household Income | 394 | $66,905 |
| Mean Household Income | 394 | $90,248 |
| Income Deficit | 242 | $0 |
| Wage / Income Gap (%) | 809 | 0.00% |
| Wage / Income Gap ($) | 809 | 100.00¢ per $1 |
| Gini / Inequality Index | 809 | 0.41 |
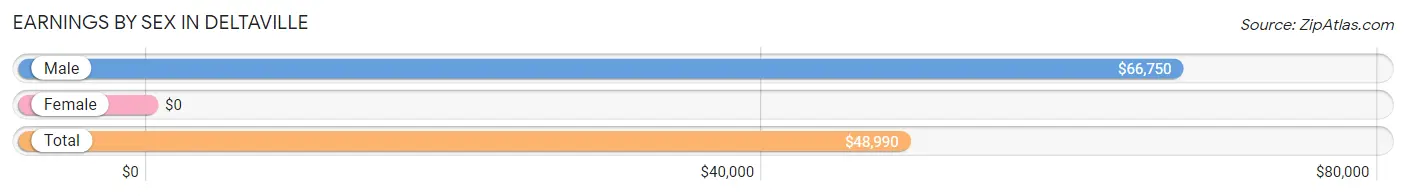
Earnings by Sex in Deltaville
| Sex | Number | Average Earnings |
| Male | 206 (62.6%) | $66,750 |
| Female | 123 (37.4%) | $0 |
| Total | 329 (100.0%) | $48,990 |
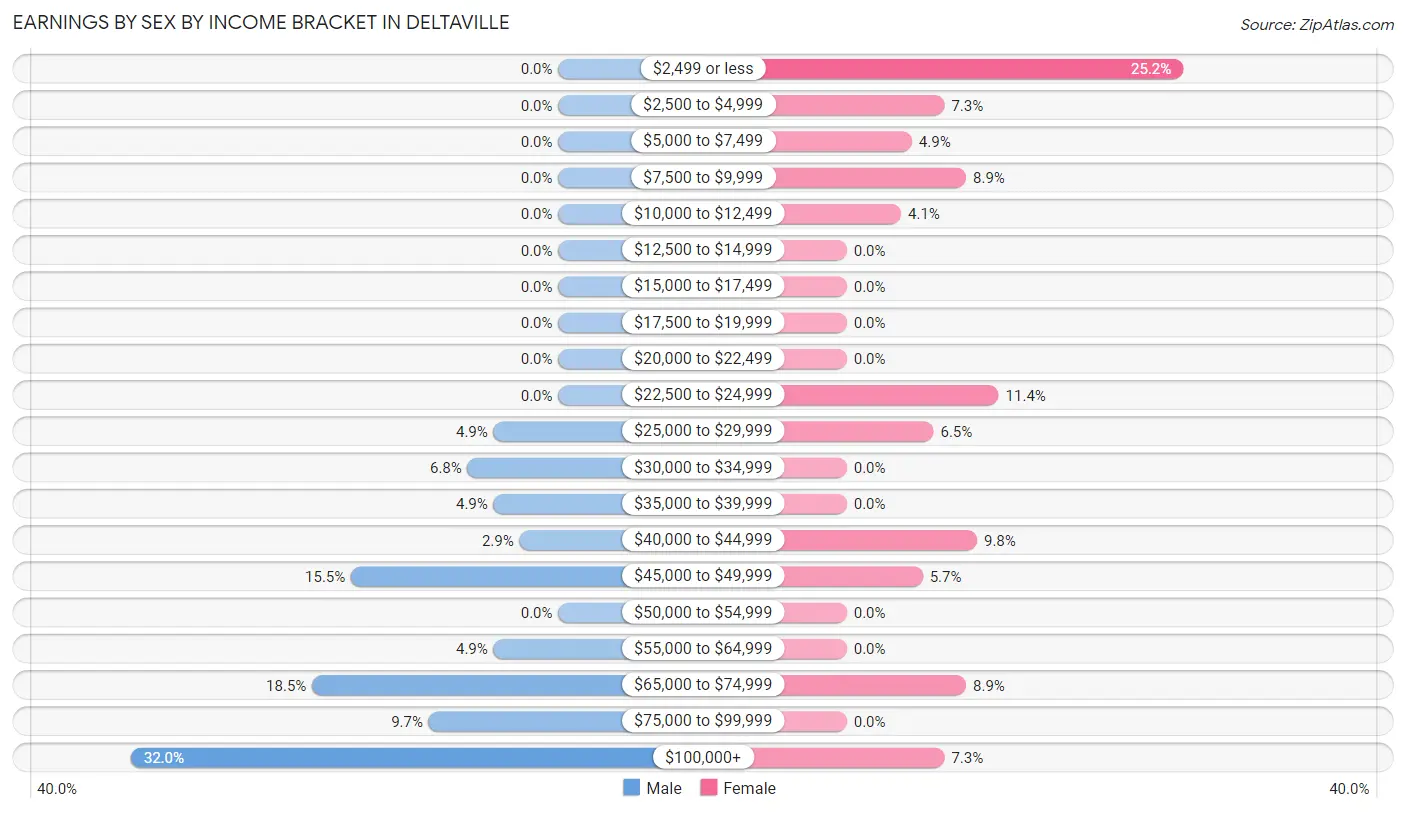
Earnings by Sex by Income Bracket in Deltaville
The most common earnings brackets in Deltaville are $100,000+ for men (66 | 32.0%) and $2,499 or less for women (31 | 25.2%).
| Income | Male | Female |
| $2,499 or less | 0 (0.0%) | 31 (25.2%) |
| $2,500 to $4,999 | 0 (0.0%) | 9 (7.3%) |
| $5,000 to $7,499 | 0 (0.0%) | 6 (4.9%) |
| $7,500 to $9,999 | 0 (0.0%) | 11 (8.9%) |
| $10,000 to $12,499 | 0 (0.0%) | 5 (4.1%) |
| $12,500 to $14,999 | 0 (0.0%) | 0 (0.0%) |
| $15,000 to $17,499 | 0 (0.0%) | 0 (0.0%) |
| $17,500 to $19,999 | 0 (0.0%) | 0 (0.0%) |
| $20,000 to $22,499 | 0 (0.0%) | 0 (0.0%) |
| $22,500 to $24,999 | 0 (0.0%) | 14 (11.4%) |
| $25,000 to $29,999 | 10 (4.9%) | 8 (6.5%) |
| $30,000 to $34,999 | 14 (6.8%) | 0 (0.0%) |
| $35,000 to $39,999 | 10 (4.9%) | 0 (0.0%) |
| $40,000 to $44,999 | 6 (2.9%) | 12 (9.8%) |
| $45,000 to $49,999 | 32 (15.5%) | 7 (5.7%) |
| $50,000 to $54,999 | 0 (0.0%) | 0 (0.0%) |
| $55,000 to $64,999 | 10 (4.9%) | 0 (0.0%) |
| $65,000 to $74,999 | 38 (18.4%) | 11 (8.9%) |
| $75,000 to $99,999 | 20 (9.7%) | 0 (0.0%) |
| $100,000+ | 66 (32.0%) | 9 (7.3%) |
| Total | 206 (100.0%) | 123 (100.0%) |
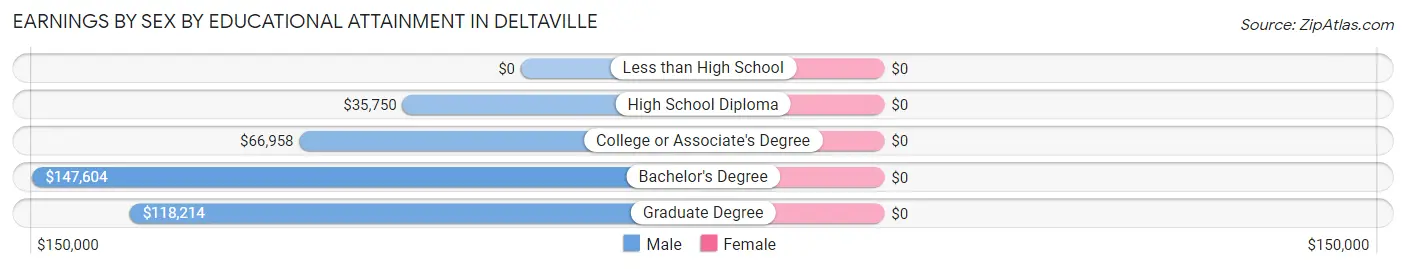
Earnings by Sex by Educational Attainment in Deltaville
| Educational Attainment | Male Income | Female Income |
| Less than High School | - | - |
| High School Diploma | $35,750 | $0 |
| College or Associate's Degree | $66,958 | $0 |
| Bachelor's Degree | $147,604 | $0 |
| Graduate Degree | $118,214 | $0 |
| Total | $66,750 | $23,482 |
Family Income in Deltaville
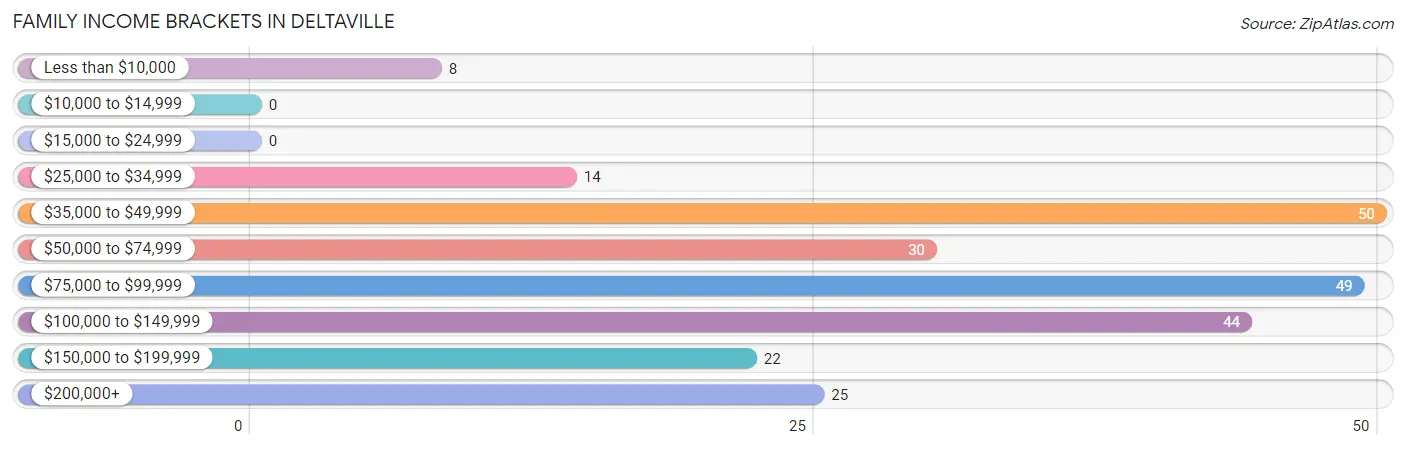
Family Income Brackets in Deltaville
According to the Deltaville family income data, there are 50 families falling into the $35,000 to $49,999 income range, which is the most common income bracket and makes up 20.7% of all families.
| Income Bracket | # Families | % Families |
| Less than $10,000 | 8 | 3.3% |
| $10,000 to $14,999 | 0 | 0.0% |
| $15,000 to $24,999 | 0 | 0.0% |
| $25,000 to $34,999 | 14 | 5.8% |
| $35,000 to $49,999 | 50 | 20.7% |
| $50,000 to $74,999 | 30 | 12.4% |
| $75,000 to $99,999 | 49 | 20.2% |
| $100,000 to $149,999 | 44 | 18.2% |
| $150,000 to $199,999 | 22 | 9.1% |
| $200,000+ | 25 | 10.3% |
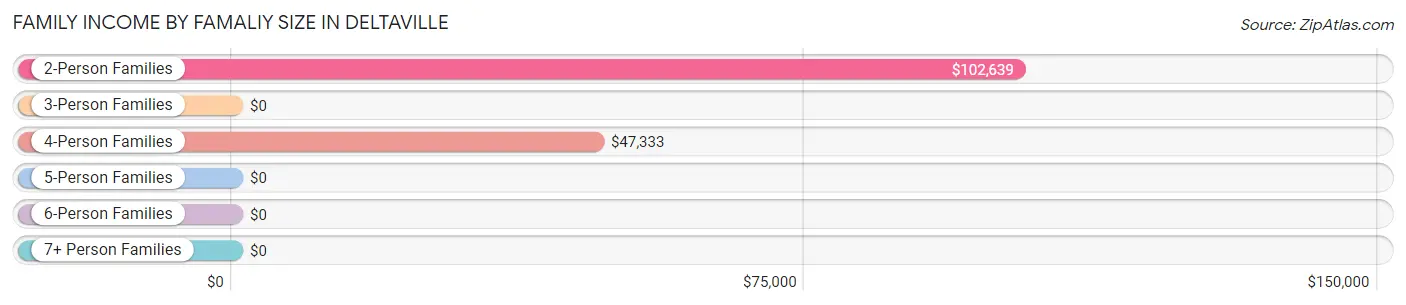
Family Income by Famaliy Size in Deltaville
2-person families (170 | 70.3%) account for the highest median family income in Deltaville with $102,639 per family, while 2-person families (170 | 70.3%) have the highest median income of $51,320 per family member.
| Income Bracket | # Families | Median Income |
| 2-Person Families | 170 (70.3%) | $102,639 |
| 3-Person Families | 36 (14.9%) | $0 |
| 4-Person Families | 28 (11.6%) | $47,333 |
| 5-Person Families | 8 (3.3%) | $0 |
| 6-Person Families | 0 (0.0%) | $0 |
| 7+ Person Families | 0 (0.0%) | $0 |
| Total | 242 (100.0%) | $87,946 |
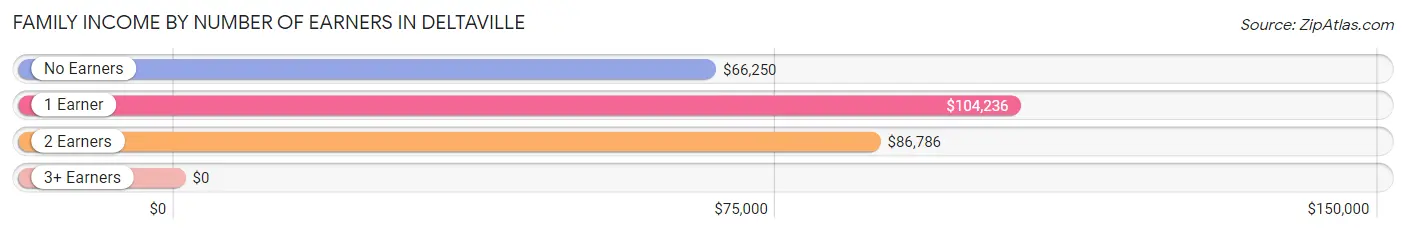
Family Income by Number of Earners in Deltaville
| Number of Earners | # Families | Median Income |
| No Earners | 88 (36.4%) | $66,250 |
| 1 Earner | 113 (46.7%) | $104,236 |
| 2 Earners | 36 (14.9%) | $86,786 |
| 3+ Earners | 5 (2.1%) | $0 |
| Total | 242 (100.0%) | $87,946 |
Household Income in Deltaville
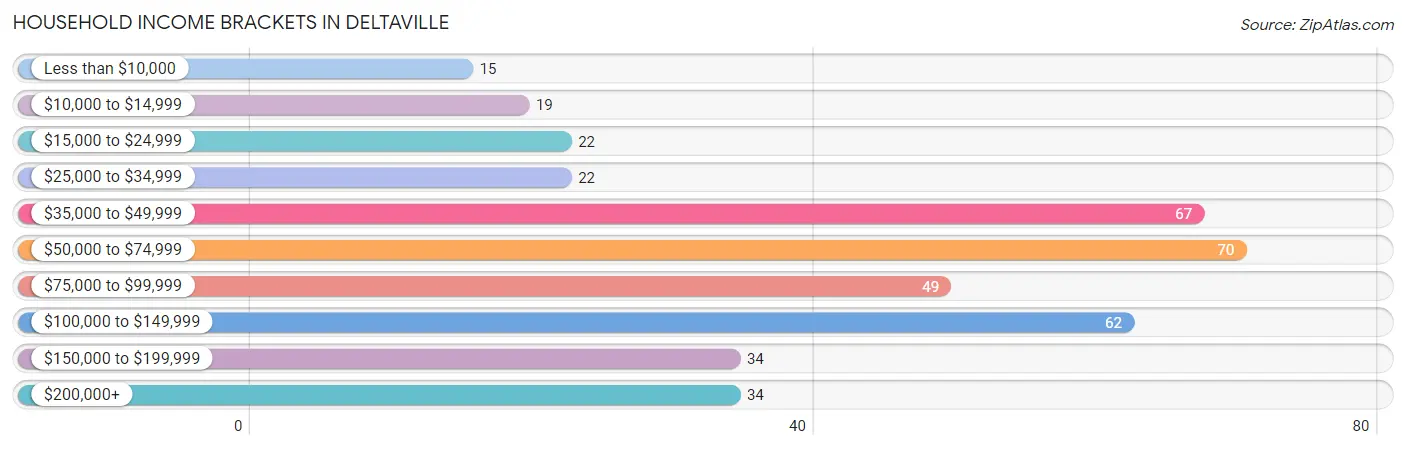
Household Income Brackets in Deltaville
With 70 households falling in the category, the $50,000 to $74,999 income range is the most frequent in Deltaville, accounting for 17.8% of all households. In contrast, only 15 households (3.8%) fall into the less than $10,000 income bracket, making it the least populous group.
| Income Bracket | # Households | % Households |
| Less than $10,000 | 15 | 3.8% |
| $10,000 to $14,999 | 19 | 4.8% |
| $15,000 to $24,999 | 22 | 5.6% |
| $25,000 to $34,999 | 22 | 5.6% |
| $35,000 to $49,999 | 67 | 17.0% |
| $50,000 to $74,999 | 70 | 17.8% |
| $75,000 to $99,999 | 49 | 12.4% |
| $100,000 to $149,999 | 62 | 15.7% |
| $150,000 to $199,999 | 34 | 8.6% |
| $200,000+ | 34 | 8.6% |
Household Income by Householder Age in Deltaville
The median household income in Deltaville is $66,905, with the highest median household income of $67,083 found in the 25 to 44 years age bracket for the primary householder. A total of 70 households (17.8%) fall into this category.
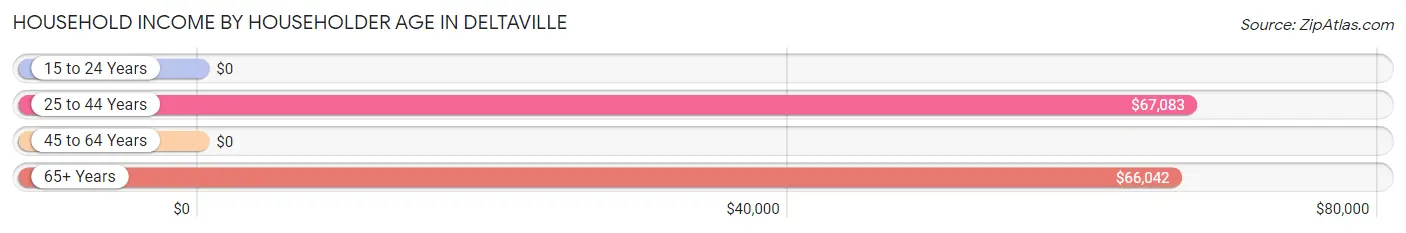
| Income Bracket | # Households | Median Income |
| 15 to 24 Years | 0 (0.0%) | $0 |
| 25 to 44 Years | 70 (17.8%) | $67,083 |
| 45 to 64 Years | 146 (37.1%) | $0 |
| 65+ Years | 178 (45.2%) | $66,042 |
| Total | 394 (100.0%) | $66,905 |
Poverty in Deltaville
Income Below Poverty by Sex and Age in Deltaville
With 4.4% poverty level for males and 7.6% for females among the residents of Deltaville, 75 year old and over males and 25 to 34 year old females are the most vulnerable to poverty, with 8 males (29.6%) and 11 females (26.2%) in their respective age groups living below the poverty level.
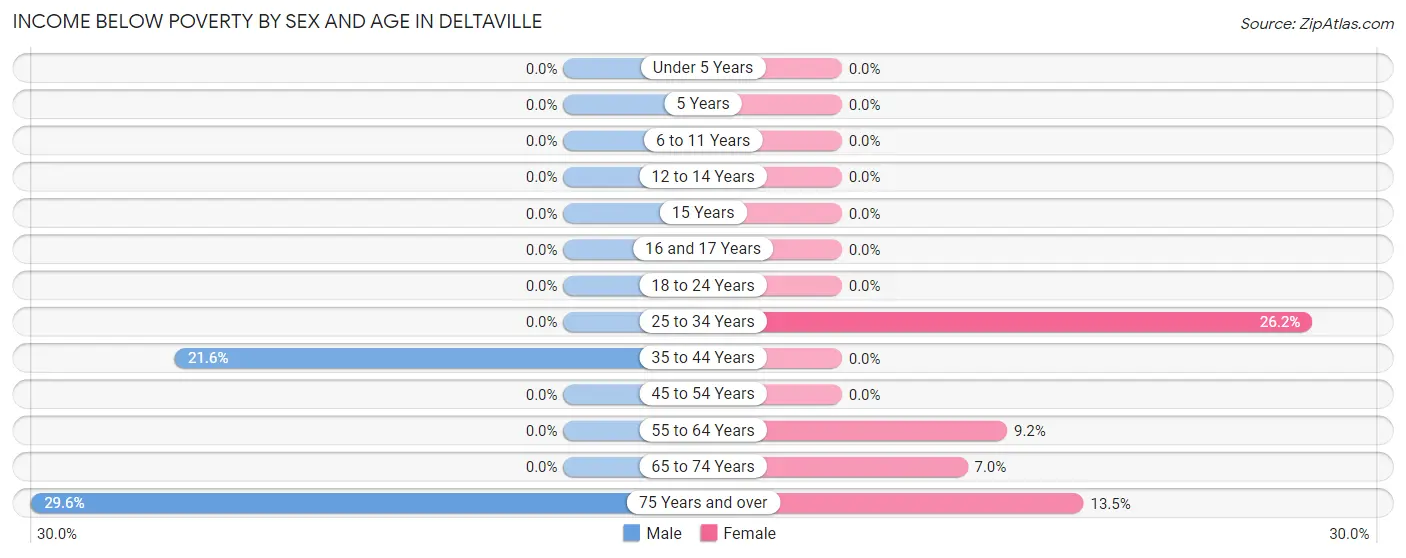
| Age Bracket | Male | Female |
| Under 5 Years | 0 (0.0%) | 0 (0.0%) |
| 5 Years | 0 (0.0%) | 0 (0.0%) |
| 6 to 11 Years | 0 (0.0%) | 0 (0.0%) |
| 12 to 14 Years | 0 (0.0%) | 0 (0.0%) |
| 15 Years | 0 (0.0%) | 0 (0.0%) |
| 16 and 17 Years | 0 (0.0%) | 0 (0.0%) |
| 18 to 24 Years | 0 (0.0%) | 0 (0.0%) |
| 25 to 34 Years | 0 (0.0%) | 11 (26.2%) |
| 35 to 44 Years | 8 (21.6%) | 0 (0.0%) |
| 45 to 54 Years | 0 (0.0%) | 0 (0.0%) |
| 55 to 64 Years | 0 (0.0%) | 8 (9.2%) |
| 65 to 74 Years | 0 (0.0%) | 7 (7.0%) |
| 75 Years and over | 8 (29.6%) | 7 (13.5%) |
| Total | 16 (4.4%) | 33 (7.6%) |
Income Above Poverty by Sex and Age in Deltaville
According to the poverty statistics in Deltaville, males aged 6 to 11 years and females aged under 5 years are the age groups that are most secure financially, with 100.0% of males and 100.0% of females in these age groups living above the poverty line.
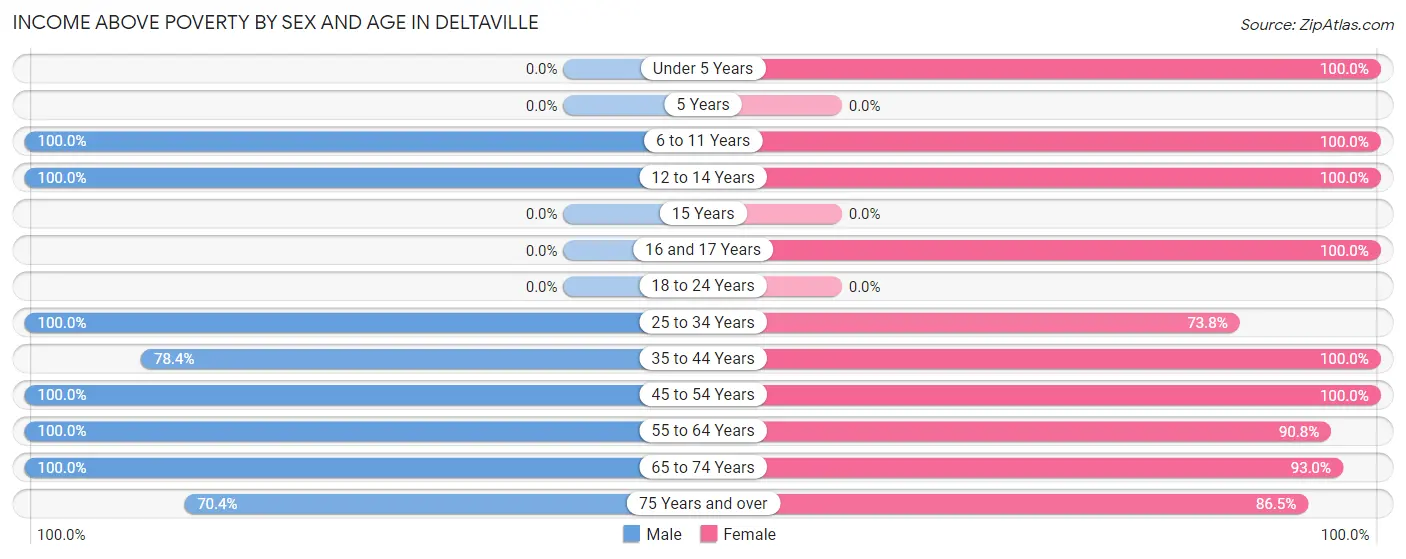
| Age Bracket | Male | Female |
| Under 5 Years | 0 (0.0%) | 17 (100.0%) |
| 5 Years | 0 (0.0%) | 0 (0.0%) |
| 6 to 11 Years | 20 (100.0%) | 49 (100.0%) |
| 12 to 14 Years | 22 (100.0%) | 14 (100.0%) |
| 15 Years | 0 (0.0%) | 0 (0.0%) |
| 16 and 17 Years | 0 (0.0%) | 22 (100.0%) |
| 18 to 24 Years | 0 (0.0%) | 0 (0.0%) |
| 25 to 34 Years | 38 (100.0%) | 31 (73.8%) |
| 35 to 44 Years | 29 (78.4%) | 13 (100.0%) |
| 45 to 54 Years | 56 (100.0%) | 40 (100.0%) |
| 55 to 64 Years | 76 (100.0%) | 79 (90.8%) |
| 65 to 74 Years | 88 (100.0%) | 93 (93.0%) |
| 75 Years and over | 19 (70.4%) | 45 (86.5%) |
| Total | 348 (95.6%) | 403 (92.4%) |
Income Below Poverty Among Married-Couple Families in Deltaville
The poverty statistics for married-couple families in Deltaville show that 4.3% or 8 of the total 185 families live below the poverty line. Families with no children have the highest poverty rate of 5.4%, comprising of 8 families. On the other hand, families with 1 or 2 children have the lowest poverty rate of 0.0%, which includes 0 families.
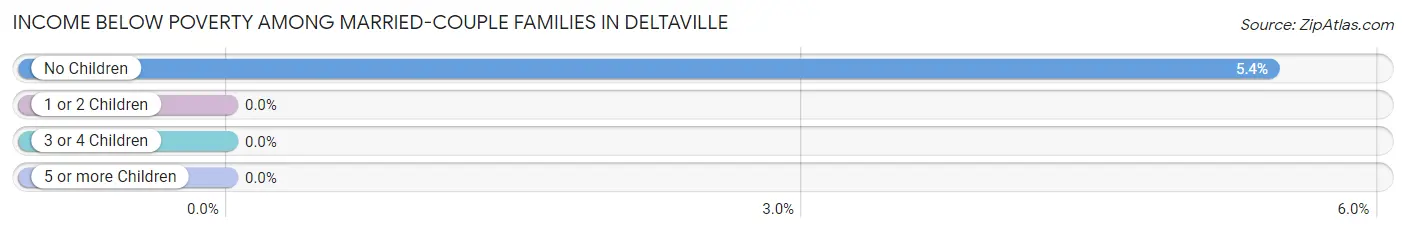
| Children | Above Poverty | Below Poverty |
| No Children | 139 (94.6%) | 8 (5.4%) |
| 1 or 2 Children | 38 (100.0%) | 0 (0.0%) |
| 3 or 4 Children | 0 (0.0%) | 0 (0.0%) |
| 5 or more Children | 0 (0.0%) | 0 (0.0%) |
| Total | 177 (95.7%) | 8 (4.3%) |
Income Below Poverty Among Single-Parent Households in Deltaville
| Children | Single Father | Single Mother |
| No Children | 0 (0.0%) | 0 (0.0%) |
| 1 or 2 Children | 0 (0.0%) | 0 (0.0%) |
| 3 or 4 Children | 0 (0.0%) | 0 (0.0%) |
| 5 or more Children | 0 (0.0%) | 0 (0.0%) |
| Total | 0 (0.0%) | 0 (0.0%) |
Income Below Poverty Among Married-Couple vs Single-Parent Households in Deltaville
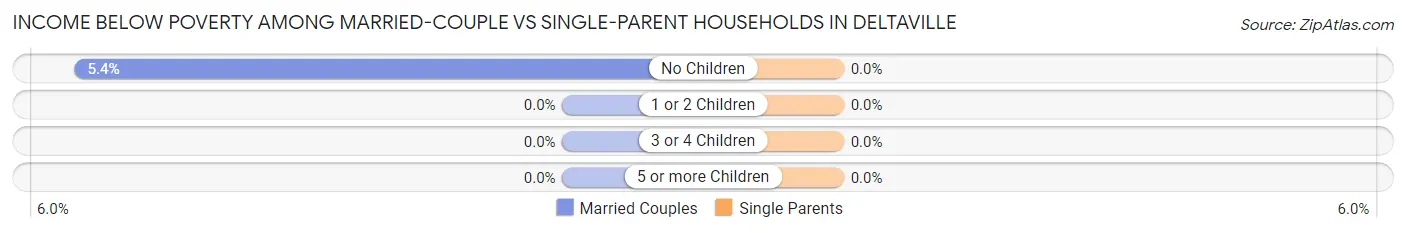
| Children | Married-Couple Families | Single-Parent Households |
| No Children | 8 (5.4%) | 0 (0.0%) |
| 1 or 2 Children | 0 (0.0%) | 0 (0.0%) |
| 3 or 4 Children | 0 (0.0%) | 0 (0.0%) |
| 5 or more Children | 0 (0.0%) | 0 (0.0%) |
| Total | 8 (4.3%) | 0 (0.0%) |
Race in Deltaville
The most populous races in Deltaville are White / Caucasian (789 | 97.5%), and Two or more Races (20 | 2.5%).
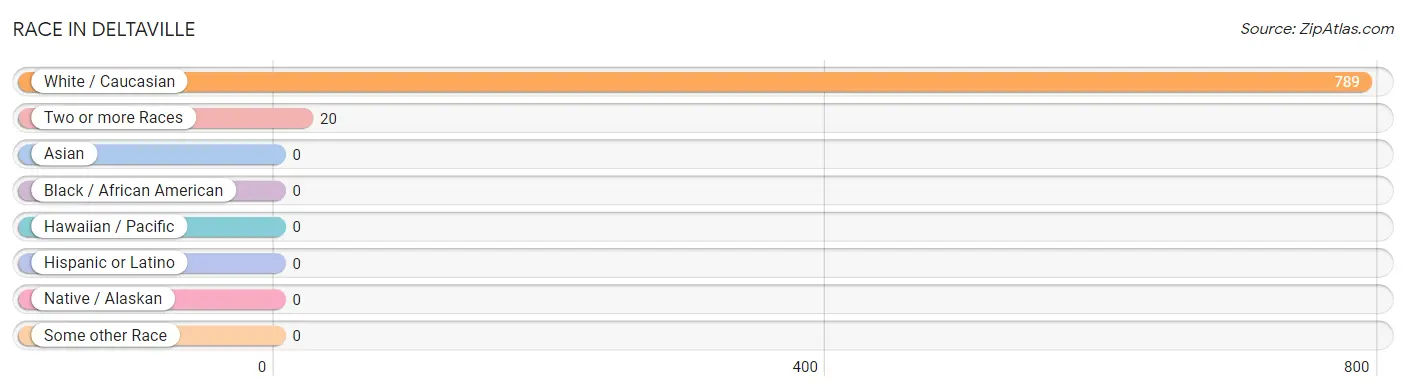
| Race | # Population | % Population |
| Asian | 0 | 0.0% |
| Black / African American | 0 | 0.0% |
| Hawaiian / Pacific | 0 | 0.0% |
| Hispanic or Latino | 0 | 0.0% |
| Native / Alaskan | 0 | 0.0% |
| White / Caucasian | 789 | 97.5% |
| Two or more Races | 20 | 2.5% |
| Some other Race | 0 | 0.0% |
| Total | 809 | 100.0% |
Ancestry in Deltaville
The most populous ancestries reported in Deltaville are American (236 | 29.2%), English (97 | 12.0%), Irish (88 | 10.9%), Polish (59 | 7.3%), and Italian (56 | 6.9%), together accounting for 66.2% of all Deltaville residents.
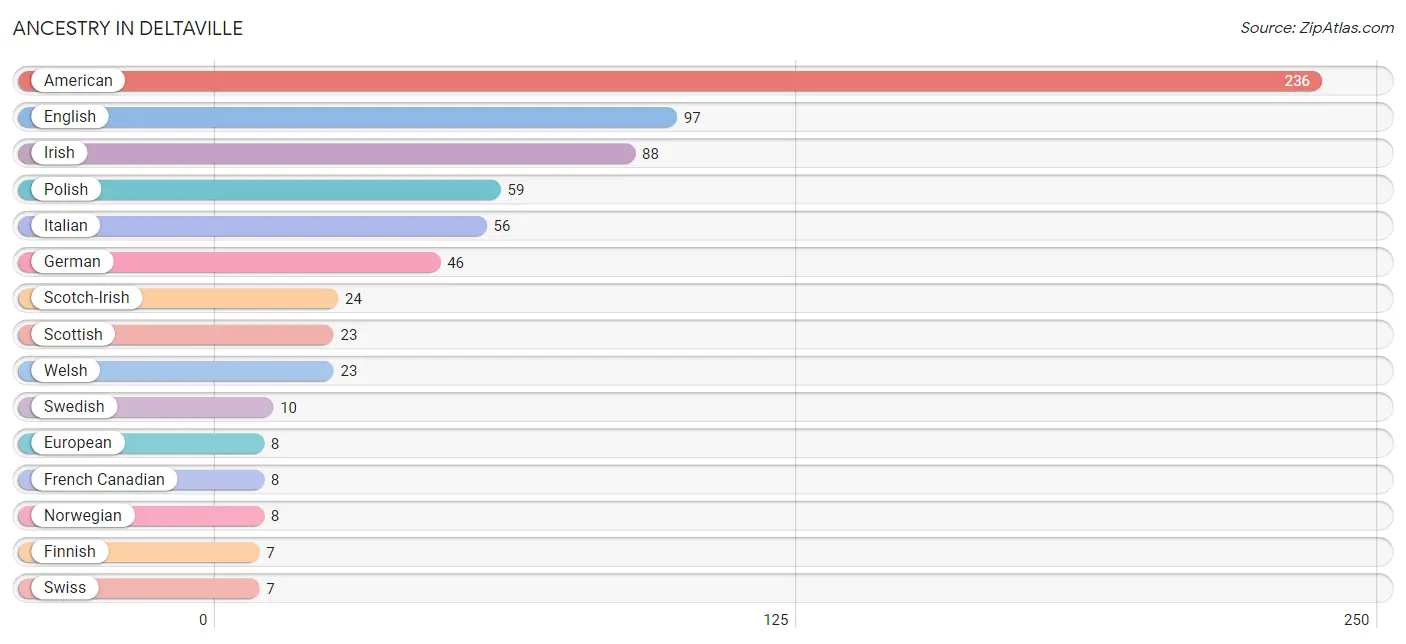
| Ancestry | # Population | % Population |
| American | 236 | 29.2% |
| English | 97 | 12.0% |
| European | 8 | 1.0% |
| Finnish | 7 | 0.9% |
| French Canadian | 8 | 1.0% |
| German | 46 | 5.7% |
| Irish | 88 | 10.9% |
| Italian | 56 | 6.9% |
| Norwegian | 8 | 1.0% |
| Polish | 59 | 7.3% |
| Scotch-Irish | 24 | 3.0% |
| Scottish | 23 | 2.8% |
| Swedish | 10 | 1.2% |
| Swiss | 7 | 0.9% |
| Welsh | 23 | 2.8% | View All 15 Rows |
Immigrants in Deltaville
The most numerous immigrant groups reported in Deltaville came from Canada (8 | 1.0%), Europe (7 | 0.9%), Germany (7 | 0.9%), and Western Europe (7 | 0.9%), together accounting for 3.6% of all Deltaville residents.
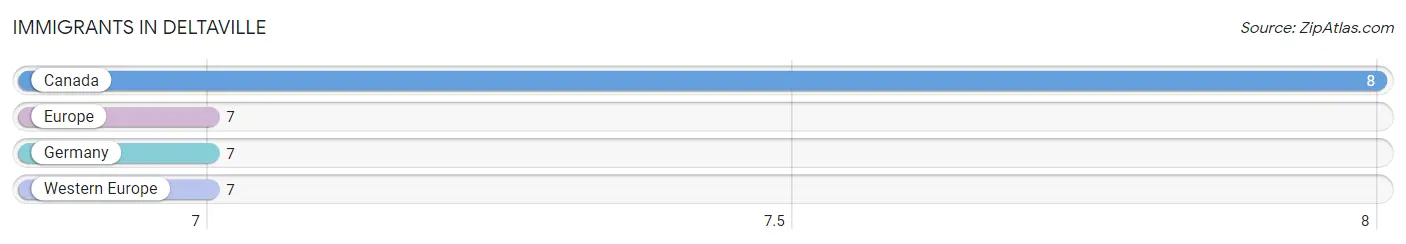
| Immigration Origin | # Population | % Population |
| Canada | 8 | 1.0% |
| Europe | 7 | 0.9% |
| Germany | 7 | 0.9% |
| Western Europe | 7 | 0.9% | View All 4 Rows |
Sex and Age in Deltaville
Sex and Age in Deltaville
The most populous age groups in Deltaville are 65 to 69 Years (44 | 11.8%) for men and 65 to 69 Years (67 | 15.4%) for women.
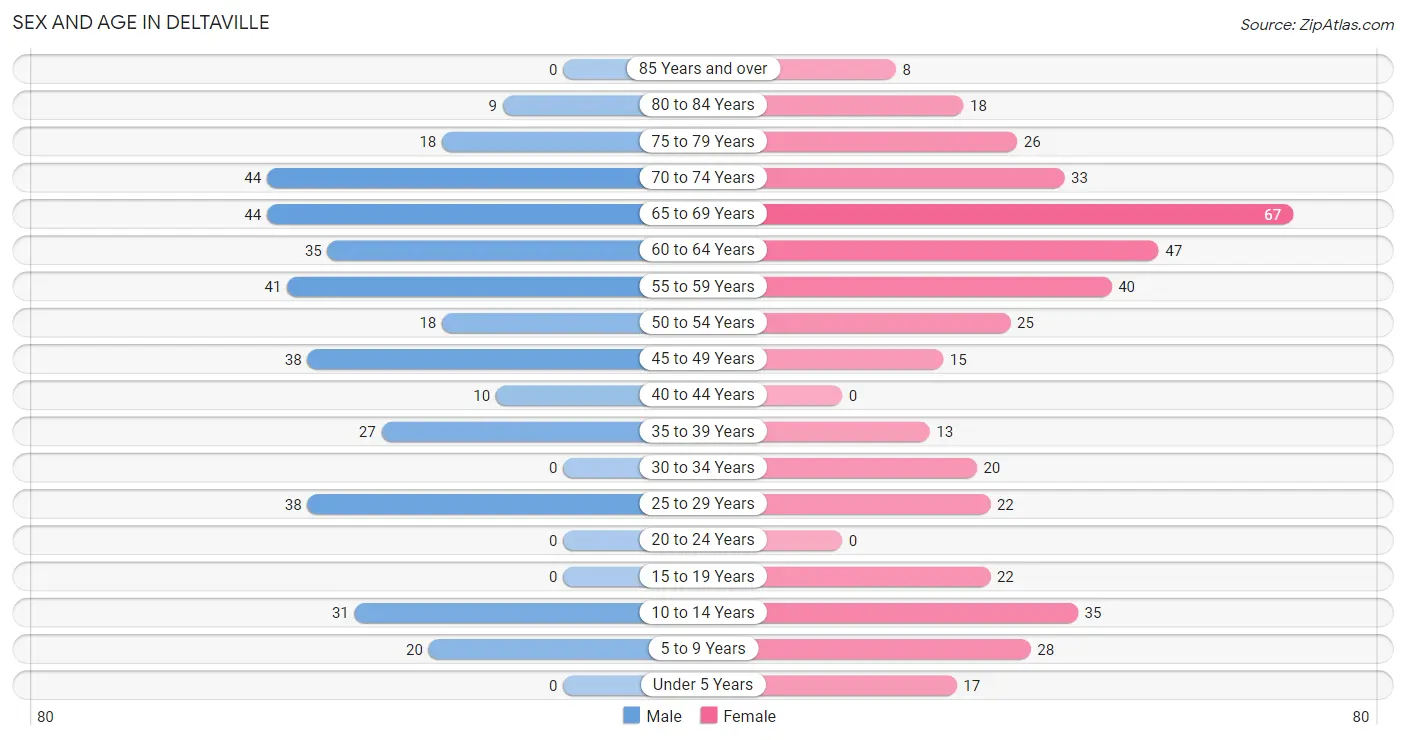
| Age Bracket | Male | Female |
| Under 5 Years | 0 (0.0%) | 17 (3.9%) |
| 5 to 9 Years | 20 (5.4%) | 28 (6.4%) |
| 10 to 14 Years | 31 (8.3%) | 35 (8.0%) |
| 15 to 19 Years | 0 (0.0%) | 22 (5.1%) |
| 20 to 24 Years | 0 (0.0%) | 0 (0.0%) |
| 25 to 29 Years | 38 (10.2%) | 22 (5.1%) |
| 30 to 34 Years | 0 (0.0%) | 20 (4.6%) |
| 35 to 39 Years | 27 (7.2%) | 13 (3.0%) |
| 40 to 44 Years | 10 (2.7%) | 0 (0.0%) |
| 45 to 49 Years | 38 (10.2%) | 15 (3.4%) |
| 50 to 54 Years | 18 (4.8%) | 25 (5.7%) |
| 55 to 59 Years | 41 (11.0%) | 40 (9.2%) |
| 60 to 64 Years | 35 (9.4%) | 47 (10.8%) |
| 65 to 69 Years | 44 (11.8%) | 67 (15.4%) |
| 70 to 74 Years | 44 (11.8%) | 33 (7.6%) |
| 75 to 79 Years | 18 (4.8%) | 26 (6.0%) |
| 80 to 84 Years | 9 (2.4%) | 18 (4.1%) |
| 85 Years and over | 0 (0.0%) | 8 (1.8%) |
| Total | 373 (100.0%) | 436 (100.0%) |
Families and Households in Deltaville
Median Family Size in Deltaville
The median family size in Deltaville is 2.49 persons per family, with single male/father families (40 | 16.5%) accounting for the largest median family size of 3.3 persons per family. On the other hand, single female/mother families (17 | 7.0%) represent the smallest median family size with 1.82 persons per family.
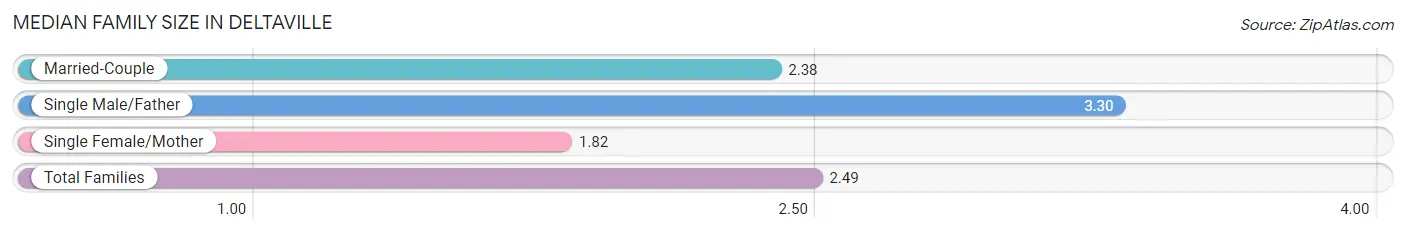
| Family Type | # Families | Family Size |
| Married-Couple | 185 (76.4%) | 2.38 |
| Single Male/Father | 40 (16.5%) | 3.30 |
| Single Female/Mother | 17 (7.0%) | 1.82 |
| Total Families | 242 (100.0%) | 2.49 |
Median Household Size in Deltaville
The median household size in Deltaville is 2.05 persons per household, with single male/father households (40 | 10.2%) accounting for the largest median household size of 3.3 persons per household. non-family households (152 | 38.6%) represent the smallest median household size with 1.25 persons per household.
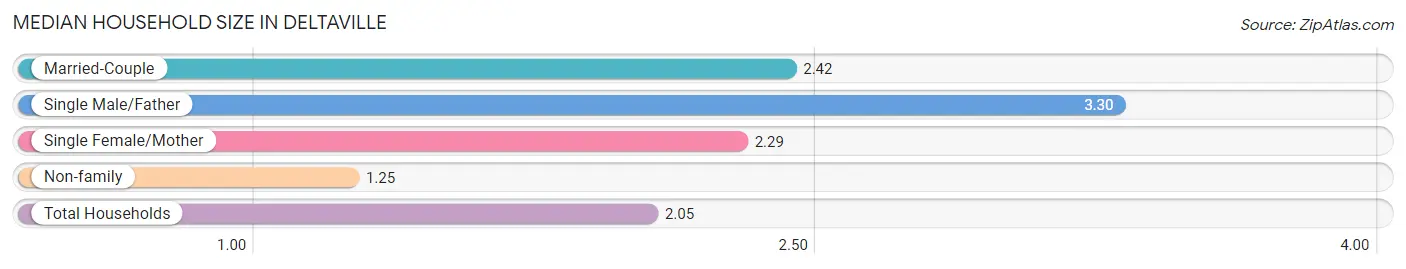
| Household Type | # Households | Household Size |
| Married-Couple | 185 (46.9%) | 2.42 |
| Single Male/Father | 40 (10.2%) | 3.30 |
| Single Female/Mother | 17 (4.3%) | 2.29 |
| Non-family | 152 (38.6%) | 1.25 |
| Total Households | 394 (100.0%) | 2.05 |
Household Size by Marriage Status in Deltaville
Out of a total of 394 households in Deltaville, 242 (61.4%) are family households, while 152 (38.6%) are nonfamily households. The most numerous type of family households are 2-person households, comprising 161, and the most common type of nonfamily households are 1-person households, comprising 120.
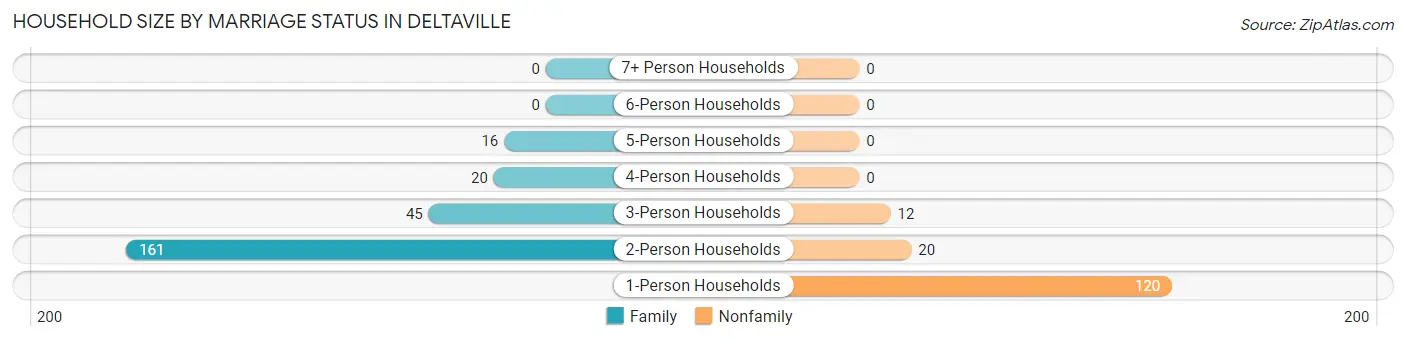
| Household Size | Family Households | Nonfamily Households |
| 1-Person Households | - | 120 (30.5%) |
| 2-Person Households | 161 (40.9%) | 20 (5.1%) |
| 3-Person Households | 45 (11.4%) | 12 (3.0%) |
| 4-Person Households | 20 (5.1%) | 0 (0.0%) |
| 5-Person Households | 16 (4.1%) | 0 (0.0%) |
| 6-Person Households | 0 (0.0%) | 0 (0.0%) |
| 7+ Person Households | 0 (0.0%) | 0 (0.0%) |
| Total | 242 (61.4%) | 152 (38.6%) |
Female Fertility in Deltaville
Fertility by Age in Deltaville
| Age Bracket | Women with Births | Births / 1,000 Women |
| 15 to 19 years | 0 (0.0%) | 0.0 |
| 20 to 34 years | 0 (0.0%) | 0.0 |
| 35 to 50 years | 0 (0.0%) | 0.0 |
| Total | 0 (0.0%) | 0.0 |
Fertility by Age by Marriage Status in Deltaville
| Age Bracket | Married | Unmarried |
| 15 to 19 years | 0 (0.0%) | 0 (0.0%) |
| 20 to 34 years | 0 (0.0%) | 0 (0.0%) |
| 35 to 50 years | 0 (0.0%) | 0 (0.0%) |
| Total | 0 (0.0%) | 0 (0.0%) |
Fertility by Education in Deltaville
| Educational Attainment | Women with Births | Births / 1,000 Women |
| Less than High School | 0 (0.0%) | 0.0 |
| High School Diploma | 0 (0.0%) | 0.0 |
| College or Associate's Degree | 0 (0.0%) | 0.0 |
| Bachelor's Degree | 0 (0.0%) | 0.0 |
| Graduate Degree | 0 (0.0%) | 0.0 |
| Total | 0 (0.0%) | 0.0 |
Fertility by Education by Marriage Status in Deltaville
| Educational Attainment | Married | Unmarried |
| Less than High School | 0 (0.0%) | 0 (0.0%) |
| High School Diploma | 0 (0.0%) | 0 (0.0%) |
| College or Associate's Degree | 0 (0.0%) | 0 (0.0%) |
| Bachelor's Degree | 0 (0.0%) | 0 (0.0%) |
| Graduate Degree | 0 (0.0%) | 0 (0.0%) |
| Total | 0 (0.0%) | 0 (0.0%) |
Employment Characteristics in Deltaville
Employment by Class of Employer in Deltaville
Among the 279 employed individuals in Deltaville, private company employees (194 | 69.5%), self-employed (not incorporated) (51 | 18.3%), and self-employed (incorporated) (12 | 4.3%) make up the most common classes of employment.
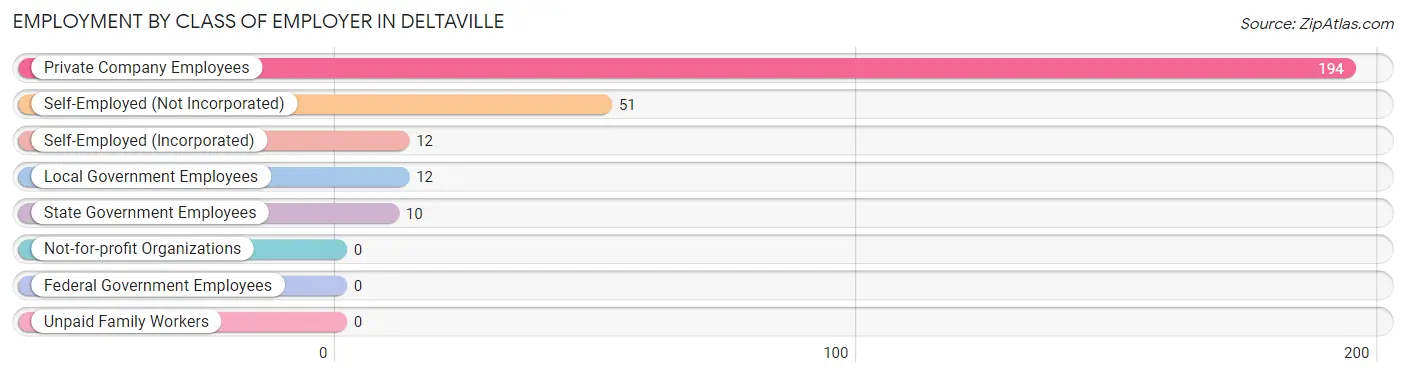
| Employer Class | # Employees | % Employees |
| Private Company Employees | 194 | 69.5% |
| Self-Employed (Incorporated) | 12 | 4.3% |
| Self-Employed (Not Incorporated) | 51 | 18.3% |
| Not-for-profit Organizations | 0 | 0.0% |
| Local Government Employees | 12 | 4.3% |
| State Government Employees | 10 | 3.6% |
| Federal Government Employees | 0 | 0.0% |
| Unpaid Family Workers | 0 | 0.0% |
| Total | 279 | 100.0% |
Employment Status by Age in Deltaville
According to the labor force statistics for Deltaville, out of the total population over 16 years of age (678), 46.3% or 314 individuals are in the labor force, with 7.3% or 23 of them unemployed. The age group with the highest labor force participation rate is 35 to 44 years, with 100.0% or 50 individuals in the labor force. Within the labor force, the 35 to 44 years age range has the highest percentage of unemployed individuals, with 26.0% or 13 of them being unemployed.
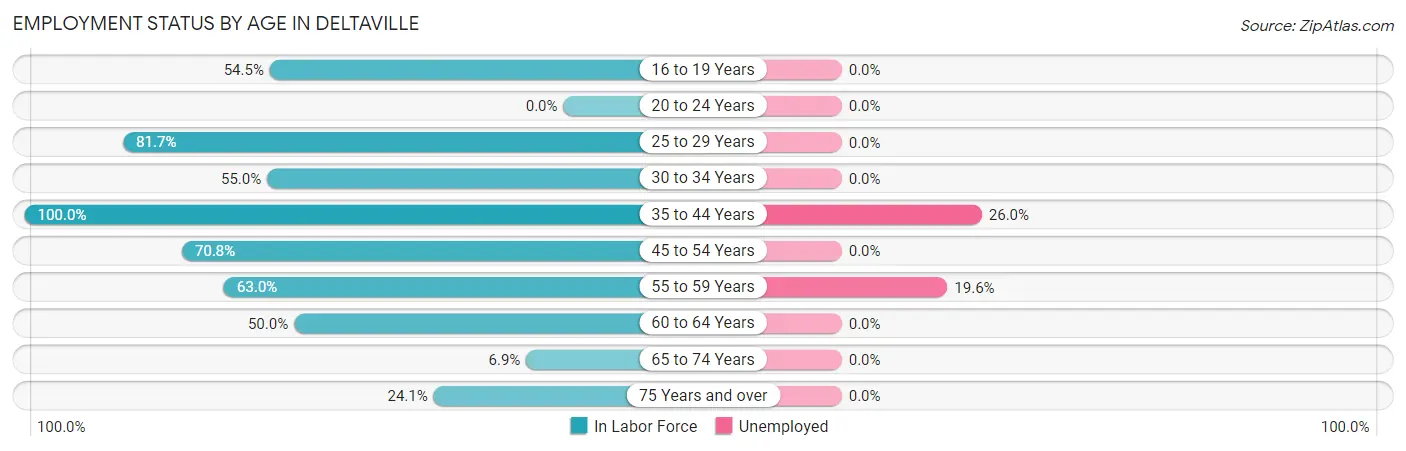
| Age Bracket | In Labor Force | Unemployed |
| 16 to 19 Years | 12 (54.5%) | 0 (0.0%) |
| 20 to 24 Years | 0 (0.0%) | 0 (0.0%) |
| 25 to 29 Years | 49 (81.7%) | 0 (0.0%) |
| 30 to 34 Years | 11 (55.0%) | 0 (0.0%) |
| 35 to 44 Years | 50 (100.0%) | 13 (26.0%) |
| 45 to 54 Years | 68 (70.8%) | 0 (0.0%) |
| 55 to 59 Years | 51 (63.0%) | 10 (19.6%) |
| 60 to 64 Years | 41 (50.0%) | 0 (0.0%) |
| 65 to 74 Years | 13 (6.9%) | 0 (0.0%) |
| 75 Years and over | 19 (24.1%) | 0 (0.0%) |
| Total | 314 (46.3%) | 23 (7.3%) |
Employment Status by Educational Attainment in Deltaville
According to labor force statistics for Deltaville, 69.4% of individuals (270) out of the total population between 25 and 64 years of age (389) are in the labor force, with 8.5% or 23 of them being unemployed. The group with the highest labor force participation rate are those with the educational attainment of bachelor's degree or higher, with 79.6% or 43 individuals in the labor force. Within the labor force, individuals with high school diploma education have the highest percentage of unemployment, with 18.0% or 18 of them being unemployed.
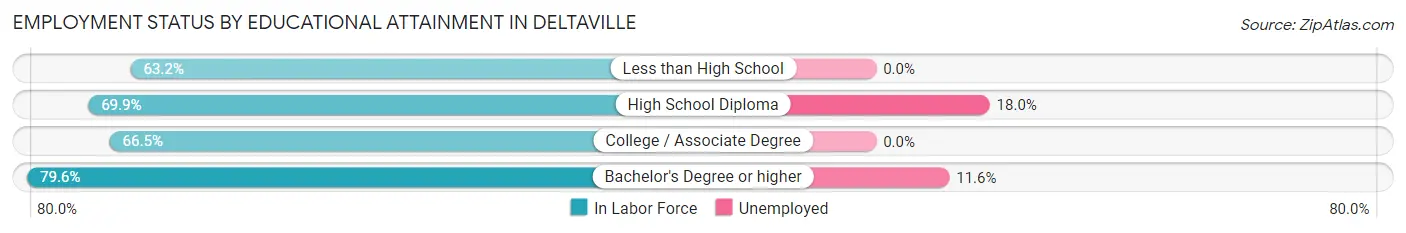
| Educational Attainment | In Labor Force | Unemployed |
| Less than High School | 12 (63.2%) | 0 (0.0%) |
| High School Diploma | 100 (69.9%) | 26 (18.0%) |
| College / Associate Degree | 115 (66.5%) | 0 (0.0%) |
| Bachelor's Degree or higher | 43 (79.6%) | 6 (11.6%) |
| Total | 270 (69.4%) | 33 (8.5%) |
Employment Occupations by Sex in Deltaville
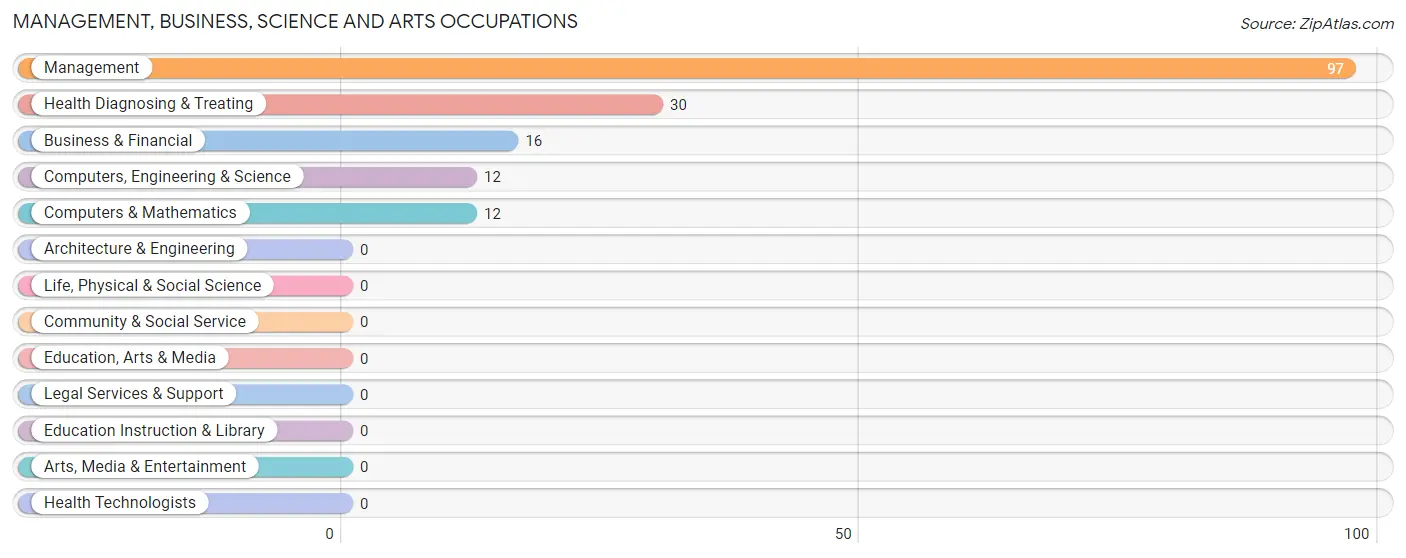
Management, Business, Science and Arts Occupations
The most common Management, Business, Science and Arts occupations in Deltaville are Management (97 | 33.3%), Health Diagnosing & Treating (30 | 10.3%), Business & Financial (16 | 5.5%), Computers, Engineering & Science (12 | 4.1%), and Computers & Mathematics (12 | 4.1%).
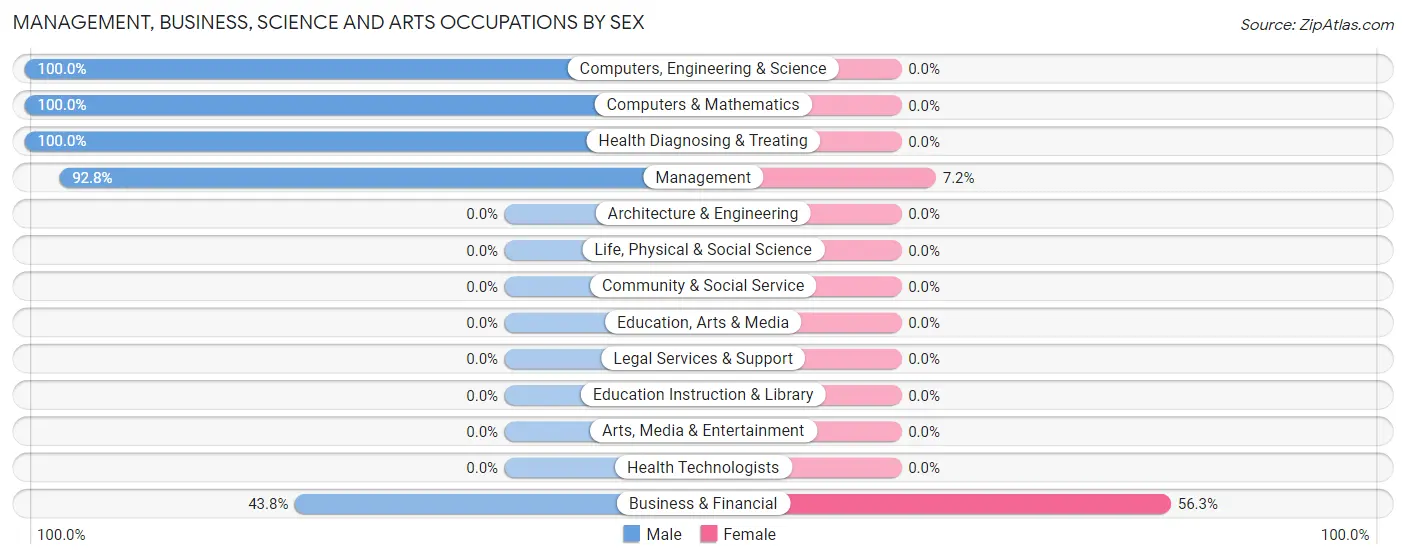
Management, Business, Science and Arts Occupations by Sex
Within the Management, Business, Science and Arts occupations in Deltaville, the most male-oriented occupations are Computers, Engineering & Science (100.0%), Computers & Mathematics (100.0%), and Health Diagnosing & Treating (100.0%), while the most female-oriented occupations are Business & Financial (56.2%), and Management (7.2%).
| Occupation | Male | Female |
| Management | 90 (92.8%) | 7 (7.2%) |
| Business & Financial | 7 (43.8%) | 9 (56.2%) |
| Computers, Engineering & Science | 12 (100.0%) | 0 (0.0%) |
| Computers & Mathematics | 12 (100.0%) | 0 (0.0%) |
| Architecture & Engineering | 0 (0.0%) | 0 (0.0%) |
| Life, Physical & Social Science | 0 (0.0%) | 0 (0.0%) |
| Community & Social Service | 0 (0.0%) | 0 (0.0%) |
| Education, Arts & Media | 0 (0.0%) | 0 (0.0%) |
| Legal Services & Support | 0 (0.0%) | 0 (0.0%) |
| Education Instruction & Library | 0 (0.0%) | 0 (0.0%) |
| Arts, Media & Entertainment | 0 (0.0%) | 0 (0.0%) |
| Health Diagnosing & Treating | 30 (100.0%) | 0 (0.0%) |
| Health Technologists | 0 (0.0%) | 0 (0.0%) |
| Total (Category) | 139 (89.7%) | 16 (10.3%) |
| Total (Overall) | 184 (63.2%) | 107 (36.8%) |
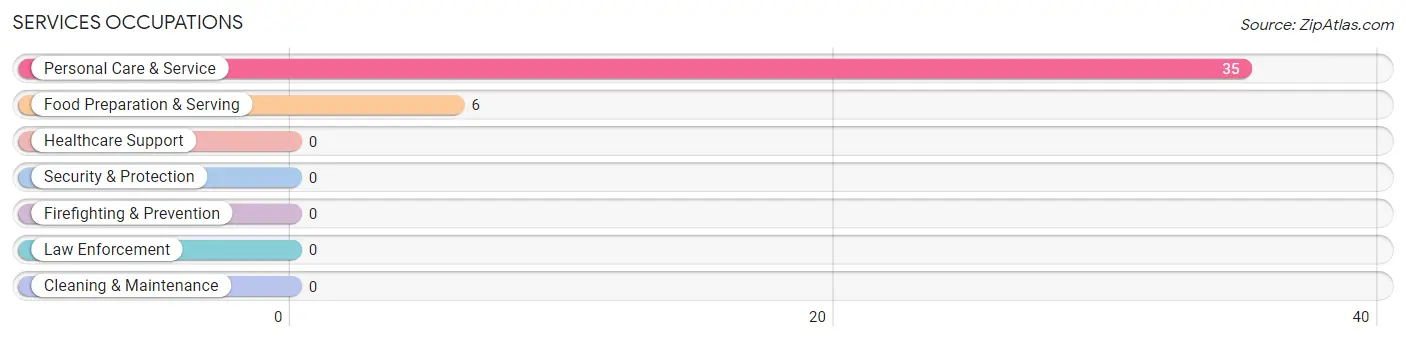
Services Occupations
The most common Services occupations in Deltaville are Personal Care & Service (35 | 12.0%), and Food Preparation & Serving (6 | 2.1%).
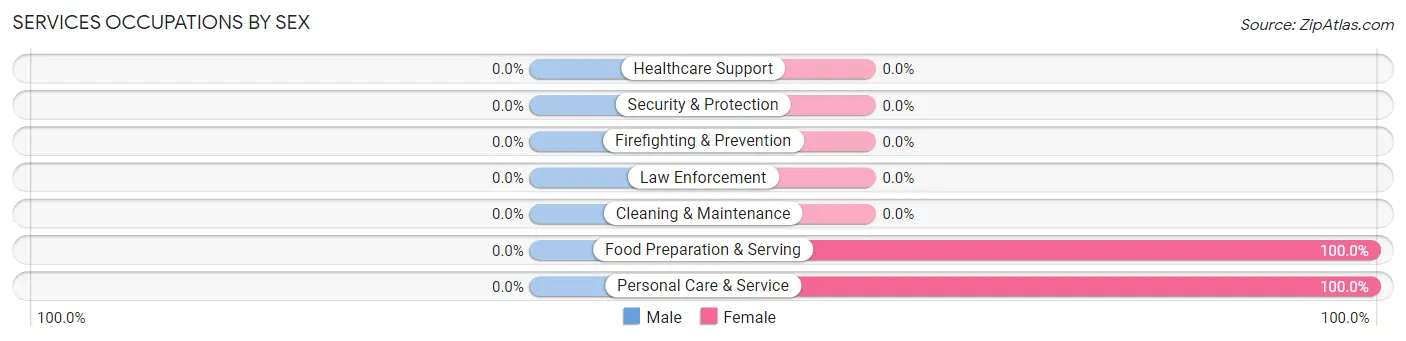
Services Occupations by Sex
| Occupation | Male | Female |
| Healthcare Support | 0 (0.0%) | 0 (0.0%) |
| Security & Protection | 0 (0.0%) | 0 (0.0%) |
| Firefighting & Prevention | 0 (0.0%) | 0 (0.0%) |
| Law Enforcement | 0 (0.0%) | 0 (0.0%) |
| Food Preparation & Serving | 0 (0.0%) | 6 (100.0%) |
| Cleaning & Maintenance | 0 (0.0%) | 0 (0.0%) |
| Personal Care & Service | 0 (0.0%) | 35 (100.0%) |
| Total (Category) | 0 (0.0%) | 41 (100.0%) |
| Total (Overall) | 184 (63.2%) | 107 (36.8%) |
Sales and Office Occupations
The most common Sales and Office occupations in Deltaville are Sales & Related (35 | 12.0%), and Office & Administration (24 | 8.3%).
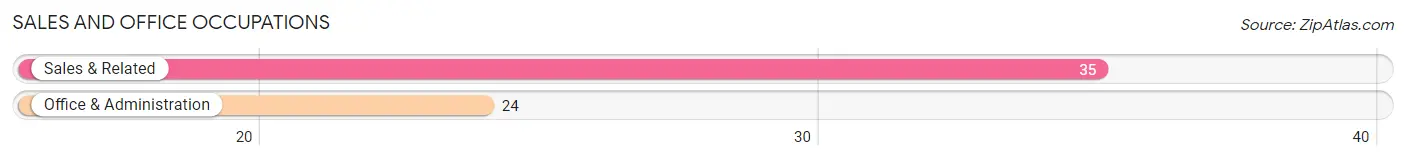
Sales and Office Occupations by Sex
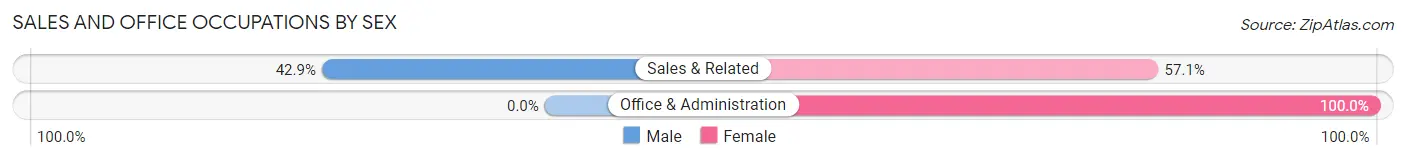
| Occupation | Male | Female |
| Sales & Related | 15 (42.9%) | 20 (57.1%) |
| Office & Administration | 0 (0.0%) | 24 (100.0%) |
| Total (Category) | 15 (25.4%) | 44 (74.6%) |
| Total (Overall) | 184 (63.2%) | 107 (36.8%) |
Natural Resources, Construction and Maintenance Occupations
The most common Natural Resources, Construction and Maintenance occupations in Deltaville are Construction & Extraction (16 | 5.5%), and Installation, Maintenance & Repair (6 | 2.1%).
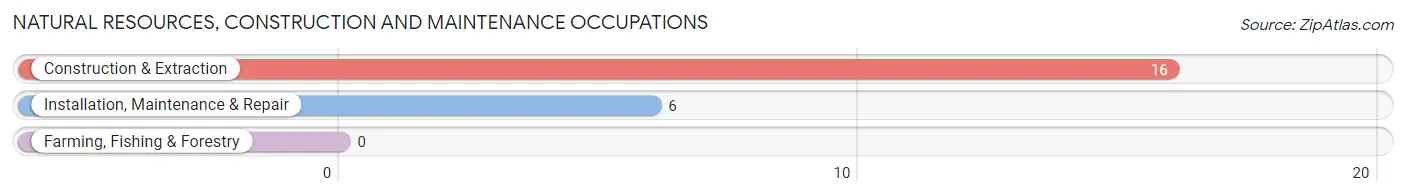
Natural Resources, Construction and Maintenance Occupations by Sex

| Occupation | Male | Female |
| Farming, Fishing & Forestry | 0 (0.0%) | 0 (0.0%) |
| Construction & Extraction | 16 (100.0%) | 0 (0.0%) |
| Installation, Maintenance & Repair | 6 (100.0%) | 0 (0.0%) |
| Total (Category) | 22 (100.0%) | 0 (0.0%) |
| Total (Overall) | 184 (63.2%) | 107 (36.8%) |
Production, Transportation and Moving Occupations
The most common Production, Transportation and Moving occupations in Deltaville are Transportation (8 | 2.8%), and Production (6 | 2.1%).
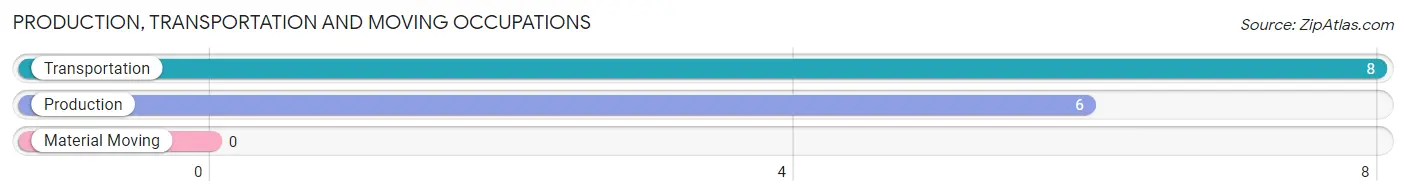
Production, Transportation and Moving Occupations by Sex
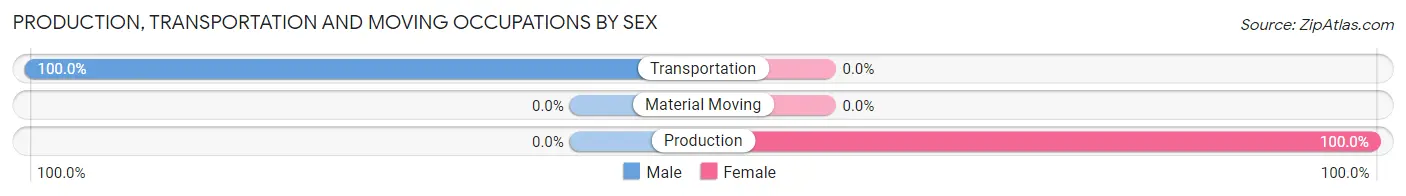
| Occupation | Male | Female |
| Production | 0 (0.0%) | 6 (100.0%) |
| Transportation | 8 (100.0%) | 0 (0.0%) |
| Material Moving | 0 (0.0%) | 0 (0.0%) |
| Total (Category) | 8 (57.1%) | 6 (42.9%) |
| Total (Overall) | 184 (63.2%) | 107 (36.8%) |
Employment Industries by Sex in Deltaville
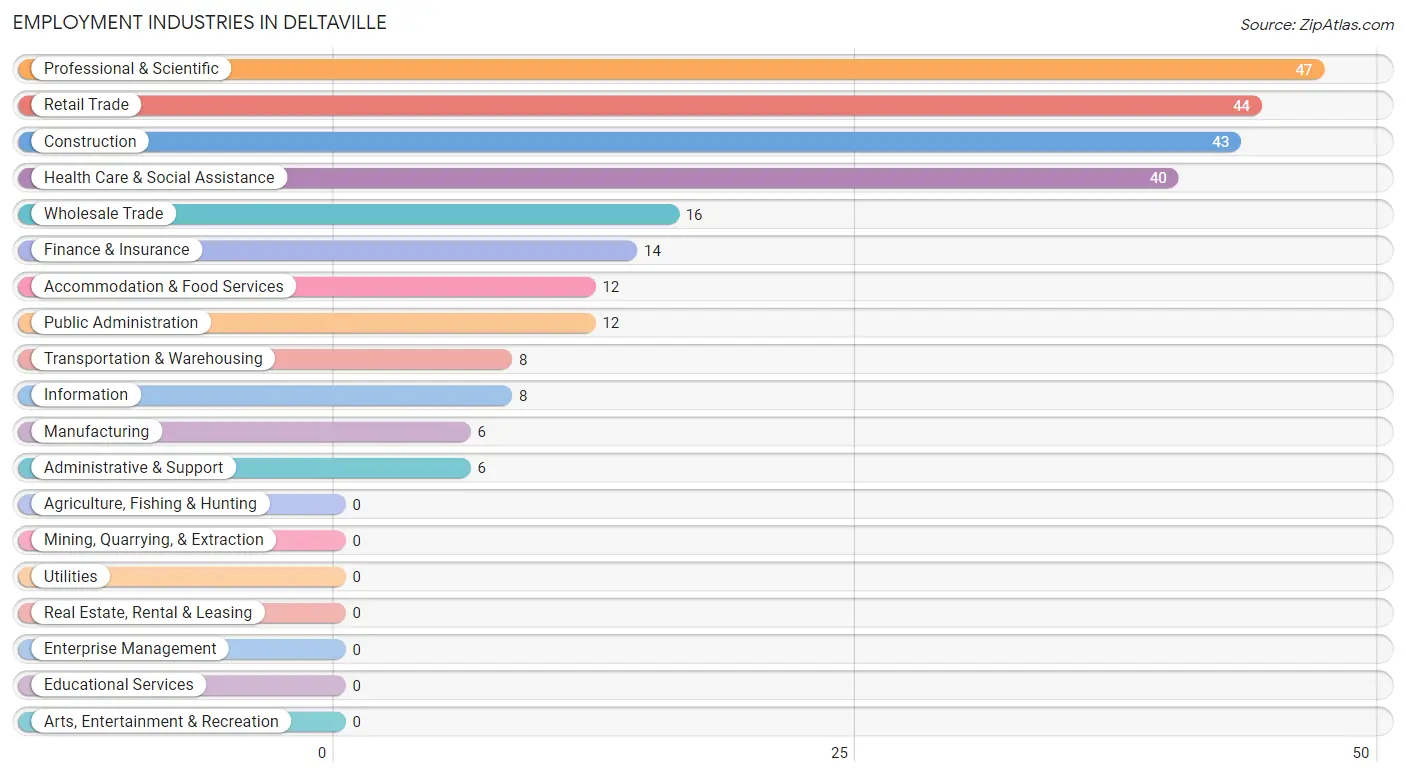
Employment Industries in Deltaville
The major employment industries in Deltaville include Professional & Scientific (47 | 16.2%), Retail Trade (44 | 15.1%), Construction (43 | 14.8%), Health Care & Social Assistance (40 | 13.8%), and Wholesale Trade (16 | 5.5%).
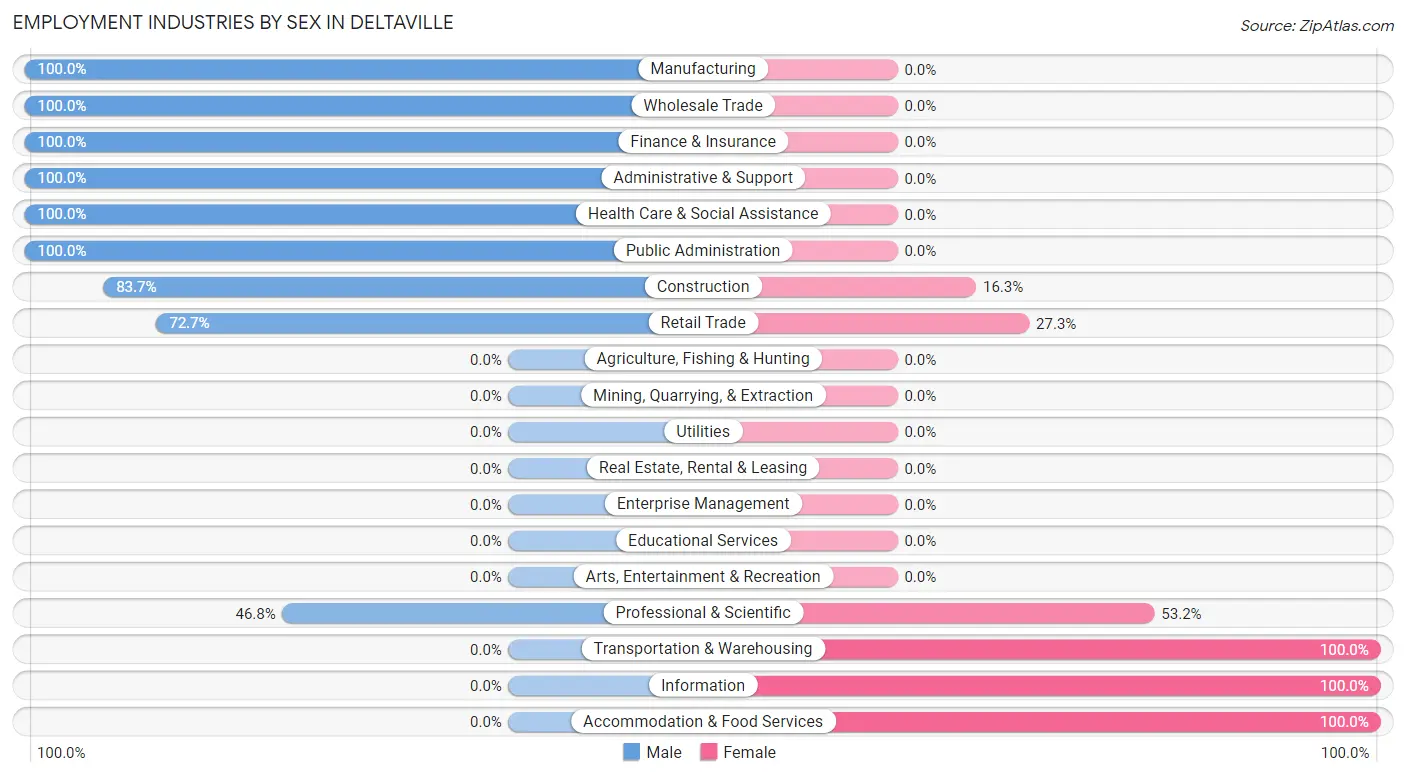
Employment Industries by Sex in Deltaville
The Deltaville industries that see more men than women are Manufacturing (100.0%), Wholesale Trade (100.0%), and Finance & Insurance (100.0%), whereas the industries that tend to have a higher number of women are Transportation & Warehousing (100.0%), Information (100.0%), and Accommodation & Food Services (100.0%).
| Industry | Male | Female |
| Agriculture, Fishing & Hunting | 0 (0.0%) | 0 (0.0%) |
| Mining, Quarrying, & Extraction | 0 (0.0%) | 0 (0.0%) |
| Construction | 36 (83.7%) | 7 (16.3%) |
| Manufacturing | 6 (100.0%) | 0 (0.0%) |
| Wholesale Trade | 16 (100.0%) | 0 (0.0%) |
| Retail Trade | 32 (72.7%) | 12 (27.3%) |
| Transportation & Warehousing | 0 (0.0%) | 8 (100.0%) |
| Utilities | 0 (0.0%) | 0 (0.0%) |
| Information | 0 (0.0%) | 8 (100.0%) |
| Finance & Insurance | 14 (100.0%) | 0 (0.0%) |
| Real Estate, Rental & Leasing | 0 (0.0%) | 0 (0.0%) |
| Professional & Scientific | 22 (46.8%) | 25 (53.2%) |
| Enterprise Management | 0 (0.0%) | 0 (0.0%) |
| Administrative & Support | 6 (100.0%) | 0 (0.0%) |
| Educational Services | 0 (0.0%) | 0 (0.0%) |
| Health Care & Social Assistance | 40 (100.0%) | 0 (0.0%) |
| Arts, Entertainment & Recreation | 0 (0.0%) | 0 (0.0%) |
| Accommodation & Food Services | 0 (0.0%) | 12 (100.0%) |
| Public Administration | 12 (100.0%) | 0 (0.0%) |
| Total | 184 (63.2%) | 107 (36.8%) |
Education in Deltaville
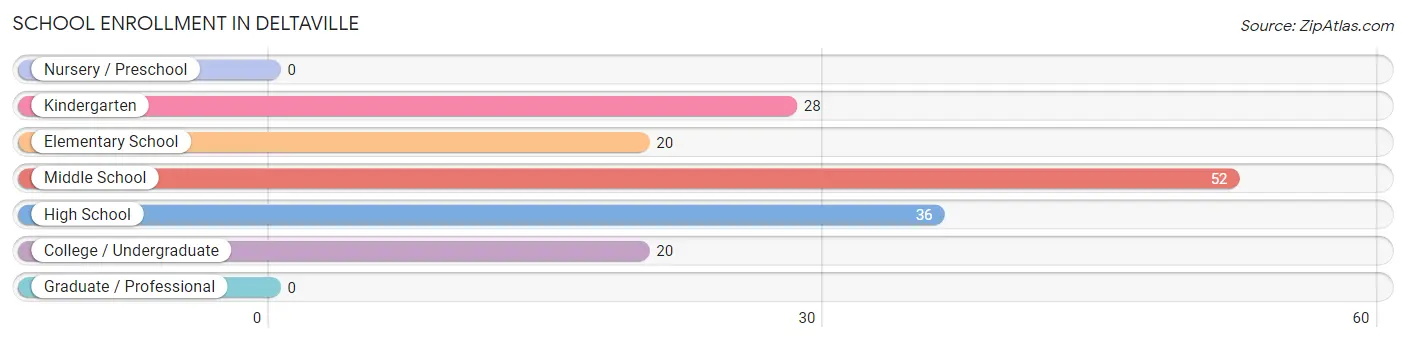
School Enrollment in Deltaville
The most common levels of schooling among the 156 students in Deltaville are middle school (52 | 33.3%), high school (36 | 23.1%), and kindergarten (28 | 17.9%).
| School Level | # Students | % Students |
| Nursery / Preschool | 0 | 0.0% |
| Kindergarten | 28 | 17.9% |
| Elementary School | 20 | 12.8% |
| Middle School | 52 | 33.3% |
| High School | 36 | 23.1% |
| College / Undergraduate | 20 | 12.8% |
| Graduate / Professional | 0 | 0.0% |
| Total | 156 | 100.0% |
School Enrollment by Age by Funding Source in Deltaville
Out of a total of 156 students who are enrolled in schools in Deltaville, 9 (5.8%) attend a private institution, while the remaining 147 (94.2%) are enrolled in public schools. The age group of 35 years and over has the highest likelihood of being enrolled in private schools, with 9 (100.0% in the age bracket) enrolled. Conversely, the age group of 5 to 9 year old has the lowest likelihood of being enrolled in a private school, with 48 (100.0% in the age bracket) attending a public institution.
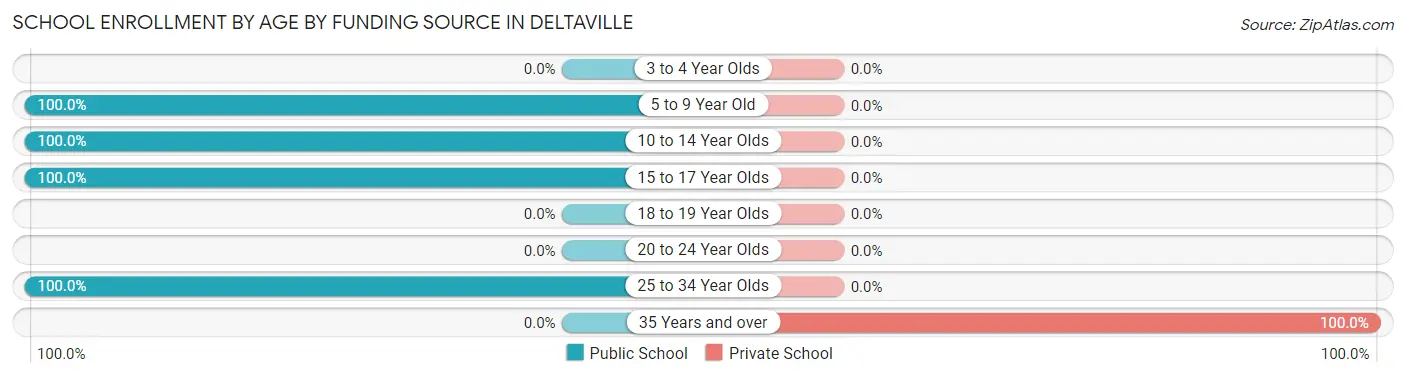
| Age Bracket | Public School | Private School |
| 3 to 4 Year Olds | 0 (0.0%) | 0 (0.0%) |
| 5 to 9 Year Old | 48 (100.0%) | 0 (0.0%) |
| 10 to 14 Year Olds | 66 (100.0%) | 0 (0.0%) |
| 15 to 17 Year Olds | 22 (100.0%) | 0 (0.0%) |
| 18 to 19 Year Olds | 0 (0.0%) | 0 (0.0%) |
| 20 to 24 Year Olds | 0 (0.0%) | 0 (0.0%) |
| 25 to 34 Year Olds | 11 (100.0%) | 0 (0.0%) |
| 35 Years and over | 0 (0.0%) | 9 (100.0%) |
| Total | 147 (94.2%) | 9 (5.8%) |
Educational Attainment by Field of Study in Deltaville
Science & technology (46 | 26.6%), social sciences (27 | 15.6%), physical & health sciences (20 | 11.6%), education (20 | 11.6%), and liberal arts & history (17 | 9.8%) are the most common fields of study among 173 individuals in Deltaville who have obtained a bachelor's degree or higher.
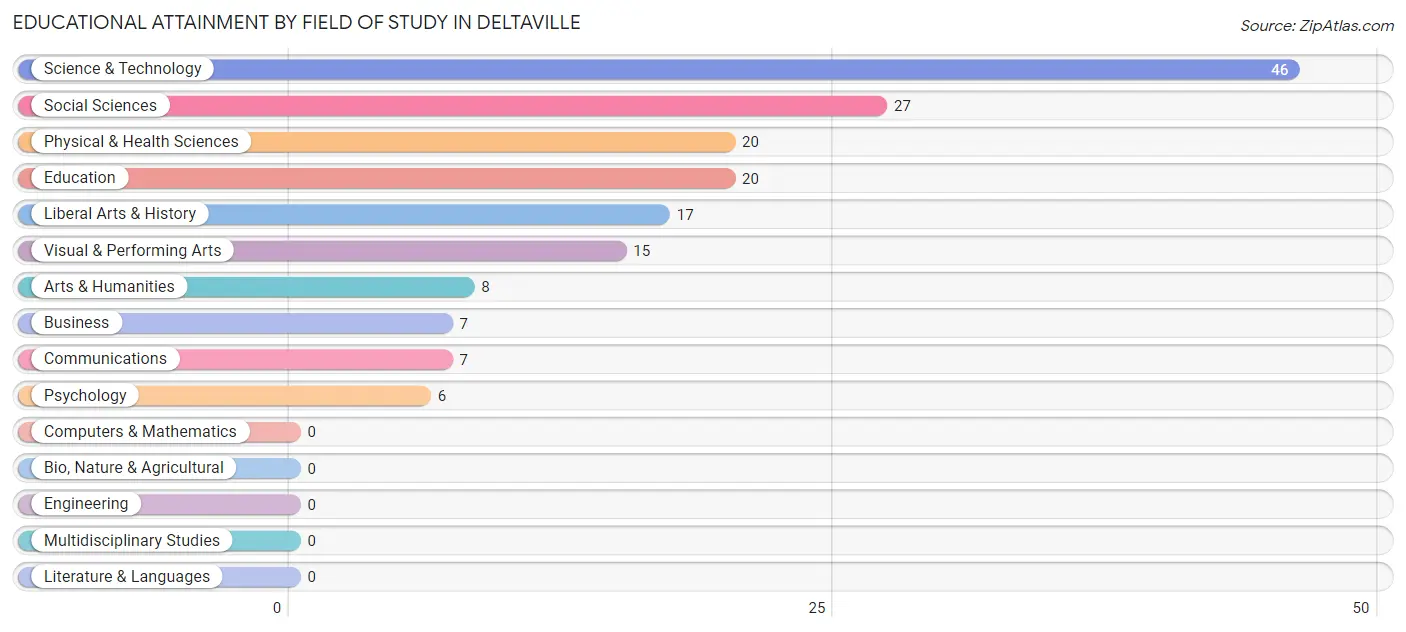
| Field of Study | # Graduates | % Graduates |
| Computers & Mathematics | 0 | 0.0% |
| Bio, Nature & Agricultural | 0 | 0.0% |
| Physical & Health Sciences | 20 | 11.6% |
| Psychology | 6 | 3.5% |
| Social Sciences | 27 | 15.6% |
| Engineering | 0 | 0.0% |
| Multidisciplinary Studies | 0 | 0.0% |
| Science & Technology | 46 | 26.6% |
| Business | 7 | 4.1% |
| Education | 20 | 11.6% |
| Literature & Languages | 0 | 0.0% |
| Liberal Arts & History | 17 | 9.8% |
| Visual & Performing Arts | 15 | 8.7% |
| Communications | 7 | 4.1% |
| Arts & Humanities | 8 | 4.6% |
| Total | 173 | 100.0% |
Transportation & Commute in Deltaville
Vehicle Availability by Sex in Deltaville
The most prevalent vehicle ownership categories in Deltaville are males with 2 vehicles (73, accounting for 41.2%) and females with 2 vehicles (32, making up 71.6%).
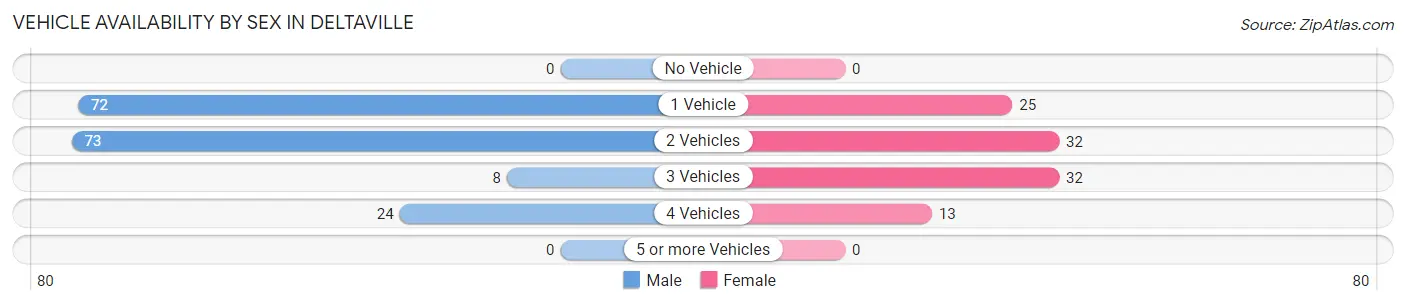
| Vehicles Available | Male | Female |
| No Vehicle | 0 (0.0%) | 0 (0.0%) |
| 1 Vehicle | 72 (40.7%) | 25 (24.5%) |
| 2 Vehicles | 73 (41.2%) | 32 (31.4%) |
| 3 Vehicles | 8 (4.5%) | 32 (31.4%) |
| 4 Vehicles | 24 (13.6%) | 13 (12.8%) |
| 5 or more Vehicles | 0 (0.0%) | 0 (0.0%) |
| Total | 177 (100.0%) | 102 (100.0%) |
Commute Time in Deltaville
The most frequently occuring commute durations in Deltaville are 15 to 19 minutes (32 commuters, 13.1%), 30 to 34 minutes (32 commuters, 13.1%), and 25 to 29 minutes (30 commuters, 12.2%).
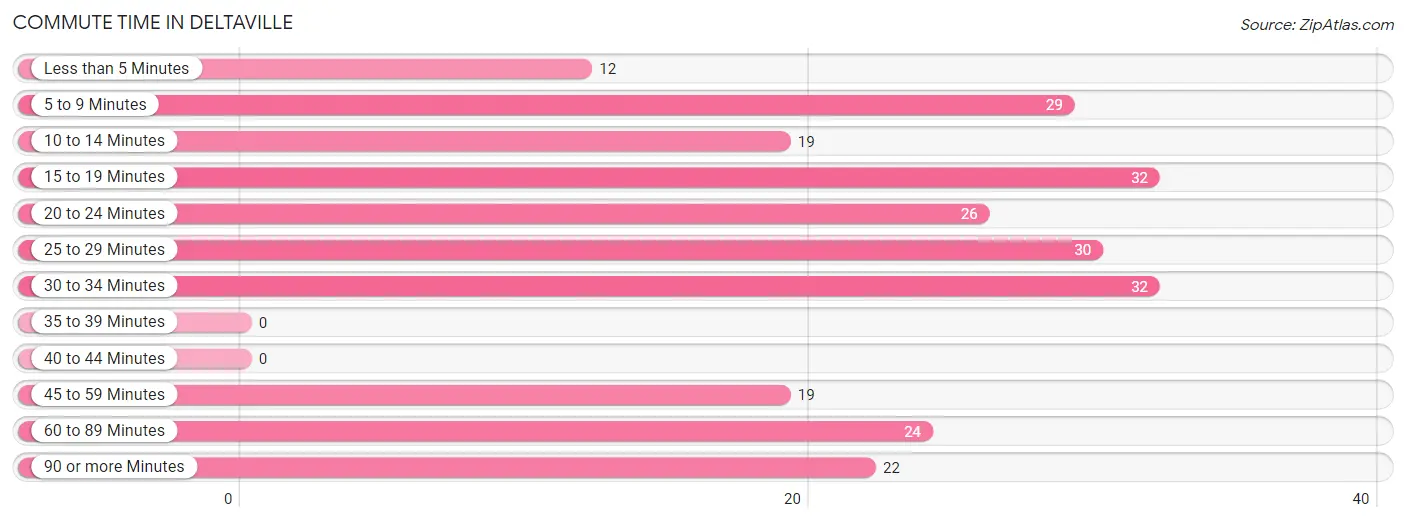
| Commute Time | # Commuters | % Commuters |
| Less than 5 Minutes | 12 | 4.9% |
| 5 to 9 Minutes | 29 | 11.8% |
| 10 to 14 Minutes | 19 | 7.8% |
| 15 to 19 Minutes | 32 | 13.1% |
| 20 to 24 Minutes | 26 | 10.6% |
| 25 to 29 Minutes | 30 | 12.2% |
| 30 to 34 Minutes | 32 | 13.1% |
| 35 to 39 Minutes | 0 | 0.0% |
| 40 to 44 Minutes | 0 | 0.0% |
| 45 to 59 Minutes | 19 | 7.8% |
| 60 to 89 Minutes | 24 | 9.8% |
| 90 or more Minutes | 22 | 9.0% |
Commute Time by Sex in Deltaville
The most common commute times in Deltaville are 25 to 29 minutes (30 commuters, 18.3%) for males and 10 to 14 minutes (19 commuters, 23.5%) for females.
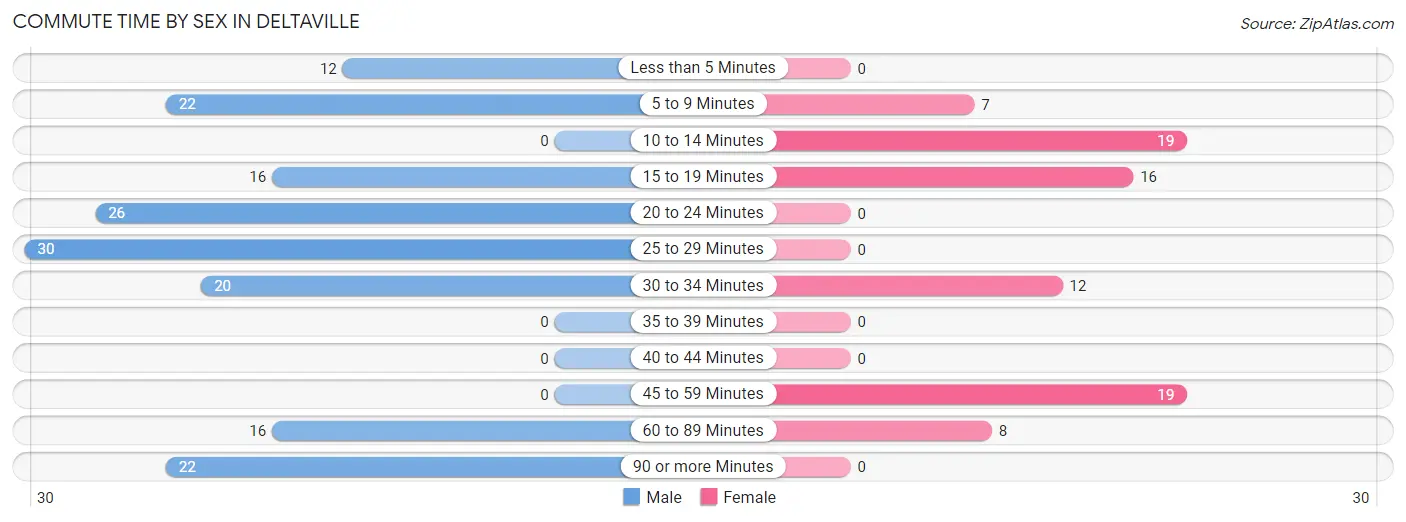
| Commute Time | Male | Female |
| Less than 5 Minutes | 12 (7.3%) | 0 (0.0%) |
| 5 to 9 Minutes | 22 (13.4%) | 7 (8.6%) |
| 10 to 14 Minutes | 0 (0.0%) | 19 (23.5%) |
| 15 to 19 Minutes | 16 (9.8%) | 16 (19.8%) |
| 20 to 24 Minutes | 26 (15.9%) | 0 (0.0%) |
| 25 to 29 Minutes | 30 (18.3%) | 0 (0.0%) |
| 30 to 34 Minutes | 20 (12.2%) | 12 (14.8%) |
| 35 to 39 Minutes | 0 (0.0%) | 0 (0.0%) |
| 40 to 44 Minutes | 0 (0.0%) | 0 (0.0%) |
| 45 to 59 Minutes | 0 (0.0%) | 19 (23.5%) |
| 60 to 89 Minutes | 16 (9.8%) | 8 (9.9%) |
| 90 or more Minutes | 22 (13.4%) | 0 (0.0%) |
Time of Departure to Work by Sex in Deltaville
The most frequent times of departure to work in Deltaville are 6:00 AM to 6:29 AM (60, 36.6%) for males and 9:00 AM to 9:59 AM (33, 40.7%) for females.
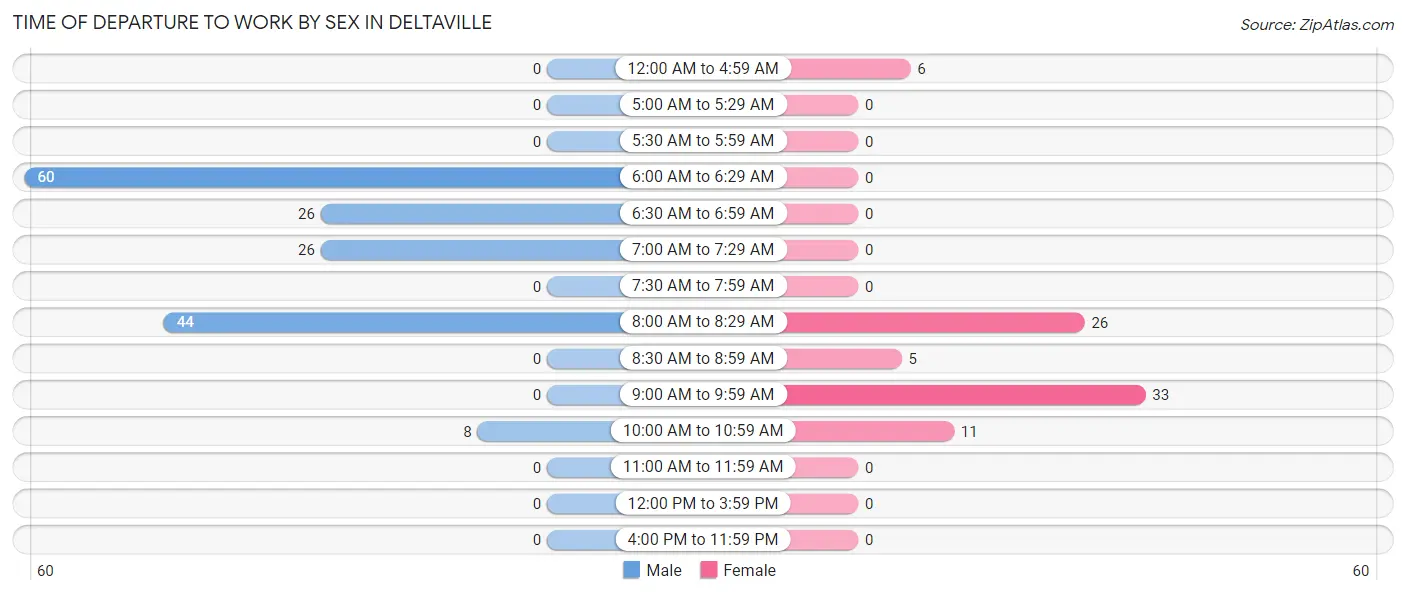
| Time of Departure | Male | Female |
| 12:00 AM to 4:59 AM | 0 (0.0%) | 6 (7.4%) |
| 5:00 AM to 5:29 AM | 0 (0.0%) | 0 (0.0%) |
| 5:30 AM to 5:59 AM | 0 (0.0%) | 0 (0.0%) |
| 6:00 AM to 6:29 AM | 60 (36.6%) | 0 (0.0%) |
| 6:30 AM to 6:59 AM | 26 (15.9%) | 0 (0.0%) |
| 7:00 AM to 7:29 AM | 26 (15.9%) | 0 (0.0%) |
| 7:30 AM to 7:59 AM | 0 (0.0%) | 0 (0.0%) |
| 8:00 AM to 8:29 AM | 44 (26.8%) | 26 (32.1%) |
| 8:30 AM to 8:59 AM | 0 (0.0%) | 5 (6.2%) |
| 9:00 AM to 9:59 AM | 0 (0.0%) | 33 (40.7%) |
| 10:00 AM to 10:59 AM | 8 (4.9%) | 11 (13.6%) |
| 11:00 AM to 11:59 AM | 0 (0.0%) | 0 (0.0%) |
| 12:00 PM to 3:59 PM | 0 (0.0%) | 0 (0.0%) |
| 4:00 PM to 11:59 PM | 0 (0.0%) | 0 (0.0%) |
| Total | 164 (100.0%) | 81 (100.0%) |
Housing Occupancy in Deltaville
Occupancy by Ownership in Deltaville
Of the total 394 dwellings in Deltaville, owner-occupied units account for 367 (93.1%), while renter-occupied units make up 27 (6.9%).
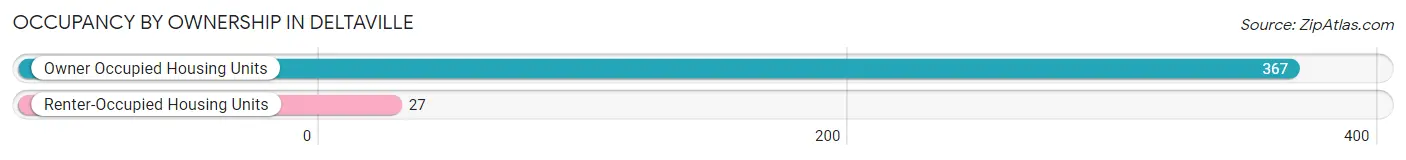
| Occupancy | # Housing Units | % Housing Units |
| Owner Occupied Housing Units | 367 | 93.1% |
| Renter-Occupied Housing Units | 27 | 6.9% |
| Total Occupied Housing Units | 394 | 100.0% |
Occupancy by Household Size in Deltaville
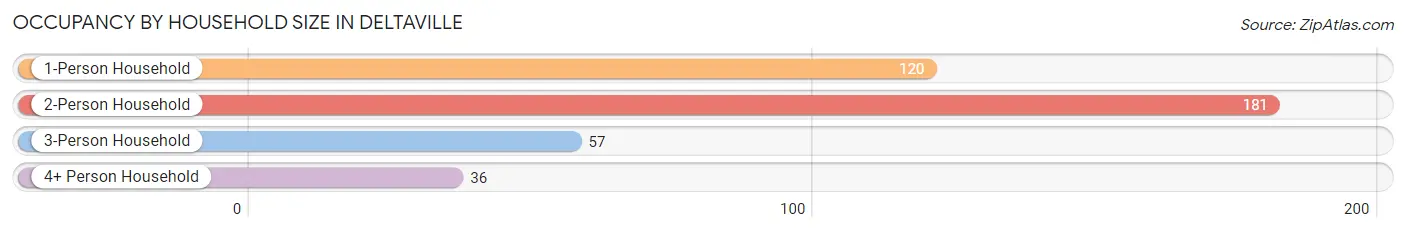
| Household Size | # Housing Units | % Housing Units |
| 1-Person Household | 120 | 30.5% |
| 2-Person Household | 181 | 45.9% |
| 3-Person Household | 57 | 14.5% |
| 4+ Person Household | 36 | 9.1% |
| Total Housing Units | 394 | 100.0% |
Occupancy by Ownership by Household Size in Deltaville
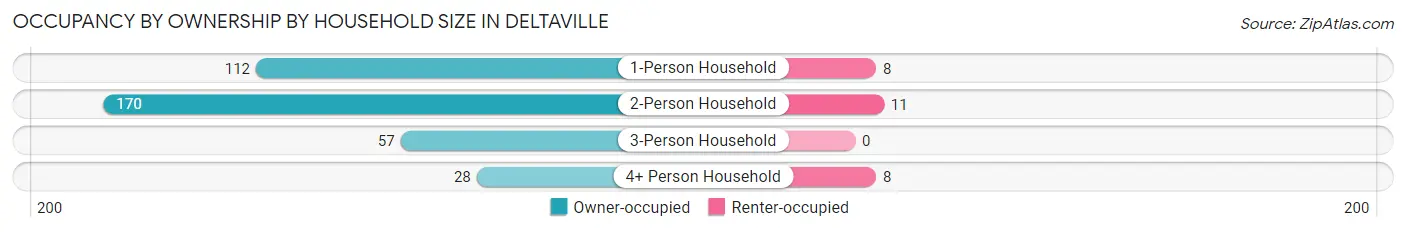
| Household Size | Owner-occupied | Renter-occupied |
| 1-Person Household | 112 (93.3%) | 8 (6.7%) |
| 2-Person Household | 170 (93.9%) | 11 (6.1%) |
| 3-Person Household | 57 (100.0%) | 0 (0.0%) |
| 4+ Person Household | 28 (77.8%) | 8 (22.2%) |
| Total Housing Units | 367 (93.1%) | 27 (6.9%) |
Occupancy by Educational Attainment in Deltaville
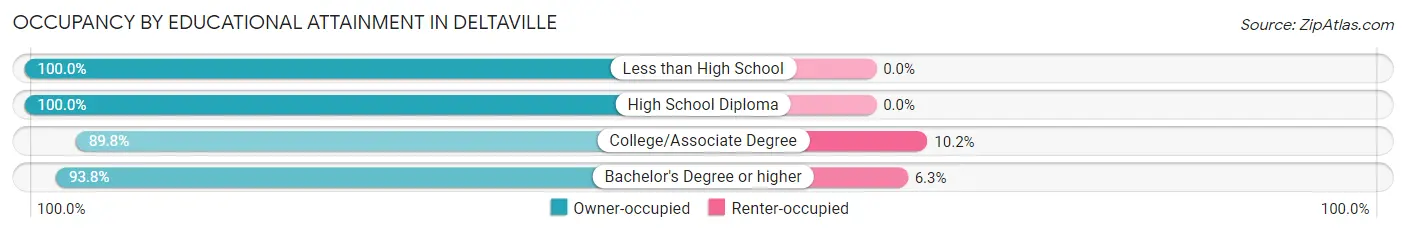
| Household Size | Owner-occupied | Renter-occupied |
| Less than High School | 21 (100.0%) | 0 (0.0%) |
| High School Diploma | 58 (100.0%) | 0 (0.0%) |
| College/Associate Degree | 168 (89.8%) | 19 (10.2%) |
| Bachelor's Degree or higher | 120 (93.8%) | 8 (6.2%) |
Occupancy by Age of Householder in Deltaville
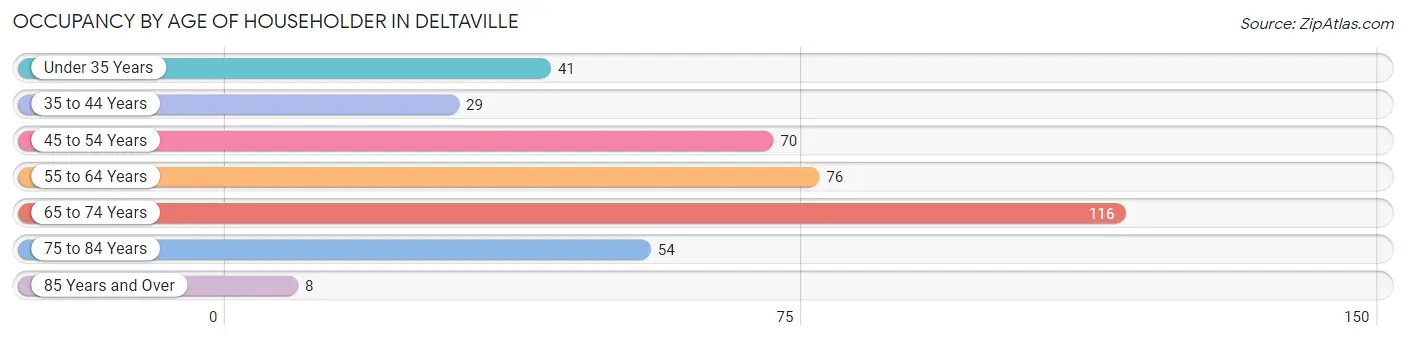
| Age Bracket | # Households | % Households |
| Under 35 Years | 41 | 10.4% |
| 35 to 44 Years | 29 | 7.4% |
| 45 to 54 Years | 70 | 17.8% |
| 55 to 64 Years | 76 | 19.3% |
| 65 to 74 Years | 116 | 29.4% |
| 75 to 84 Years | 54 | 13.7% |
| 85 Years and Over | 8 | 2.0% |
| Total | 394 | 100.0% |
Housing Finances in Deltaville
Median Income by Occupancy in Deltaville
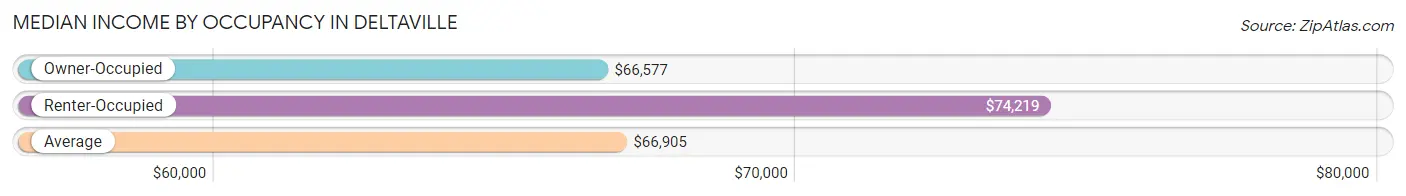
| Occupancy Type | # Households | Median Income |
| Owner-Occupied | 367 (93.1%) | $66,577 |
| Renter-Occupied | 27 (6.9%) | $74,219 |
| Average | 394 (100.0%) | $66,905 |
Occupancy by Householder Income Bracket in Deltaville
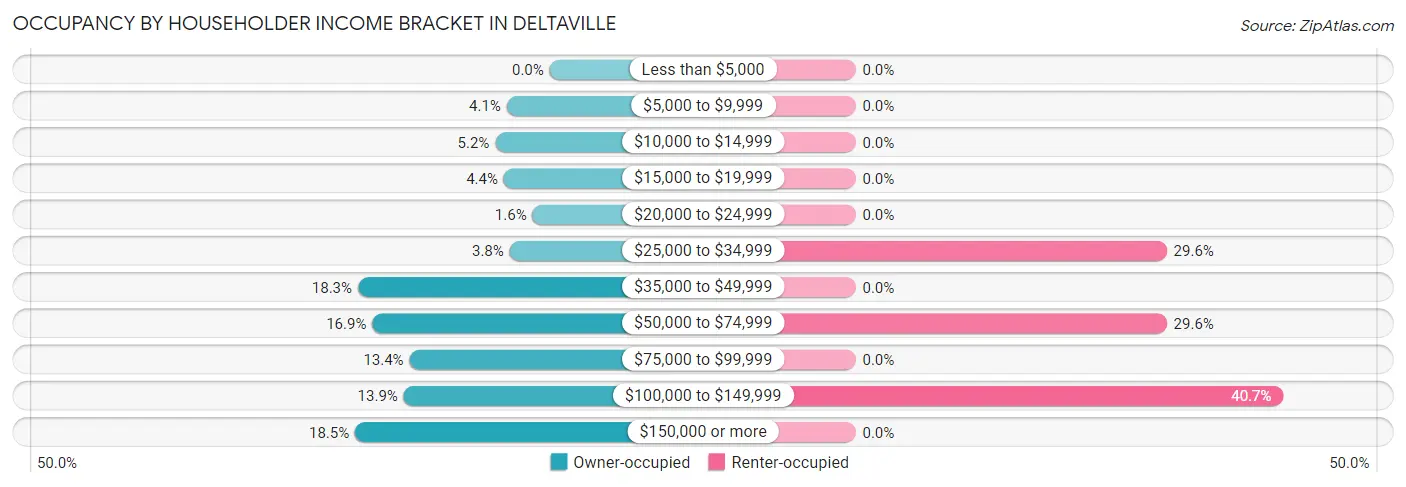
| Income Bracket | Owner-occupied | Renter-occupied |
| Less than $5,000 | 0 (0.0%) | 0 (0.0%) |
| $5,000 to $9,999 | 15 (4.1%) | 0 (0.0%) |
| $10,000 to $14,999 | 19 (5.2%) | 0 (0.0%) |
| $15,000 to $19,999 | 16 (4.4%) | 0 (0.0%) |
| $20,000 to $24,999 | 6 (1.6%) | 0 (0.0%) |
| $25,000 to $34,999 | 14 (3.8%) | 8 (29.6%) |
| $35,000 to $49,999 | 67 (18.3%) | 0 (0.0%) |
| $50,000 to $74,999 | 62 (16.9%) | 8 (29.6%) |
| $75,000 to $99,999 | 49 (13.4%) | 0 (0.0%) |
| $100,000 to $149,999 | 51 (13.9%) | 11 (40.7%) |
| $150,000 or more | 68 (18.5%) | 0 (0.0%) |
| Total | 367 (100.0%) | 27 (100.0%) |
Monthly Housing Cost Tiers in Deltaville
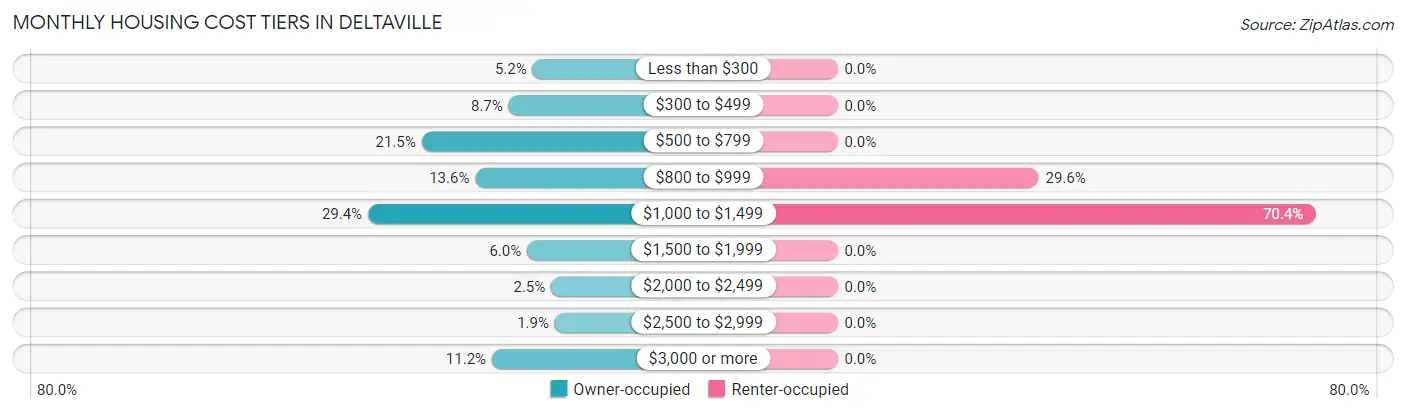
| Monthly Cost | Owner-occupied | Renter-occupied |
| Less than $300 | 19 (5.2%) | 0 (0.0%) |
| $300 to $499 | 32 (8.7%) | 0 (0.0%) |
| $500 to $799 | 79 (21.5%) | 0 (0.0%) |
| $800 to $999 | 50 (13.6%) | 8 (29.6%) |
| $1,000 to $1,499 | 108 (29.4%) | 19 (70.4%) |
| $1,500 to $1,999 | 22 (6.0%) | 0 (0.0%) |
| $2,000 to $2,499 | 9 (2.5%) | 0 (0.0%) |
| $2,500 to $2,999 | 7 (1.9%) | 0 (0.0%) |
| $3,000 or more | 41 (11.2%) | 0 (0.0%) |
| Total | 367 (100.0%) | 27 (100.0%) |
Physical Housing Characteristics in Deltaville
Housing Structures in Deltaville
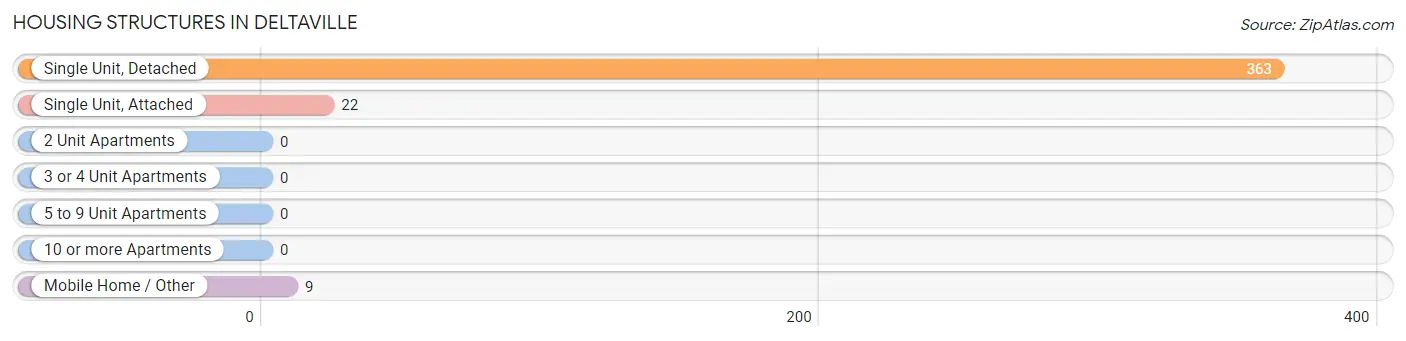
| Structure Type | # Housing Units | % Housing Units |
| Single Unit, Detached | 363 | 92.1% |
| Single Unit, Attached | 22 | 5.6% |
| 2 Unit Apartments | 0 | 0.0% |
| 3 or 4 Unit Apartments | 0 | 0.0% |
| 5 to 9 Unit Apartments | 0 | 0.0% |
| 10 or more Apartments | 0 | 0.0% |
| Mobile Home / Other | 9 | 2.3% |
| Total | 394 | 100.0% |
Housing Structures by Occupancy in Deltaville
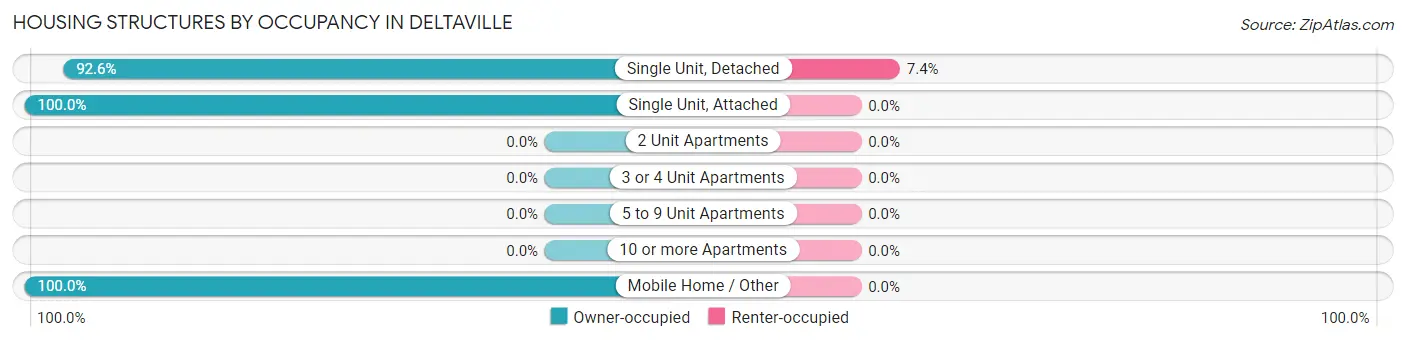
| Structure Type | Owner-occupied | Renter-occupied |
| Single Unit, Detached | 336 (92.6%) | 27 (7.4%) |
| Single Unit, Attached | 22 (100.0%) | 0 (0.0%) |
| 2 Unit Apartments | 0 (0.0%) | 0 (0.0%) |
| 3 or 4 Unit Apartments | 0 (0.0%) | 0 (0.0%) |
| 5 to 9 Unit Apartments | 0 (0.0%) | 0 (0.0%) |
| 10 or more Apartments | 0 (0.0%) | 0 (0.0%) |
| Mobile Home / Other | 9 (100.0%) | 0 (0.0%) |
| Total | 367 (93.1%) | 27 (6.9%) |
Housing Structures by Number of Rooms in Deltaville
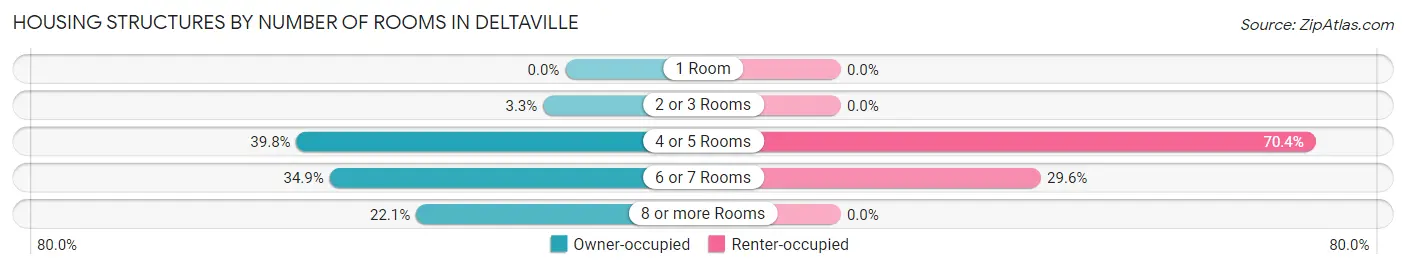
| Number of Rooms | Owner-occupied | Renter-occupied |
| 1 Room | 0 (0.0%) | 0 (0.0%) |
| 2 or 3 Rooms | 12 (3.3%) | 0 (0.0%) |
| 4 or 5 Rooms | 146 (39.8%) | 19 (70.4%) |
| 6 or 7 Rooms | 128 (34.9%) | 8 (29.6%) |
| 8 or more Rooms | 81 (22.1%) | 0 (0.0%) |
| Total | 367 (100.0%) | 27 (100.0%) |
Housing Structure by Heating Type in Deltaville
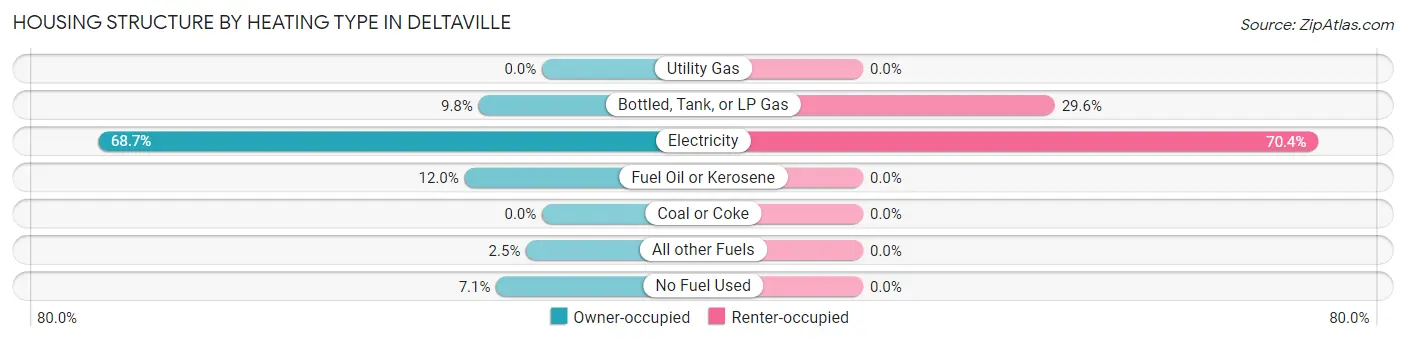
| Heating Type | Owner-occupied | Renter-occupied |
| Utility Gas | 0 (0.0%) | 0 (0.0%) |
| Bottled, Tank, or LP Gas | 36 (9.8%) | 8 (29.6%) |
| Electricity | 252 (68.7%) | 19 (70.4%) |
| Fuel Oil or Kerosene | 44 (12.0%) | 0 (0.0%) |
| Coal or Coke | 0 (0.0%) | 0 (0.0%) |
| All other Fuels | 9 (2.5%) | 0 (0.0%) |
| No Fuel Used | 26 (7.1%) | 0 (0.0%) |
| Total | 367 (100.0%) | 27 (100.0%) |
Household Vehicle Usage in Deltaville
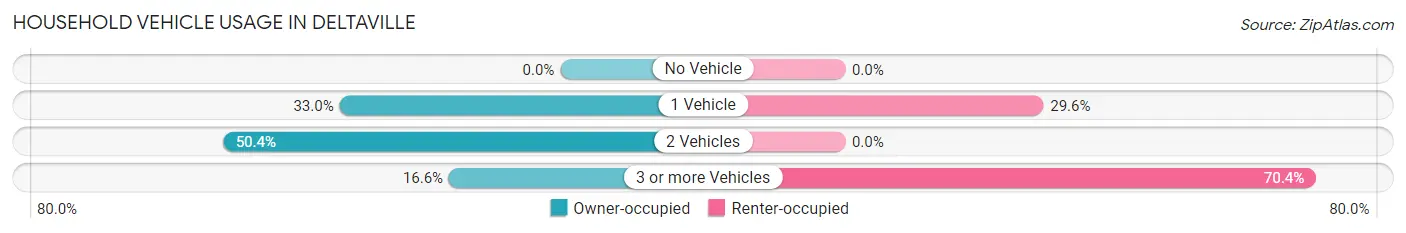
| Vehicles per Household | Owner-occupied | Renter-occupied |
| No Vehicle | 0 (0.0%) | 0 (0.0%) |
| 1 Vehicle | 121 (33.0%) | 8 (29.6%) |
| 2 Vehicles | 185 (50.4%) | 0 (0.0%) |
| 3 or more Vehicles | 61 (16.6%) | 19 (70.4%) |
| Total | 367 (100.0%) | 27 (100.0%) |
Real Estate & Mortgages in Deltaville
Real Estate and Mortgage Overview in Deltaville
| Characteristic | Without Mortgage | With Mortgage |
| Housing Units | 133 | 234 |
| Median Property Value | $315,000 | $261,800 |
| Median Household Income | $87,798 | $55 |
| Monthly Housing Costs | $529 | $41 |
| Real Estate Taxes | $1,769 | $0 |
Property Value by Mortgage Status in Deltaville
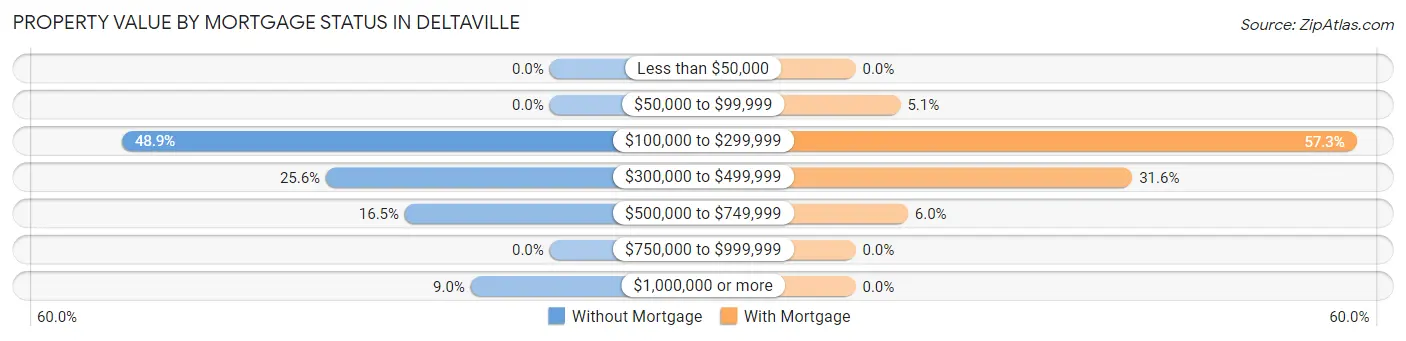
| Property Value | Without Mortgage | With Mortgage |
| Less than $50,000 | 0 (0.0%) | 0 (0.0%) |
| $50,000 to $99,999 | 0 (0.0%) | 12 (5.1%) |
| $100,000 to $299,999 | 65 (48.9%) | 134 (57.3%) |
| $300,000 to $499,999 | 34 (25.6%) | 74 (31.6%) |
| $500,000 to $749,999 | 22 (16.5%) | 14 (6.0%) |
| $750,000 to $999,999 | 0 (0.0%) | 0 (0.0%) |
| $1,000,000 or more | 12 (9.0%) | 0 (0.0%) |
| Total | 133 (100.0%) | 234 (100.0%) |
Household Income by Mortgage Status in Deltaville
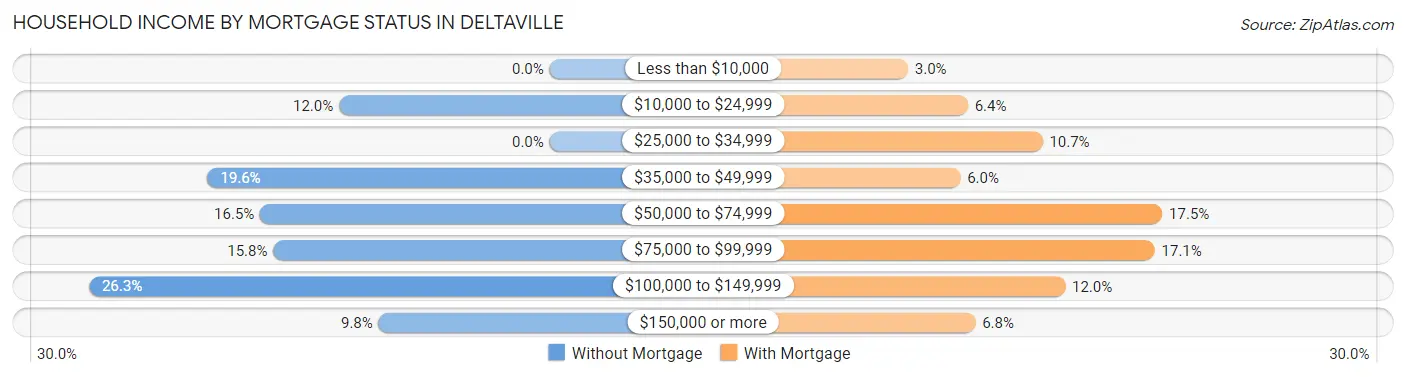
| Household Income | Without Mortgage | With Mortgage |
| Less than $10,000 | 0 (0.0%) | 7 (3.0%) |
| $10,000 to $24,999 | 16 (12.0%) | 15 (6.4%) |
| $25,000 to $34,999 | 0 (0.0%) | 25 (10.7%) |
| $35,000 to $49,999 | 26 (19.6%) | 14 (6.0%) |
| $50,000 to $74,999 | 22 (16.5%) | 41 (17.5%) |
| $75,000 to $99,999 | 21 (15.8%) | 40 (17.1%) |
| $100,000 to $149,999 | 35 (26.3%) | 28 (12.0%) |
| $150,000 or more | 13 (9.8%) | 16 (6.8%) |
| Total | 133 (100.0%) | 234 (100.0%) |
Property Value to Household Income Ratio in Deltaville
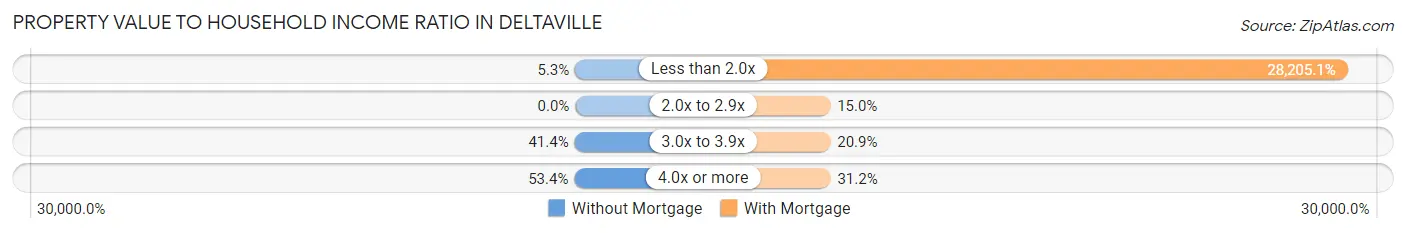
| Value-to-Income Ratio | Without Mortgage | With Mortgage |
| Less than 2.0x | 7 (5.3%) | 66,000 (28,205.1%) |
| 2.0x to 2.9x | 0 (0.0%) | 35 (15.0%) |
| 3.0x to 3.9x | 55 (41.3%) | 49 (20.9%) |
| 4.0x or more | 71 (53.4%) | 73 (31.2%) |
| Total | 133 (100.0%) | 234 (100.0%) |
Real Estate Taxes by Mortgage Status in Deltaville
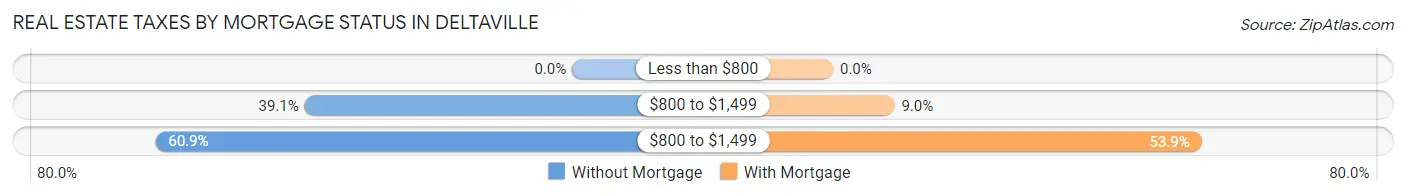
| Property Taxes | Without Mortgage | With Mortgage |
| Less than $800 | 0 (0.0%) | 0 (0.0%) |
| $800 to $1,499 | 52 (39.1%) | 21 (9.0%) |
| $800 to $1,499 | 81 (60.9%) | 126 (53.8%) |
| Total | 133 (100.0%) | 234 (100.0%) |
Health & Disability in Deltaville
Health Insurance Coverage by Age in Deltaville
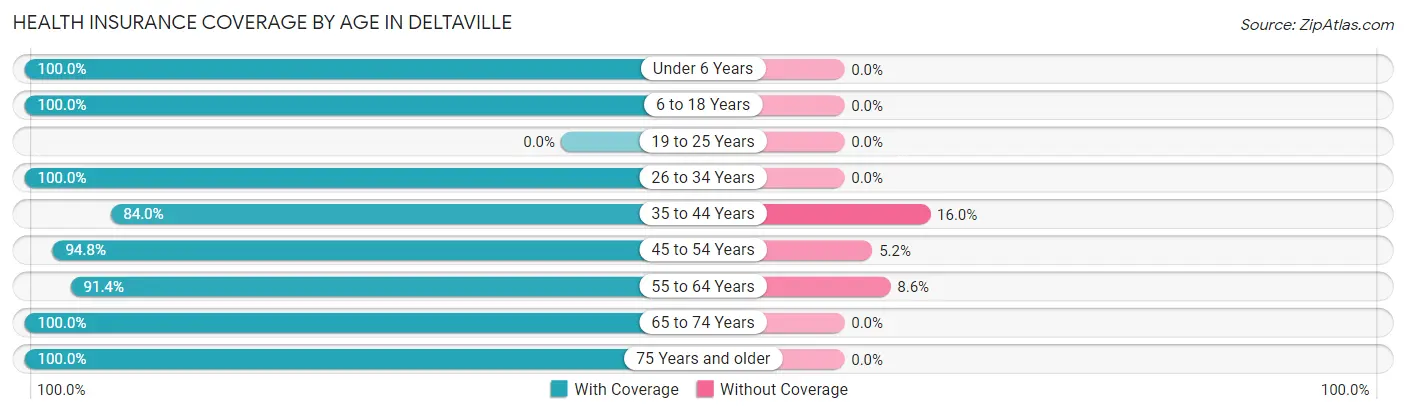
| Age Bracket | With Coverage | Without Coverage |
| Under 6 Years | 17 (100.0%) | 0 (0.0%) |
| 6 to 18 Years | 136 (100.0%) | 0 (0.0%) |
| 19 to 25 Years | 0 (0.0%) | 0 (0.0%) |
| 26 to 34 Years | 80 (100.0%) | 0 (0.0%) |
| 35 to 44 Years | 42 (84.0%) | 8 (16.0%) |
| 45 to 54 Years | 91 (94.8%) | 5 (5.2%) |
| 55 to 64 Years | 149 (91.4%) | 14 (8.6%) |
| 65 to 74 Years | 188 (100.0%) | 0 (0.0%) |
| 75 Years and older | 79 (100.0%) | 0 (0.0%) |
| Total | 782 (96.7%) | 27 (3.3%) |
Health Insurance Coverage by Citizenship Status in Deltaville
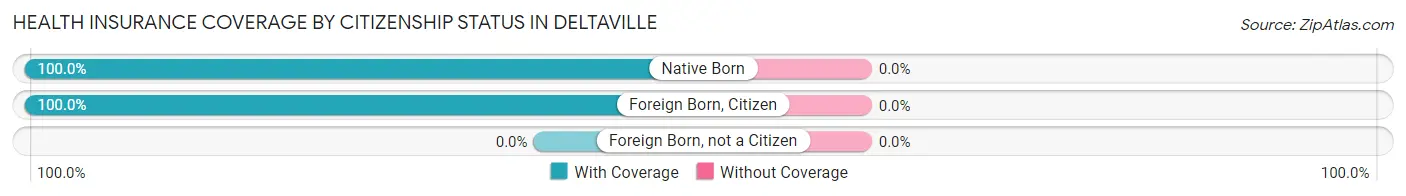
| Citizenship Status | With Coverage | Without Coverage |
| Native Born | 17 (100.0%) | 0 (0.0%) |
| Foreign Born, Citizen | 136 (100.0%) | 0 (0.0%) |
| Foreign Born, not a Citizen | 0 (0.0%) | 0 (0.0%) |
Health Insurance Coverage by Household Income in Deltaville
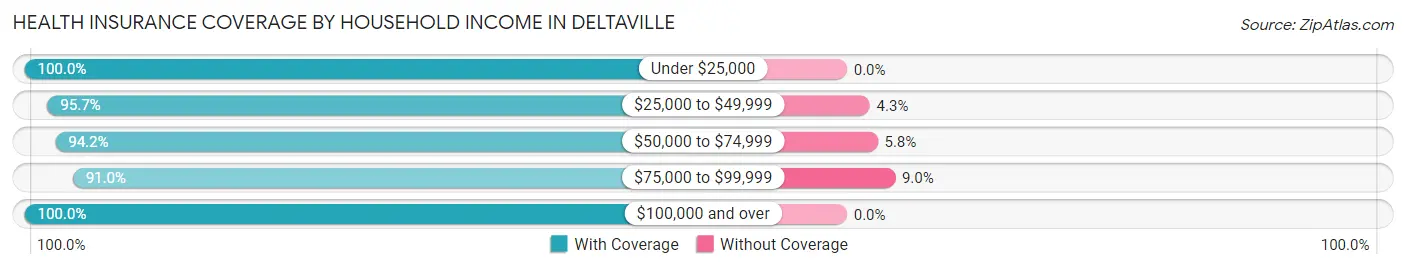
| Household Income | With Coverage | Without Coverage |
| Under $25,000 | 63 (100.0%) | 0 (0.0%) |
| $25,000 to $49,999 | 179 (95.7%) | 8 (4.3%) |
| $50,000 to $74,999 | 131 (94.2%) | 8 (5.8%) |
| $75,000 to $99,999 | 111 (91.0%) | 11 (9.0%) |
| $100,000 and over | 298 (100.0%) | 0 (0.0%) |
Public vs Private Health Insurance Coverage by Age in Deltaville
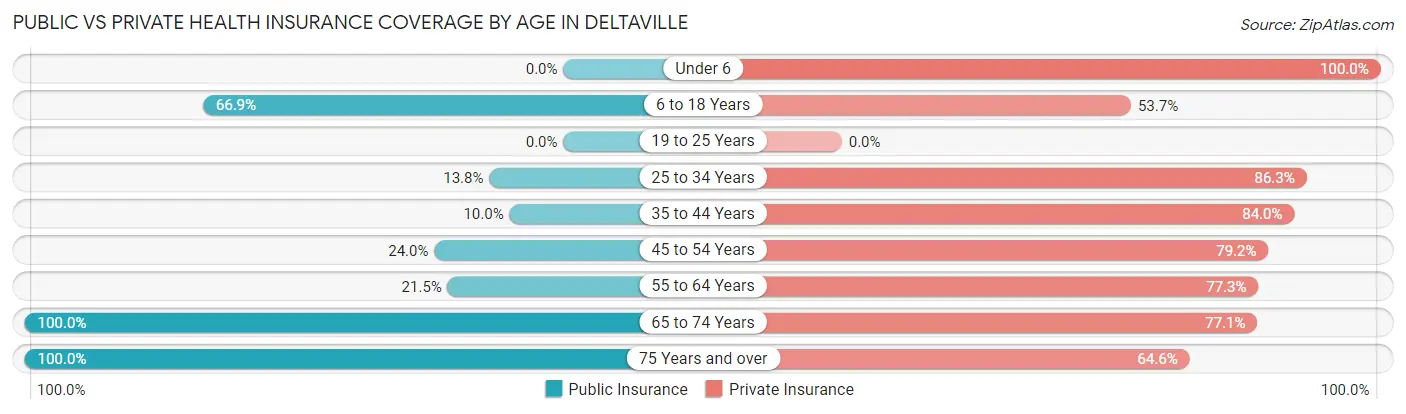
| Age Bracket | Public Insurance | Private Insurance |
| Under 6 | 0 (0.0%) | 17 (100.0%) |
| 6 to 18 Years | 91 (66.9%) | 73 (53.7%) |
| 19 to 25 Years | 0 (0.0%) | 0 (0.0%) |
| 25 to 34 Years | 11 (13.8%) | 69 (86.3%) |
| 35 to 44 Years | 5 (10.0%) | 42 (84.0%) |
| 45 to 54 Years | 23 (24.0%) | 76 (79.2%) |
| 55 to 64 Years | 35 (21.5%) | 126 (77.3%) |
| 65 to 74 Years | 188 (100.0%) | 145 (77.1%) |
| 75 Years and over | 79 (100.0%) | 51 (64.6%) |
| Total | 432 (53.4%) | 599 (74.0%) |
Disability Status by Sex by Age in Deltaville
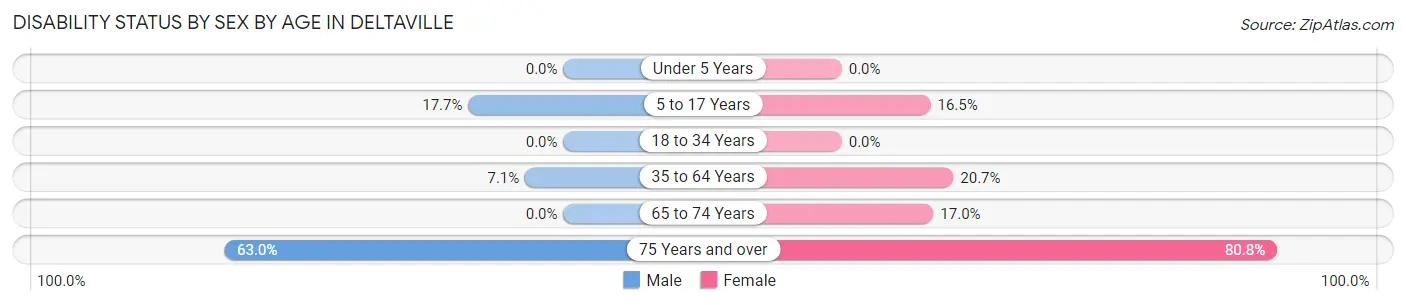
| Age Bracket | Male | Female |
| Under 5 Years | 0 (0.0%) | 0 (0.0%) |
| 5 to 17 Years | 9 (17.6%) | 14 (16.5%) |
| 18 to 34 Years | 0 (0.0%) | 0 (0.0%) |
| 35 to 64 Years | 12 (7.1%) | 29 (20.7%) |
| 65 to 74 Years | 0 (0.0%) | 17 (17.0%) |
| 75 Years and over | 17 (63.0%) | 42 (80.8%) |
Disability Class by Sex by Age in Deltaville
Disability Class: Hearing Difficulty
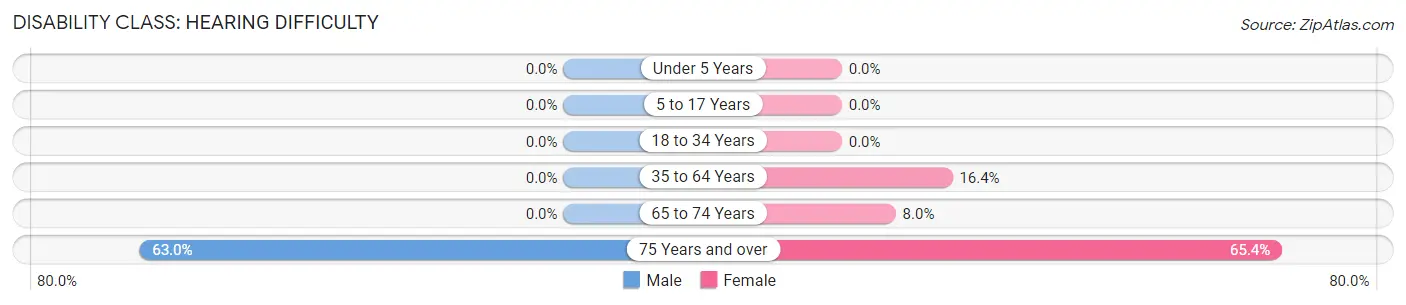
| Age Bracket | Male | Female |
| Under 5 Years | 0 (0.0%) | 0 (0.0%) |
| 5 to 17 Years | 0 (0.0%) | 0 (0.0%) |
| 18 to 34 Years | 0 (0.0%) | 0 (0.0%) |
| 35 to 64 Years | 0 (0.0%) | 23 (16.4%) |
| 65 to 74 Years | 0 (0.0%) | 8 (8.0%) |
| 75 Years and over | 17 (63.0%) | 34 (65.4%) |
Disability Class: Vision Difficulty
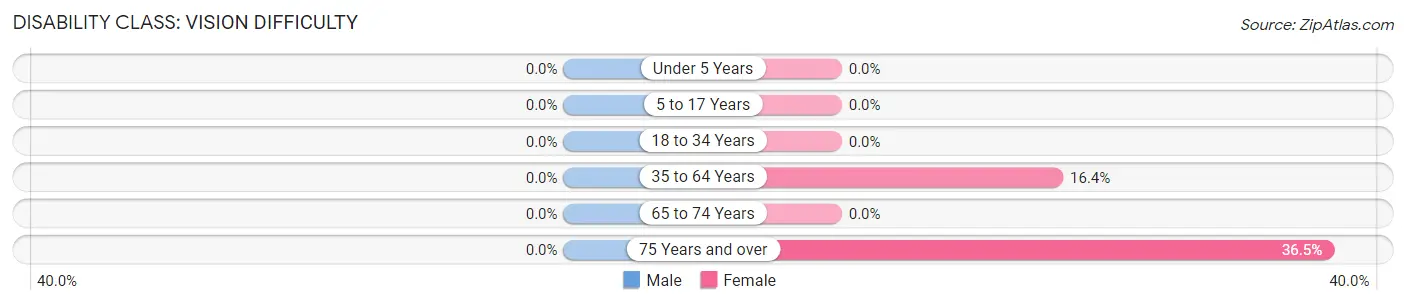
| Age Bracket | Male | Female |
| Under 5 Years | 0 (0.0%) | 0 (0.0%) |
| 5 to 17 Years | 0 (0.0%) | 0 (0.0%) |
| 18 to 34 Years | 0 (0.0%) | 0 (0.0%) |
| 35 to 64 Years | 0 (0.0%) | 23 (16.4%) |
| 65 to 74 Years | 0 (0.0%) | 0 (0.0%) |
| 75 Years and over | 0 (0.0%) | 19 (36.5%) |
Disability Class: Cognitive Difficulty
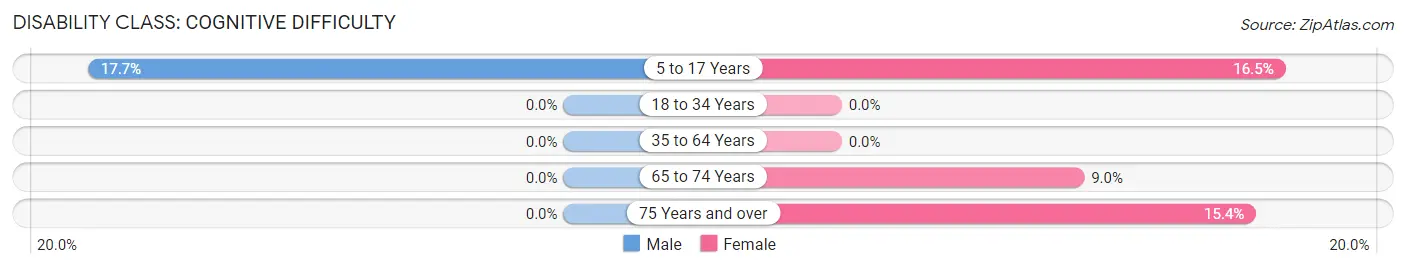
| Age Bracket | Male | Female |
| 5 to 17 Years | 9 (17.6%) | 14 (16.5%) |
| 18 to 34 Years | 0 (0.0%) | 0 (0.0%) |
| 35 to 64 Years | 0 (0.0%) | 0 (0.0%) |
| 65 to 74 Years | 0 (0.0%) | 9 (9.0%) |
| 75 Years and over | 0 (0.0%) | 8 (15.4%) |
Disability Class: Ambulatory Difficulty
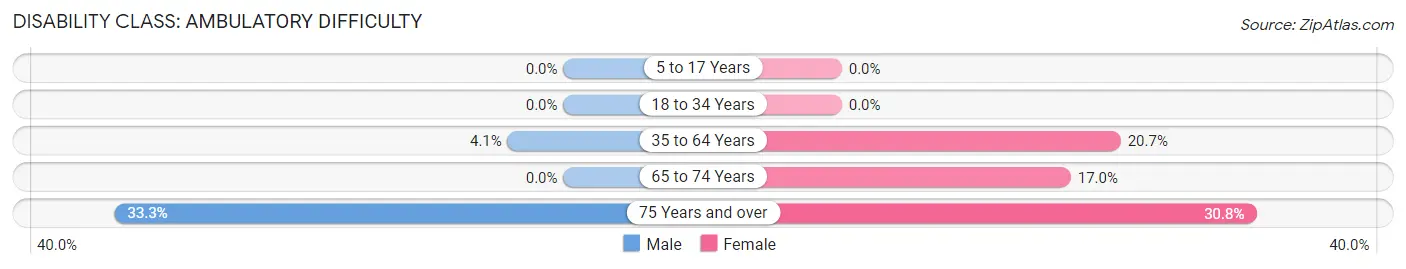
| Age Bracket | Male | Female |
| 5 to 17 Years | 0 (0.0%) | 0 (0.0%) |
| 18 to 34 Years | 0 (0.0%) | 0 (0.0%) |
| 35 to 64 Years | 7 (4.1%) | 29 (20.7%) |
| 65 to 74 Years | 0 (0.0%) | 17 (17.0%) |
| 75 Years and over | 9 (33.3%) | 16 (30.8%) |
Disability Class: Self-Care Difficulty
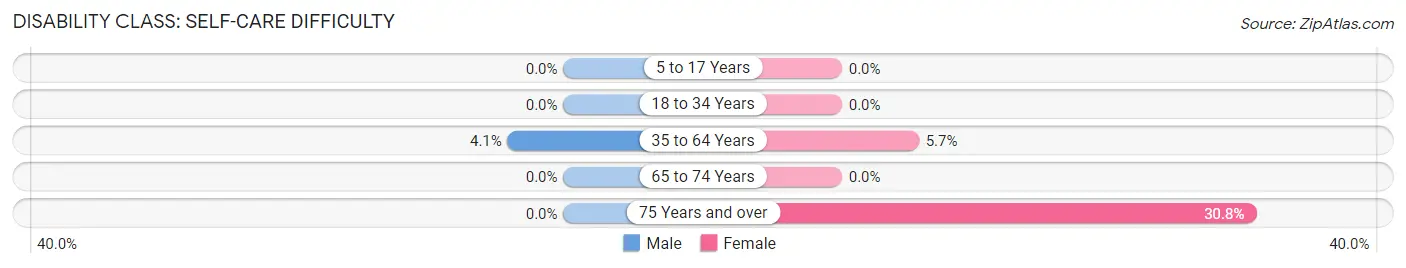
| Age Bracket | Male | Female |
| 5 to 17 Years | 0 (0.0%) | 0 (0.0%) |
| 18 to 34 Years | 0 (0.0%) | 0 (0.0%) |
| 35 to 64 Years | 7 (4.1%) | 8 (5.7%) |
| 65 to 74 Years | 0 (0.0%) | 0 (0.0%) |
| 75 Years and over | 0 (0.0%) | 16 (30.8%) |
Technology Access in Deltaville
Computing Device Access in Deltaville
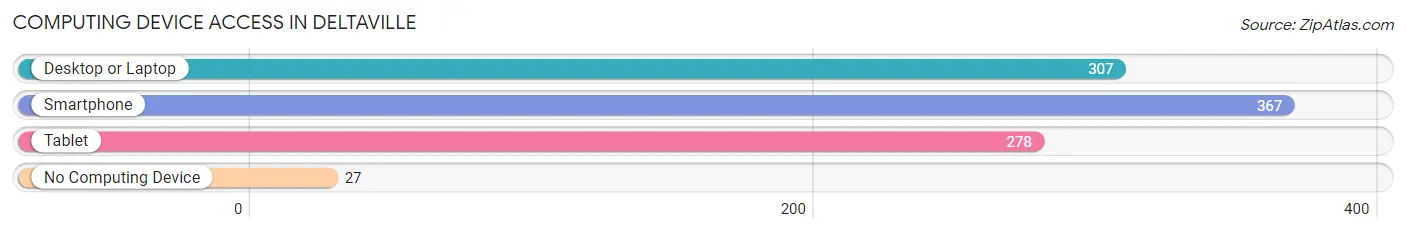
| Device Type | # Households | % Households |
| Desktop or Laptop | 307 | 77.9% |
| Smartphone | 367 | 93.1% |
| Tablet | 278 | 70.6% |
| No Computing Device | 27 | 6.9% |
| Total | 394 | 100.0% |
Internet Access in Deltaville
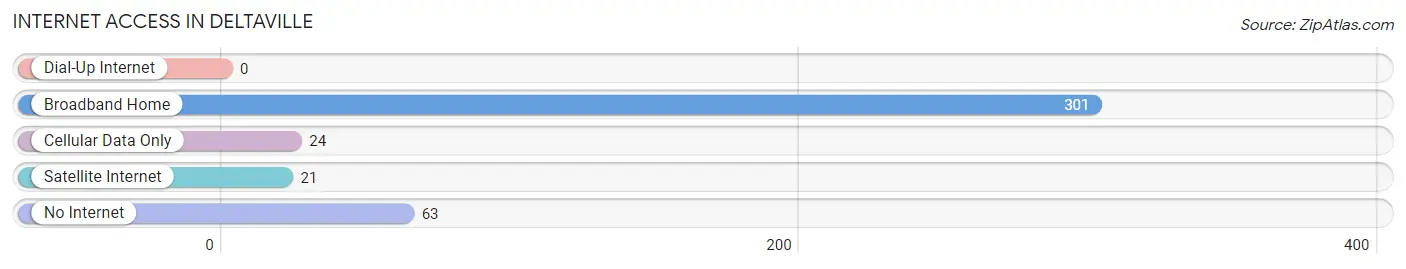
| Internet Type | # Households | % Households |
| Dial-Up Internet | 0 | 0.0% |
| Broadband Home | 301 | 76.4% |
| Cellular Data Only | 24 | 6.1% |
| Satellite Internet | 21 | 5.3% |
| No Internet | 63 | 16.0% |
| Total | 394 | 100.0% |
Deltaville Summary
Deltaville is a small unincorporated community located in Middlesex County, Virginia. It is situated on the western shore of the Chesapeake Bay, approximately halfway between the cities of Richmond and Norfolk. The town is known for its maritime heritage, and is home to a number of marinas, boatyards, and other businesses related to the boating industry.
History
The area that is now Deltaville was first settled in the early 1700s by English colonists. The town was originally known as “Deltaville Crossroads”, and was a small farming community. In the late 1800s, the town began to develop a reputation as a fishing and oystering center. In the early 1900s, the town began to attract recreational boaters, and the first marina was established in the 1920s.
In the 1950s, the town began to experience a period of rapid growth, as more and more people moved to the area to take advantage of the area’s natural beauty and recreational opportunities. This growth continued into the 1960s and 1970s, and the town was officially incorporated in 1975.
Geography
Deltaville is located in Middlesex County, Virginia, on the western shore of the Chesapeake Bay. The town is situated approximately halfway between the cities of Richmond and Norfolk. The town is bordered to the north by the Rappahannock River, to the east by the Piankatank River, and to the south by the Chesapeake Bay.
The town is located on a peninsula, and is surrounded by a number of small creeks and inlets. The town is also home to a number of small islands, including Gwynn’s Island, which is located just off the coast of Deltaville.
Economy
The economy of Deltaville is largely based on the town’s maritime heritage. The town is home to a number of marinas, boatyards, and other businesses related to the boating industry. The town is also home to a number of restaurants, shops, and other businesses catering to tourists and recreational boaters.
In addition to the boating industry, Deltaville is also home to a number of other businesses, including a number of seafood processing plants, a lumber mill, and a number of small manufacturing companies.
Demographics
As of the 2010 census, the population of Deltaville was 1,068. The town has a total area of 4.2 square miles, and a population density of 253.3 people per square mile. The median household income in Deltaville is $50,938, and the median age is 48.7 years.
The racial makeup of Deltaville is 94.2% White, 2.2% African American, 0.3% Native American, 0.7% Asian, 0.1% Pacific Islander, 0.7% from other races, and 1.8% from two or more races. The town is also home to a number of Hispanic and Latino residents, making up 2.2% of the population.
Conclusion
Deltaville is a small unincorporated community located in Middlesex County, Virginia. It is situated on the western shore of the Chesapeake Bay, and is known for its maritime heritage and recreational opportunities. The town’s economy is largely based on the boating industry, and the town is also home to a number of other businesses. As of the 2010 census, the population of Deltaville was 1,068, with a median household income of $50,938 and a median age of 48.7 years.
Common Questions
What is Per Capita Income in Deltaville?
Per Capita income in Deltaville is $42,755.
What is the Median Family Income in Deltaville?
Median Family Income in Deltaville is $87,946.
What is the Median Household income in Deltaville?
Median Household Income in Deltaville is $66,905.
What is Inequality or Gini Index in Deltaville?
Inequality or Gini Index in Deltaville is 0.41.
What is the Total Population of Deltaville?
Total Population of Deltaville is 809.
What is the Total Male Population of Deltaville?
Total Male Population of Deltaville is 373.
What is the Total Female Population of Deltaville?
Total Female Population of Deltaville is 436.
What is the Ratio of Males per 100 Females in Deltaville?
There are 85.55 Males per 100 Females in Deltaville.
What is the Ratio of Females per 100 Males in Deltaville?
There are 116.89 Females per 100 Males in Deltaville.
What is the Median Population Age in Deltaville?
Median Population Age in Deltaville is 58.1 Years.
What is the Average Family Size in Deltaville
Average Family Size in Deltaville is 2.5 People.
What is the Average Household Size in Deltaville
Average Household Size in Deltaville is 2.0 People.
How Large is the Labor Force in Deltaville?
There are 314 People in the Labor Forcein in Deltaville.
What is the Percentage of People in the Labor Force in Deltaville?
46.3% of People are in the Labor Force in Deltaville.
What is the Unemployment Rate in Deltaville?
Unemployment Rate in Deltaville is 7.3%.