Cumberland, VA Map & Demographics
Cumberland Map
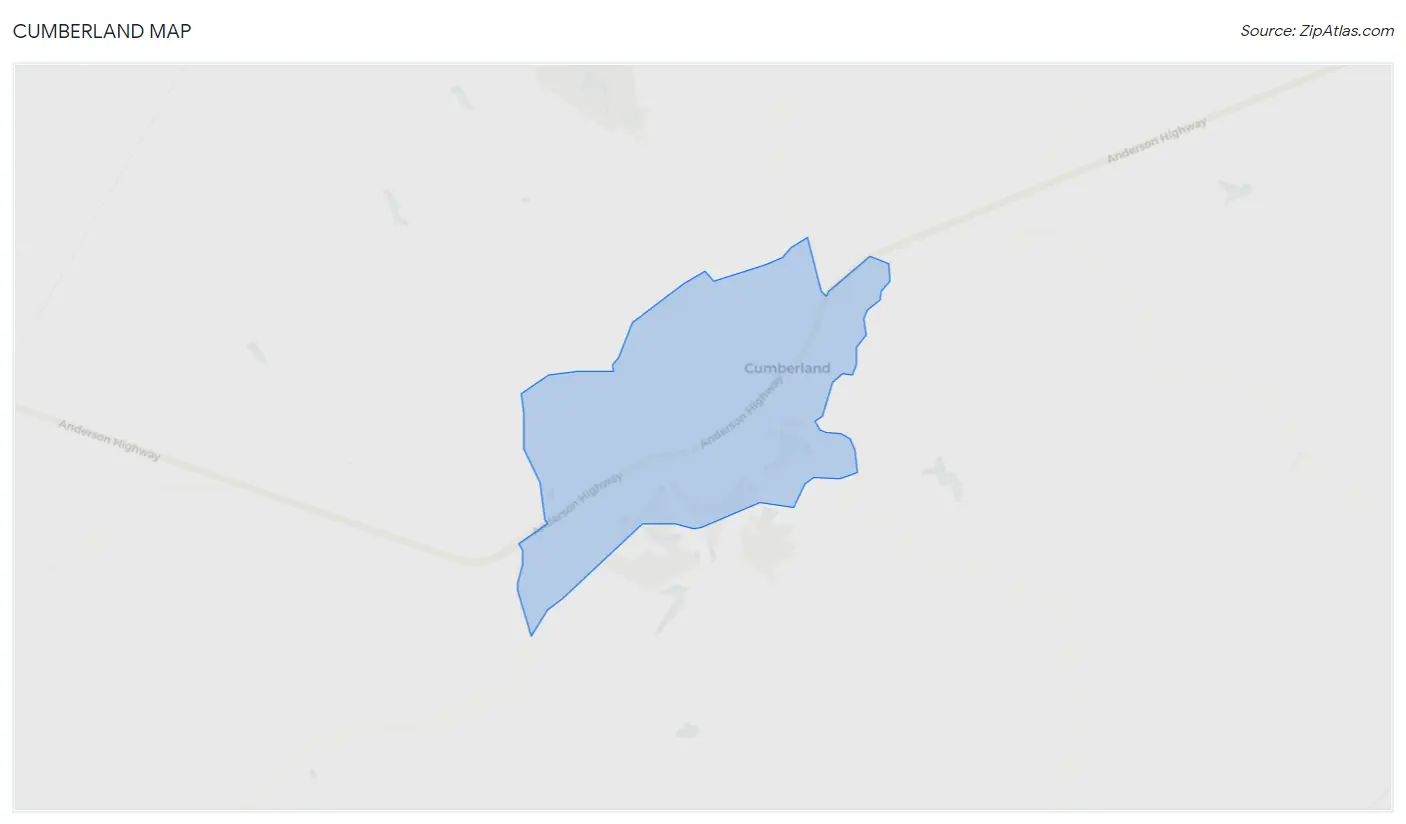
Cumberland Overview
$42,950
PER CAPITA INCOME
$104,444
AVG FAMILY INCOME
0.50
INEQUALITY / GINI INDEX
334
TOTAL POPULATION
218
MALE POPULATION
116
FEMALE POPULATION
187.93
MALES / 100 FEMALES
53.21
FEMALES / 100 MALES
66.5
MEDIAN AGE
2.8
AVG FAMILY SIZE
2.0
AVG HOUSEHOLD SIZE
168
LABOR FORCE [ PEOPLE ]
50.3%
PERCENT IN LABOR FORCE
8.9%
UNEMPLOYMENT RATE
Cumberland Zip Codes
Cumberland Area Codes
Income in Cumberland
Income Overview in Cumberland
| Characteristic | Number | Measure |
| Per Capita Income | 334 | $42,950 |
| Median Family Income | 94 | $104,444 |
| Mean Family Income | 94 | $105,214 |
| Median Household Income | 166 | $0 |
| Mean Household Income | 166 | $72,057 |
| Income Deficit | 94 | $0 |
| Wage / Income Gap (%) | 334 | 0.00% |
| Wage / Income Gap ($) | 334 | 100.00¢ per $1 |
| Gini / Inequality Index | 334 | 0.50 |
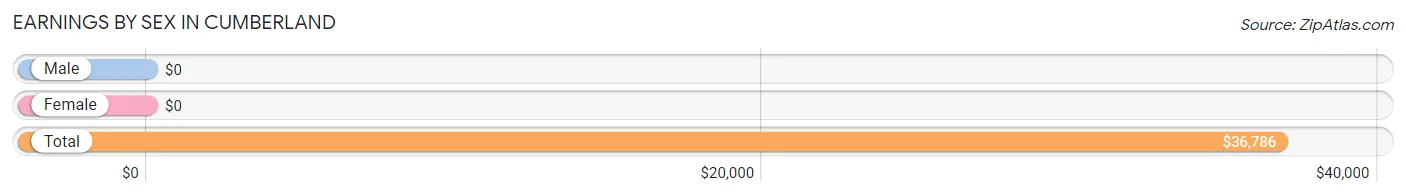
Earnings by Sex in Cumberland
| Sex | Number | Average Earnings |
| Male | 85 (48.8%) | $0 |
| Female | 89 (51.1%) | $0 |
| Total | 174 (100.0%) | $36,786 |
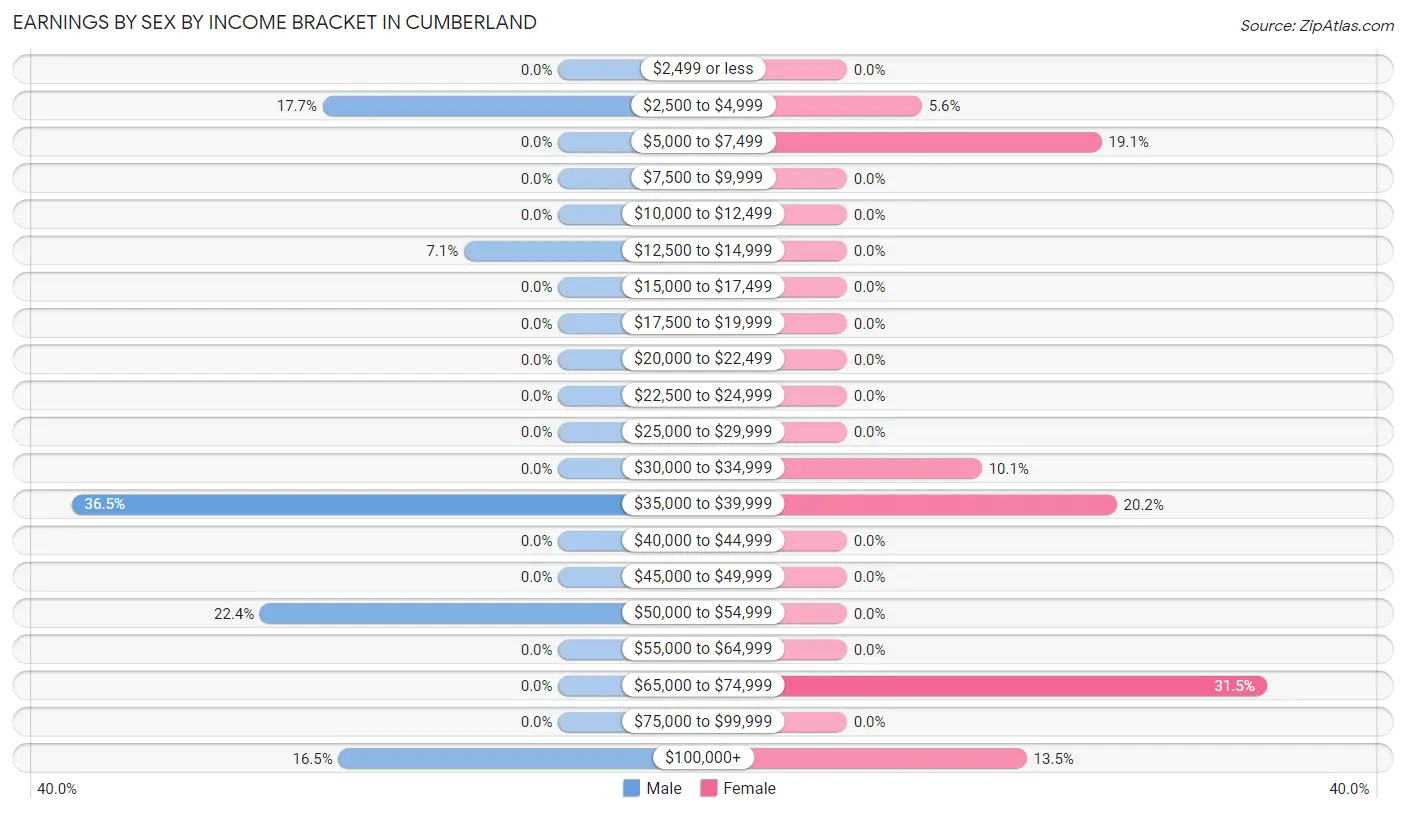
Earnings by Sex by Income Bracket in Cumberland
The most common earnings brackets in Cumberland are $35,000 to $39,999 for men (31 | 36.5%) and $65,000 to $74,999 for women (28 | 31.5%).
| Income | Male | Female |
| $2,499 or less | 0 (0.0%) | 0 (0.0%) |
| $2,500 to $4,999 | 15 (17.6%) | 5 (5.6%) |
| $5,000 to $7,499 | 0 (0.0%) | 17 (19.1%) |
| $7,500 to $9,999 | 0 (0.0%) | 0 (0.0%) |
| $10,000 to $12,499 | 0 (0.0%) | 0 (0.0%) |
| $12,500 to $14,999 | 6 (7.1%) | 0 (0.0%) |
| $15,000 to $17,499 | 0 (0.0%) | 0 (0.0%) |
| $17,500 to $19,999 | 0 (0.0%) | 0 (0.0%) |
| $20,000 to $22,499 | 0 (0.0%) | 0 (0.0%) |
| $22,500 to $24,999 | 0 (0.0%) | 0 (0.0%) |
| $25,000 to $29,999 | 0 (0.0%) | 0 (0.0%) |
| $30,000 to $34,999 | 0 (0.0%) | 9 (10.1%) |
| $35,000 to $39,999 | 31 (36.5%) | 18 (20.2%) |
| $40,000 to $44,999 | 0 (0.0%) | 0 (0.0%) |
| $45,000 to $49,999 | 0 (0.0%) | 0 (0.0%) |
| $50,000 to $54,999 | 19 (22.4%) | 0 (0.0%) |
| $55,000 to $64,999 | 0 (0.0%) | 0 (0.0%) |
| $65,000 to $74,999 | 0 (0.0%) | 28 (31.5%) |
| $75,000 to $99,999 | 0 (0.0%) | 0 (0.0%) |
| $100,000+ | 14 (16.5%) | 12 (13.5%) |
| Total | 85 (100.0%) | 89 (100.0%) |
Earnings by Sex by Educational Attainment in Cumberland
| Educational Attainment | Male Income | Female Income |
| Less than High School | - | - |
| High School Diploma | - | - |
| College or Associate's Degree | - | - |
| Bachelor's Degree | - | - |
| Graduate Degree | - | - |
| Total | - | - |
Family Income in Cumberland
Family Income Brackets in Cumberland
According to the Cumberland family income data, there are 47 families falling into the $100,000 to $149,999 income range, which is the most common income bracket and makes up 50.0% of all families.
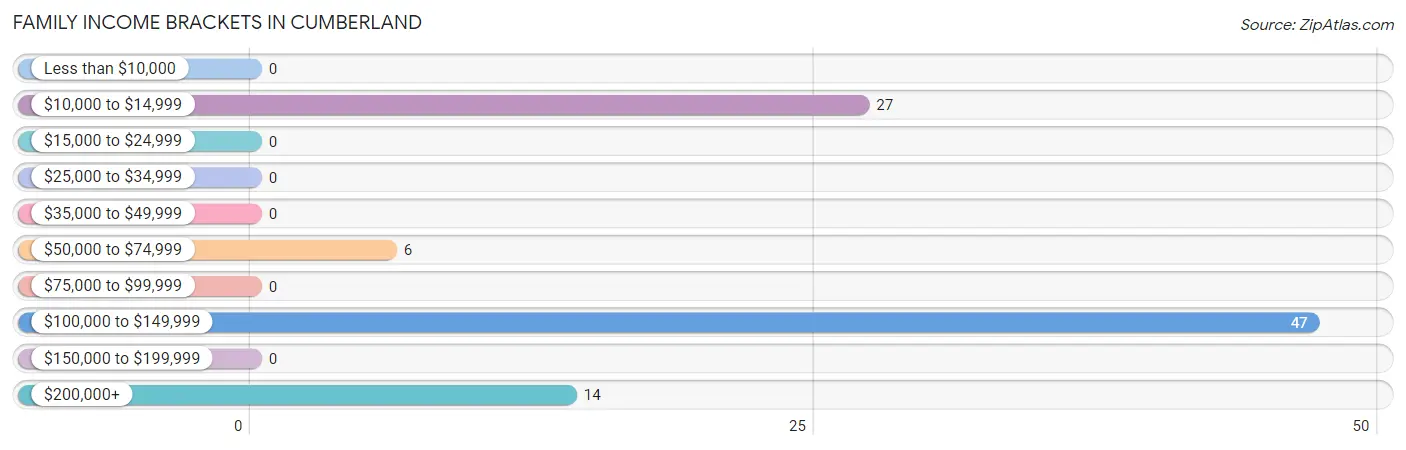
| Income Bracket | # Families | % Families |
| Less than $10,000 | 0 | 0.0% |
| $10,000 to $14,999 | 27 | 28.7% |
| $15,000 to $24,999 | 0 | 0.0% |
| $25,000 to $34,999 | 0 | 0.0% |
| $35,000 to $49,999 | 0 | 0.0% |
| $50,000 to $74,999 | 6 | 6.4% |
| $75,000 to $99,999 | 0 | 0.0% |
| $100,000 to $149,999 | 47 | 50.0% |
| $150,000 to $199,999 | 0 | 0.0% |
| $200,000+ | 14 | 14.9% |
Family Income by Famaliy Size in Cumberland
| Income Bracket | # Families | Median Income |
| 2-Person Families | 65 (69.2%) | $0 |
| 3-Person Families | 29 (30.8%) | $0 |
| 4-Person Families | 0 (0.0%) | $0 |
| 5-Person Families | 0 (0.0%) | $0 |
| 6-Person Families | 0 (0.0%) | $0 |
| 7+ Person Families | 0 (0.0%) | $0 |
| Total | 94 (100.0%) | $104,444 |
Family Income by Number of Earners in Cumberland
| Number of Earners | # Families | Median Income |
| No Earners | 27 (28.7%) | $0 |
| 1 Earner | 18 (19.2%) | $0 |
| 2 Earners | 37 (39.4%) | $0 |
| 3+ Earners | 12 (12.8%) | $0 |
| Total | 94 (100.0%) | $104,444 |
Household Income in Cumberland
Household Income Brackets in Cumberland
With 49 households falling in the category, the $10,000 to $14,999 income range is the most frequent in Cumberland, accounting for 29.5% of all households.
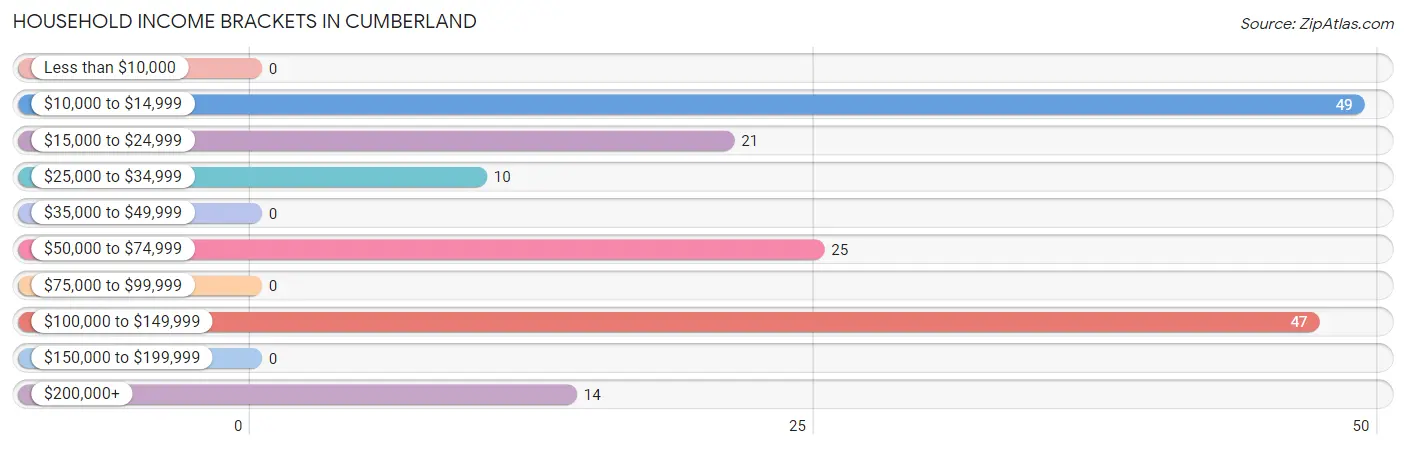
| Income Bracket | # Households | % Households |
| Less than $10,000 | 0 | 0.0% |
| $10,000 to $14,999 | 49 | 29.5% |
| $15,000 to $24,999 | 21 | 12.7% |
| $25,000 to $34,999 | 10 | 6.0% |
| $35,000 to $49,999 | 0 | 0.0% |
| $50,000 to $74,999 | 25 | 15.1% |
| $75,000 to $99,999 | 0 | 0.0% |
| $100,000 to $149,999 | 47 | 28.3% |
| $150,000 to $199,999 | 0 | 0.0% |
| $200,000+ | 14 | 8.4% |
Household Income by Householder Age in Cumberland
The median household income in Cumberland is $0, with the highest median household income of $103,194 found in the 45 to 64 years age bracket for the primary householder. A total of 60 households (36.1%) fall into this category.
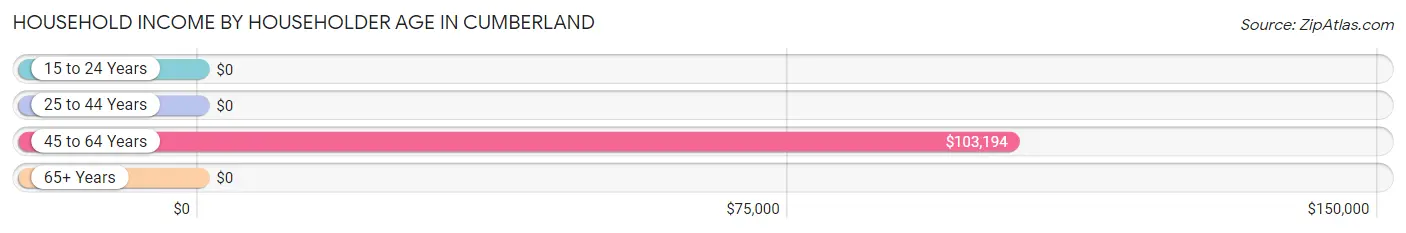
| Income Bracket | # Households | Median Income |
| 15 to 24 Years | 0 (0.0%) | $0 |
| 25 to 44 Years | 12 (7.2%) | $0 |
| 45 to 64 Years | 60 (36.1%) | $103,194 |
| 65+ Years | 94 (56.6%) | $0 |
| Total | 166 (100.0%) | $0 |
Poverty in Cumberland
Income Below Poverty by Sex and Age in Cumberland
With 18.8% poverty level for males and 23.3% for females among the residents of Cumberland, 65 to 74 year old males and 65 to 74 year old females are the most vulnerable to poverty, with 19 males (29.2%) and 27 females (100.0%) in their respective age groups living below the poverty level.
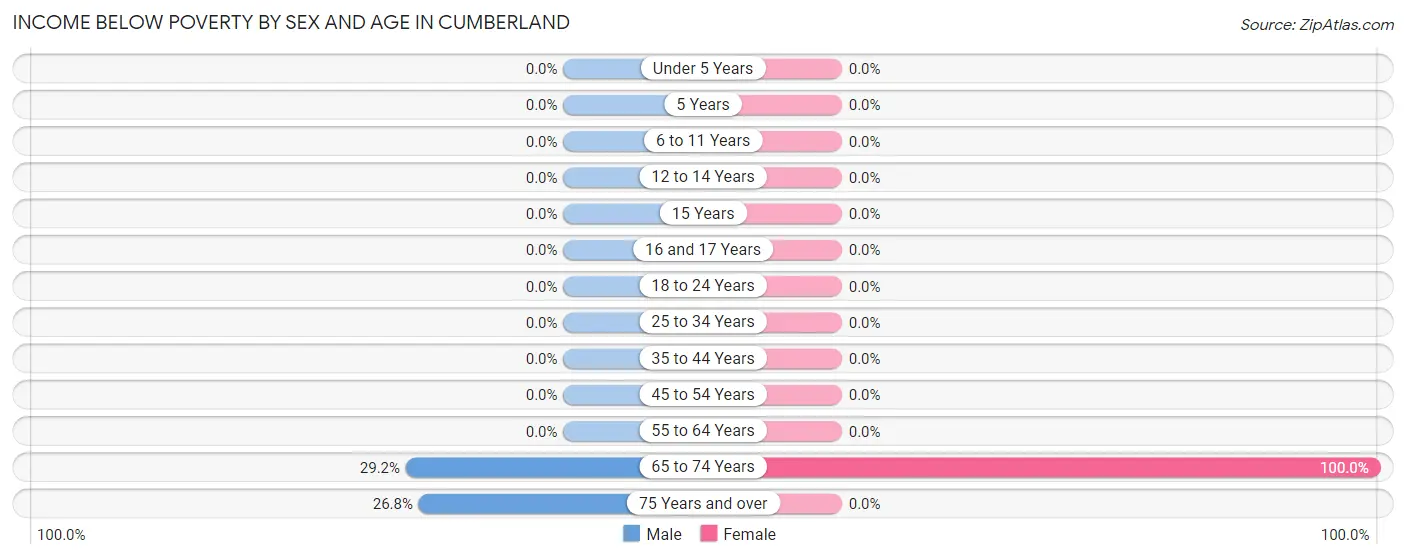
| Age Bracket | Male | Female |
| Under 5 Years | 0 (0.0%) | 0 (0.0%) |
| 5 Years | 0 (0.0%) | 0 (0.0%) |
| 6 to 11 Years | 0 (0.0%) | 0 (0.0%) |
| 12 to 14 Years | 0 (0.0%) | 0 (0.0%) |
| 15 Years | 0 (0.0%) | 0 (0.0%) |
| 16 and 17 Years | 0 (0.0%) | 0 (0.0%) |
| 18 to 24 Years | 0 (0.0%) | 0 (0.0%) |
| 25 to 34 Years | 0 (0.0%) | 0 (0.0%) |
| 35 to 44 Years | 0 (0.0%) | 0 (0.0%) |
| 45 to 54 Years | 0 (0.0%) | 0 (0.0%) |
| 55 to 64 Years | 0 (0.0%) | 0 (0.0%) |
| 65 to 74 Years | 19 (29.2%) | 27 (100.0%) |
| 75 Years and over | 22 (26.8%) | 0 (0.0%) |
| Total | 41 (18.8%) | 27 (23.3%) |
Income Above Poverty by Sex and Age in Cumberland
According to the poverty statistics in Cumberland, males aged 18 to 24 years and females aged 35 to 44 years are the age groups that are most secure financially, with 100.0% of males and 100.0% of females in these age groups living above the poverty line.
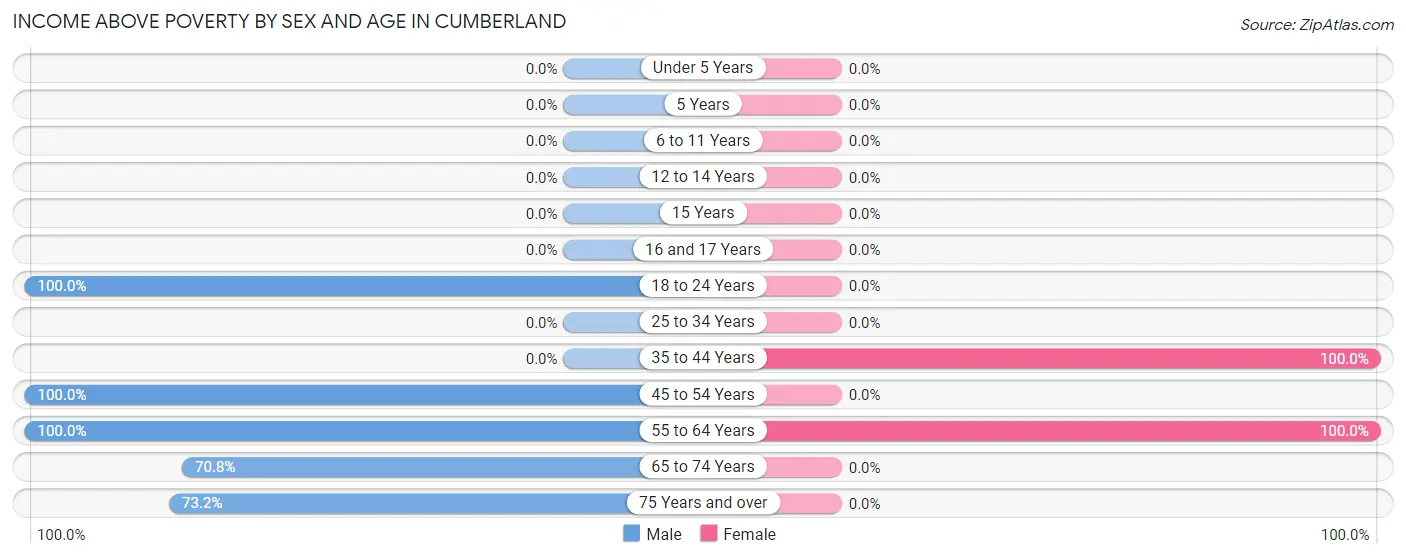
| Age Bracket | Male | Female |
| Under 5 Years | 0 (0.0%) | 0 (0.0%) |
| 5 Years | 0 (0.0%) | 0 (0.0%) |
| 6 to 11 Years | 0 (0.0%) | 0 (0.0%) |
| 12 to 14 Years | 0 (0.0%) | 0 (0.0%) |
| 15 Years | 0 (0.0%) | 0 (0.0%) |
| 16 and 17 Years | 0 (0.0%) | 0 (0.0%) |
| 18 to 24 Years | 15 (100.0%) | 0 (0.0%) |
| 25 to 34 Years | 0 (0.0%) | 0 (0.0%) |
| 35 to 44 Years | 0 (0.0%) | 40 (100.0%) |
| 45 to 54 Years | 50 (100.0%) | 0 (0.0%) |
| 55 to 64 Years | 6 (100.0%) | 49 (100.0%) |
| 65 to 74 Years | 46 (70.8%) | 0 (0.0%) |
| 75 Years and over | 60 (73.2%) | 0 (0.0%) |
| Total | 177 (81.2%) | 89 (76.7%) |
Income Below Poverty Among Married-Couple Families in Cumberland
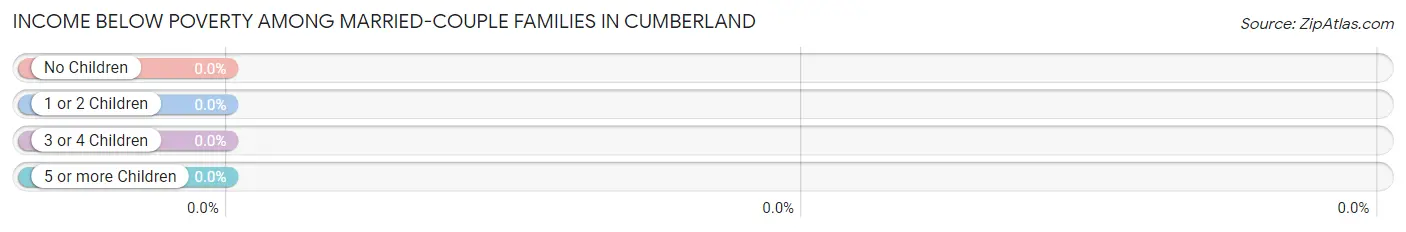
| Children | Above Poverty | Below Poverty |
| No Children | 67 (100.0%) | 0 (0.0%) |
| 1 or 2 Children | 0 (0.0%) | 0 (0.0%) |
| 3 or 4 Children | 0 (0.0%) | 0 (0.0%) |
| 5 or more Children | 0 (0.0%) | 0 (0.0%) |
| Total | 67 (100.0%) | 0 (0.0%) |
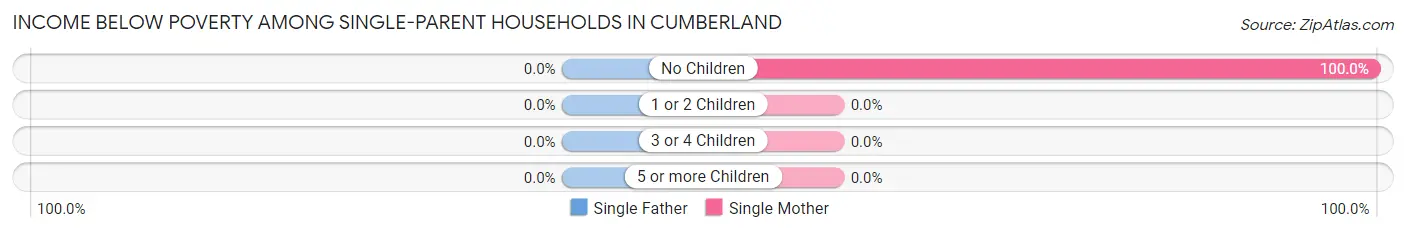
Income Below Poverty Among Single-Parent Households in Cumberland
| Children | Single Father | Single Mother |
| No Children | 0 (0.0%) | 27 (100.0%) |
| 1 or 2 Children | 0 (0.0%) | 0 (0.0%) |
| 3 or 4 Children | 0 (0.0%) | 0 (0.0%) |
| 5 or more Children | 0 (0.0%) | 0 (0.0%) |
| Total | 0 (0.0%) | 27 (100.0%) |
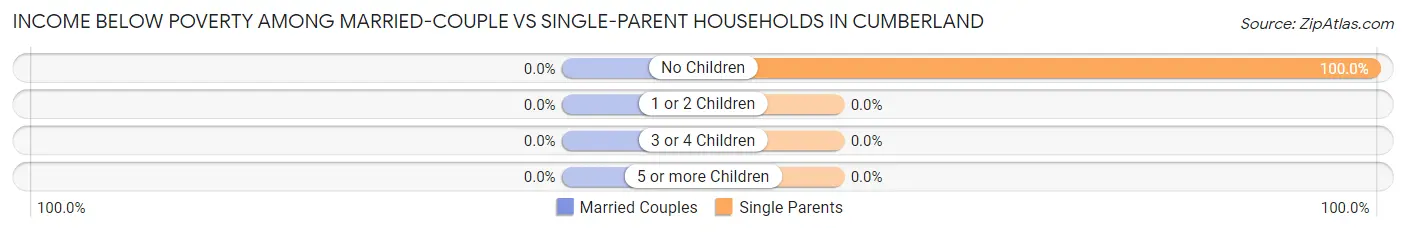
Income Below Poverty Among Married-Couple vs Single-Parent Households in Cumberland
| Children | Married-Couple Families | Single-Parent Households |
| No Children | 0 (0.0%) | 27 (100.0%) |
| 1 or 2 Children | 0 (0.0%) | 0 (0.0%) |
| 3 or 4 Children | 0 (0.0%) | 0 (0.0%) |
| 5 or more Children | 0 (0.0%) | 0 (0.0%) |
| Total | 0 (0.0%) | 27 (100.0%) |
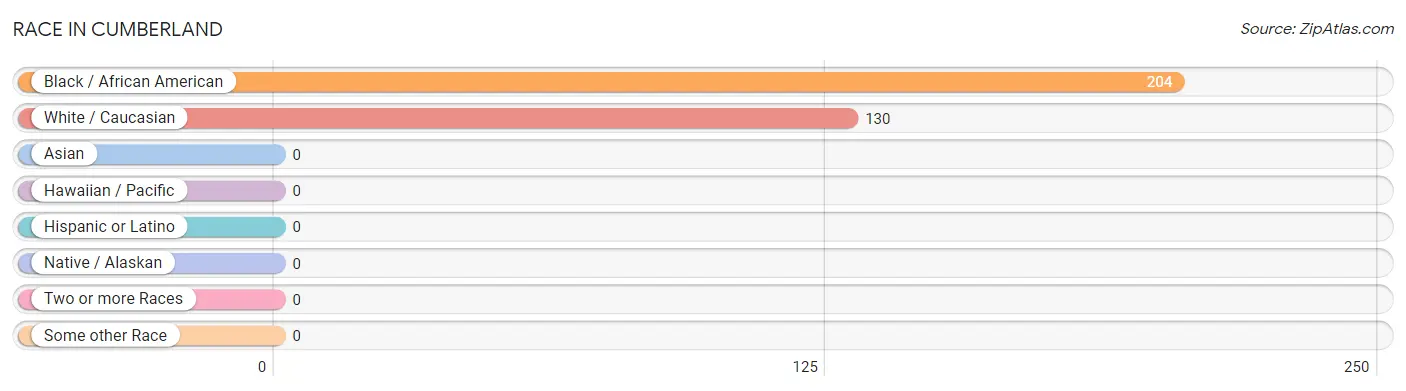
Race in Cumberland
The most populous races in Cumberland are Black / African American (204 | 61.1%), and White / Caucasian (130 | 38.9%).
| Race | # Population | % Population |
| Asian | 0 | 0.0% |
| Black / African American | 204 | 61.1% |
| Hawaiian / Pacific | 0 | 0.0% |
| Hispanic or Latino | 0 | 0.0% |
| Native / Alaskan | 0 | 0.0% |
| White / Caucasian | 130 | 38.9% |
| Two or more Races | 0 | 0.0% |
| Some other Race | 0 | 0.0% |
| Total | 334 | 100.0% |
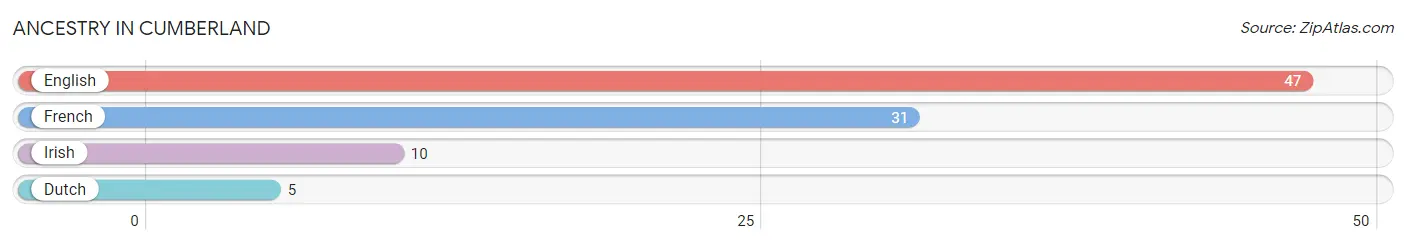
Ancestry in Cumberland
The most populous ancestries reported in Cumberland are English (47 | 14.1%), French (31 | 9.3%), Irish (10 | 3.0%), and Dutch (5 | 1.5%), together accounting for 27.8% of all Cumberland residents.
| Ancestry | # Population | % Population |
| Dutch | 5 | 1.5% |
| English | 47 | 14.1% |
| French | 31 | 9.3% |
| Irish | 10 | 3.0% | View All 4 Rows |
Immigrants in Cumberland

| Immigration Origin | # Population | % Population | View All 0 Rows |
Sex and Age in Cumberland
Sex and Age in Cumberland
The most populous age groups in Cumberland are 75 to 79 Years (82 | 37.6%) for men and 35 to 39 Years (40 | 34.5%) for women.
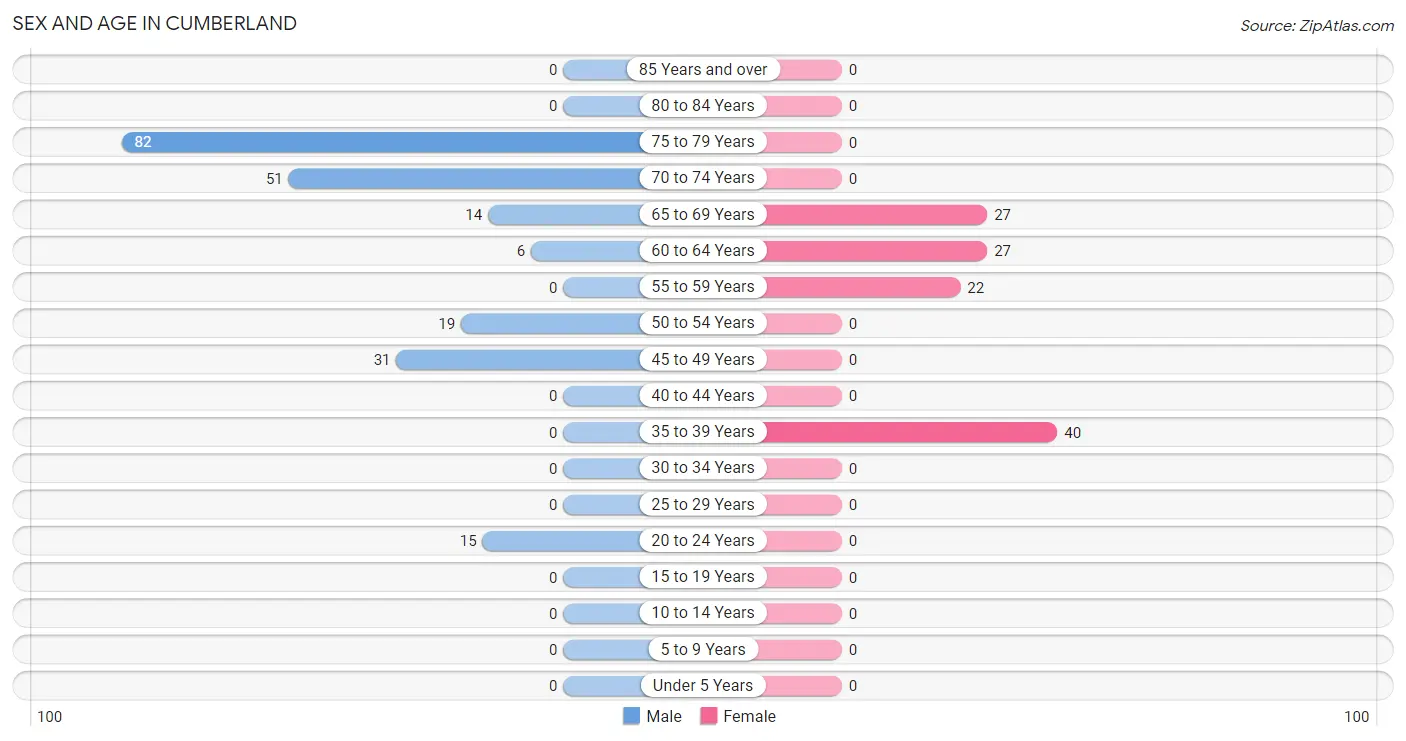
| Age Bracket | Male | Female |
| Under 5 Years | 0 (0.0%) | 0 (0.0%) |
| 5 to 9 Years | 0 (0.0%) | 0 (0.0%) |
| 10 to 14 Years | 0 (0.0%) | 0 (0.0%) |
| 15 to 19 Years | 0 (0.0%) | 0 (0.0%) |
| 20 to 24 Years | 15 (6.9%) | 0 (0.0%) |
| 25 to 29 Years | 0 (0.0%) | 0 (0.0%) |
| 30 to 34 Years | 0 (0.0%) | 0 (0.0%) |
| 35 to 39 Years | 0 (0.0%) | 40 (34.5%) |
| 40 to 44 Years | 0 (0.0%) | 0 (0.0%) |
| 45 to 49 Years | 31 (14.2%) | 0 (0.0%) |
| 50 to 54 Years | 19 (8.7%) | 0 (0.0%) |
| 55 to 59 Years | 0 (0.0%) | 22 (19.0%) |
| 60 to 64 Years | 6 (2.8%) | 27 (23.3%) |
| 65 to 69 Years | 14 (6.4%) | 27 (23.3%) |
| 70 to 74 Years | 51 (23.4%) | 0 (0.0%) |
| 75 to 79 Years | 82 (37.6%) | 0 (0.0%) |
| 80 to 84 Years | 0 (0.0%) | 0 (0.0%) |
| 85 Years and over | 0 (0.0%) | 0 (0.0%) |
| Total | 218 (100.0%) | 116 (100.0%) |
Families and Households in Cumberland
Median Family Size in Cumberland
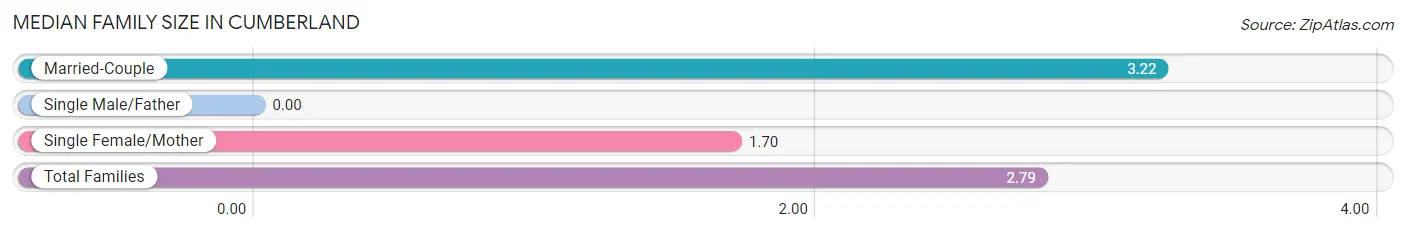
| Family Type | # Families | Family Size |
| Married-Couple | 67 (71.3%) | 3.22 |
| Single Male/Father | 0 (0.0%) | - |
| Single Female/Mother | 27 (28.7%) | 1.70 |
| Total Families | 94 (100.0%) | 2.79 |
Median Household Size in Cumberland
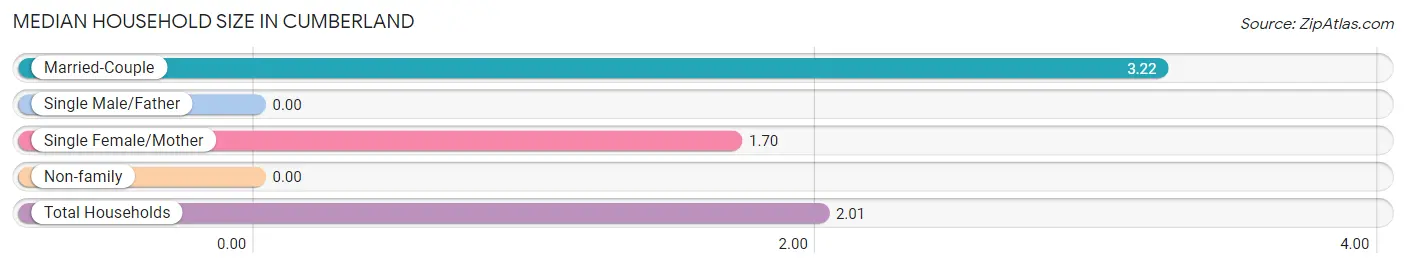
| Household Type | # Households | Household Size |
| Married-Couple | 67 (40.4%) | 3.22 |
| Single Male/Father | 0 (0.0%) | - |
| Single Female/Mother | 27 (16.3%) | 1.70 |
| Non-family | 72 (43.4%) | - |
| Total Households | 166 (100.0%) | 2.01 |
Household Size by Marriage Status in Cumberland
Out of a total of 166 households in Cumberland, 94 (56.6%) are family households, while 72 (43.4%) are nonfamily households. The most numerous type of family households are 2-person households, comprising 65, and the most common type of nonfamily households are 1-person households, comprising 72.
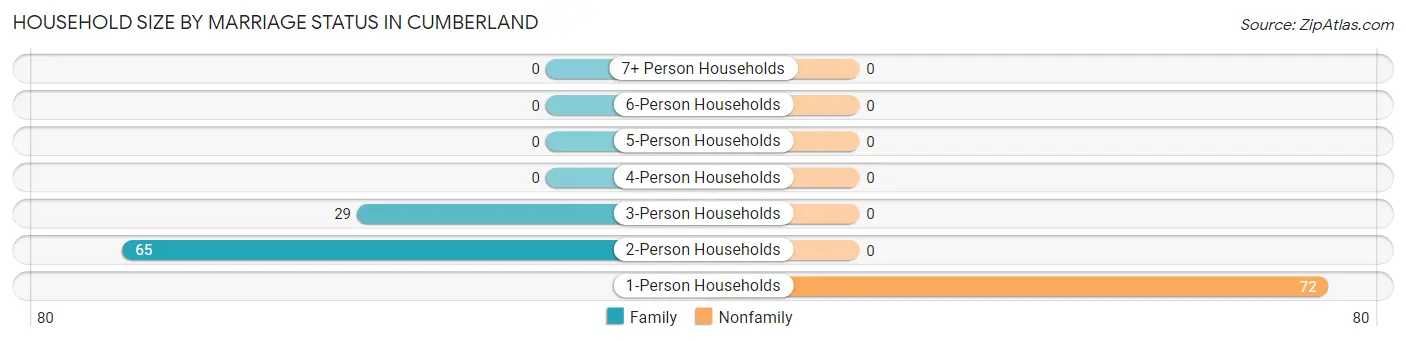
| Household Size | Family Households | Nonfamily Households |
| 1-Person Households | - | 72 (43.4%) |
| 2-Person Households | 65 (39.2%) | 0 (0.0%) |
| 3-Person Households | 29 (17.5%) | 0 (0.0%) |
| 4-Person Households | 0 (0.0%) | 0 (0.0%) |
| 5-Person Households | 0 (0.0%) | 0 (0.0%) |
| 6-Person Households | 0 (0.0%) | 0 (0.0%) |
| 7+ Person Households | 0 (0.0%) | 0 (0.0%) |
| Total | 94 (56.6%) | 72 (43.4%) |
Female Fertility in Cumberland
Fertility by Age in Cumberland
| Age Bracket | Women with Births | Births / 1,000 Women |
| 15 to 19 years | 0 (0.0%) | 0.0 |
| 20 to 34 years | 0 (0.0%) | 0.0 |
| 35 to 50 years | 0 (0.0%) | 0.0 |
| Total | 0 (0.0%) | 0.0 |
Fertility by Age by Marriage Status in Cumberland
| Age Bracket | Married | Unmarried |
| 15 to 19 years | 0 (0.0%) | 0 (0.0%) |
| 20 to 34 years | 0 (0.0%) | 0 (0.0%) |
| 35 to 50 years | 0 (0.0%) | 0 (0.0%) |
| Total | 0 (0.0%) | 0 (0.0%) |
Fertility by Education in Cumberland
| Educational Attainment | Women with Births | Births / 1,000 Women |
| Less than High School | 0 (0.0%) | 0.0 |
| High School Diploma | 0 (0.0%) | 0.0 |
| College or Associate's Degree | 0 (0.0%) | 0.0 |
| Bachelor's Degree | 0 (0.0%) | 0.0 |
| Graduate Degree | 0 (0.0%) | 0.0 |
| Total | 0 (0.0%) | 0.0 |
Fertility by Education by Marriage Status in Cumberland
| Educational Attainment | Married | Unmarried |
| Less than High School | 0 (0.0%) | 0 (0.0%) |
| High School Diploma | 0 (0.0%) | 0 (0.0%) |
| College or Associate's Degree | 0 (0.0%) | 0 (0.0%) |
| Bachelor's Degree | 0 (0.0%) | 0 (0.0%) |
| Graduate Degree | 0 (0.0%) | 0 (0.0%) |
| Total | 0 (0.0%) | 0 (0.0%) |
Employment Characteristics in Cumberland
Employment by Class of Employer in Cumberland
Among the 135 employed individuals in Cumberland, private company employees (95 | 70.4%), local government employees (28 | 20.7%), and self-employed (incorporated) (12 | 8.9%) make up the most common classes of employment.
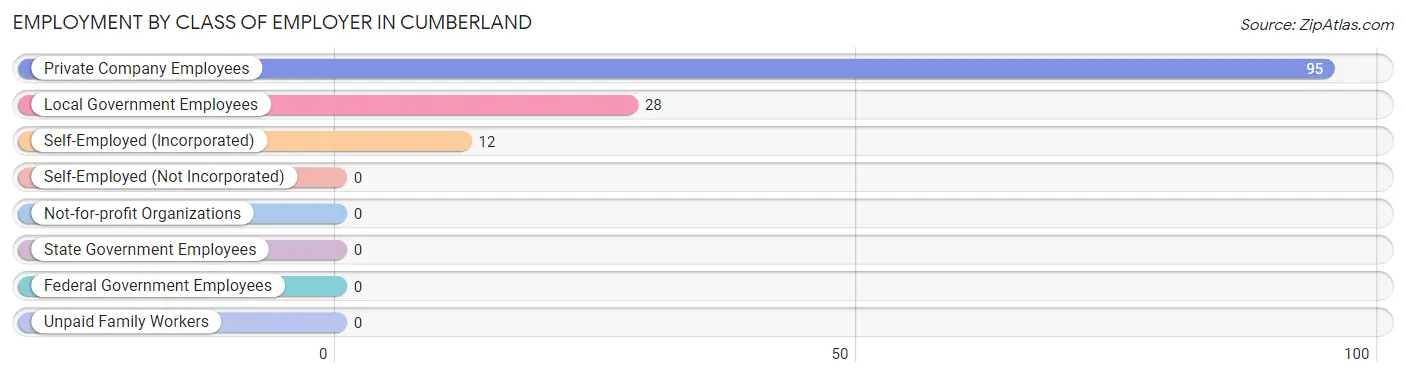
| Employer Class | # Employees | % Employees |
| Private Company Employees | 95 | 70.4% |
| Self-Employed (Incorporated) | 12 | 8.9% |
| Self-Employed (Not Incorporated) | 0 | 0.0% |
| Not-for-profit Organizations | 0 | 0.0% |
| Local Government Employees | 28 | 20.7% |
| State Government Employees | 0 | 0.0% |
| Federal Government Employees | 0 | 0.0% |
| Unpaid Family Workers | 0 | 0.0% |
| Total | 135 | 100.0% |
Employment Status by Age in Cumberland
According to the labor force statistics for Cumberland, out of the total population over 16 years of age (334), 50.3% or 168 individuals are in the labor force, with 8.9% or 15 of them unemployed. The age group with the highest labor force participation rate is 20 to 24 years, with 100.0% or 15 individuals in the labor force. Within the labor force, the 20 to 24 years age range has the highest percentage of unemployed individuals, with 100.0% or 15 of them being unemployed.
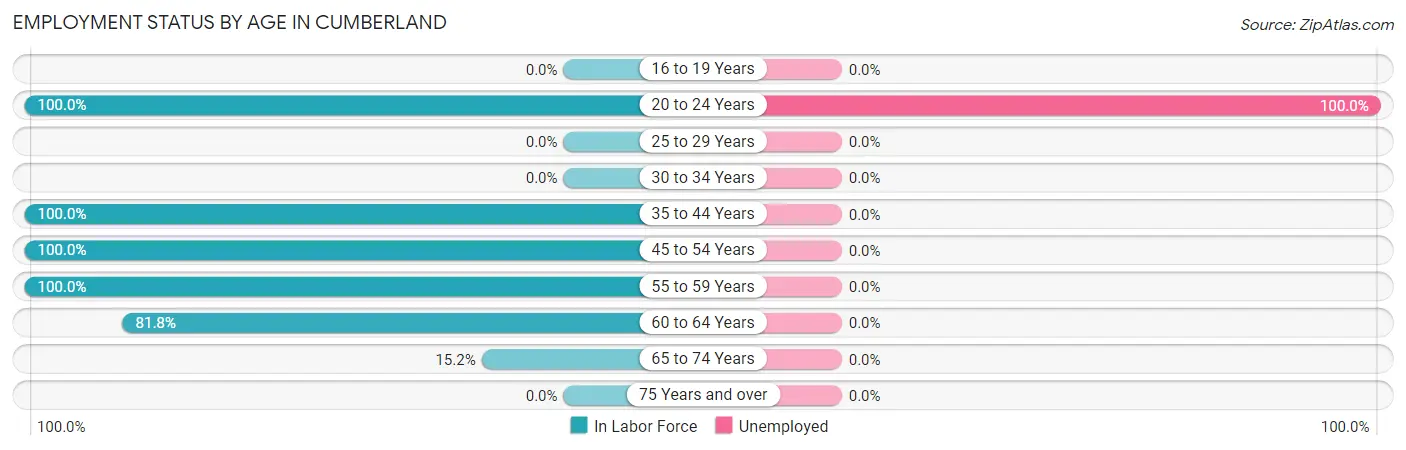
| Age Bracket | In Labor Force | Unemployed |
| 16 to 19 Years | 0 (0.0%) | 0 (0.0%) |
| 20 to 24 Years | 15 (100.0%) | 15 (100.0%) |
| 25 to 29 Years | 0 (0.0%) | 0 (0.0%) |
| 30 to 34 Years | 0 (0.0%) | 0 (0.0%) |
| 35 to 44 Years | 40 (100.0%) | 0 (0.0%) |
| 45 to 54 Years | 50 (100.0%) | 0 (0.0%) |
| 55 to 59 Years | 22 (100.0%) | 0 (0.0%) |
| 60 to 64 Years | 27 (81.8%) | 0 (0.0%) |
| 65 to 74 Years | 14 (15.2%) | 0 (0.0%) |
| 75 Years and over | 0 (0.0%) | 0 (0.0%) |
| Total | 168 (50.3%) | 15 (8.9%) |
Employment Status by Educational Attainment in Cumberland
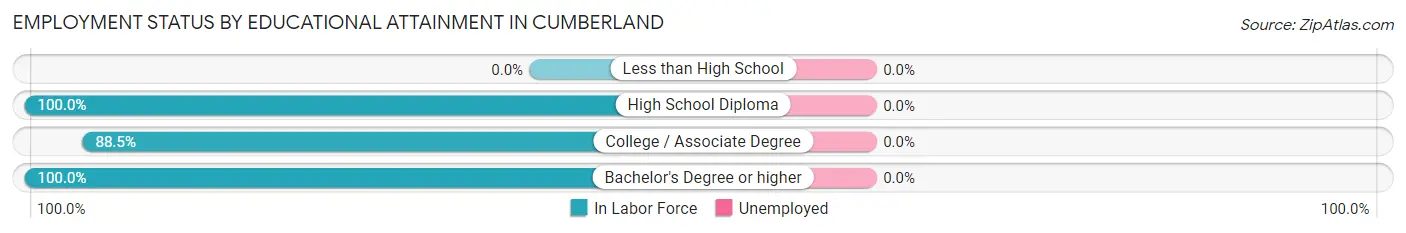
| Educational Attainment | In Labor Force | Unemployed |
| Less than High School | 0 (0.0%) | 0 (0.0%) |
| High School Diploma | 31 (100.0%) | 0 (0.0%) |
| College / Associate Degree | 46 (88.5%) | 0 (0.0%) |
| Bachelor's Degree or higher | 62 (100.0%) | 0 (0.0%) |
| Total | 139 (95.9%) | 0 (0.0%) |
Employment Occupations by Sex in Cumberland
Management, Business, Science and Arts Occupations
The most common Management, Business, Science and Arts occupations in Cumberland are Management (14 | 9.1%), Business & Financial (12 | 7.8%), Community & Social Service (9 | 5.9%), and Education Instruction & Library (9 | 5.9%).
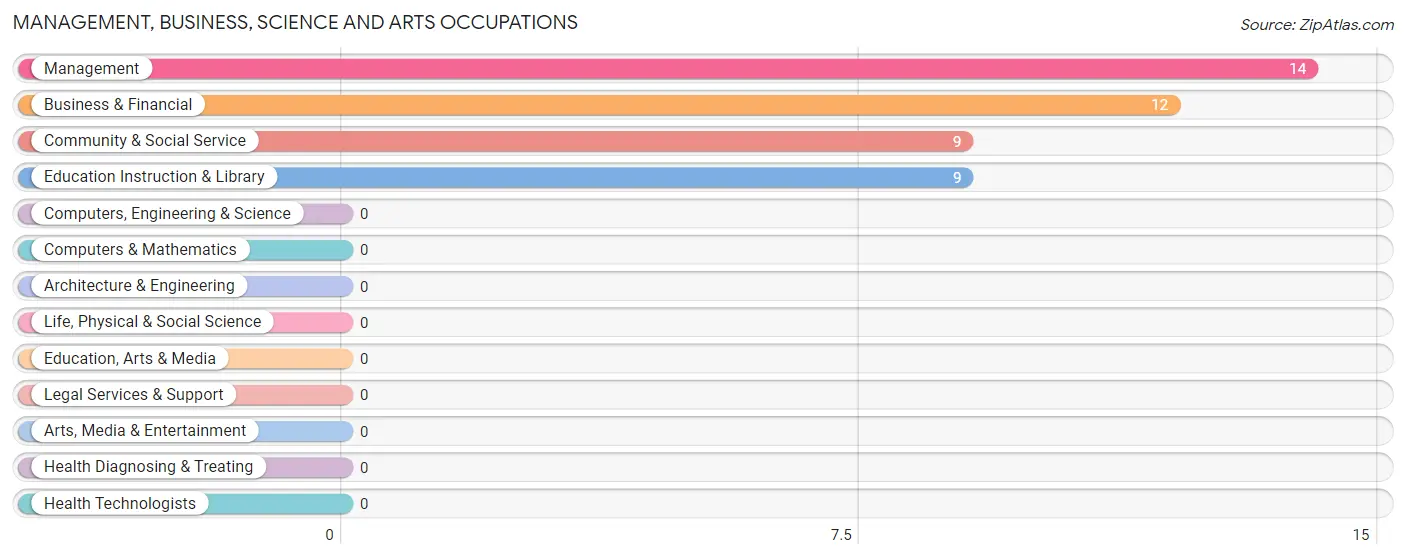
Management, Business, Science and Arts Occupations by Sex
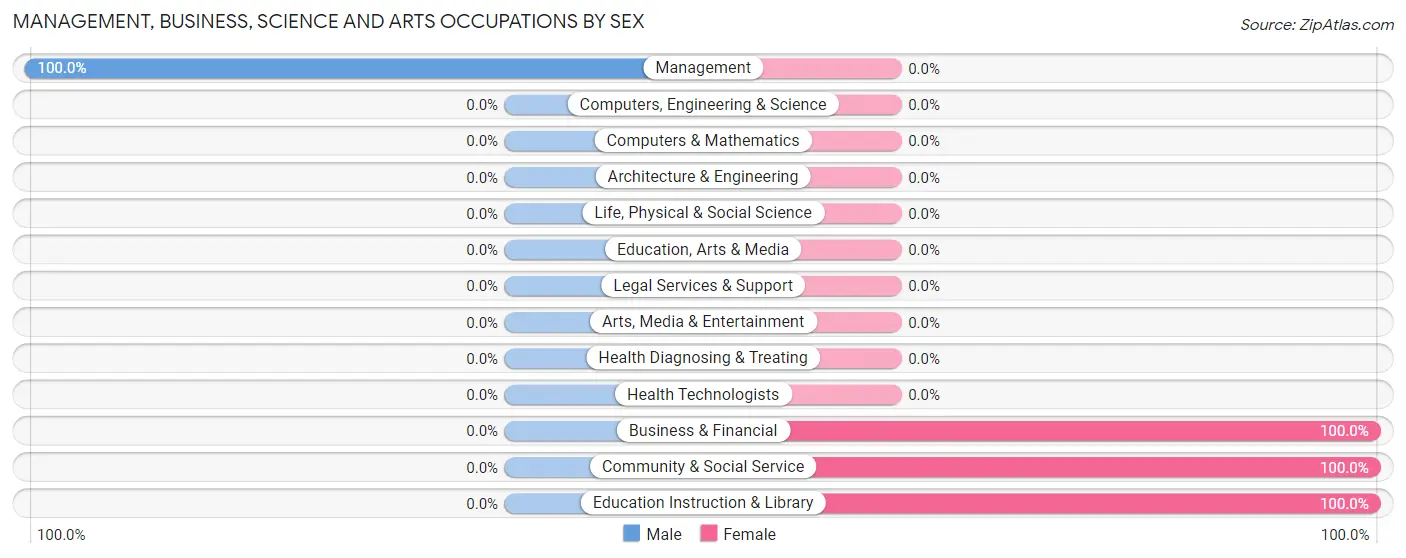
| Occupation | Male | Female |
| Management | 14 (100.0%) | 0 (0.0%) |
| Business & Financial | 0 (0.0%) | 12 (100.0%) |
| Computers, Engineering & Science | 0 (0.0%) | 0 (0.0%) |
| Computers & Mathematics | 0 (0.0%) | 0 (0.0%) |
| Architecture & Engineering | 0 (0.0%) | 0 (0.0%) |
| Life, Physical & Social Science | 0 (0.0%) | 0 (0.0%) |
| Community & Social Service | 0 (0.0%) | 9 (100.0%) |
| Education, Arts & Media | 0 (0.0%) | 0 (0.0%) |
| Legal Services & Support | 0 (0.0%) | 0 (0.0%) |
| Education Instruction & Library | 0 (0.0%) | 9 (100.0%) |
| Arts, Media & Entertainment | 0 (0.0%) | 0 (0.0%) |
| Health Diagnosing & Treating | 0 (0.0%) | 0 (0.0%) |
| Health Technologists | 0 (0.0%) | 0 (0.0%) |
| Total (Category) | 14 (40.0%) | 21 (60.0%) |
| Total (Overall) | 64 (41.8%) | 89 (58.2%) |
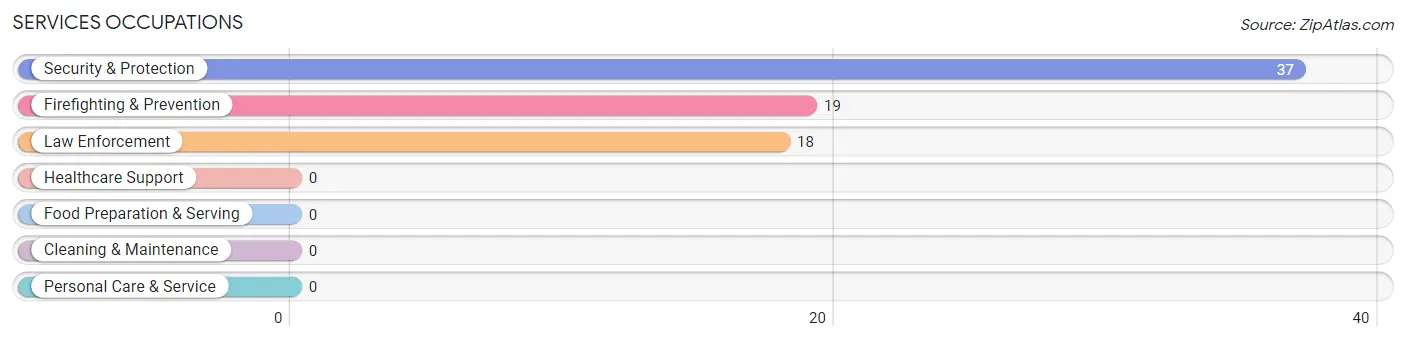
Services Occupations
The most common Services occupations in Cumberland are Security & Protection (37 | 24.2%), Firefighting & Prevention (19 | 12.4%), and Law Enforcement (18 | 11.8%).
Services Occupations by Sex
Within the Services occupations in Cumberland, the most male-oriented occupations are Firefighting & Prevention (100.0%), and Security & Protection (51.3%), while the most female-oriented occupations are Law Enforcement (100.0%), and Security & Protection (48.6%).
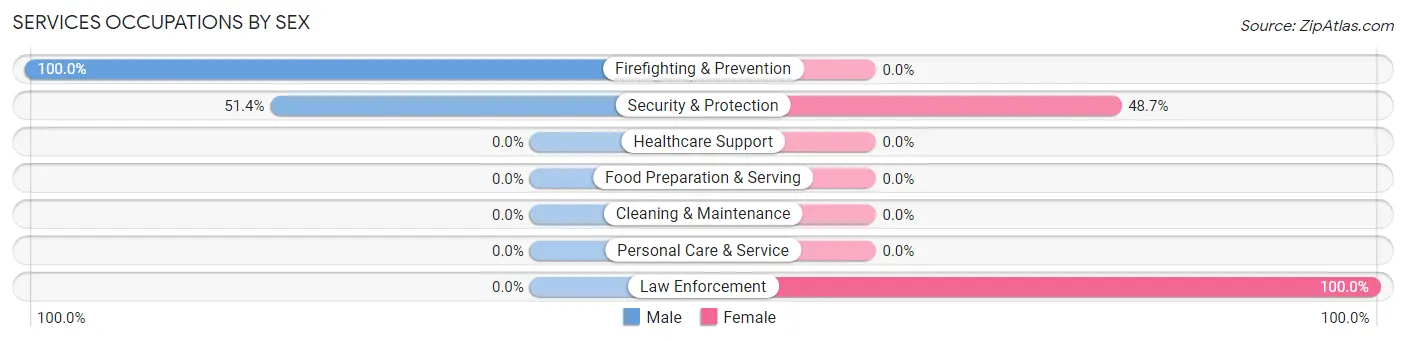
| Occupation | Male | Female |
| Healthcare Support | 0 (0.0%) | 0 (0.0%) |
| Security & Protection | 19 (51.3%) | 18 (48.6%) |
| Firefighting & Prevention | 19 (100.0%) | 0 (0.0%) |
| Law Enforcement | 0 (0.0%) | 18 (100.0%) |
| Food Preparation & Serving | 0 (0.0%) | 0 (0.0%) |
| Cleaning & Maintenance | 0 (0.0%) | 0 (0.0%) |
| Personal Care & Service | 0 (0.0%) | 0 (0.0%) |
| Total (Category) | 19 (51.3%) | 18 (48.6%) |
| Total (Overall) | 64 (41.8%) | 89 (58.2%) |
Sales and Office Occupations
The most common Sales and Office occupations in Cumberland are Sales & Related (31 | 20.3%), and Office & Administration (22 | 14.4%).
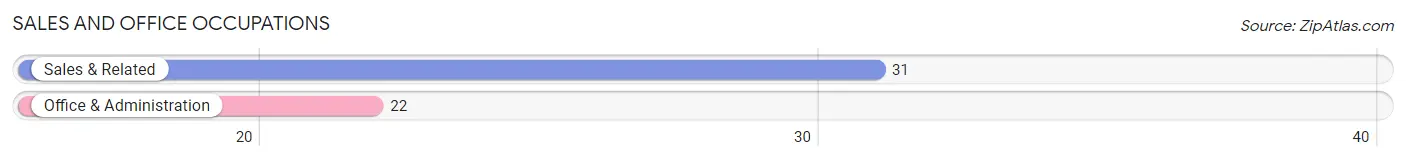
Sales and Office Occupations by Sex

| Occupation | Male | Female |
| Sales & Related | 31 (100.0%) | 0 (0.0%) |
| Office & Administration | 0 (0.0%) | 22 (100.0%) |
| Total (Category) | 31 (58.5%) | 22 (41.5%) |
| Total (Overall) | 64 (41.8%) | 89 (58.2%) |
Natural Resources, Construction and Maintenance Occupations
Natural Resources, Construction and Maintenance Occupations by Sex
| Occupation | Male | Female |
| Farming, Fishing & Forestry | 0 (0.0%) | 0 (0.0%) |
| Construction & Extraction | 0 (0.0%) | 0 (0.0%) |
| Installation, Maintenance & Repair | 0 (0.0%) | 0 (0.0%) |
| Total (Category) | 0 (0.0%) | 0 (0.0%) |
| Total (Overall) | 64 (41.8%) | 89 (58.2%) |
Production, Transportation and Moving Occupations
The most common Production, Transportation and Moving occupations in Cumberland are , and Production (28 | 18.3%).
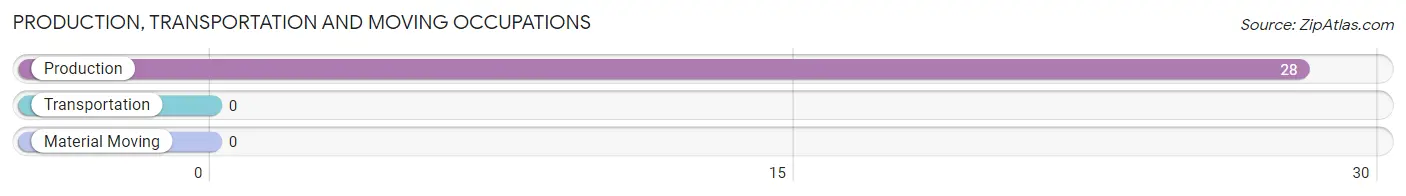
Production, Transportation and Moving Occupations by Sex
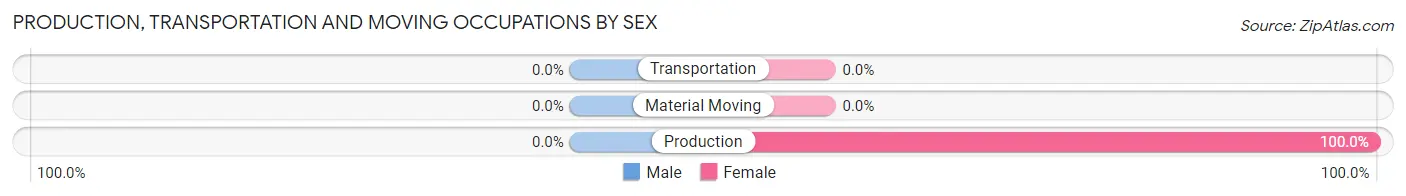
| Occupation | Male | Female |
| Production | 0 (0.0%) | 28 (100.0%) |
| Transportation | 0 (0.0%) | 0 (0.0%) |
| Material Moving | 0 (0.0%) | 0 (0.0%) |
| Total (Category) | 0 (0.0%) | 28 (100.0%) |
| Total (Overall) | 64 (41.8%) | 89 (58.2%) |
Employment Industries by Sex in Cumberland
Employment Industries in Cumberland
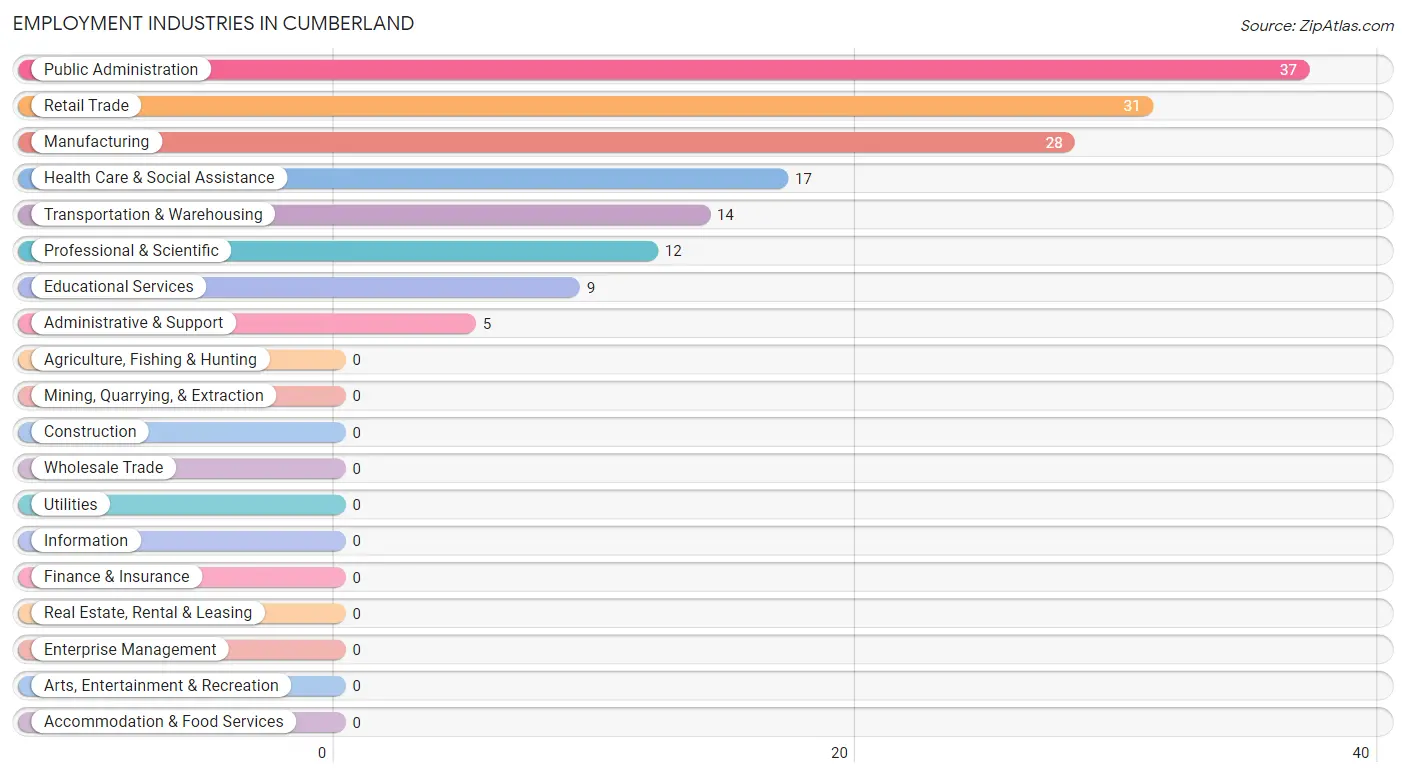
The major employment industries in Cumberland include Public Administration (37 | 24.2%), Retail Trade (31 | 20.3%), Manufacturing (28 | 18.3%), Health Care & Social Assistance (17 | 11.1%), and Transportation & Warehousing (14 | 9.1%).
Employment Industries by Sex in Cumberland
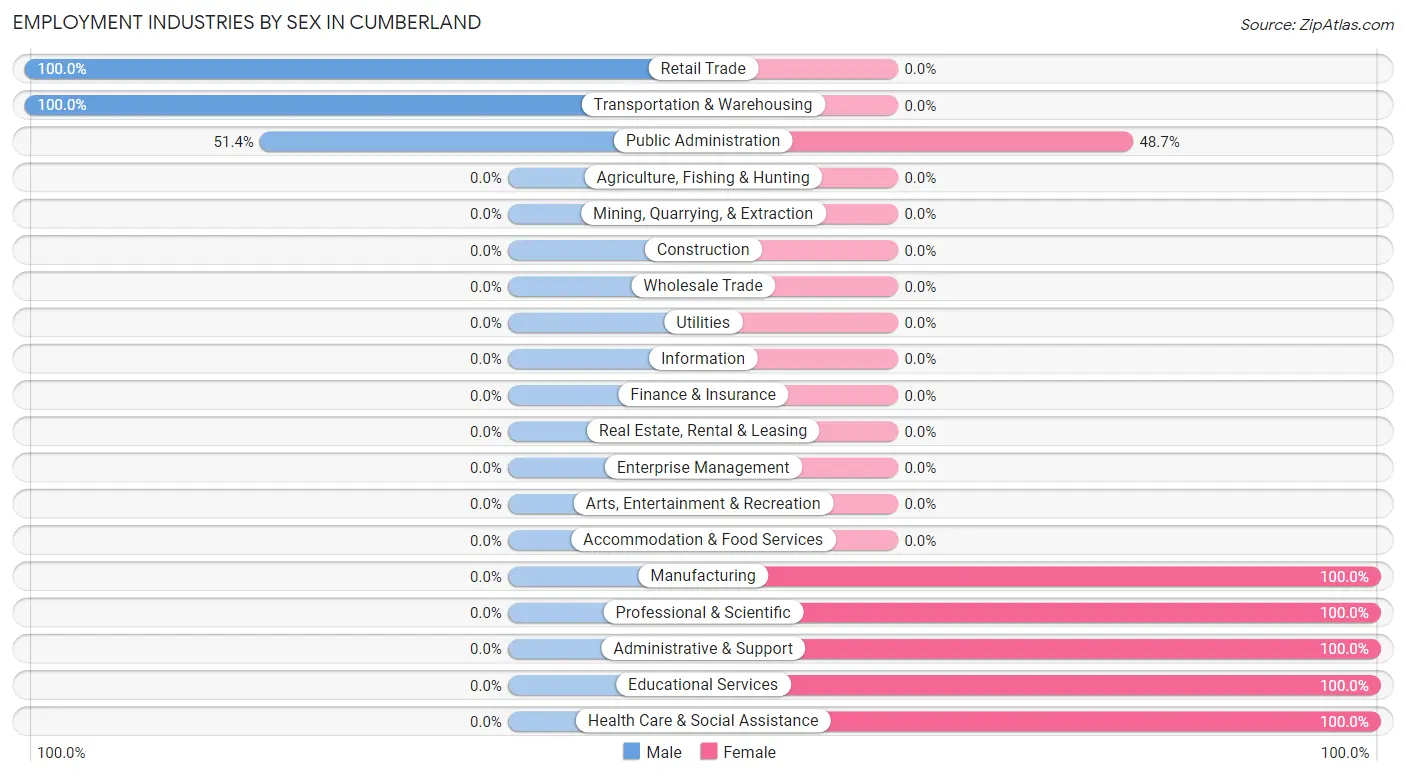
The Cumberland industries that see more men than women are Retail Trade (100.0%), Transportation & Warehousing (100.0%), and Public Administration (51.3%), whereas the industries that tend to have a higher number of women are Manufacturing (100.0%), Professional & Scientific (100.0%), and Administrative & Support (100.0%).
| Industry | Male | Female |
| Agriculture, Fishing & Hunting | 0 (0.0%) | 0 (0.0%) |
| Mining, Quarrying, & Extraction | 0 (0.0%) | 0 (0.0%) |
| Construction | 0 (0.0%) | 0 (0.0%) |
| Manufacturing | 0 (0.0%) | 28 (100.0%) |
| Wholesale Trade | 0 (0.0%) | 0 (0.0%) |
| Retail Trade | 31 (100.0%) | 0 (0.0%) |
| Transportation & Warehousing | 14 (100.0%) | 0 (0.0%) |
| Utilities | 0 (0.0%) | 0 (0.0%) |
| Information | 0 (0.0%) | 0 (0.0%) |
| Finance & Insurance | 0 (0.0%) | 0 (0.0%) |
| Real Estate, Rental & Leasing | 0 (0.0%) | 0 (0.0%) |
| Professional & Scientific | 0 (0.0%) | 12 (100.0%) |
| Enterprise Management | 0 (0.0%) | 0 (0.0%) |
| Administrative & Support | 0 (0.0%) | 5 (100.0%) |
| Educational Services | 0 (0.0%) | 9 (100.0%) |
| Health Care & Social Assistance | 0 (0.0%) | 17 (100.0%) |
| Arts, Entertainment & Recreation | 0 (0.0%) | 0 (0.0%) |
| Accommodation & Food Services | 0 (0.0%) | 0 (0.0%) |
| Public Administration | 19 (51.3%) | 18 (48.6%) |
| Total | 64 (41.8%) | 89 (58.2%) |
Education in Cumberland
School Enrollment in Cumberland
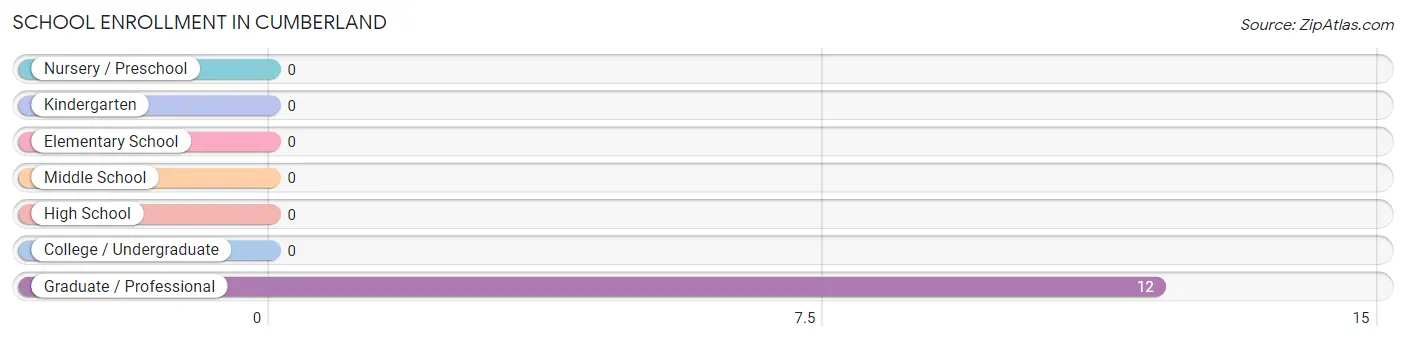
| School Level | # Students | % Students |
| Nursery / Preschool | 0 | 0.0% |
| Kindergarten | 0 | 0.0% |
| Elementary School | 0 | 0.0% |
| Middle School | 0 | 0.0% |
| High School | 0 | 0.0% |
| College / Undergraduate | 0 | 0.0% |
| Graduate / Professional | 12 | 100.0% |
| Total | 12 | 100.0% |
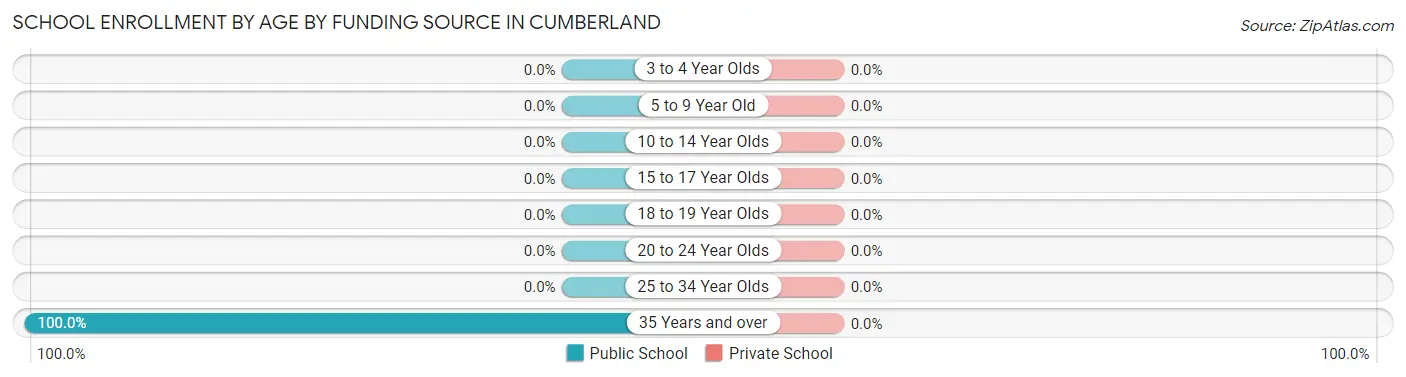
School Enrollment by Age by Funding Source in Cumberland
| Age Bracket | Public School | Private School |
| 3 to 4 Year Olds | 0 (0.0%) | 0 (0.0%) |
| 5 to 9 Year Old | 0 (0.0%) | 0 (0.0%) |
| 10 to 14 Year Olds | 0 (0.0%) | 0 (0.0%) |
| 15 to 17 Year Olds | 0 (0.0%) | 0 (0.0%) |
| 18 to 19 Year Olds | 0 (0.0%) | 0 (0.0%) |
| 20 to 24 Year Olds | 0 (0.0%) | 0 (0.0%) |
| 25 to 34 Year Olds | 0 (0.0%) | 0 (0.0%) |
| 35 Years and over | 12 (100.0%) | 0 (0.0%) |
| Total | 12 (100.0%) | 0 (0.0%) |
Educational Attainment by Field of Study in Cumberland
Business (43 | 56.6%), psychology (28 | 36.8%), and liberal arts & history (5 | 6.6%) are the most common fields of study among 76 individuals in Cumberland who have obtained a bachelor's degree or higher.
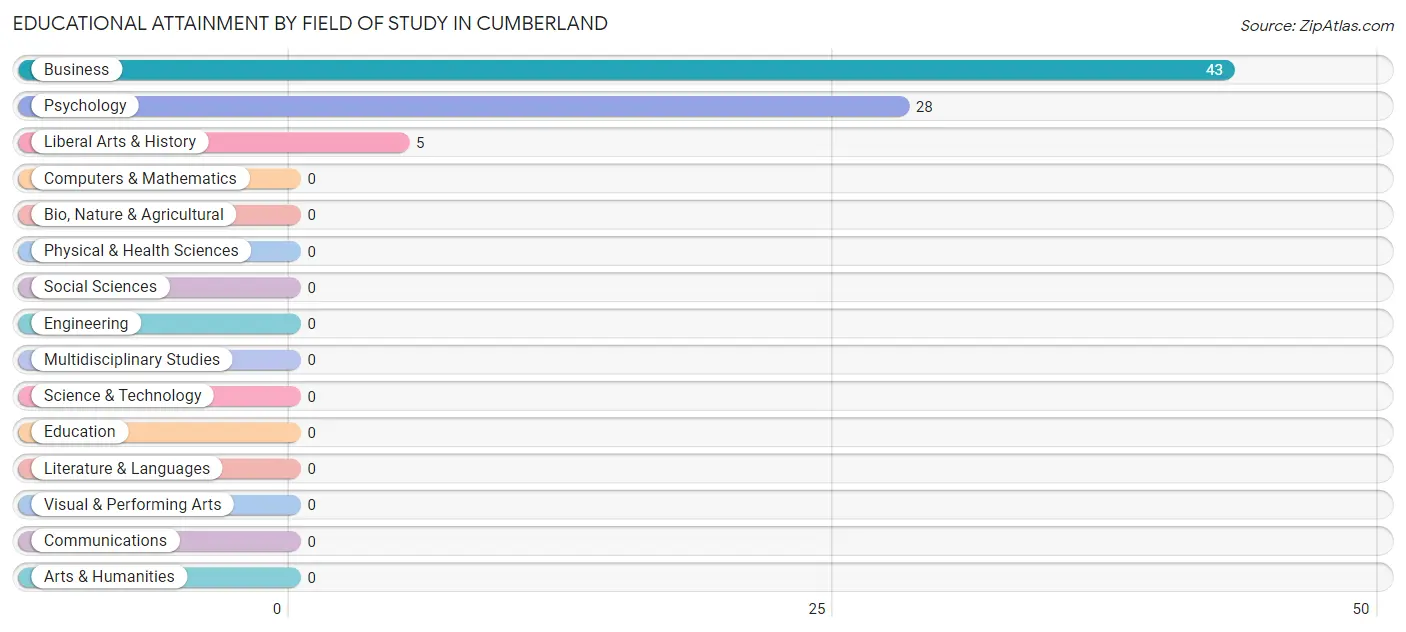
| Field of Study | # Graduates | % Graduates |
| Computers & Mathematics | 0 | 0.0% |
| Bio, Nature & Agricultural | 0 | 0.0% |
| Physical & Health Sciences | 0 | 0.0% |
| Psychology | 28 | 36.8% |
| Social Sciences | 0 | 0.0% |
| Engineering | 0 | 0.0% |
| Multidisciplinary Studies | 0 | 0.0% |
| Science & Technology | 0 | 0.0% |
| Business | 43 | 56.6% |
| Education | 0 | 0.0% |
| Literature & Languages | 0 | 0.0% |
| Liberal Arts & History | 5 | 6.6% |
| Visual & Performing Arts | 0 | 0.0% |
| Communications | 0 | 0.0% |
| Arts & Humanities | 0 | 0.0% |
| Total | 76 | 100.0% |
Transportation & Commute in Cumberland
Vehicle Availability by Sex in Cumberland
The most prevalent vehicle ownership categories in Cumberland are males with 3 vehicles (45, accounting for 70.3%) and females with 3 vehicles (21, making up 63.4%).
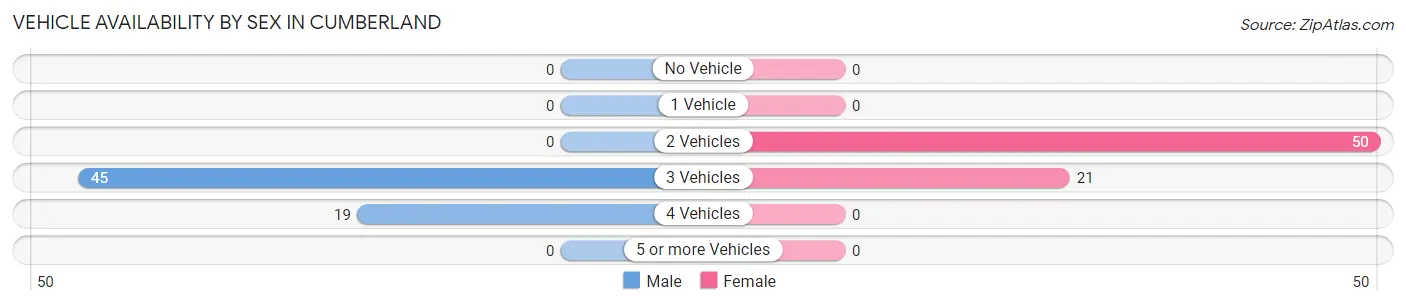
| Vehicles Available | Male | Female |
| No Vehicle | 0 (0.0%) | 0 (0.0%) |
| 1 Vehicle | 0 (0.0%) | 0 (0.0%) |
| 2 Vehicles | 0 (0.0%) | 50 (70.4%) |
| 3 Vehicles | 45 (70.3%) | 21 (29.6%) |
| 4 Vehicles | 19 (29.7%) | 0 (0.0%) |
| 5 or more Vehicles | 0 (0.0%) | 0 (0.0%) |
| Total | 64 (100.0%) | 71 (100.0%) |
Commute Time in Cumberland
The most frequently occuring commute durations in Cumberland are 60 to 89 minutes (62 commuters, 50.4%), 90 or more minutes (28 commuters, 22.8%), and 35 to 39 minutes (19 commuters, 15.4%).
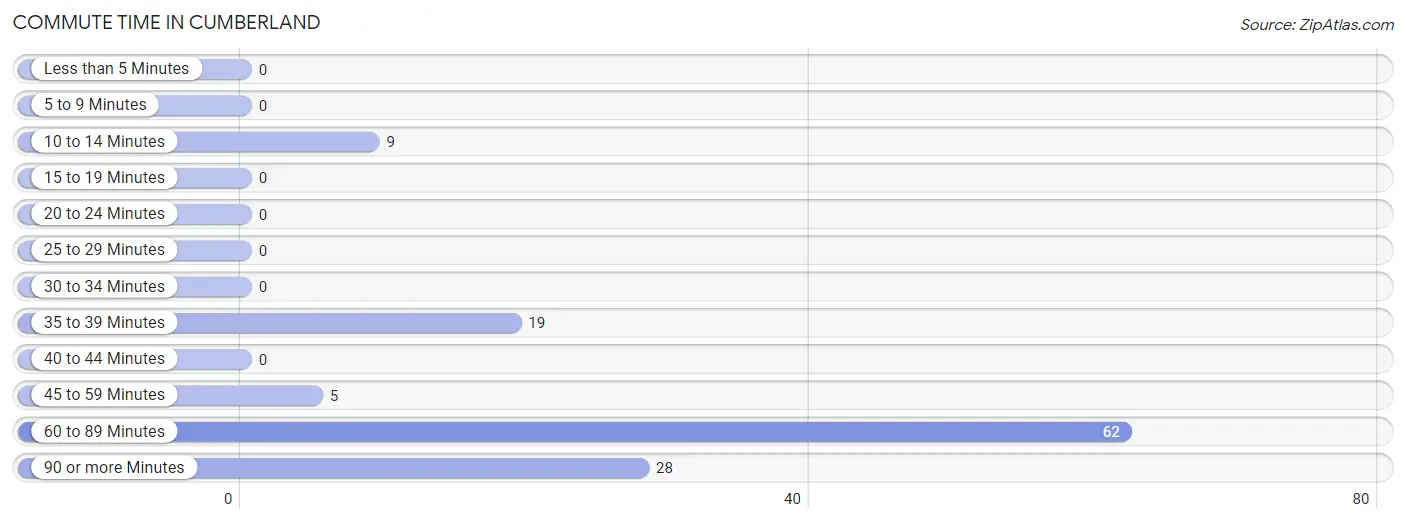
| Commute Time | # Commuters | % Commuters |
| Less than 5 Minutes | 0 | 0.0% |
| 5 to 9 Minutes | 0 | 0.0% |
| 10 to 14 Minutes | 9 | 7.3% |
| 15 to 19 Minutes | 0 | 0.0% |
| 20 to 24 Minutes | 0 | 0.0% |
| 25 to 29 Minutes | 0 | 0.0% |
| 30 to 34 Minutes | 0 | 0.0% |
| 35 to 39 Minutes | 19 | 15.4% |
| 40 to 44 Minutes | 0 | 0.0% |
| 45 to 59 Minutes | 5 | 4.1% |
| 60 to 89 Minutes | 62 | 50.4% |
| 90 or more Minutes | 28 | 22.8% |
Commute Time by Sex in Cumberland
The most common commute times in Cumberland are 60 to 89 minutes (45 commuters, 70.3%) for males and 90 or more minutes (28 commuters, 47.5%) for females.
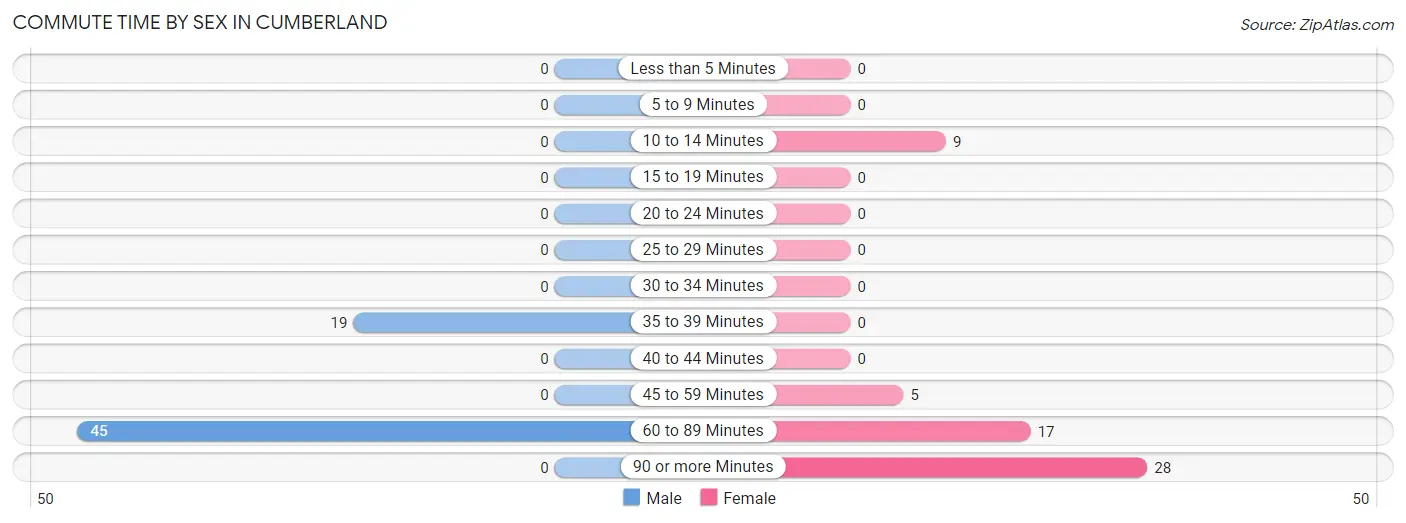
| Commute Time | Male | Female |
| Less than 5 Minutes | 0 (0.0%) | 0 (0.0%) |
| 5 to 9 Minutes | 0 (0.0%) | 0 (0.0%) |
| 10 to 14 Minutes | 0 (0.0%) | 9 (15.2%) |
| 15 to 19 Minutes | 0 (0.0%) | 0 (0.0%) |
| 20 to 24 Minutes | 0 (0.0%) | 0 (0.0%) |
| 25 to 29 Minutes | 0 (0.0%) | 0 (0.0%) |
| 30 to 34 Minutes | 0 (0.0%) | 0 (0.0%) |
| 35 to 39 Minutes | 19 (29.7%) | 0 (0.0%) |
| 40 to 44 Minutes | 0 (0.0%) | 0 (0.0%) |
| 45 to 59 Minutes | 0 (0.0%) | 5 (8.5%) |
| 60 to 89 Minutes | 45 (70.3%) | 17 (28.8%) |
| 90 or more Minutes | 0 (0.0%) | 28 (47.5%) |
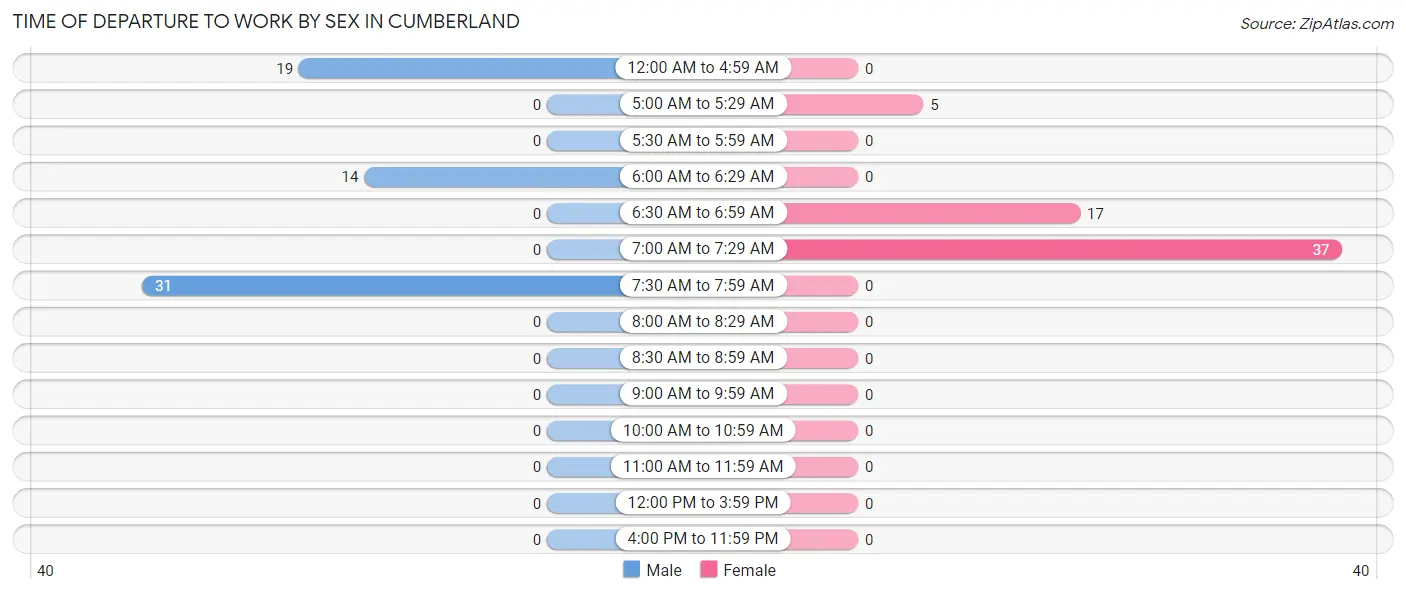
Time of Departure to Work by Sex in Cumberland
The most frequent times of departure to work in Cumberland are 7:30 AM to 7:59 AM (31, 48.4%) for males and 7:00 AM to 7:29 AM (37, 62.7%) for females.
| Time of Departure | Male | Female |
| 12:00 AM to 4:59 AM | 19 (29.7%) | 0 (0.0%) |
| 5:00 AM to 5:29 AM | 0 (0.0%) | 5 (8.5%) |
| 5:30 AM to 5:59 AM | 0 (0.0%) | 0 (0.0%) |
| 6:00 AM to 6:29 AM | 14 (21.9%) | 0 (0.0%) |
| 6:30 AM to 6:59 AM | 0 (0.0%) | 17 (28.8%) |
| 7:00 AM to 7:29 AM | 0 (0.0%) | 37 (62.7%) |
| 7:30 AM to 7:59 AM | 31 (48.4%) | 0 (0.0%) |
| 8:00 AM to 8:29 AM | 0 (0.0%) | 0 (0.0%) |
| 8:30 AM to 8:59 AM | 0 (0.0%) | 0 (0.0%) |
| 9:00 AM to 9:59 AM | 0 (0.0%) | 0 (0.0%) |
| 10:00 AM to 10:59 AM | 0 (0.0%) | 0 (0.0%) |
| 11:00 AM to 11:59 AM | 0 (0.0%) | 0 (0.0%) |
| 12:00 PM to 3:59 PM | 0 (0.0%) | 0 (0.0%) |
| 4:00 PM to 11:59 PM | 0 (0.0%) | 0 (0.0%) |
| Total | 64 (100.0%) | 59 (100.0%) |
Housing Occupancy in Cumberland
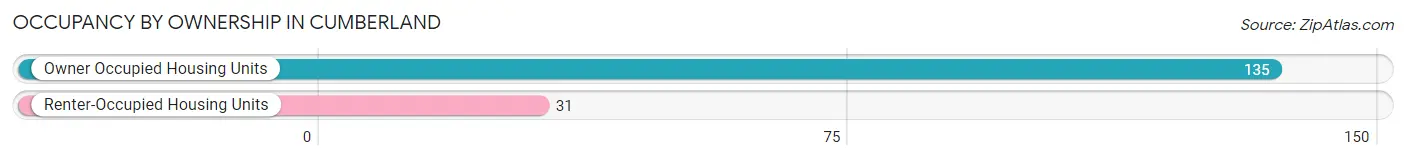
Occupancy by Ownership in Cumberland
Of the total 166 dwellings in Cumberland, owner-occupied units account for 135 (81.3%), while renter-occupied units make up 31 (18.7%).
| Occupancy | # Housing Units | % Housing Units |
| Owner Occupied Housing Units | 135 | 81.3% |
| Renter-Occupied Housing Units | 31 | 18.7% |
| Total Occupied Housing Units | 166 | 100.0% |
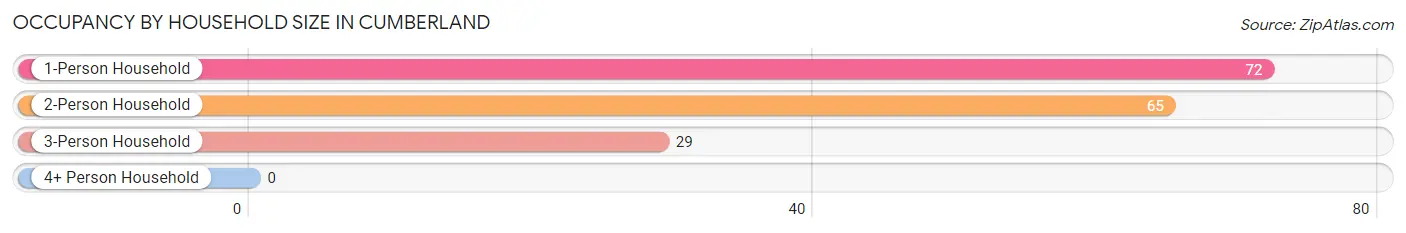
Occupancy by Household Size in Cumberland
| Household Size | # Housing Units | % Housing Units |
| 1-Person Household | 72 | 43.4% |
| 2-Person Household | 65 | 39.2% |
| 3-Person Household | 29 | 17.5% |
| 4+ Person Household | 0 | 0.0% |
| Total Housing Units | 166 | 100.0% |
Occupancy by Ownership by Household Size in Cumberland
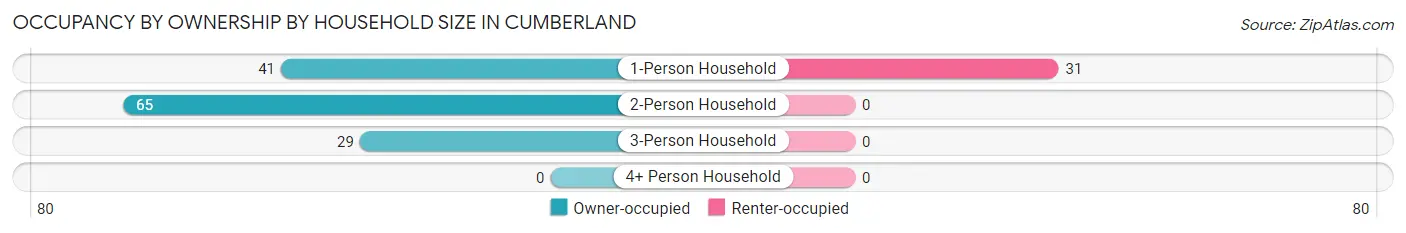
| Household Size | Owner-occupied | Renter-occupied |
| 1-Person Household | 41 (56.9%) | 31 (43.1%) |
| 2-Person Household | 65 (100.0%) | 0 (0.0%) |
| 3-Person Household | 29 (100.0%) | 0 (0.0%) |
| 4+ Person Household | 0 (0.0%) | 0 (0.0%) |
| Total Housing Units | 135 (81.3%) | 31 (18.7%) |
Occupancy by Educational Attainment in Cumberland
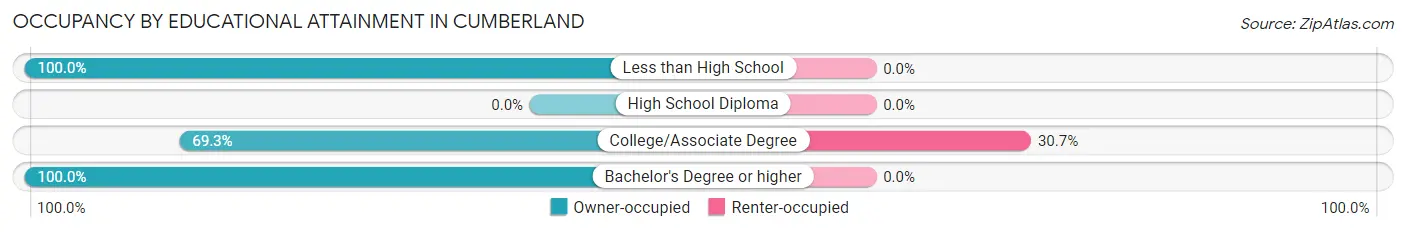
| Household Size | Owner-occupied | Renter-occupied |
| Less than High School | 22 (100.0%) | 0 (0.0%) |
| High School Diploma | 0 (0.0%) | 0 (0.0%) |
| College/Associate Degree | 70 (69.3%) | 31 (30.7%) |
| Bachelor's Degree or higher | 43 (100.0%) | 0 (0.0%) |
Occupancy by Age of Householder in Cumberland
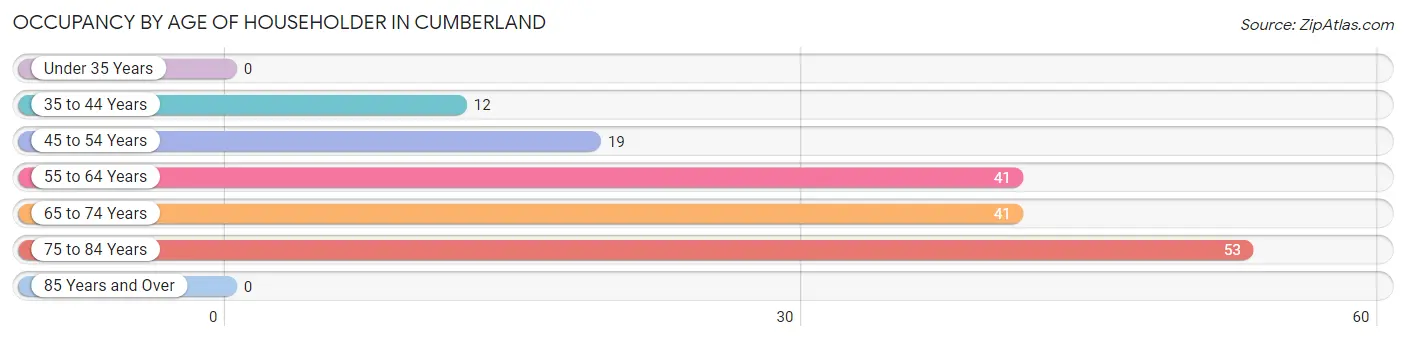
| Age Bracket | # Households | % Households |
| Under 35 Years | 0 | 0.0% |
| 35 to 44 Years | 12 | 7.2% |
| 45 to 54 Years | 19 | 11.5% |
| 55 to 64 Years | 41 | 24.7% |
| 65 to 74 Years | 41 | 24.7% |
| 75 to 84 Years | 53 | 31.9% |
| 85 Years and Over | 0 | 0.0% |
| Total | 166 | 100.0% |
Housing Finances in Cumberland
Median Income by Occupancy in Cumberland
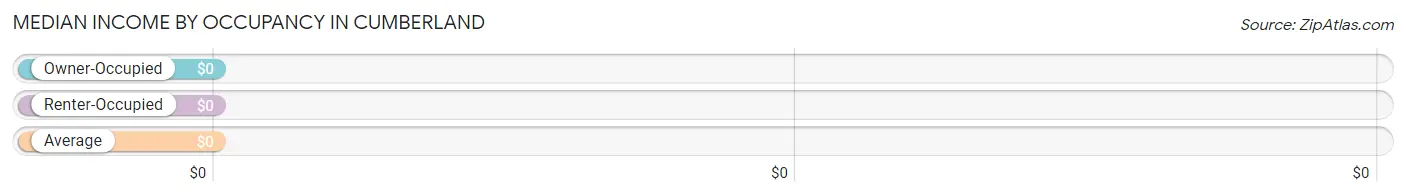
| Occupancy Type | # Households | Median Income |
| Owner-Occupied | 135 (81.3%) | $0 |
| Renter-Occupied | 31 (18.7%) | $0 |
| Average | 166 (100.0%) | $0 |
Occupancy by Householder Income Bracket in Cumberland
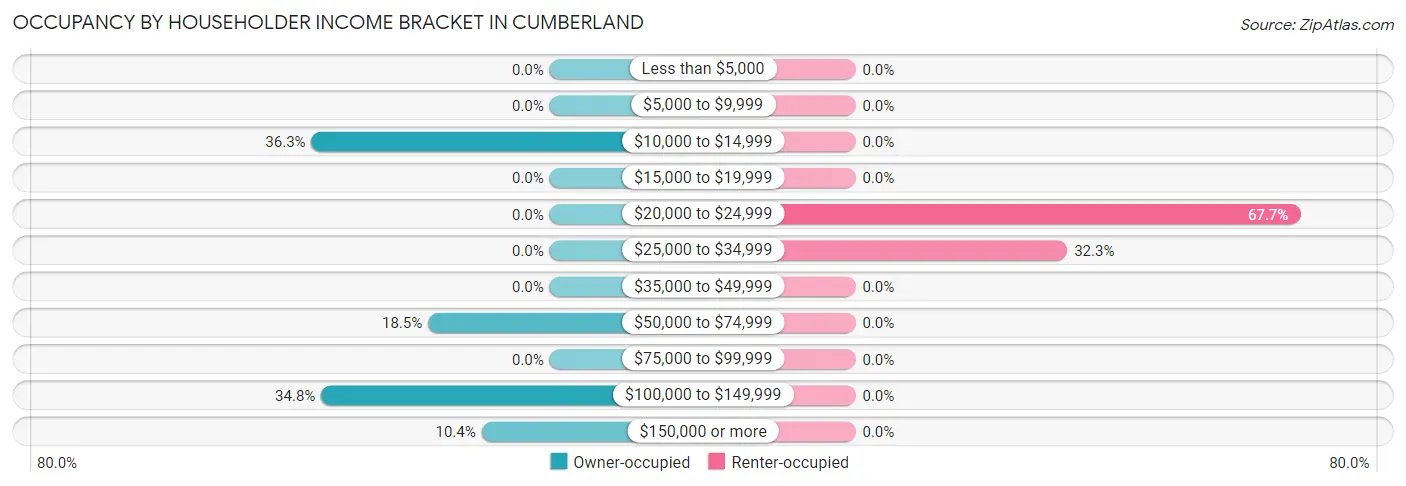
| Income Bracket | Owner-occupied | Renter-occupied |
| Less than $5,000 | 0 (0.0%) | 0 (0.0%) |
| $5,000 to $9,999 | 0 (0.0%) | 0 (0.0%) |
| $10,000 to $14,999 | 49 (36.3%) | 0 (0.0%) |
| $15,000 to $19,999 | 0 (0.0%) | 0 (0.0%) |
| $20,000 to $24,999 | 0 (0.0%) | 21 (67.7%) |
| $25,000 to $34,999 | 0 (0.0%) | 10 (32.3%) |
| $35,000 to $49,999 | 0 (0.0%) | 0 (0.0%) |
| $50,000 to $74,999 | 25 (18.5%) | 0 (0.0%) |
| $75,000 to $99,999 | 0 (0.0%) | 0 (0.0%) |
| $100,000 to $149,999 | 47 (34.8%) | 0 (0.0%) |
| $150,000 or more | 14 (10.4%) | 0 (0.0%) |
| Total | 135 (100.0%) | 31 (100.0%) |
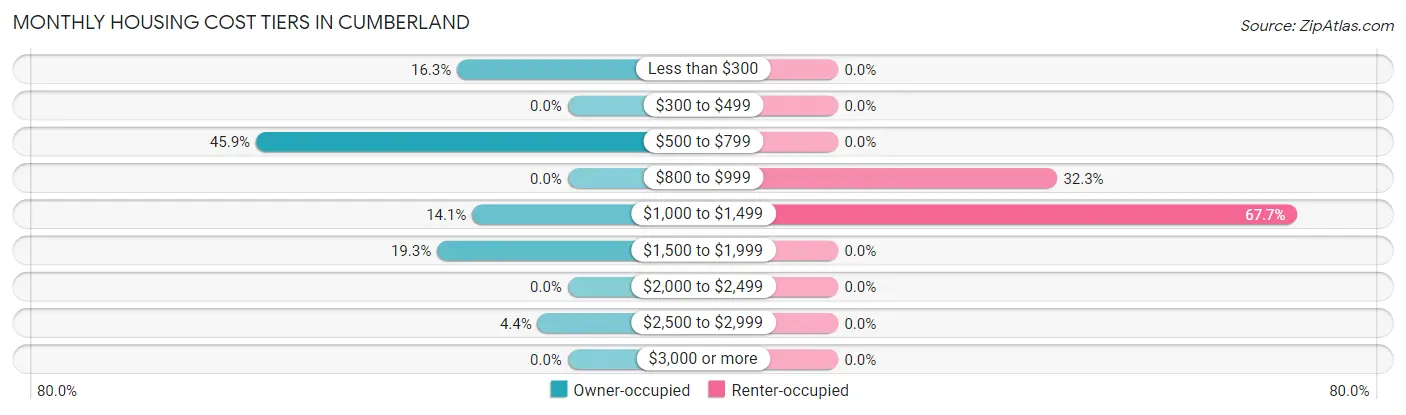
Monthly Housing Cost Tiers in Cumberland
| Monthly Cost | Owner-occupied | Renter-occupied |
| Less than $300 | 22 (16.3%) | 0 (0.0%) |
| $300 to $499 | 0 (0.0%) | 0 (0.0%) |
| $500 to $799 | 62 (45.9%) | 0 (0.0%) |
| $800 to $999 | 0 (0.0%) | 10 (32.3%) |
| $1,000 to $1,499 | 19 (14.1%) | 21 (67.7%) |
| $1,500 to $1,999 | 26 (19.3%) | 0 (0.0%) |
| $2,000 to $2,499 | 0 (0.0%) | 0 (0.0%) |
| $2,500 to $2,999 | 6 (4.4%) | 0 (0.0%) |
| $3,000 or more | 0 (0.0%) | 0 (0.0%) |
| Total | 135 (100.0%) | 31 (100.0%) |
Physical Housing Characteristics in Cumberland
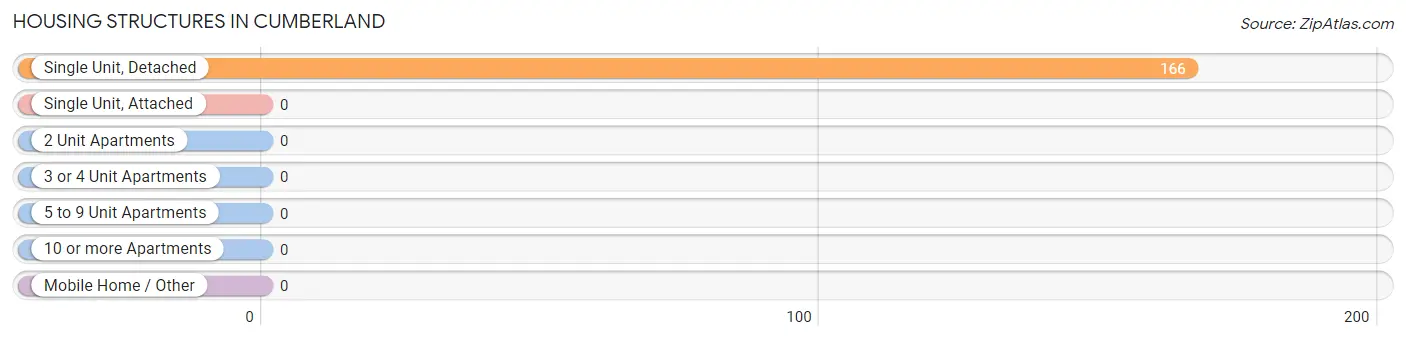
Housing Structures in Cumberland
| Structure Type | # Housing Units | % Housing Units |
| Single Unit, Detached | 166 | 100.0% |
| Single Unit, Attached | 0 | 0.0% |
| 2 Unit Apartments | 0 | 0.0% |
| 3 or 4 Unit Apartments | 0 | 0.0% |
| 5 to 9 Unit Apartments | 0 | 0.0% |
| 10 or more Apartments | 0 | 0.0% |
| Mobile Home / Other | 0 | 0.0% |
| Total | 166 | 100.0% |
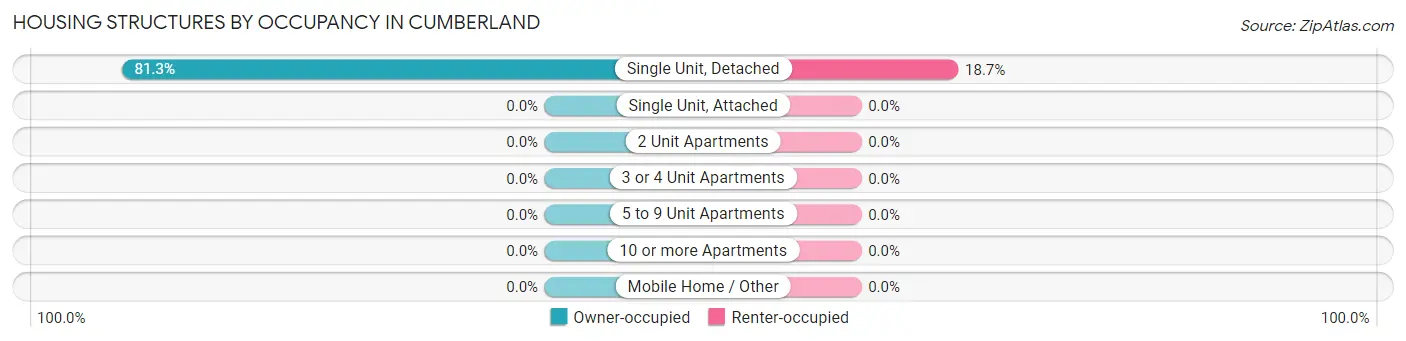
Housing Structures by Occupancy in Cumberland
| Structure Type | Owner-occupied | Renter-occupied |
| Single Unit, Detached | 135 (81.3%) | 31 (18.7%) |
| Single Unit, Attached | 0 (0.0%) | 0 (0.0%) |
| 2 Unit Apartments | 0 (0.0%) | 0 (0.0%) |
| 3 or 4 Unit Apartments | 0 (0.0%) | 0 (0.0%) |
| 5 to 9 Unit Apartments | 0 (0.0%) | 0 (0.0%) |
| 10 or more Apartments | 0 (0.0%) | 0 (0.0%) |
| Mobile Home / Other | 0 (0.0%) | 0 (0.0%) |
| Total | 135 (81.3%) | 31 (18.7%) |
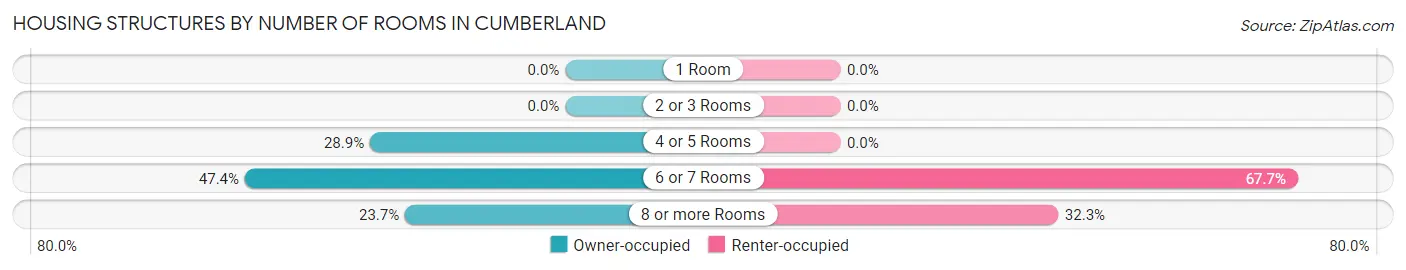
Housing Structures by Number of Rooms in Cumberland
| Number of Rooms | Owner-occupied | Renter-occupied |
| 1 Room | 0 (0.0%) | 0 (0.0%) |
| 2 or 3 Rooms | 0 (0.0%) | 0 (0.0%) |
| 4 or 5 Rooms | 39 (28.9%) | 0 (0.0%) |
| 6 or 7 Rooms | 64 (47.4%) | 21 (67.7%) |
| 8 or more Rooms | 32 (23.7%) | 10 (32.3%) |
| Total | 135 (100.0%) | 31 (100.0%) |
Housing Structure by Heating Type in Cumberland
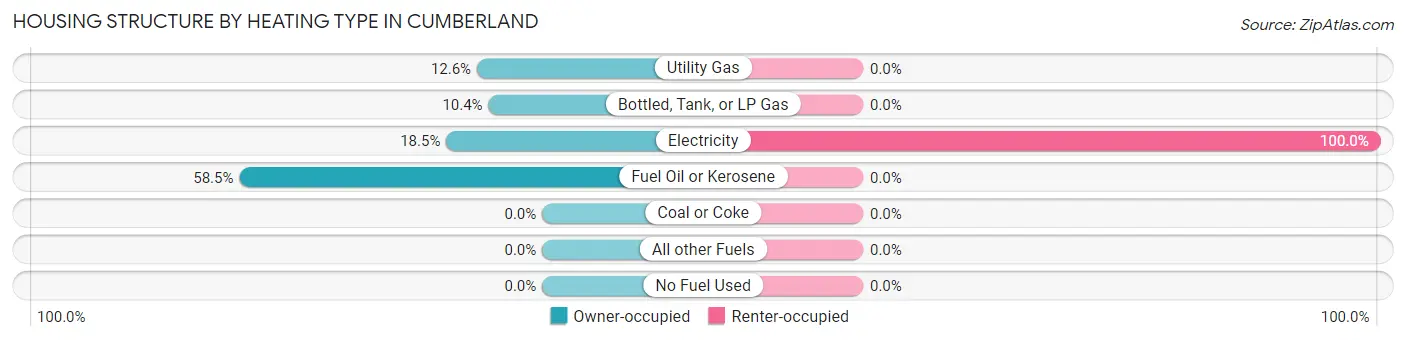
| Heating Type | Owner-occupied | Renter-occupied |
| Utility Gas | 17 (12.6%) | 0 (0.0%) |
| Bottled, Tank, or LP Gas | 14 (10.4%) | 0 (0.0%) |
| Electricity | 25 (18.5%) | 31 (100.0%) |
| Fuel Oil or Kerosene | 79 (58.5%) | 0 (0.0%) |
| Coal or Coke | 0 (0.0%) | 0 (0.0%) |
| All other Fuels | 0 (0.0%) | 0 (0.0%) |
| No Fuel Used | 0 (0.0%) | 0 (0.0%) |
| Total | 135 (100.0%) | 31 (100.0%) |
Household Vehicle Usage in Cumberland
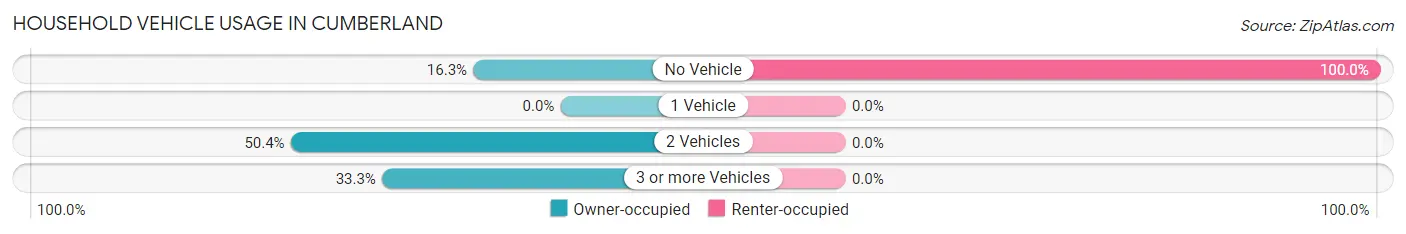
| Vehicles per Household | Owner-occupied | Renter-occupied |
| No Vehicle | 22 (16.3%) | 31 (100.0%) |
| 1 Vehicle | 0 (0.0%) | 0 (0.0%) |
| 2 Vehicles | 68 (50.4%) | 0 (0.0%) |
| 3 or more Vehicles | 45 (33.3%) | 0 (0.0%) |
| Total | 135 (100.0%) | 31 (100.0%) |
Real Estate & Mortgages in Cumberland
Real Estate and Mortgage Overview in Cumberland
| Characteristic | Without Mortgage | With Mortgage |
| Housing Units | 98 | 37 |
| Median Property Value | $131,900 | $229,800 |
| Median Household Income | - | - |
| Monthly Housing Costs | $544 | $0 |
| Real Estate Taxes | $1,386 | $0 |
Property Value by Mortgage Status in Cumberland
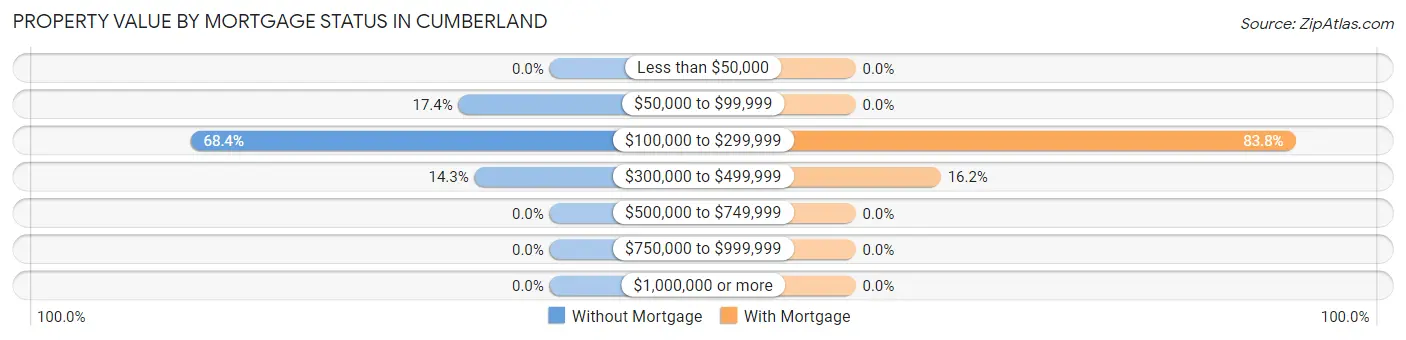
| Property Value | Without Mortgage | With Mortgage |
| Less than $50,000 | 0 (0.0%) | 0 (0.0%) |
| $50,000 to $99,999 | 17 (17.3%) | 0 (0.0%) |
| $100,000 to $299,999 | 67 (68.4%) | 31 (83.8%) |
| $300,000 to $499,999 | 14 (14.3%) | 6 (16.2%) |
| $500,000 to $749,999 | 0 (0.0%) | 0 (0.0%) |
| $750,000 to $999,999 | 0 (0.0%) | 0 (0.0%) |
| $1,000,000 or more | 0 (0.0%) | 0 (0.0%) |
| Total | 98 (100.0%) | 37 (100.0%) |
Household Income by Mortgage Status in Cumberland
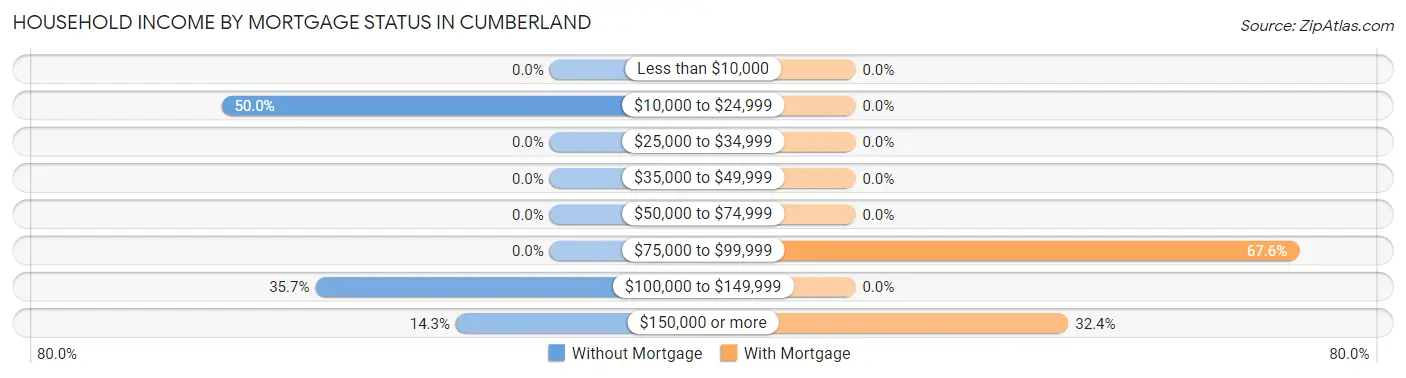
| Household Income | Without Mortgage | With Mortgage |
| Less than $10,000 | 0 (0.0%) | 0 (0.0%) |
| $10,000 to $24,999 | 49 (50.0%) | 0 (0.0%) |
| $25,000 to $34,999 | 0 (0.0%) | 0 (0.0%) |
| $35,000 to $49,999 | 0 (0.0%) | 0 (0.0%) |
| $50,000 to $74,999 | 0 (0.0%) | 0 (0.0%) |
| $75,000 to $99,999 | 0 (0.0%) | 25 (67.6%) |
| $100,000 to $149,999 | 35 (35.7%) | 0 (0.0%) |
| $150,000 or more | 14 (14.3%) | 12 (32.4%) |
| Total | 98 (100.0%) | 37 (100.0%) |
Property Value to Household Income Ratio in Cumberland
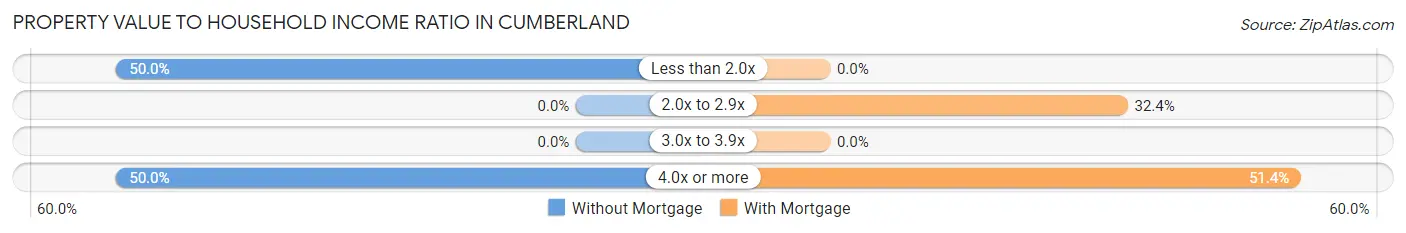
| Value-to-Income Ratio | Without Mortgage | With Mortgage |
| Less than 2.0x | 49 (50.0%) | 0 (0.0%) |
| 2.0x to 2.9x | 0 (0.0%) | 12 (32.4%) |
| 3.0x to 3.9x | 0 (0.0%) | 0 (0.0%) |
| 4.0x or more | 49 (50.0%) | 19 (51.3%) |
| Total | 98 (100.0%) | 37 (100.0%) |
Real Estate Taxes by Mortgage Status in Cumberland
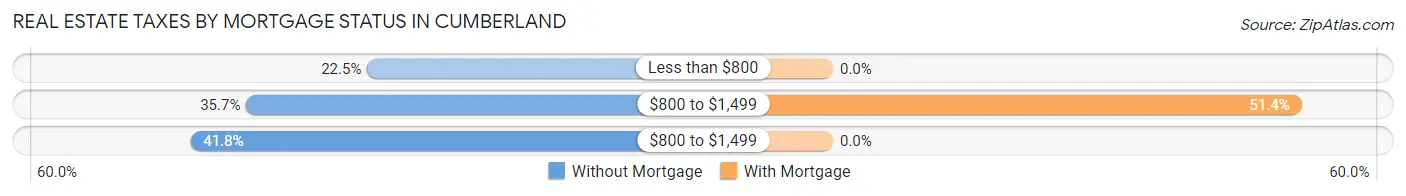
| Property Taxes | Without Mortgage | With Mortgage |
| Less than $800 | 22 (22.5%) | 0 (0.0%) |
| $800 to $1,499 | 35 (35.7%) | 19 (51.3%) |
| $800 to $1,499 | 41 (41.8%) | 0 (0.0%) |
| Total | 98 (100.0%) | 37 (100.0%) |
Health & Disability in Cumberland
Health Insurance Coverage by Age in Cumberland
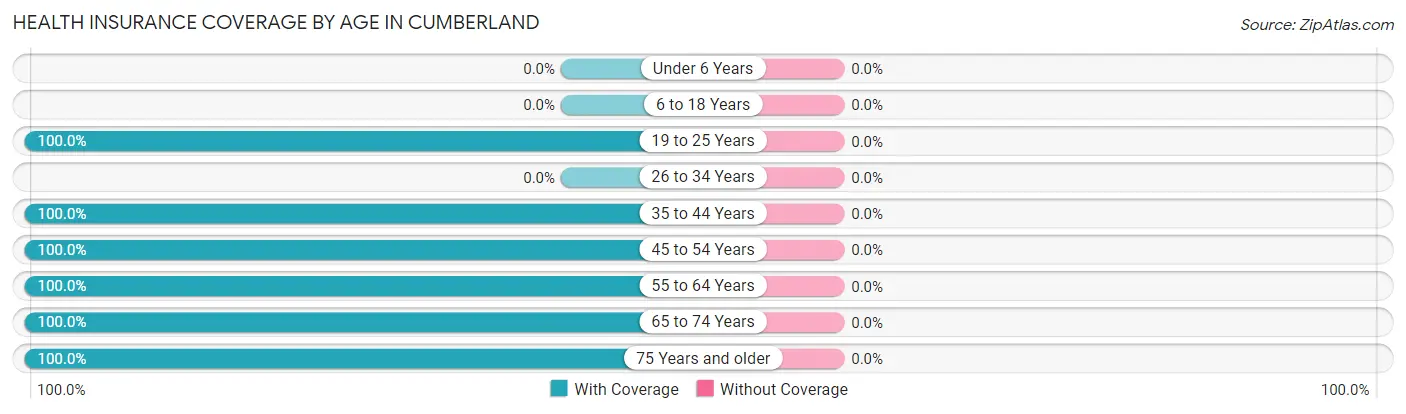
| Age Bracket | With Coverage | Without Coverage |
| Under 6 Years | 0 (0.0%) | 0 (0.0%) |
| 6 to 18 Years | 0 (0.0%) | 0 (0.0%) |
| 19 to 25 Years | 15 (100.0%) | 0 (0.0%) |
| 26 to 34 Years | 0 (0.0%) | 0 (0.0%) |
| 35 to 44 Years | 40 (100.0%) | 0 (0.0%) |
| 45 to 54 Years | 50 (100.0%) | 0 (0.0%) |
| 55 to 64 Years | 55 (100.0%) | 0 (0.0%) |
| 65 to 74 Years | 92 (100.0%) | 0 (0.0%) |
| 75 Years and older | 82 (100.0%) | 0 (0.0%) |
| Total | 334 (100.0%) | 0 (0.0%) |
Health Insurance Coverage by Citizenship Status in Cumberland
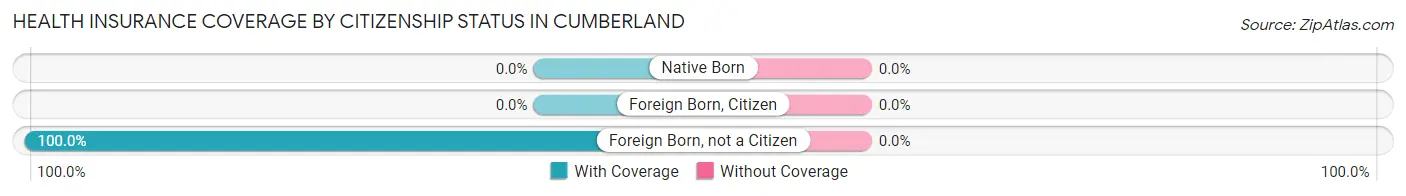
| Citizenship Status | With Coverage | Without Coverage |
| Native Born | 0 (0.0%) | 0 (0.0%) |
| Foreign Born, Citizen | 0 (0.0%) | 0 (0.0%) |
| Foreign Born, not a Citizen | 15 (100.0%) | 0 (0.0%) |
Health Insurance Coverage by Household Income in Cumberland
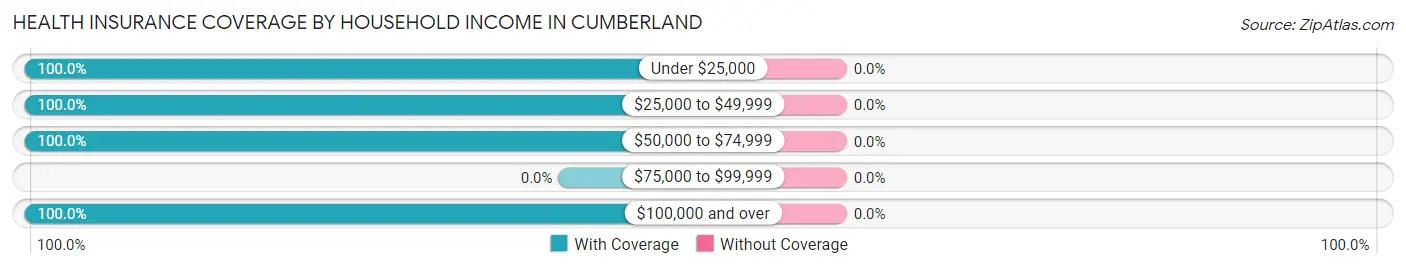
| Household Income | With Coverage | Without Coverage |
| Under $25,000 | 89 (100.0%) | 0 (0.0%) |
| $25,000 to $49,999 | 10 (100.0%) | 0 (0.0%) |
| $50,000 to $74,999 | 30 (100.0%) | 0 (0.0%) |
| $75,000 to $99,999 | 0 (0.0%) | 0 (0.0%) |
| $100,000 and over | 205 (100.0%) | 0 (0.0%) |
Public vs Private Health Insurance Coverage by Age in Cumberland
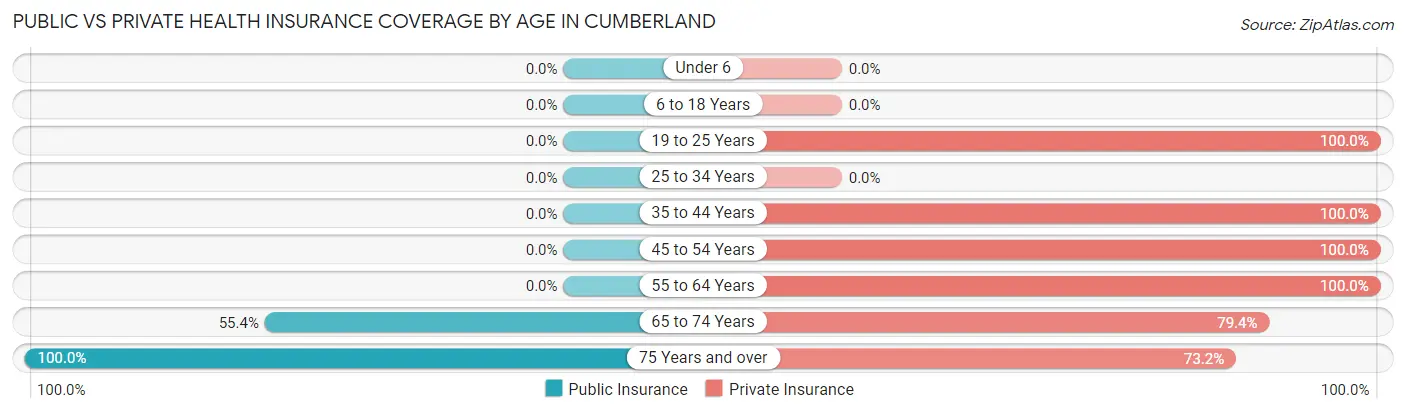
| Age Bracket | Public Insurance | Private Insurance |
| Under 6 | 0 (0.0%) | 0 (0.0%) |
| 6 to 18 Years | 0 (0.0%) | 0 (0.0%) |
| 19 to 25 Years | 0 (0.0%) | 15 (100.0%) |
| 25 to 34 Years | 0 (0.0%) | 0 (0.0%) |
| 35 to 44 Years | 0 (0.0%) | 40 (100.0%) |
| 45 to 54 Years | 0 (0.0%) | 50 (100.0%) |
| 55 to 64 Years | 0 (0.0%) | 55 (100.0%) |
| 65 to 74 Years | 51 (55.4%) | 73 (79.3%) |
| 75 Years and over | 82 (100.0%) | 60 (73.2%) |
| Total | 133 (39.8%) | 293 (87.7%) |
Disability Status by Sex by Age in Cumberland
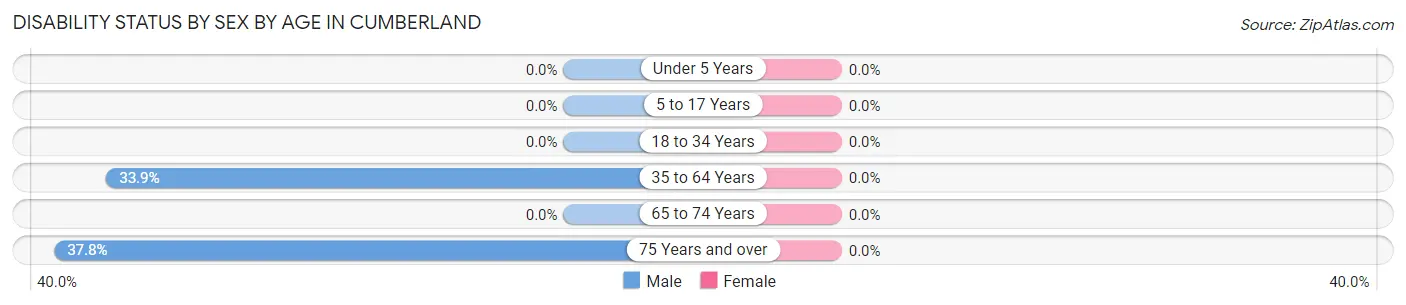
| Age Bracket | Male | Female |
| Under 5 Years | 0 (0.0%) | 0 (0.0%) |
| 5 to 17 Years | 0 (0.0%) | 0 (0.0%) |
| 18 to 34 Years | 0 (0.0%) | 0 (0.0%) |
| 35 to 64 Years | 19 (33.9%) | 0 (0.0%) |
| 65 to 74 Years | 0 (0.0%) | 0 (0.0%) |
| 75 Years and over | 31 (37.8%) | 0 (0.0%) |
Disability Class by Sex by Age in Cumberland
Disability Class: Hearing Difficulty
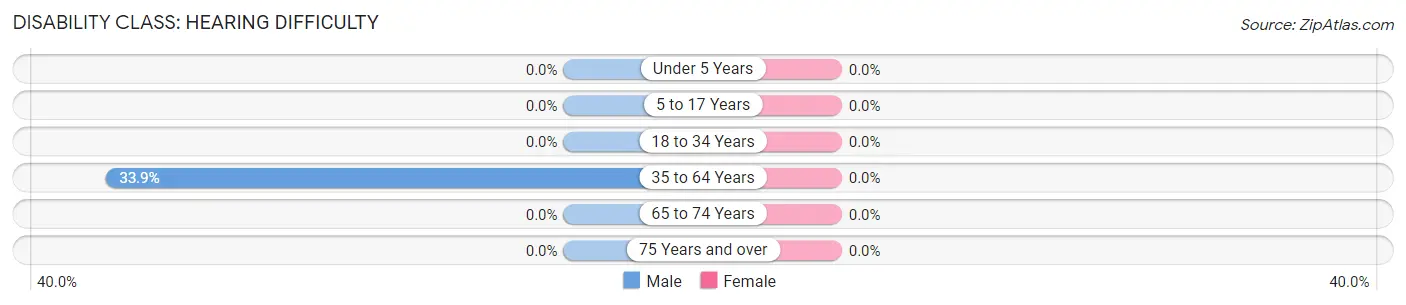
| Age Bracket | Male | Female |
| Under 5 Years | 0 (0.0%) | 0 (0.0%) |
| 5 to 17 Years | 0 (0.0%) | 0 (0.0%) |
| 18 to 34 Years | 0 (0.0%) | 0 (0.0%) |
| 35 to 64 Years | 19 (33.9%) | 0 (0.0%) |
| 65 to 74 Years | 0 (0.0%) | 0 (0.0%) |
| 75 Years and over | 0 (0.0%) | 0 (0.0%) |
Disability Class: Vision Difficulty
| Age Bracket | Male | Female |
| Under 5 Years | 0 (0.0%) | 0 (0.0%) |
| 5 to 17 Years | 0 (0.0%) | 0 (0.0%) |
| 18 to 34 Years | 0 (0.0%) | 0 (0.0%) |
| 35 to 64 Years | 0 (0.0%) | 0 (0.0%) |
| 65 to 74 Years | 0 (0.0%) | 0 (0.0%) |
| 75 Years and over | 0 (0.0%) | 0 (0.0%) |
Disability Class: Cognitive Difficulty

| Age Bracket | Male | Female |
| 5 to 17 Years | 0 (0.0%) | 0 (0.0%) |
| 18 to 34 Years | 0 (0.0%) | 0 (0.0%) |
| 35 to 64 Years | 0 (0.0%) | 0 (0.0%) |
| 65 to 74 Years | 0 (0.0%) | 0 (0.0%) |
| 75 Years and over | 0 (0.0%) | 0 (0.0%) |
Disability Class: Ambulatory Difficulty
| Age Bracket | Male | Female |
| 5 to 17 Years | 0 (0.0%) | 0 (0.0%) |
| 18 to 34 Years | 0 (0.0%) | 0 (0.0%) |
| 35 to 64 Years | 0 (0.0%) | 0 (0.0%) |
| 65 to 74 Years | 0 (0.0%) | 0 (0.0%) |
| 75 Years and over | 31 (37.8%) | 0 (0.0%) |
Disability Class: Self-Care Difficulty
| Age Bracket | Male | Female |
| 5 to 17 Years | 0 (0.0%) | 0 (0.0%) |
| 18 to 34 Years | 0 (0.0%) | 0 (0.0%) |
| 35 to 64 Years | 0 (0.0%) | 0 (0.0%) |
| 65 to 74 Years | 0 (0.0%) | 0 (0.0%) |
| 75 Years and over | 0 (0.0%) | 0 (0.0%) |
Technology Access in Cumberland
Computing Device Access in Cumberland
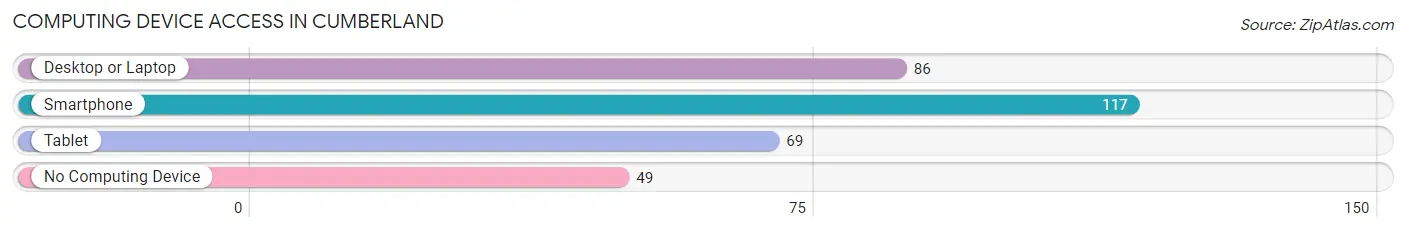
| Device Type | # Households | % Households |
| Desktop or Laptop | 86 | 51.8% |
| Smartphone | 117 | 70.5% |
| Tablet | 69 | 41.6% |
| No Computing Device | 49 | 29.5% |
| Total | 166 | 100.0% |
Internet Access in Cumberland
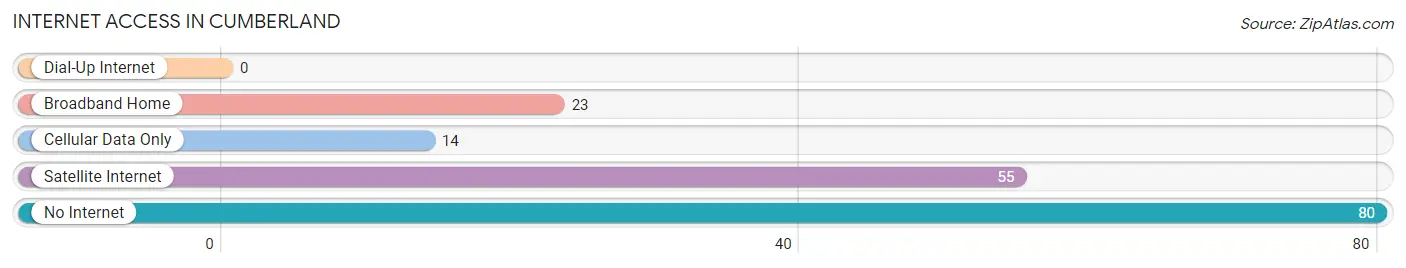
| Internet Type | # Households | % Households |
| Dial-Up Internet | 0 | 0.0% |
| Broadband Home | 23 | 13.9% |
| Cellular Data Only | 14 | 8.4% |
| Satellite Internet | 55 | 33.1% |
| No Internet | 80 | 48.2% |
| Total | 166 | 100.0% |
Cumberland Summary
Cumberland, Virginia is a small town located in the south-central part of the state, in the foothills of the Blue Ridge Mountains. It is part of the Cumberland Plateau, a region of rolling hills and valleys that stretches from southwestern Virginia to northeastern Tennessee. The town is situated on the banks of the North Fork of the Holston River, and is surrounded by the George Washington and Jefferson National Forests.
History
Cumberland was first settled in 1750 by a group of settlers from Pennsylvania. The town was named after the Duke of Cumberland, who had recently defeated the Jacobite forces in Scotland. The town was incorporated in 1786, and quickly became a center of commerce and industry. The town was home to a number of mills, including a grist mill, a saw mill, and a woolen mill. The town also had a number of stores, a post office, and a school.
In the early 19th century, Cumberland was a major stop on the Great Road, a major thoroughfare that connected the Shenandoah Valley to the rest of the state. The town was also a major stop on the Virginia and Tennessee Railroad, which connected the town to the rest of the state.
Geography
Cumberland is located in the south-central part of Virginia, in the foothills of the Blue Ridge Mountains. The town is situated on the banks of the North Fork of the Holston River, and is surrounded by the George Washington and Jefferson National Forests. The town is located at an elevation of 1,400 feet, and has a total area of 1.3 square miles.
The climate in Cumberland is humid subtropical, with hot, humid summers and mild winters. The average annual temperature is 57 degrees Fahrenheit, and the average annual precipitation is 43 inches.
Economy
The economy of Cumberland is largely based on agriculture and tourism. The town is home to a number of farms, which produce a variety of crops, including corn, soybeans, wheat, and hay. The town is also home to a number of tourist attractions, including the Cumberland Gap National Historical Park, the Cumberland Gap Visitor Center, and the Cumberland Gap Museum.
Demographics
As of the 2010 census, the population of Cumberland was 1,845. The racial makeup of the town was 95.3% White, 1.2% African American, 0.3% Native American, 0.2% Asian, 0.1% Pacific Islander, and 2.9% from other races. The median household income was $30,938, and the median family income was $37,813. The per capita income was $17,845.
Conclusion
Cumberland, Virginia is a small town located in the south-central part of the state, in the foothills of the Blue Ridge Mountains. It is part of the Cumberland Plateau, a region of rolling hills and valleys that stretches from southwestern Virginia to northeastern Tennessee. The town was first settled in 1750, and has since become a center of commerce and industry. The economy of Cumberland is largely based on agriculture and tourism, and the town is home to a number of tourist attractions. As of the 2010 census, the population of Cumberland was 1,845.
Common Questions
What is Per Capita Income in Cumberland?
Per Capita income in Cumberland is $42,950.
What is the Median Family Income in Cumberland?
Median Family Income in Cumberland is $104,444.
What is Inequality or Gini Index in Cumberland?
Inequality or Gini Index in Cumberland is 0.50.
What is the Total Population of Cumberland?
Total Population of Cumberland is 334.
What is the Total Male Population of Cumberland?
Total Male Population of Cumberland is 218.
What is the Total Female Population of Cumberland?
Total Female Population of Cumberland is 116.
What is the Ratio of Males per 100 Females in Cumberland?
There are 187.93 Males per 100 Females in Cumberland.
What is the Ratio of Females per 100 Males in Cumberland?
There are 53.21 Females per 100 Males in Cumberland.
What is the Median Population Age in Cumberland?
Median Population Age in Cumberland is 66.5 Years.
What is the Average Family Size in Cumberland
Average Family Size in Cumberland is 2.8 People.
What is the Average Household Size in Cumberland
Average Household Size in Cumberland is 2.0 People.
How Large is the Labor Force in Cumberland?
There are 168 People in the Labor Forcein in Cumberland.
What is the Percentage of People in the Labor Force in Cumberland?
50.3% of People are in the Labor Force in Cumberland.
What is the Unemployment Rate in Cumberland?
Unemployment Rate in Cumberland is 8.9%.