Crewe, VA Map & Demographics
Crewe Map
Crewe Overview
$24,445
PER CAPITA INCOME
$55,978
AVG FAMILY INCOME
$47,359
AVG HOUSEHOLD INCOME
31.8%
WAGE / INCOME GAP [ % ]
68.2¢/ $1
WAGE / INCOME GAP [ $ ]
0.39
INEQUALITY / GINI INDEX
2,931
TOTAL POPULATION
1,386
MALE POPULATION
1,545
FEMALE POPULATION
89.71
MALES / 100 FEMALES
111.47
FEMALES / 100 MALES
31.5
MEDIAN AGE
3.3
AVG FAMILY SIZE
2.5
AVG HOUSEHOLD SIZE
1,393
LABOR FORCE [ PEOPLE ]
64.4%
PERCENT IN LABOR FORCE
9.0%
UNEMPLOYMENT RATE
Crewe Zip Codes
Crewe Area Codes
Income in Crewe
Income Overview in Crewe
Per Capita Income in Crewe is $24,445, while median incomes of families and households are $55,978 and $47,359 respectively.
| Characteristic | Number | Measure |
| Per Capita Income | 2,931 | $24,445 |
| Median Family Income | 694 | $55,978 |
| Mean Family Income | 694 | $69,555 |
| Median Household Income | 1,186 | $47,359 |
| Mean Household Income | 1,186 | $58,166 |
| Income Deficit | 694 | $0 |
| Wage / Income Gap (%) | 2,931 | 31.76% |
| Wage / Income Gap ($) | 2,931 | 68.24¢ per $1 |
| Gini / Inequality Index | 2,931 | 0.39 |
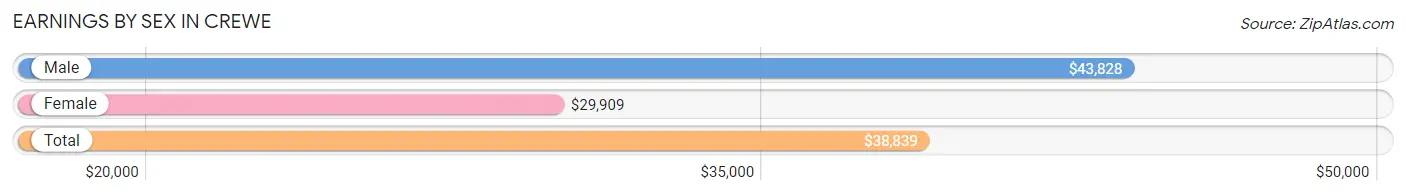
Earnings by Sex in Crewe
Average Earnings in Crewe are $38,839, $43,828 for men and $29,909 for women, a difference of 31.8%.
| Sex | Number | Average Earnings |
| Male | 781 (55.4%) | $43,828 |
| Female | 629 (44.6%) | $29,909 |
| Total | 1,410 (100.0%) | $38,839 |
Earnings by Sex by Income Bracket in Crewe
The most common earnings brackets in Crewe are $75,000 to $99,999 for men (128 | 16.4%) and $22,500 to $24,999 for women (68 | 10.8%).

| Income | Male | Female |
| $2,499 or less | 59 (7.5%) | 50 (8.0%) |
| $2,500 to $4,999 | 6 (0.8%) | 0 (0.0%) |
| $5,000 to $7,499 | 0 (0.0%) | 21 (3.3%) |
| $7,500 to $9,999 | 0 (0.0%) | 0 (0.0%) |
| $10,000 to $12,499 | 7 (0.9%) | 7 (1.1%) |
| $12,500 to $14,999 | 61 (7.8%) | 25 (4.0%) |
| $15,000 to $17,499 | 0 (0.0%) | 21 (3.3%) |
| $17,500 to $19,999 | 14 (1.8%) | 41 (6.5%) |
| $20,000 to $22,499 | 16 (2.1%) | 37 (5.9%) |
| $22,500 to $24,999 | 56 (7.2%) | 68 (10.8%) |
| $25,000 to $29,999 | 62 (7.9%) | 46 (7.3%) |
| $30,000 to $34,999 | 36 (4.6%) | 27 (4.3%) |
| $35,000 to $39,999 | 16 (2.1%) | 55 (8.7%) |
| $40,000 to $44,999 | 65 (8.3%) | 13 (2.1%) |
| $45,000 to $49,999 | 56 (7.2%) | 58 (9.2%) |
| $50,000 to $54,999 | 64 (8.2%) | 62 (9.9%) |
| $55,000 to $64,999 | 36 (4.6%) | 14 (2.2%) |
| $65,000 to $74,999 | 73 (9.3%) | 30 (4.8%) |
| $75,000 to $99,999 | 128 (16.4%) | 47 (7.5%) |
| $100,000+ | 26 (3.3%) | 7 (1.1%) |
| Total | 781 (100.0%) | 629 (100.0%) |
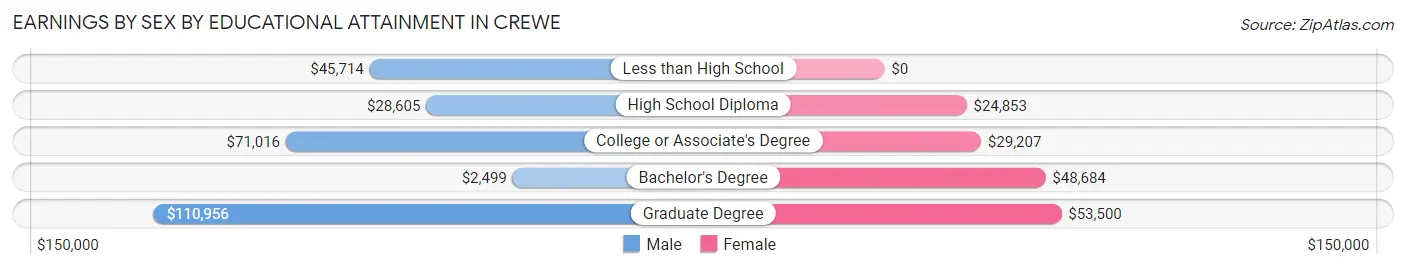
Earnings by Sex by Educational Attainment in Crewe
Average earnings in Crewe are $45,771 for men and $34,000 for women, a difference of 25.7%. Men with an educational attainment of graduate degree enjoy the highest average annual earnings of $110,956, while those with bachelor's degree education earn the least with $2,499. Women with an educational attainment of graduate degree earn the most with the average annual earnings of $53,500, while those with high school diploma education have the smallest earnings of $24,853.
| Educational Attainment | Male Income | Female Income |
| Less than High School | $45,714 | $0 |
| High School Diploma | $28,605 | $24,853 |
| College or Associate's Degree | $71,016 | $29,207 |
| Bachelor's Degree | $2,499 | $48,684 |
| Graduate Degree | $110,956 | $53,500 |
| Total | $45,771 | $34,000 |
Family Income in Crewe
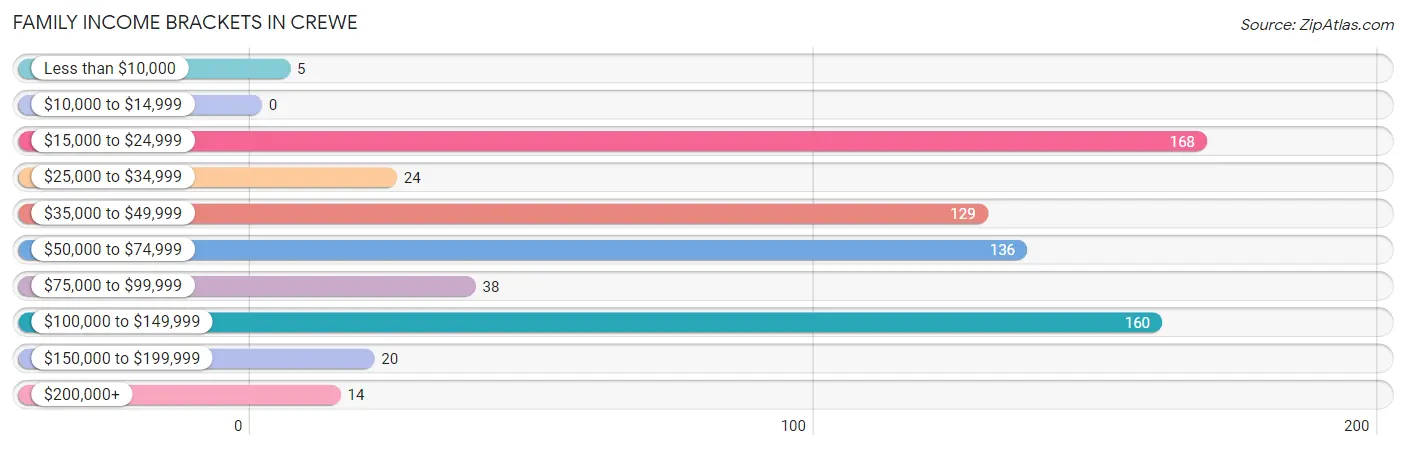
Family Income Brackets in Crewe
According to the Crewe family income data, there are 168 families falling into the $15,000 to $24,999 income range, which is the most common income bracket and makes up 24.2% of all families.
| Income Bracket | # Families | % Families |
| Less than $10,000 | 5 | 0.7% |
| $10,000 to $14,999 | 0 | 0.0% |
| $15,000 to $24,999 | 168 | 24.2% |
| $25,000 to $34,999 | 24 | 3.5% |
| $35,000 to $49,999 | 129 | 18.6% |
| $50,000 to $74,999 | 136 | 19.6% |
| $75,000 to $99,999 | 38 | 5.5% |
| $100,000 to $149,999 | 160 | 23.1% |
| $150,000 to $199,999 | 20 | 2.9% |
| $200,000+ | 14 | 2.0% |
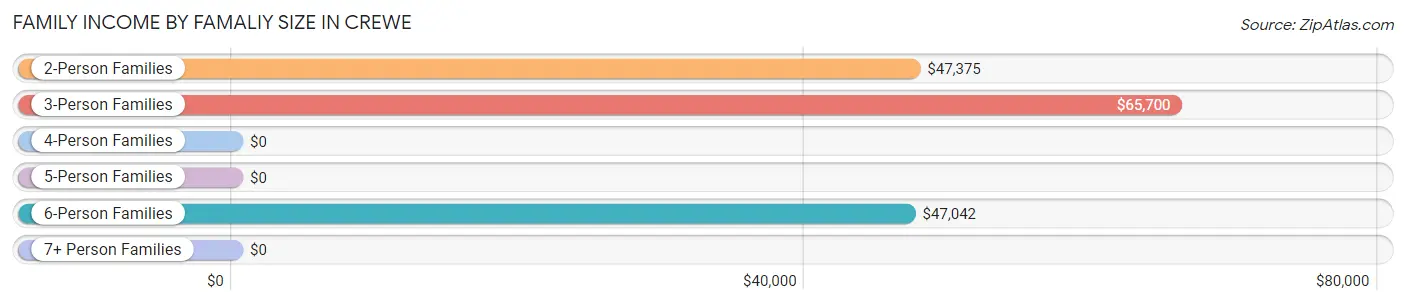
Family Income by Famaliy Size in Crewe
3-person families (140 | 20.2%) account for the highest median family income in Crewe with $65,700 per family, while 2-person families (380 | 54.8%) have the highest median income of $23,688 per family member.
| Income Bracket | # Families | Median Income |
| 2-Person Families | 380 (54.8%) | $47,375 |
| 3-Person Families | 140 (20.2%) | $65,700 |
| 4-Person Families | 103 (14.8%) | $0 |
| 5-Person Families | 9 (1.3%) | $0 |
| 6-Person Families | 49 (7.1%) | $47,042 |
| 7+ Person Families | 13 (1.9%) | $0 |
| Total | 694 (100.0%) | $55,978 |
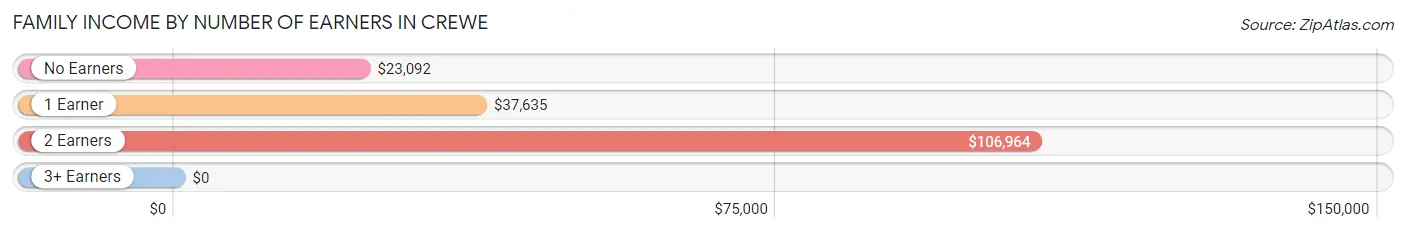
Family Income by Number of Earners in Crewe
| Number of Earners | # Families | Median Income |
| No Earners | 77 (11.1%) | $23,092 |
| 1 Earner | 330 (47.5%) | $37,635 |
| 2 Earners | 224 (32.3%) | $106,964 |
| 3+ Earners | 63 (9.1%) | $0 |
| Total | 694 (100.0%) | $55,978 |
Household Income in Crewe
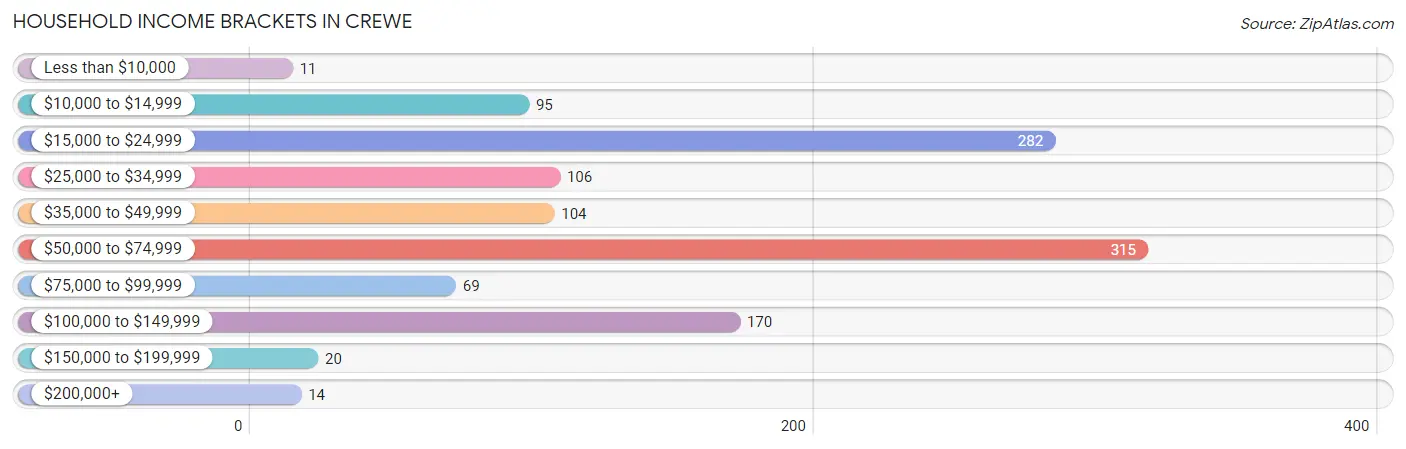
Household Income Brackets in Crewe
With 315 households falling in the category, the $50,000 to $74,999 income range is the most frequent in Crewe, accounting for 26.6% of all households. In contrast, only 11 households (0.9%) fall into the less than $10,000 income bracket, making it the least populous group.
| Income Bracket | # Households | % Households |
| Less than $10,000 | 11 | 0.9% |
| $10,000 to $14,999 | 95 | 8.0% |
| $15,000 to $24,999 | 282 | 23.8% |
| $25,000 to $34,999 | 106 | 8.9% |
| $35,000 to $49,999 | 104 | 8.8% |
| $50,000 to $74,999 | 315 | 26.6% |
| $75,000 to $99,999 | 69 | 5.8% |
| $100,000 to $149,999 | 170 | 14.3% |
| $150,000 to $199,999 | 20 | 1.7% |
| $200,000+ | 14 | 1.2% |
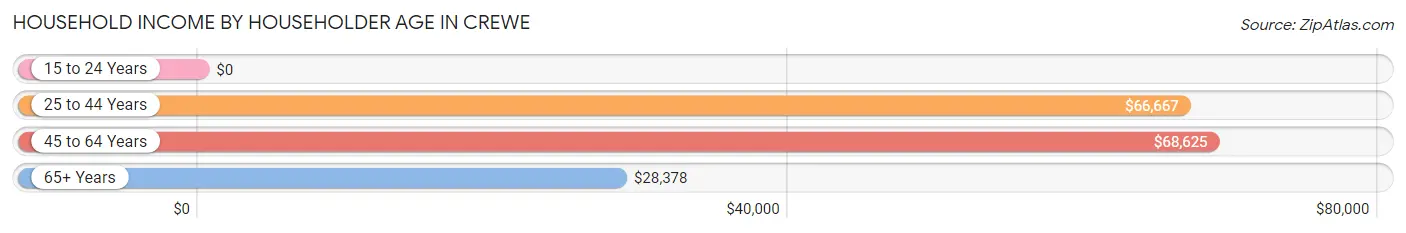
Household Income by Householder Age in Crewe
The median household income in Crewe is $47,359, with the highest median household income of $68,625 found in the 45 to 64 years age bracket for the primary householder. A total of 350 households (29.5%) fall into this category. Meanwhile, the 15 to 24 years age bracket for the primary householder has the lowest median household income of $0, with 35 households (2.9%) in this group.
| Income Bracket | # Households | Median Income |
| 15 to 24 Years | 35 (2.9%) | $0 |
| 25 to 44 Years | 474 (40.0%) | $66,667 |
| 45 to 64 Years | 350 (29.5%) | $68,625 |
| 65+ Years | 327 (27.6%) | $28,378 |
| Total | 1,186 (100.0%) | $47,359 |
Poverty in Crewe
Income Below Poverty by Sex and Age in Crewe
With 12.6% poverty level for males and 20.7% for females among the residents of Crewe, 18 to 24 year old males and 65 to 74 year old females are the most vulnerable to poverty, with 19 males (28.4%) and 95 females (54.6%) in their respective age groups living below the poverty level.
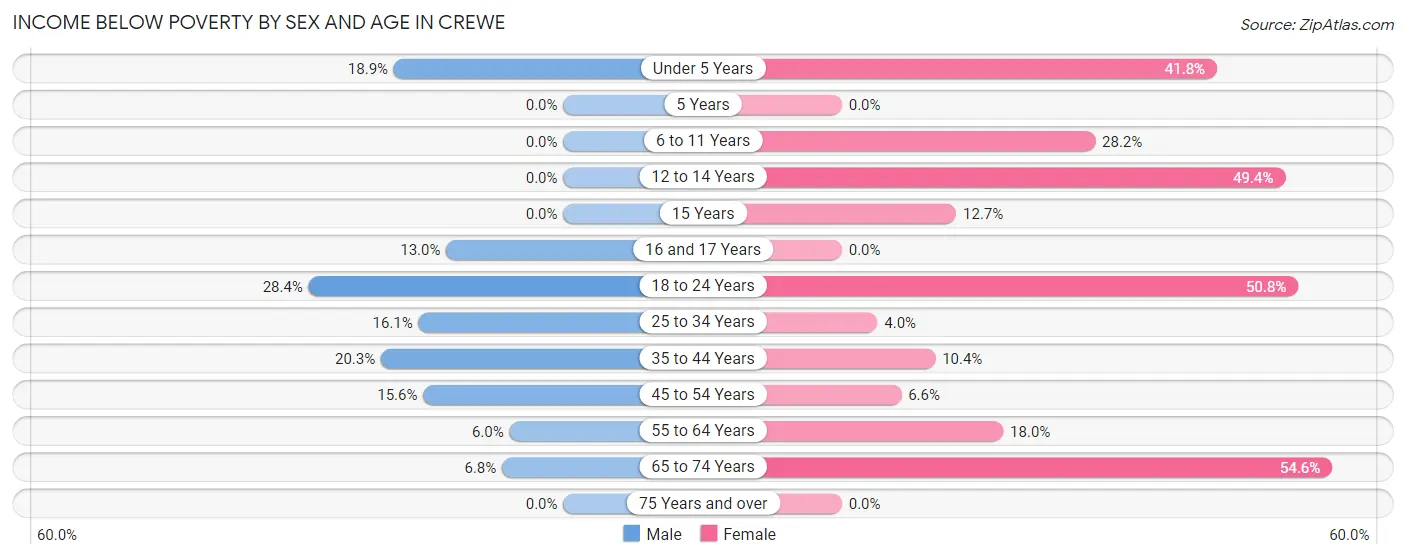
| Age Bracket | Male | Female |
| Under 5 Years | 20 (18.9%) | 33 (41.8%) |
| 5 Years | 0 (0.0%) | 0 (0.0%) |
| 6 to 11 Years | 0 (0.0%) | 22 (28.2%) |
| 12 to 14 Years | 0 (0.0%) | 40 (49.4%) |
| 15 Years | 0 (0.0%) | 7 (12.7%) |
| 16 and 17 Years | 6 (13.0%) | 0 (0.0%) |
| 18 to 24 Years | 19 (28.4%) | 62 (50.8%) |
| 25 to 34 Years | 59 (16.1%) | 8 (4.0%) |
| 35 to 44 Years | 40 (20.3%) | 21 (10.4%) |
| 45 to 54 Years | 17 (15.6%) | 9 (6.6%) |
| 55 to 64 Years | 10 (6.0%) | 23 (18.0%) |
| 65 to 74 Years | 3 (6.8%) | 95 (54.6%) |
| 75 Years and over | 0 (0.0%) | 0 (0.0%) |
| Total | 174 (12.6%) | 320 (20.7%) |
Income Above Poverty by Sex and Age in Crewe
According to the poverty statistics in Crewe, males aged 5 years and females aged 5 years are the age groups that are most secure financially, with 100.0% of males and 100.0% of females in these age groups living above the poverty line.
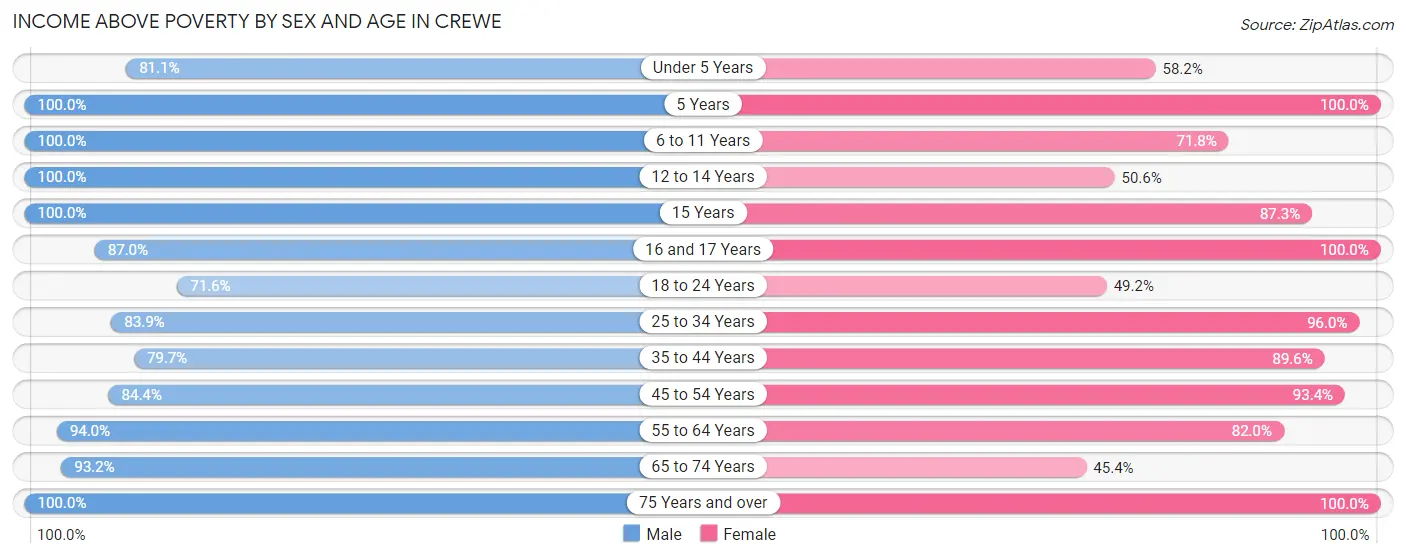
| Age Bracket | Male | Female |
| Under 5 Years | 86 (81.1%) | 46 (58.2%) |
| 5 Years | 39 (100.0%) | 116 (100.0%) |
| 6 to 11 Years | 109 (100.0%) | 56 (71.8%) |
| 12 to 14 Years | 65 (100.0%) | 41 (50.6%) |
| 15 Years | 35 (100.0%) | 48 (87.3%) |
| 16 and 17 Years | 40 (87.0%) | 42 (100.0%) |
| 18 to 24 Years | 48 (71.6%) | 60 (49.2%) |
| 25 to 34 Years | 307 (83.9%) | 194 (96.0%) |
| 35 to 44 Years | 157 (79.7%) | 181 (89.6%) |
| 45 to 54 Years | 92 (84.4%) | 127 (93.4%) |
| 55 to 64 Years | 157 (94.0%) | 105 (82.0%) |
| 65 to 74 Years | 41 (93.2%) | 79 (45.4%) |
| 75 Years and over | 31 (100.0%) | 130 (100.0%) |
| Total | 1,207 (87.4%) | 1,225 (79.3%) |
Income Below Poverty Among Married-Couple Families in Crewe
The poverty statistics for married-couple families in Crewe show that 10.9% or 38 of the total 348 families live below the poverty line. Families with 1 or 2 children have the highest poverty rate of 32.8%, comprising of 38 families. On the other hand, families with no children have the lowest poverty rate of 0.0%, which includes 0 families.
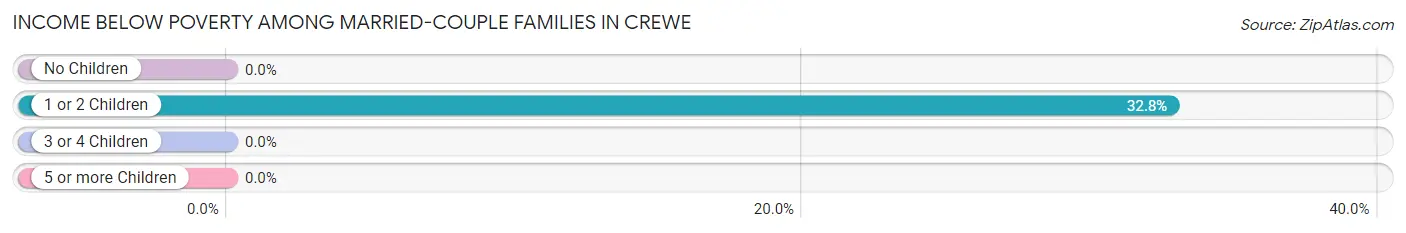
| Children | Above Poverty | Below Poverty |
| No Children | 175 (100.0%) | 0 (0.0%) |
| 1 or 2 Children | 78 (67.2%) | 38 (32.8%) |
| 3 or 4 Children | 44 (100.0%) | 0 (0.0%) |
| 5 or more Children | 13 (100.0%) | 0 (0.0%) |
| Total | 310 (89.1%) | 38 (10.9%) |
Income Below Poverty Among Single-Parent Households in Crewe
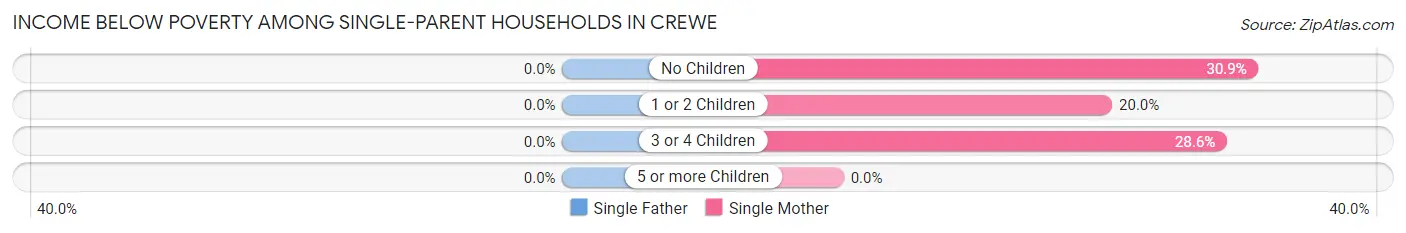
| Children | Single Father | Single Mother |
| No Children | 0 (0.0%) | 34 (30.9%) |
| 1 or 2 Children | 0 (0.0%) | 20 (20.0%) |
| 3 or 4 Children | 0 (0.0%) | 8 (28.6%) |
| 5 or more Children | 0 (0.0%) | 0 (0.0%) |
| Total | 0 (0.0%) | 62 (26.1%) |
Income Below Poverty Among Married-Couple vs Single-Parent Households in Crewe
The poverty data for Crewe shows that 38 of the married-couple family households (10.9%) and 62 of the single-parent households (17.9%) are living below the poverty level. Within the married-couple family households, those with 1 or 2 children have the highest poverty rate, with 38 households (32.8%) falling below the poverty line. Among the single-parent households, those with 3 or 4 children have the highest poverty rate, with 8 household (28.6%) living below poverty.
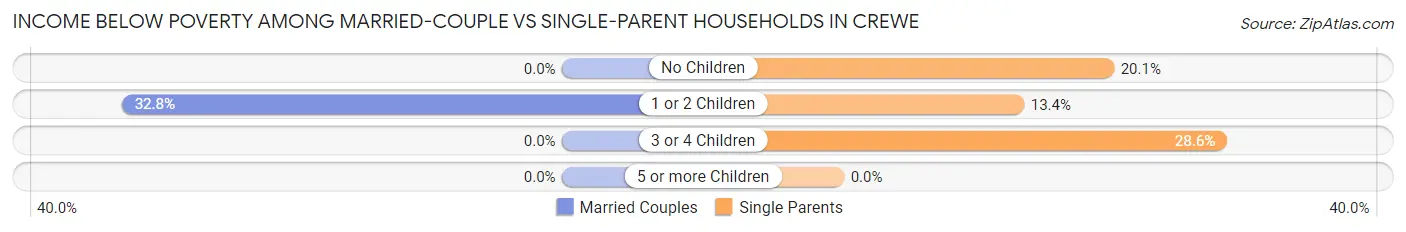
| Children | Married-Couple Families | Single-Parent Households |
| No Children | 0 (0.0%) | 34 (20.1%) |
| 1 or 2 Children | 38 (32.8%) | 20 (13.4%) |
| 3 or 4 Children | 0 (0.0%) | 8 (28.6%) |
| 5 or more Children | 0 (0.0%) | 0 (0.0%) |
| Total | 38 (10.9%) | 62 (17.9%) |
Race in Crewe
The most populous races in Crewe are White / Caucasian (1,658 | 56.6%), Black / African American (1,158 | 39.5%), and Hispanic or Latino (178 | 6.1%).
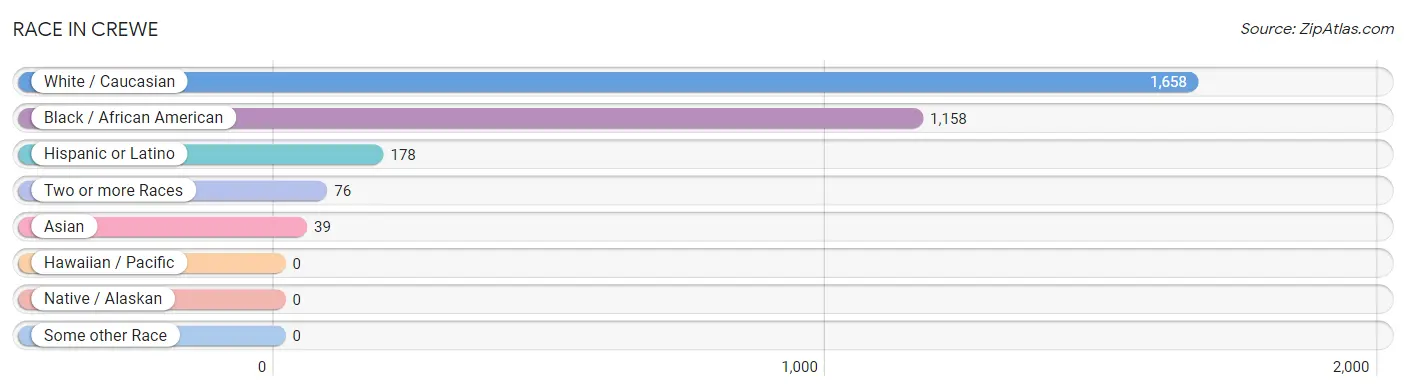
| Race | # Population | % Population |
| Asian | 39 | 1.3% |
| Black / African American | 1,158 | 39.5% |
| Hawaiian / Pacific | 0 | 0.0% |
| Hispanic or Latino | 178 | 6.1% |
| Native / Alaskan | 0 | 0.0% |
| White / Caucasian | 1,658 | 56.6% |
| Two or more Races | 76 | 2.6% |
| Some other Race | 0 | 0.0% |
| Total | 2,931 | 100.0% |
Ancestry in Crewe
The most populous ancestries reported in Crewe are American (828 | 28.2%), African (216 | 7.4%), Subsaharan African (216 | 7.4%), Mexican (137 | 4.7%), and English (131 | 4.5%), together accounting for 52.1% of all Crewe residents.
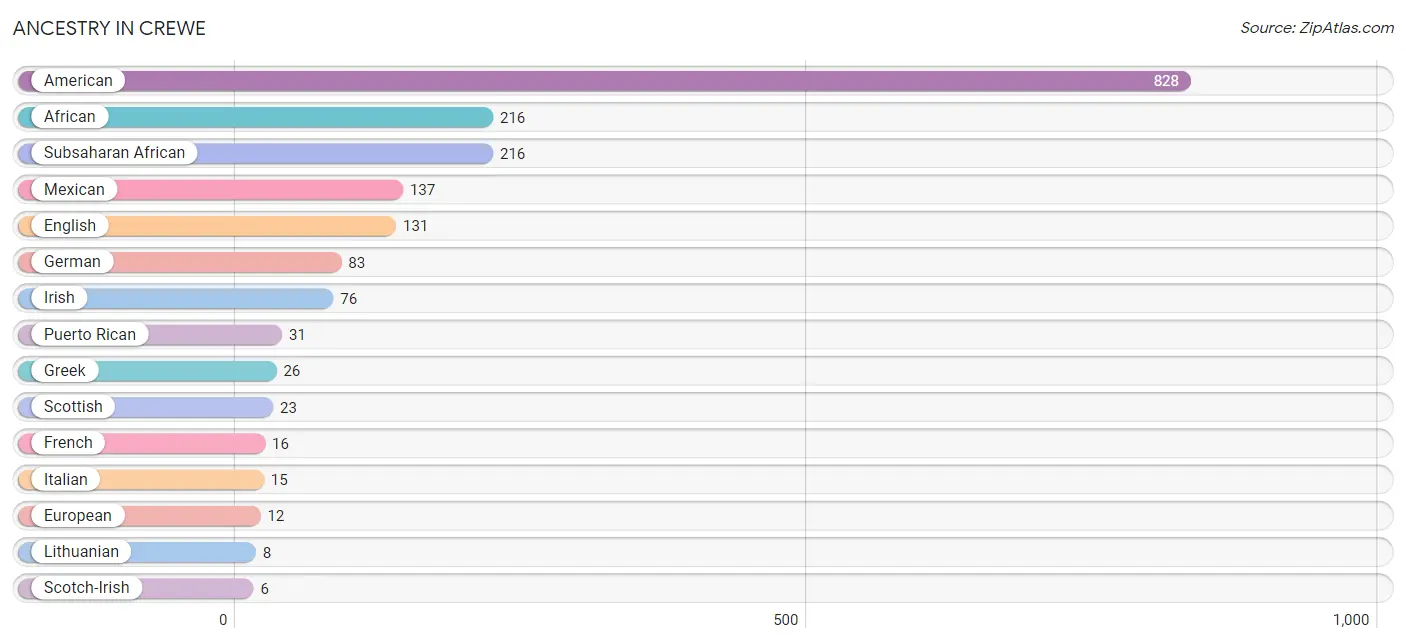
| Ancestry | # Population | % Population |
| African | 216 | 7.4% |
| American | 828 | 28.2% |
| Cherokee | 2 | 0.1% |
| Dutch | 5 | 0.2% |
| English | 131 | 4.5% |
| European | 12 | 0.4% |
| French | 16 | 0.5% |
| French Canadian | 2 | 0.1% |
| German | 83 | 2.8% |
| Greek | 26 | 0.9% |
| Irish | 76 | 2.6% |
| Italian | 15 | 0.5% |
| Lithuanian | 8 | 0.3% |
| Mexican | 137 | 4.7% |
| Polish | 5 | 0.2% |
| Puerto Rican | 31 | 1.1% |
| Scotch-Irish | 6 | 0.2% |
| Scottish | 23 | 0.8% |
| Subsaharan African | 216 | 7.4% |
| Welsh | 6 | 0.2% | View All 20 Rows |
Immigrants in Crewe
The most numerous immigrant groups reported in Crewe came from Asia (74 | 2.5%), South Central Asia (74 | 2.5%), Central America (67 | 2.3%), Latin America (67 | 2.3%), and Mexico (67 | 2.3%), together accounting for 11.9% of all Crewe residents.
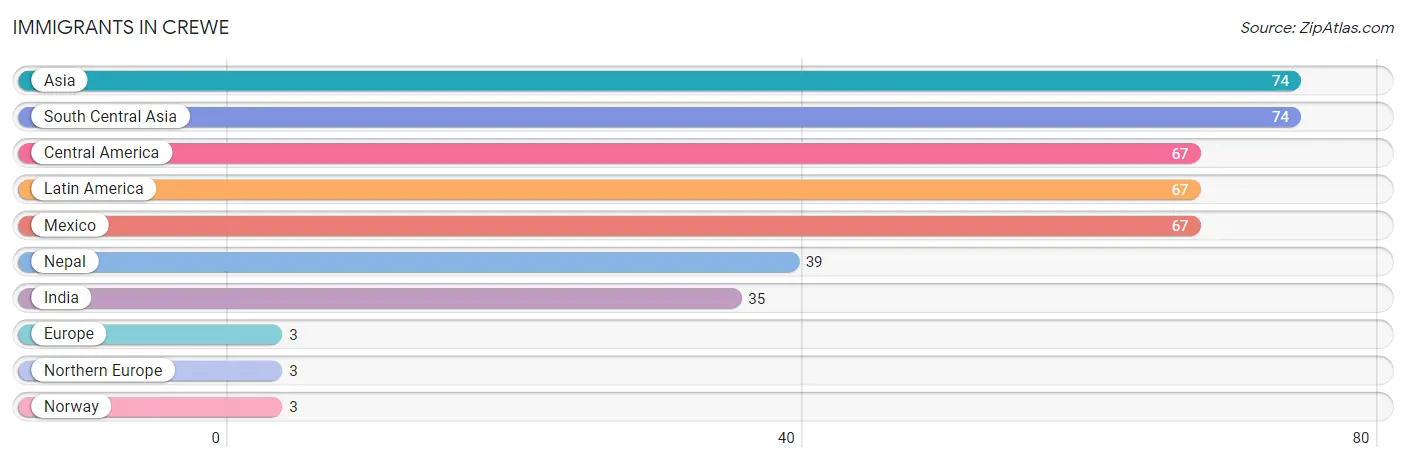
| Immigration Origin | # Population | % Population |
| Asia | 74 | 2.5% |
| Central America | 67 | 2.3% |
| Europe | 3 | 0.1% |
| India | 35 | 1.2% |
| Latin America | 67 | 2.3% |
| Mexico | 67 | 2.3% |
| Nepal | 39 | 1.3% |
| Northern Europe | 3 | 0.1% |
| Norway | 3 | 0.1% |
| South Central Asia | 74 | 2.5% | View All 10 Rows |
Sex and Age in Crewe
Sex and Age in Crewe
The most populous age groups in Crewe are 25 to 29 Years (212 | 15.3%) for men and 5 to 9 Years (151 | 9.8%) for women.
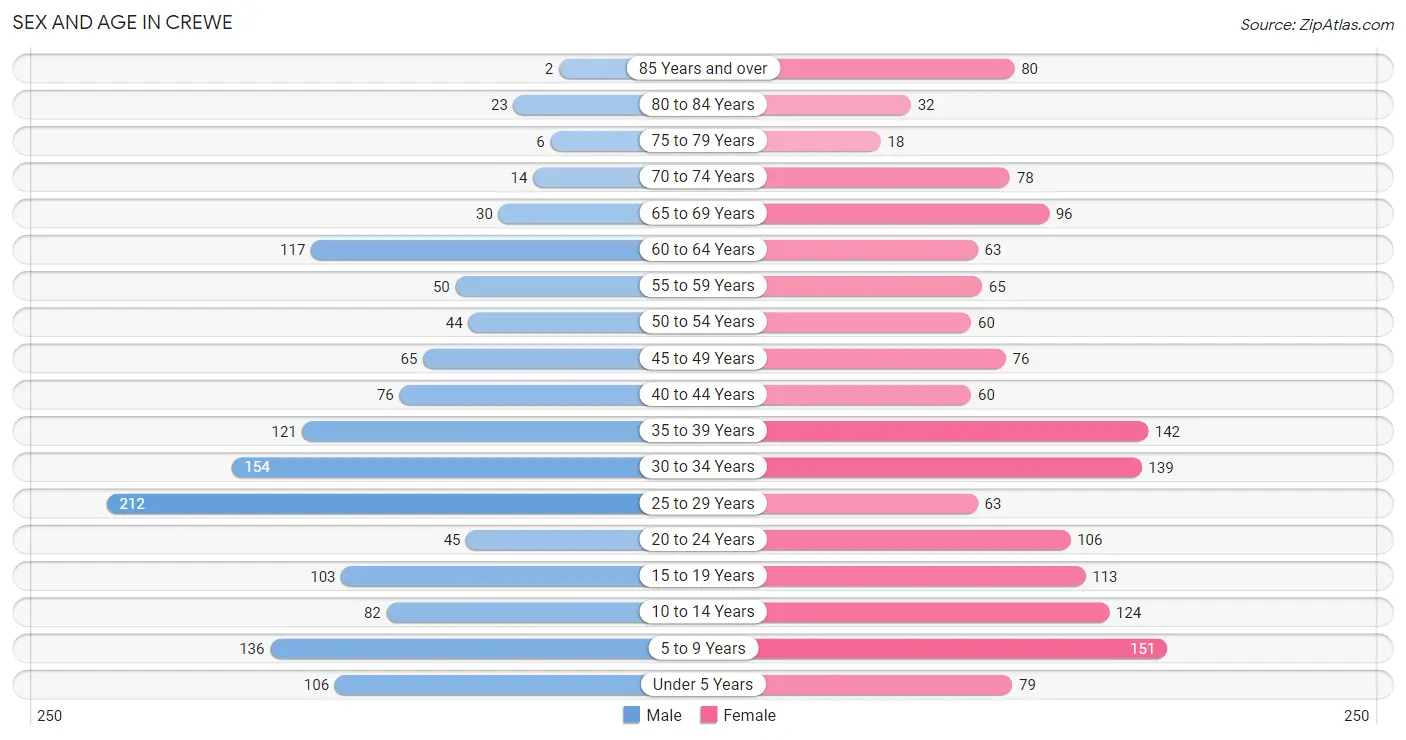
| Age Bracket | Male | Female |
| Under 5 Years | 106 (7.6%) | 79 (5.1%) |
| 5 to 9 Years | 136 (9.8%) | 151 (9.8%) |
| 10 to 14 Years | 82 (5.9%) | 124 (8.0%) |
| 15 to 19 Years | 103 (7.4%) | 113 (7.3%) |
| 20 to 24 Years | 45 (3.3%) | 106 (6.9%) |
| 25 to 29 Years | 212 (15.3%) | 63 (4.1%) |
| 30 to 34 Years | 154 (11.1%) | 139 (9.0%) |
| 35 to 39 Years | 121 (8.7%) | 142 (9.2%) |
| 40 to 44 Years | 76 (5.5%) | 60 (3.9%) |
| 45 to 49 Years | 65 (4.7%) | 76 (4.9%) |
| 50 to 54 Years | 44 (3.2%) | 60 (3.9%) |
| 55 to 59 Years | 50 (3.6%) | 65 (4.2%) |
| 60 to 64 Years | 117 (8.4%) | 63 (4.1%) |
| 65 to 69 Years | 30 (2.2%) | 96 (6.2%) |
| 70 to 74 Years | 14 (1.0%) | 78 (5.1%) |
| 75 to 79 Years | 6 (0.4%) | 18 (1.2%) |
| 80 to 84 Years | 23 (1.7%) | 32 (2.1%) |
| 85 Years and over | 2 (0.1%) | 80 (5.2%) |
| Total | 1,386 (100.0%) | 1,545 (100.0%) |
Families and Households in Crewe
Median Family Size in Crewe
The median family size in Crewe is 3.29 persons per family, with married-couple families (348 | 50.1%) accounting for the largest median family size of 4.05 persons per family. On the other hand, single male/father families (108 | 15.6%) represent the smallest median family size with 2.45 persons per family.
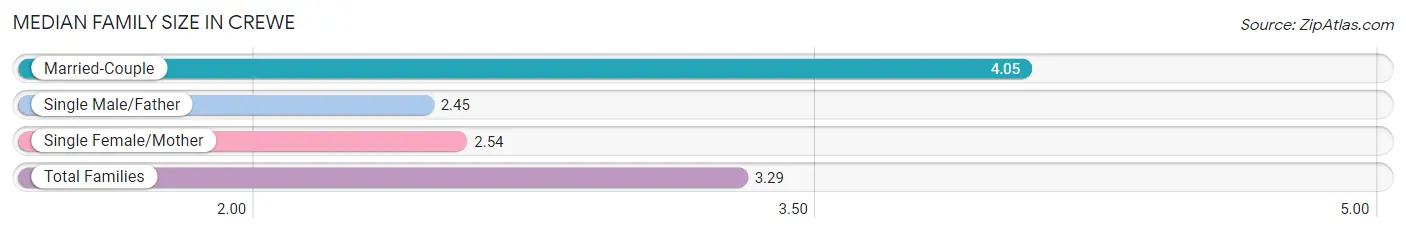
| Family Type | # Families | Family Size |
| Married-Couple | 348 (50.1%) | 4.05 |
| Single Male/Father | 108 (15.6%) | 2.45 |
| Single Female/Mother | 238 (34.3%) | 2.54 |
| Total Families | 694 (100.0%) | 3.29 |
Median Household Size in Crewe
The median household size in Crewe is 2.47 persons per household, with married-couple households (348 | 29.3%) accounting for the largest median household size of 4.05 persons per household. non-family households (492 | 41.5%) represent the smallest median household size with 1.09 persons per household.
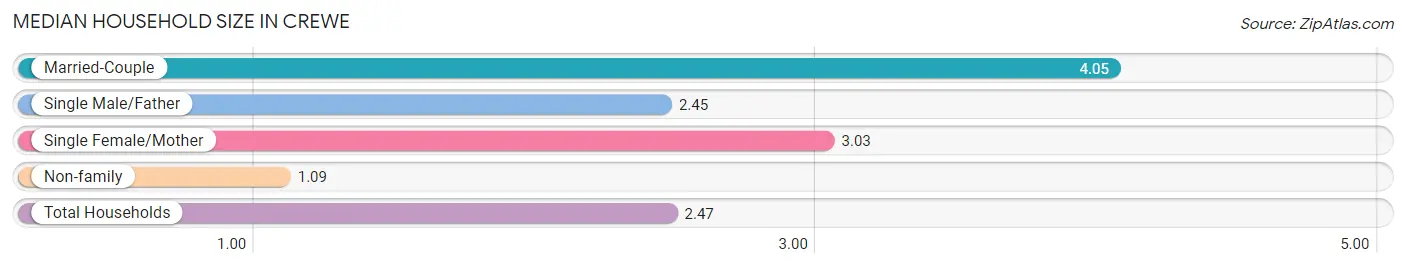
| Household Type | # Households | Household Size |
| Married-Couple | 348 (29.3%) | 4.05 |
| Single Male/Father | 108 (9.1%) | 2.45 |
| Single Female/Mother | 238 (20.1%) | 3.03 |
| Non-family | 492 (41.5%) | 1.09 |
| Total Households | 1,186 (100.0%) | 2.47 |
Household Size by Marriage Status in Crewe
Out of a total of 1,186 households in Crewe, 694 (58.5%) are family households, while 492 (41.5%) are nonfamily households. The most numerous type of family households are 2-person households, comprising 343, and the most common type of nonfamily households are 1-person households, comprising 449.
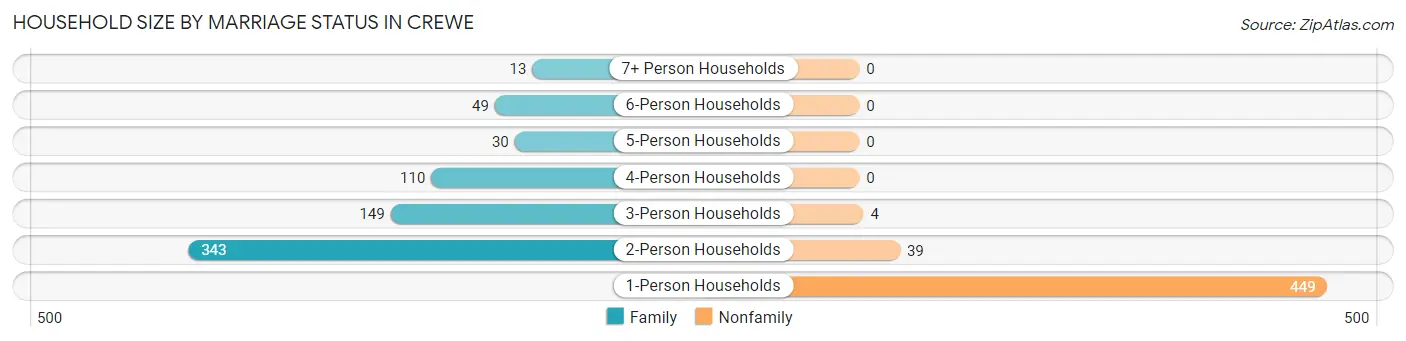
| Household Size | Family Households | Nonfamily Households |
| 1-Person Households | - | 449 (37.9%) |
| 2-Person Households | 343 (28.9%) | 39 (3.3%) |
| 3-Person Households | 149 (12.6%) | 4 (0.3%) |
| 4-Person Households | 110 (9.3%) | 0 (0.0%) |
| 5-Person Households | 30 (2.5%) | 0 (0.0%) |
| 6-Person Households | 49 (4.1%) | 0 (0.0%) |
| 7+ Person Households | 13 (1.1%) | 0 (0.0%) |
| Total | 694 (58.5%) | 492 (41.5%) |
Female Fertility in Crewe
Fertility by Age in Crewe
Average fertility rate in Crewe is 37.0 births per 1,000 women. Women in the age bracket of 20 to 34 years have the highest fertility rate with 88.0 births per 1,000 women. Women in the age bracket of 20 to 34 years acount for 100.0% of all women with births.
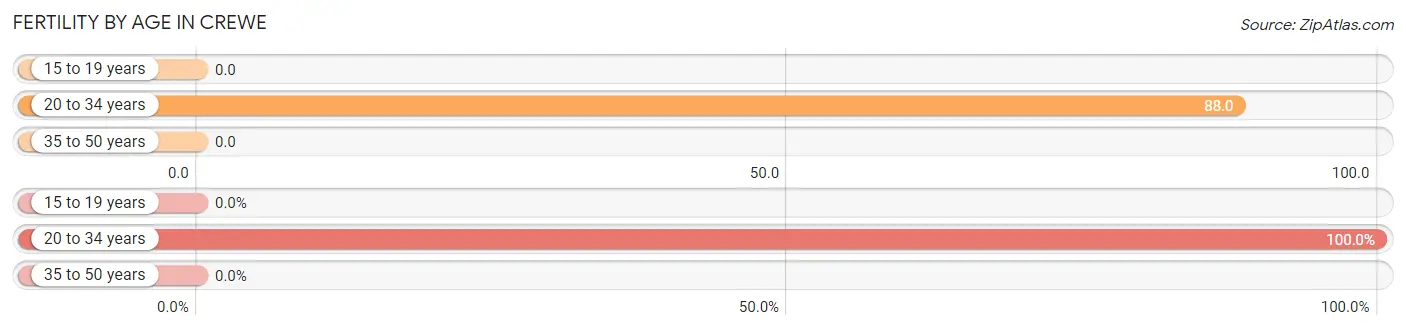
| Age Bracket | Women with Births | Births / 1,000 Women |
| 15 to 19 years | 0 (0.0%) | 0.0 |
| 20 to 34 years | 27 (100.0%) | 88.0 |
| 35 to 50 years | 0 (0.0%) | 0.0 |
| Total | 27 (100.0%) | 37.0 |
Fertility by Age by Marriage Status in Crewe
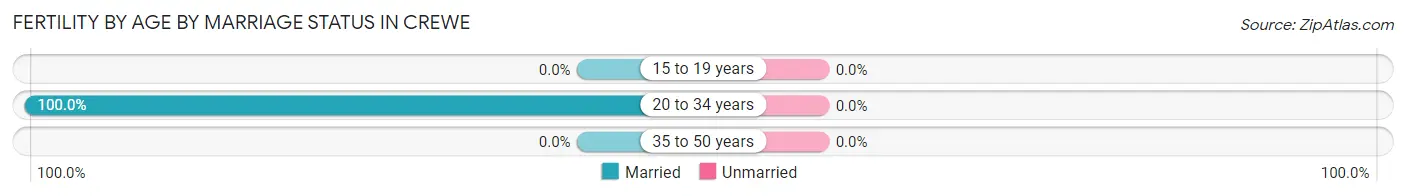
| Age Bracket | Married | Unmarried |
| 15 to 19 years | 0 (0.0%) | 0 (0.0%) |
| 20 to 34 years | 27 (100.0%) | 0 (0.0%) |
| 35 to 50 years | 0 (0.0%) | 0 (0.0%) |
| Total | 27 (100.0%) | 0 (0.0%) |
Fertility by Education in Crewe
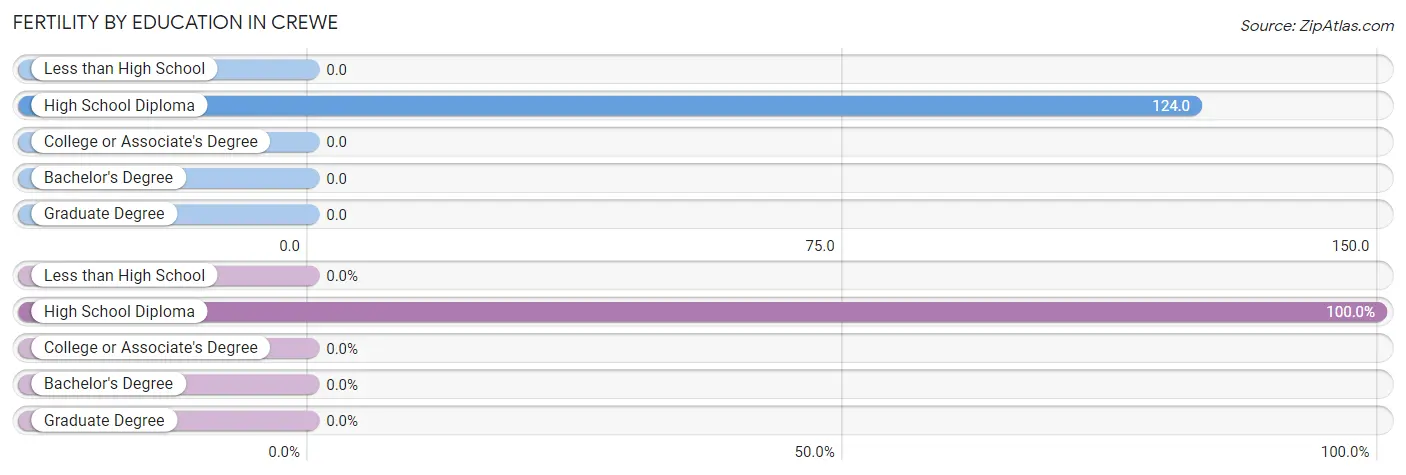
| Educational Attainment | Women with Births | Births / 1,000 Women |
| Less than High School | 0 (0.0%) | 0.0 |
| High School Diploma | 27 (100.0%) | 124.0 |
| College or Associate's Degree | 0 (0.0%) | 0.0 |
| Bachelor's Degree | 0 (0.0%) | 0.0 |
| Graduate Degree | 0 (0.0%) | 0.0 |
| Total | 27 (100.0%) | 37.0 |
Fertility by Education by Marriage Status in Crewe
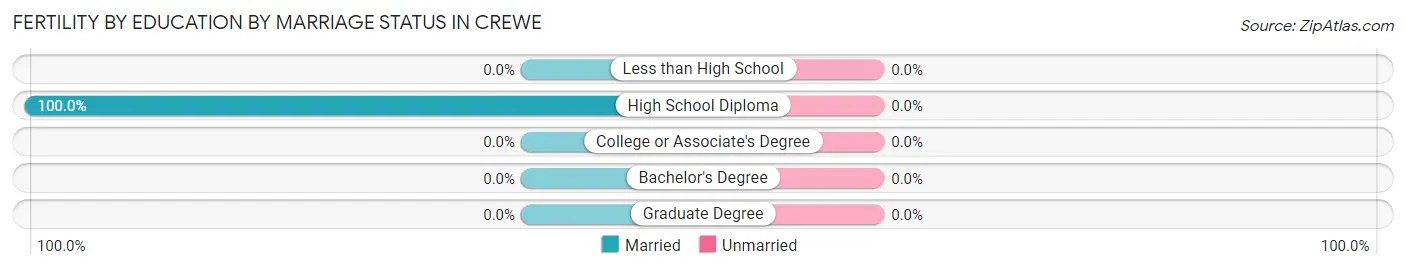
| Educational Attainment | Married | Unmarried |
| Less than High School | 0 (0.0%) | 0 (0.0%) |
| High School Diploma | 27 (100.0%) | 0 (0.0%) |
| College or Associate's Degree | 0 (0.0%) | 0 (0.0%) |
| Bachelor's Degree | 0 (0.0%) | 0 (0.0%) |
| Graduate Degree | 0 (0.0%) | 0 (0.0%) |
| Total | 27 (100.0%) | 0 (0.0%) |
Employment Characteristics in Crewe
Employment by Class of Employer in Crewe
Among the 1,261 employed individuals in Crewe, private company employees (792 | 62.8%), state government employees (175 | 13.9%), and local government employees (141 | 11.2%) make up the most common classes of employment.
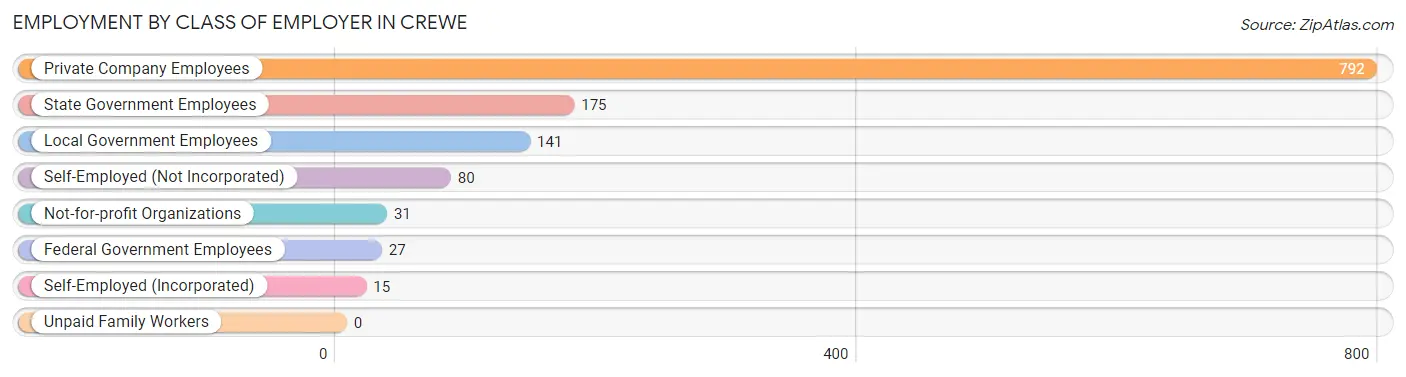
| Employer Class | # Employees | % Employees |
| Private Company Employees | 792 | 62.8% |
| Self-Employed (Incorporated) | 15 | 1.2% |
| Self-Employed (Not Incorporated) | 80 | 6.3% |
| Not-for-profit Organizations | 31 | 2.5% |
| Local Government Employees | 141 | 11.2% |
| State Government Employees | 175 | 13.9% |
| Federal Government Employees | 27 | 2.1% |
| Unpaid Family Workers | 0 | 0.0% |
| Total | 1,261 | 100.0% |
Employment Status by Age in Crewe
According to the labor force statistics for Crewe, out of the total population over 16 years of age (2,163), 64.4% or 1,393 individuals are in the labor force, with 9.0% or 125 of them unemployed. The age group with the highest labor force participation rate is 25 to 29 years, with 96.7% or 266 individuals in the labor force. Within the labor force, the 25 to 29 years age range has the highest percentage of unemployed individuals, with 33.8% or 90 of them being unemployed.
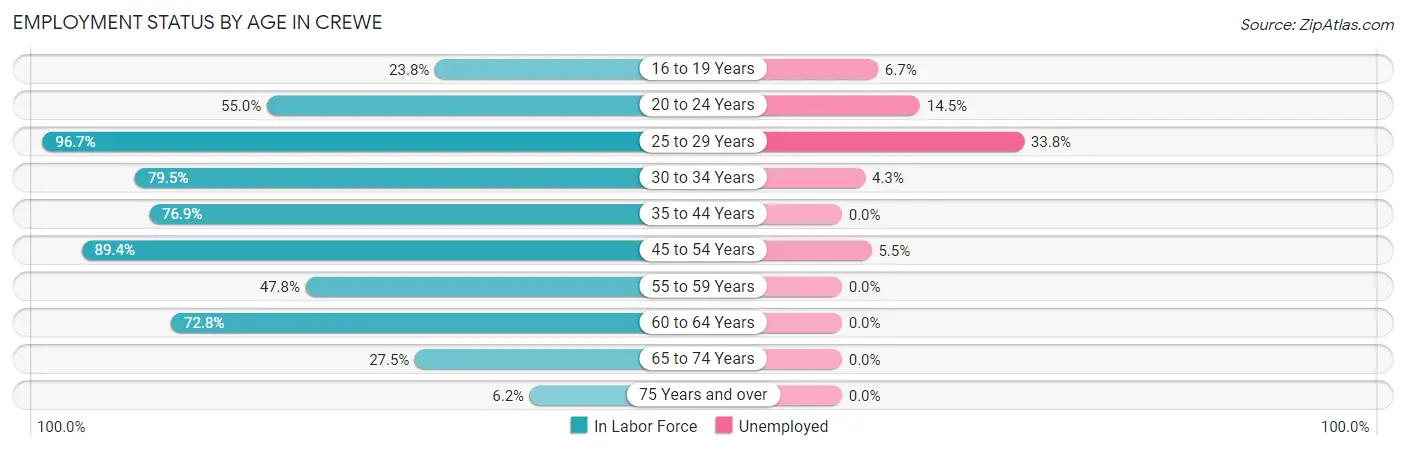
| Age Bracket | In Labor Force | Unemployed |
| 16 to 19 Years | 30 (23.8%) | 2 (6.7%) |
| 20 to 24 Years | 83 (55.0%) | 12 (14.5%) |
| 25 to 29 Years | 266 (96.7%) | 90 (33.8%) |
| 30 to 34 Years | 233 (79.5%) | 10 (4.3%) |
| 35 to 44 Years | 307 (76.9%) | 0 (0.0%) |
| 45 to 54 Years | 219 (89.4%) | 12 (5.5%) |
| 55 to 59 Years | 55 (47.8%) | 0 (0.0%) |
| 60 to 64 Years | 131 (72.8%) | 0 (0.0%) |
| 65 to 74 Years | 60 (27.5%) | 0 (0.0%) |
| 75 Years and over | 10 (6.2%) | 0 (0.0%) |
| Total | 1,393 (64.4%) | 125 (9.0%) |
Employment Status by Educational Attainment in Crewe
According to labor force statistics for Crewe, 80.4% of individuals (1,212) out of the total population between 25 and 64 years of age (1,507) are in the labor force, with 9.2% or 112 of them being unemployed. The group with the highest labor force participation rate are those with the educational attainment of college / associate degree, with 94.3% or 463 individuals in the labor force. Within the labor force, individuals with high school diploma education have the highest percentage of unemployment, with 22.4% or 100 of them being unemployed.
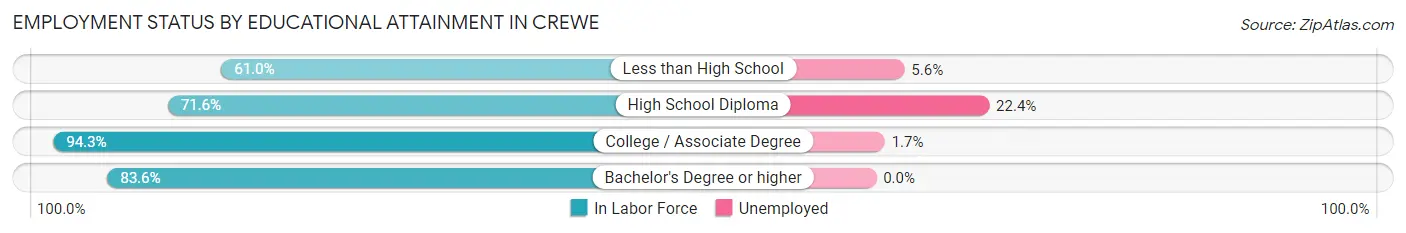
| Educational Attainment | In Labor Force | Unemployed |
| Less than High School | 72 (61.0%) | 7 (5.6%) |
| High School Diploma | 446 (71.6%) | 140 (22.4%) |
| College / Associate Degree | 463 (94.3%) | 8 (1.7%) |
| Bachelor's Degree or higher | 230 (83.6%) | 0 (0.0%) |
| Total | 1,212 (80.4%) | 139 (9.2%) |
Employment Occupations by Sex in Crewe
Management, Business, Science and Arts Occupations
The most common Management, Business, Science and Arts occupations in Crewe are Management (221 | 17.4%), Health Diagnosing & Treating (156 | 12.3%), Community & Social Service (97 | 7.6%), Education Instruction & Library (59 | 4.6%), and Health Technologists (55 | 4.3%).
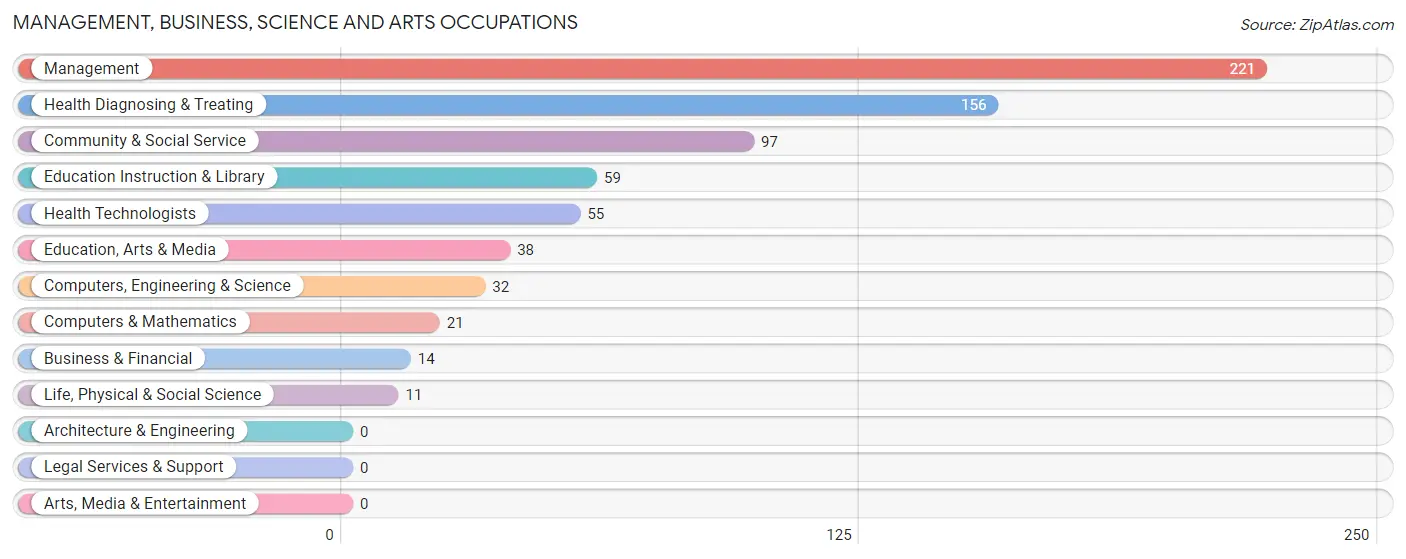
Management, Business, Science and Arts Occupations by Sex
Within the Management, Business, Science and Arts occupations in Crewe, the most male-oriented occupations are Computers & Mathematics (80.9%), Computers, Engineering & Science (71.9%), and Management (63.3%), while the most female-oriented occupations are Education, Arts & Media (100.0%), Health Technologists (100.0%), and Community & Social Service (86.6%).
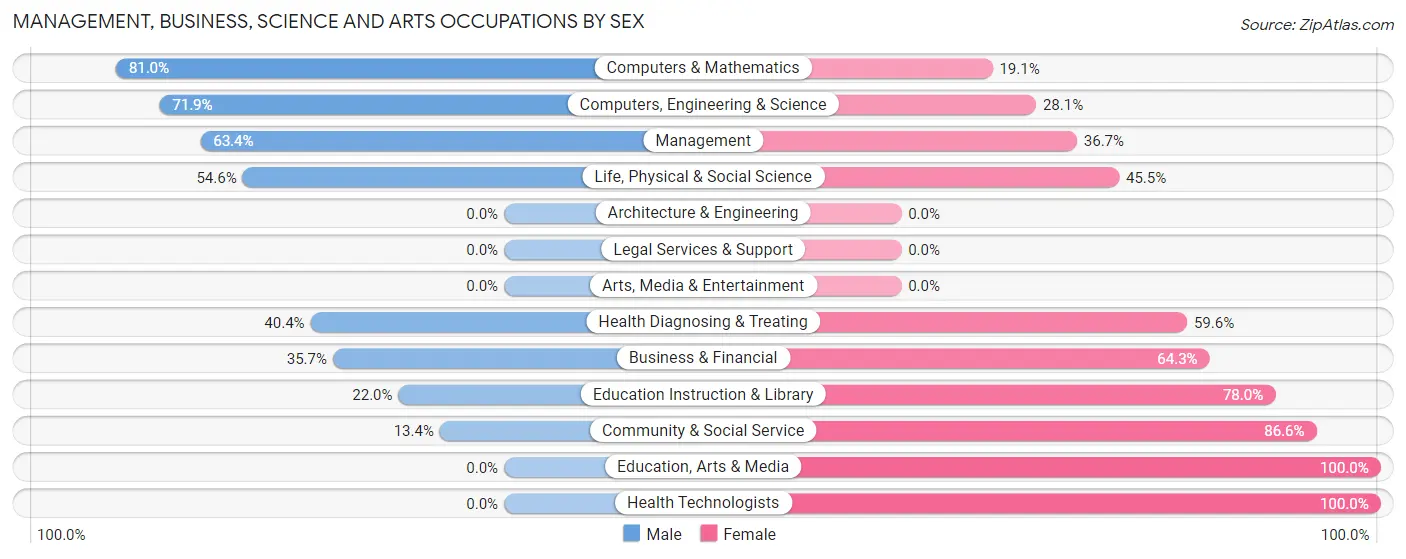
| Occupation | Male | Female |
| Management | 140 (63.3%) | 81 (36.6%) |
| Business & Financial | 5 (35.7%) | 9 (64.3%) |
| Computers, Engineering & Science | 23 (71.9%) | 9 (28.1%) |
| Computers & Mathematics | 17 (80.9%) | 4 (19.1%) |
| Architecture & Engineering | 0 (0.0%) | 0 (0.0%) |
| Life, Physical & Social Science | 6 (54.5%) | 5 (45.5%) |
| Community & Social Service | 13 (13.4%) | 84 (86.6%) |
| Education, Arts & Media | 0 (0.0%) | 38 (100.0%) |
| Legal Services & Support | 0 (0.0%) | 0 (0.0%) |
| Education Instruction & Library | 13 (22.0%) | 46 (78.0%) |
| Arts, Media & Entertainment | 0 (0.0%) | 0 (0.0%) |
| Health Diagnosing & Treating | 63 (40.4%) | 93 (59.6%) |
| Health Technologists | 0 (0.0%) | 55 (100.0%) |
| Total (Category) | 244 (46.9%) | 276 (53.1%) |
| Total (Overall) | 710 (56.0%) | 558 (44.0%) |
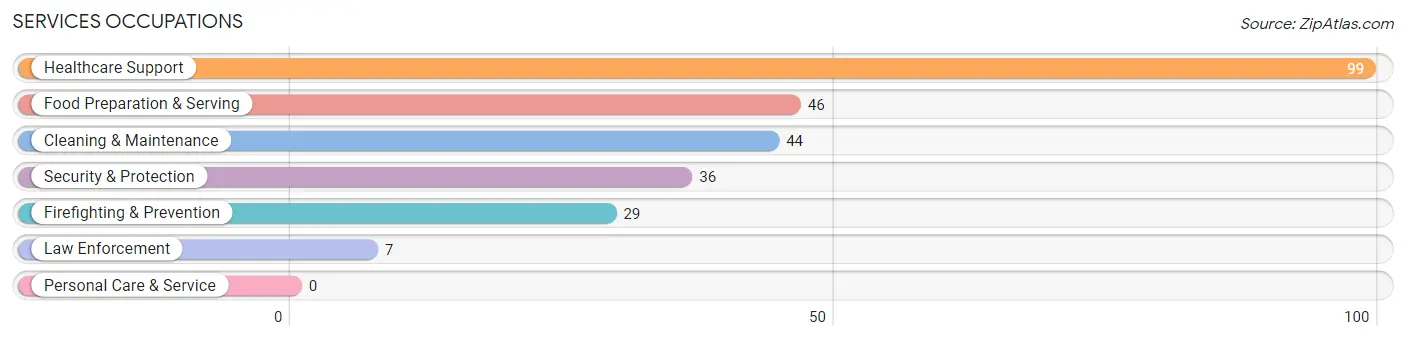
Services Occupations
The most common Services occupations in Crewe are Healthcare Support (99 | 7.8%), Food Preparation & Serving (46 | 3.6%), Cleaning & Maintenance (44 | 3.5%), Security & Protection (36 | 2.8%), and Firefighting & Prevention (29 | 2.3%).
Services Occupations by Sex
Within the Services occupations in Crewe, the most male-oriented occupations are Firefighting & Prevention (100.0%), Food Preparation & Serving (91.3%), and Security & Protection (86.1%), while the most female-oriented occupations are Healthcare Support (100.0%), Law Enforcement (71.4%), and Cleaning & Maintenance (22.7%).
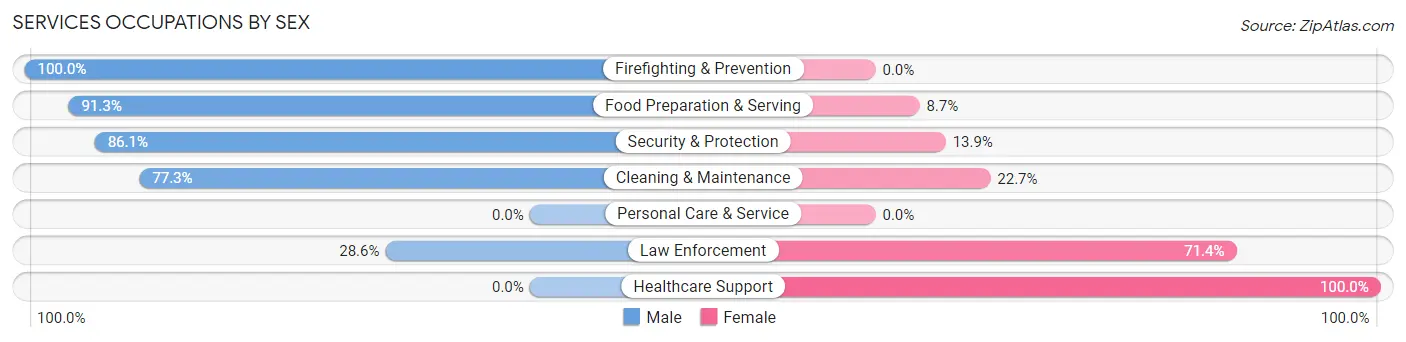
| Occupation | Male | Female |
| Healthcare Support | 0 (0.0%) | 99 (100.0%) |
| Security & Protection | 31 (86.1%) | 5 (13.9%) |
| Firefighting & Prevention | 29 (100.0%) | 0 (0.0%) |
| Law Enforcement | 2 (28.6%) | 5 (71.4%) |
| Food Preparation & Serving | 42 (91.3%) | 4 (8.7%) |
| Cleaning & Maintenance | 34 (77.3%) | 10 (22.7%) |
| Personal Care & Service | 0 (0.0%) | 0 (0.0%) |
| Total (Category) | 107 (47.6%) | 118 (52.4%) |
| Total (Overall) | 710 (56.0%) | 558 (44.0%) |
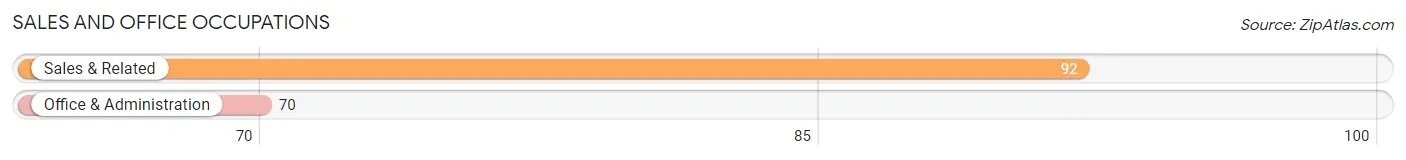
Sales and Office Occupations
The most common Sales and Office occupations in Crewe are Sales & Related (92 | 7.3%), and Office & Administration (70 | 5.5%).
Sales and Office Occupations by Sex
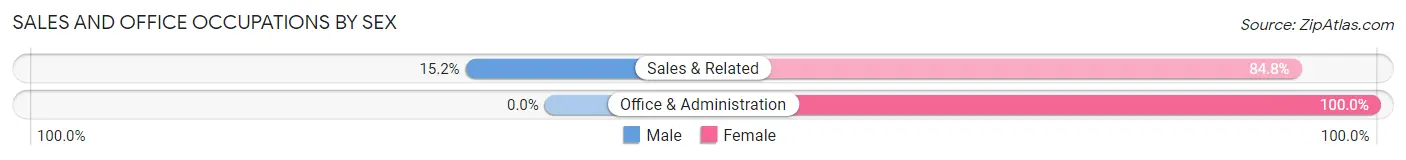
| Occupation | Male | Female |
| Sales & Related | 14 (15.2%) | 78 (84.8%) |
| Office & Administration | 0 (0.0%) | 70 (100.0%) |
| Total (Category) | 14 (8.6%) | 148 (91.4%) |
| Total (Overall) | 710 (56.0%) | 558 (44.0%) |
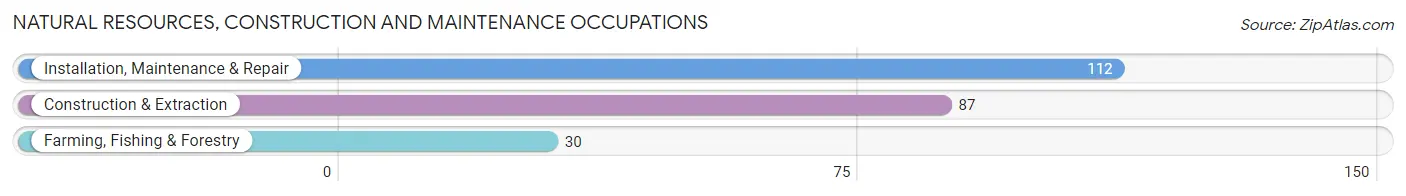
Natural Resources, Construction and Maintenance Occupations
The most common Natural Resources, Construction and Maintenance occupations in Crewe are Installation, Maintenance & Repair (112 | 8.8%), Construction & Extraction (87 | 6.9%), and Farming, Fishing & Forestry (30 | 2.4%).
Natural Resources, Construction and Maintenance Occupations by Sex
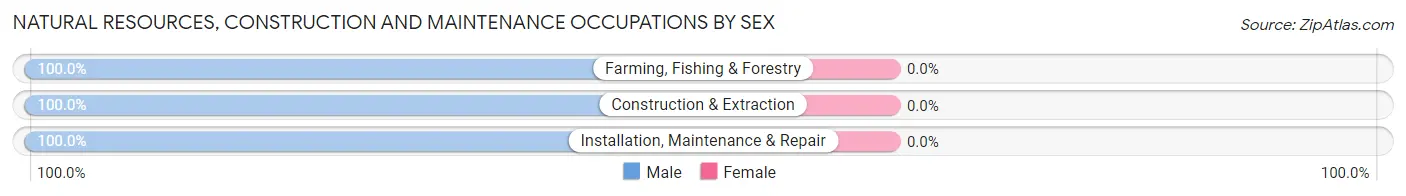
| Occupation | Male | Female |
| Farming, Fishing & Forestry | 30 (100.0%) | 0 (0.0%) |
| Construction & Extraction | 87 (100.0%) | 0 (0.0%) |
| Installation, Maintenance & Repair | 112 (100.0%) | 0 (0.0%) |
| Total (Category) | 229 (100.0%) | 0 (0.0%) |
| Total (Overall) | 710 (56.0%) | 558 (44.0%) |
Production, Transportation and Moving Occupations
The most common Production, Transportation and Moving occupations in Crewe are Transportation (67 | 5.3%), Material Moving (34 | 2.7%), and Production (31 | 2.4%).
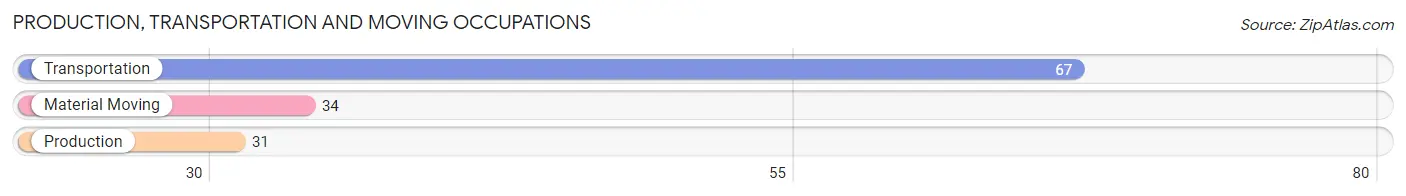
Production, Transportation and Moving Occupations by Sex
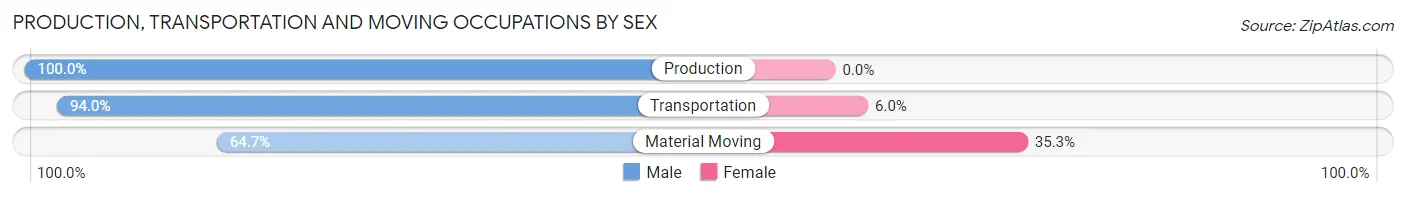
| Occupation | Male | Female |
| Production | 31 (100.0%) | 0 (0.0%) |
| Transportation | 63 (94.0%) | 4 (6.0%) |
| Material Moving | 22 (64.7%) | 12 (35.3%) |
| Total (Category) | 116 (87.9%) | 16 (12.1%) |
| Total (Overall) | 710 (56.0%) | 558 (44.0%) |
Employment Industries by Sex in Crewe
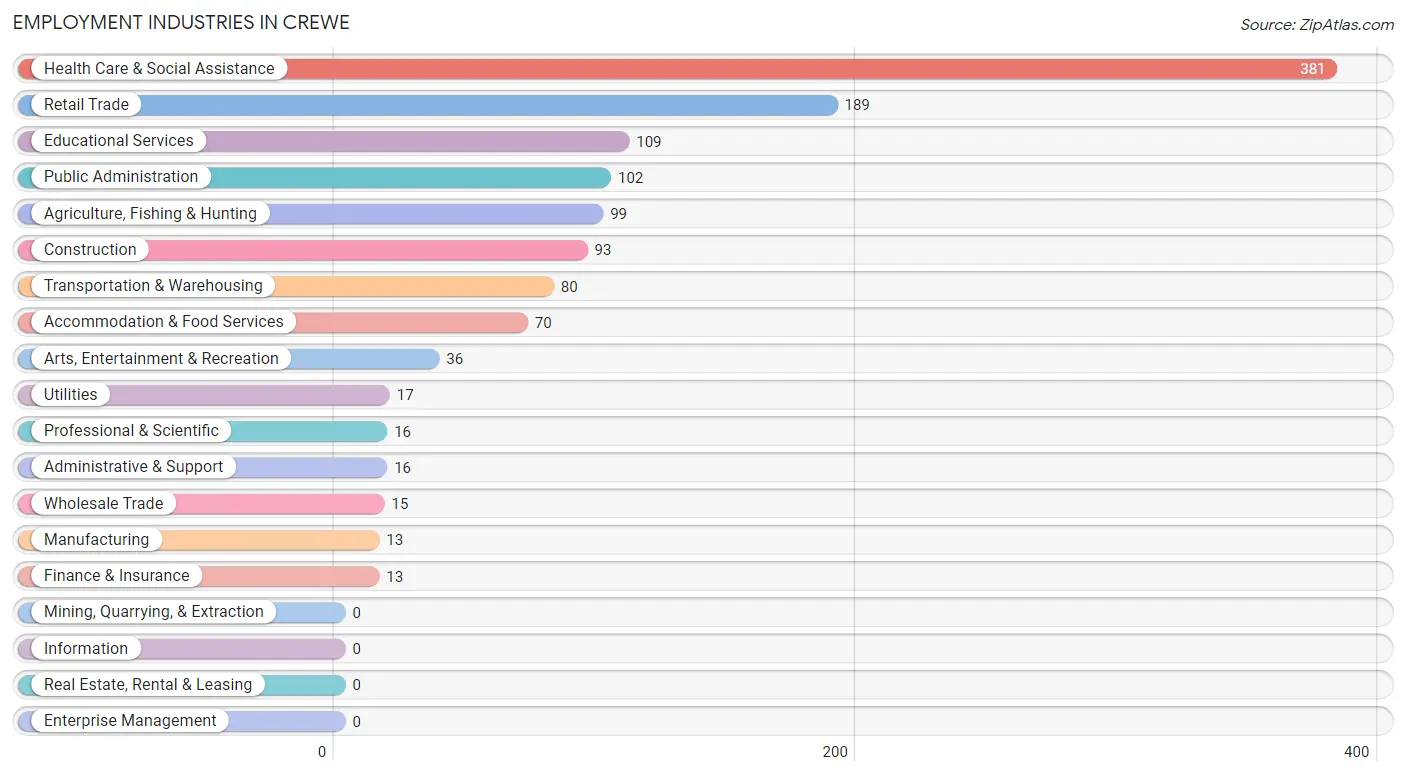
Employment Industries in Crewe
The major employment industries in Crewe include Health Care & Social Assistance (381 | 30.0%), Retail Trade (189 | 14.9%), Educational Services (109 | 8.6%), Public Administration (102 | 8.0%), and Agriculture, Fishing & Hunting (99 | 7.8%).
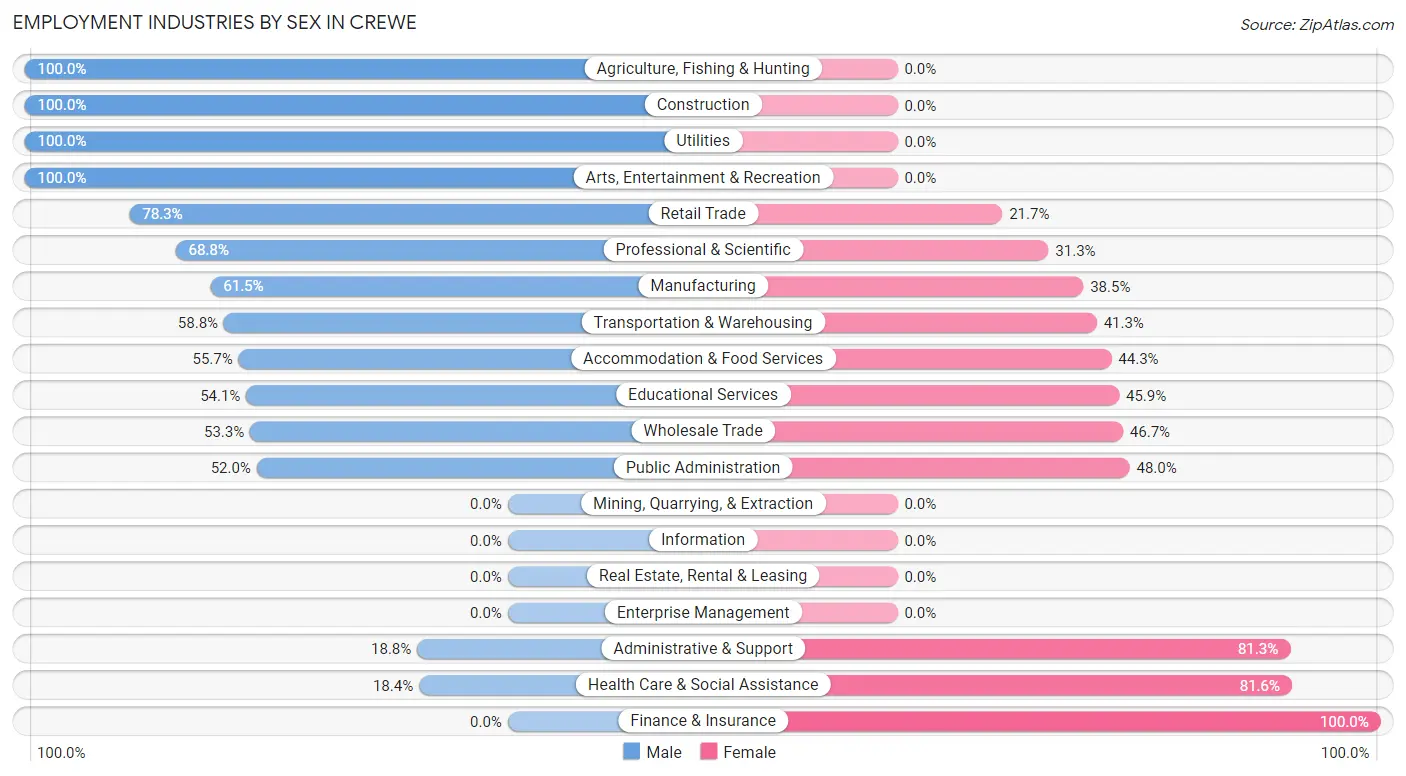
Employment Industries by Sex in Crewe
The Crewe industries that see more men than women are Agriculture, Fishing & Hunting (100.0%), Construction (100.0%), and Utilities (100.0%), whereas the industries that tend to have a higher number of women are Finance & Insurance (100.0%), Health Care & Social Assistance (81.6%), and Administrative & Support (81.2%).
| Industry | Male | Female |
| Agriculture, Fishing & Hunting | 99 (100.0%) | 0 (0.0%) |
| Mining, Quarrying, & Extraction | 0 (0.0%) | 0 (0.0%) |
| Construction | 93 (100.0%) | 0 (0.0%) |
| Manufacturing | 8 (61.5%) | 5 (38.5%) |
| Wholesale Trade | 8 (53.3%) | 7 (46.7%) |
| Retail Trade | 148 (78.3%) | 41 (21.7%) |
| Transportation & Warehousing | 47 (58.8%) | 33 (41.2%) |
| Utilities | 17 (100.0%) | 0 (0.0%) |
| Information | 0 (0.0%) | 0 (0.0%) |
| Finance & Insurance | 0 (0.0%) | 13 (100.0%) |
| Real Estate, Rental & Leasing | 0 (0.0%) | 0 (0.0%) |
| Professional & Scientific | 11 (68.8%) | 5 (31.2%) |
| Enterprise Management | 0 (0.0%) | 0 (0.0%) |
| Administrative & Support | 3 (18.8%) | 13 (81.2%) |
| Educational Services | 59 (54.1%) | 50 (45.9%) |
| Health Care & Social Assistance | 70 (18.4%) | 311 (81.6%) |
| Arts, Entertainment & Recreation | 36 (100.0%) | 0 (0.0%) |
| Accommodation & Food Services | 39 (55.7%) | 31 (44.3%) |
| Public Administration | 53 (52.0%) | 49 (48.0%) |
| Total | 710 (56.0%) | 558 (44.0%) |
Education in Crewe
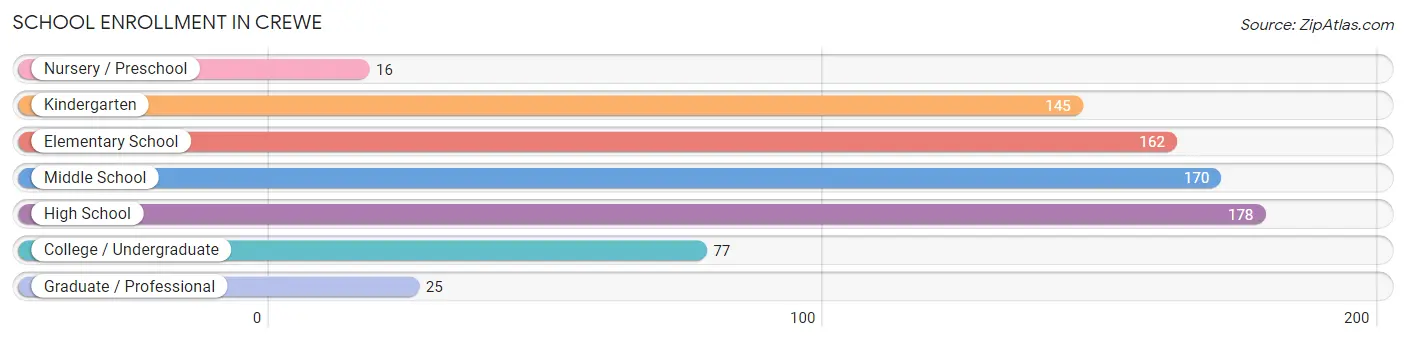
School Enrollment in Crewe
The most common levels of schooling among the 773 students in Crewe are high school (178 | 23.0%), middle school (170 | 22.0%), and elementary school (162 | 21.0%).
| School Level | # Students | % Students |
| Nursery / Preschool | 16 | 2.1% |
| Kindergarten | 145 | 18.8% |
| Elementary School | 162 | 21.0% |
| Middle School | 170 | 22.0% |
| High School | 178 | 23.0% |
| College / Undergraduate | 77 | 10.0% |
| Graduate / Professional | 25 | 3.2% |
| Total | 773 | 100.0% |
School Enrollment by Age by Funding Source in Crewe
Out of a total of 773 students who are enrolled in schools in Crewe, 115 (14.9%) attend a private institution, while the remaining 658 (85.1%) are enrolled in public schools. The age group of 35 years and over has the highest likelihood of being enrolled in private schools, with 25 (100.0% in the age bracket) enrolled. Conversely, the age group of 10 to 14 year olds has the lowest likelihood of being enrolled in a private school, with 206 (100.0% in the age bracket) attending a public institution.
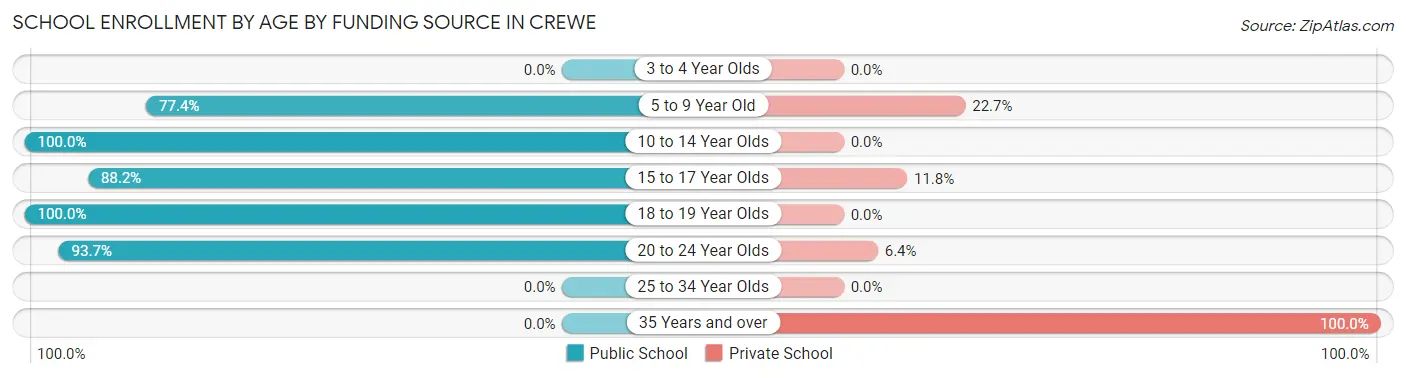
| Age Bracket | Public School | Private School |
| 3 to 4 Year Olds | 0 (0.0%) | 0 (0.0%) |
| 5 to 9 Year Old | 222 (77.3%) | 65 (22.7%) |
| 10 to 14 Year Olds | 206 (100.0%) | 0 (0.0%) |
| 15 to 17 Year Olds | 157 (88.2%) | 21 (11.8%) |
| 18 to 19 Year Olds | 14 (100.0%) | 0 (0.0%) |
| 20 to 24 Year Olds | 59 (93.6%) | 4 (6.4%) |
| 25 to 34 Year Olds | 0 (0.0%) | 0 (0.0%) |
| 35 Years and over | 0 (0.0%) | 25 (100.0%) |
| Total | 658 (85.1%) | 115 (14.9%) |
Educational Attainment by Field of Study in Crewe
Science & technology (79 | 21.7%), business (59 | 16.2%), education (57 | 15.7%), computers & mathematics (48 | 13.2%), and social sciences (38 | 10.4%) are the most common fields of study among 364 individuals in Crewe who have obtained a bachelor's degree or higher.
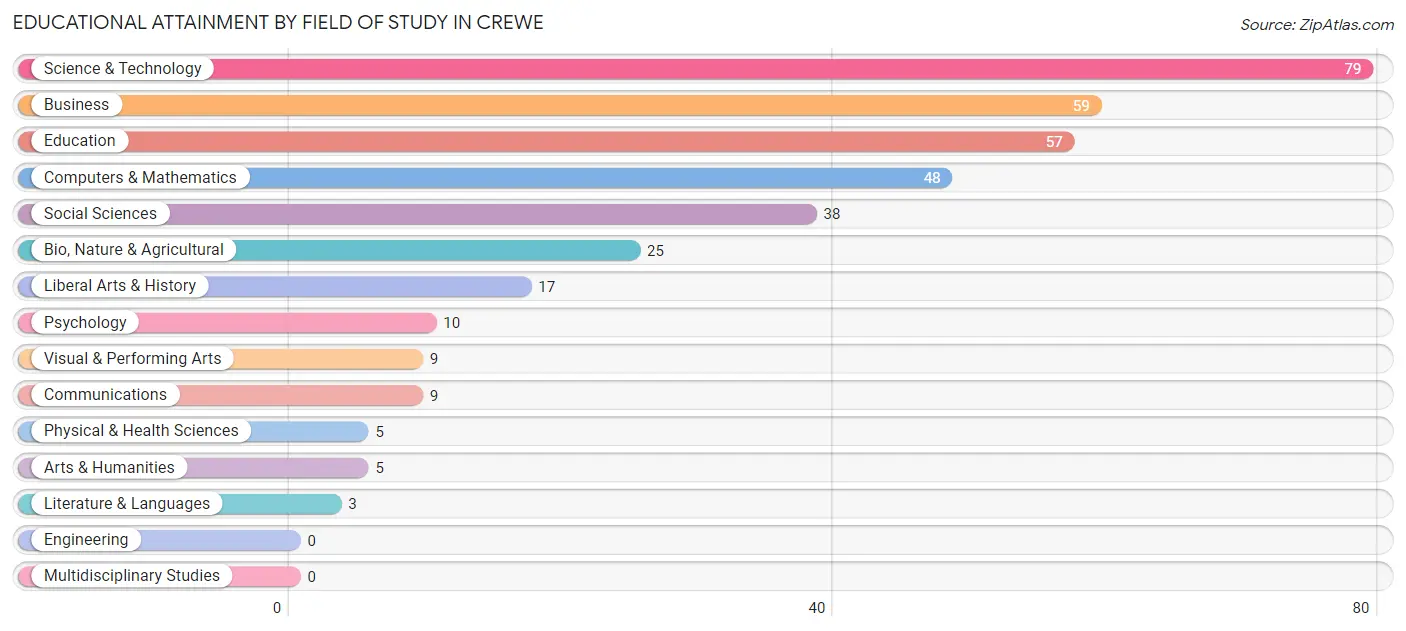
| Field of Study | # Graduates | % Graduates |
| Computers & Mathematics | 48 | 13.2% |
| Bio, Nature & Agricultural | 25 | 6.9% |
| Physical & Health Sciences | 5 | 1.4% |
| Psychology | 10 | 2.8% |
| Social Sciences | 38 | 10.4% |
| Engineering | 0 | 0.0% |
| Multidisciplinary Studies | 0 | 0.0% |
| Science & Technology | 79 | 21.7% |
| Business | 59 | 16.2% |
| Education | 57 | 15.7% |
| Literature & Languages | 3 | 0.8% |
| Liberal Arts & History | 17 | 4.7% |
| Visual & Performing Arts | 9 | 2.5% |
| Communications | 9 | 2.5% |
| Arts & Humanities | 5 | 1.4% |
| Total | 364 | 100.0% |
Transportation & Commute in Crewe
Vehicle Availability by Sex in Crewe
The most prevalent vehicle ownership categories in Crewe are males with 3 vehicles (283, accounting for 40.0%) and females with 3 vehicles (168, making up 51.2%).
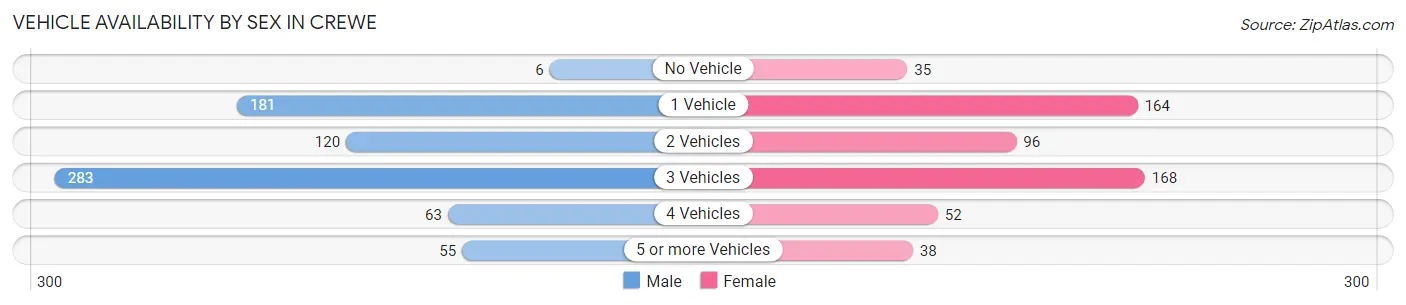
| Vehicles Available | Male | Female |
| No Vehicle | 6 (0.9%) | 35 (6.3%) |
| 1 Vehicle | 181 (25.6%) | 164 (29.7%) |
| 2 Vehicles | 120 (17.0%) | 96 (17.4%) |
| 3 Vehicles | 283 (40.0%) | 168 (30.4%) |
| 4 Vehicles | 63 (8.9%) | 52 (9.4%) |
| 5 or more Vehicles | 55 (7.8%) | 38 (6.9%) |
| Total | 708 (100.0%) | 553 (100.0%) |
Commute Time in Crewe
The most frequently occuring commute durations in Crewe are 20 to 24 minutes (256 commuters, 21.7%), 5 to 9 minutes (181 commuters, 15.3%), and 15 to 19 minutes (144 commuters, 12.2%).
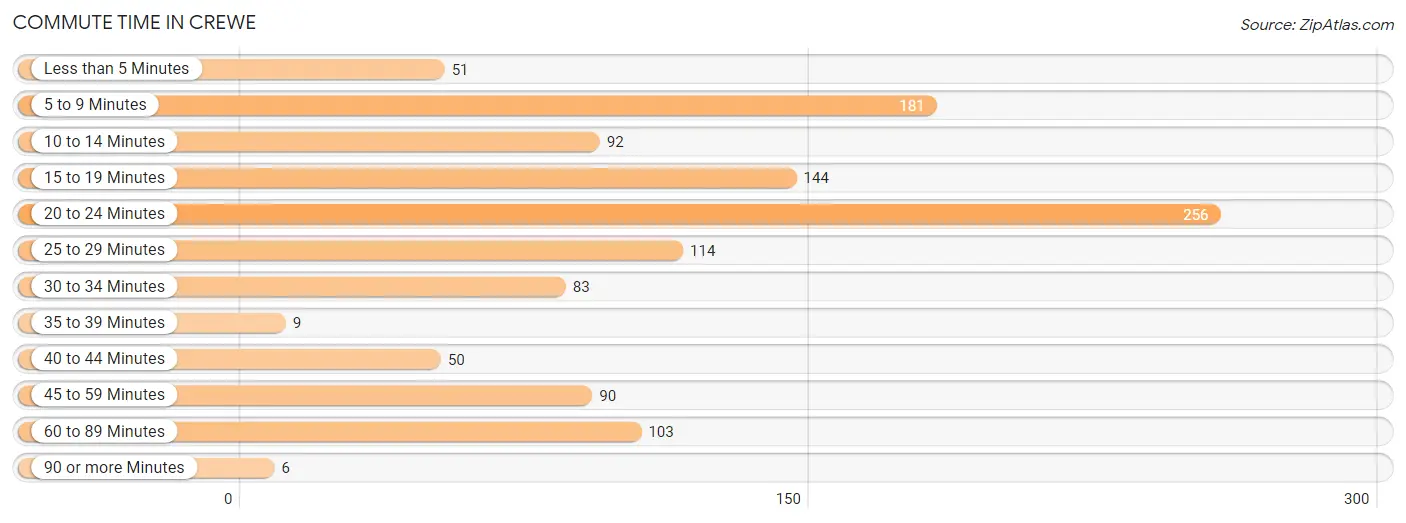
| Commute Time | # Commuters | % Commuters |
| Less than 5 Minutes | 51 | 4.3% |
| 5 to 9 Minutes | 181 | 15.3% |
| 10 to 14 Minutes | 92 | 7.8% |
| 15 to 19 Minutes | 144 | 12.2% |
| 20 to 24 Minutes | 256 | 21.7% |
| 25 to 29 Minutes | 114 | 9.7% |
| 30 to 34 Minutes | 83 | 7.0% |
| 35 to 39 Minutes | 9 | 0.8% |
| 40 to 44 Minutes | 50 | 4.2% |
| 45 to 59 Minutes | 90 | 7.6% |
| 60 to 89 Minutes | 103 | 8.7% |
| 90 or more Minutes | 6 | 0.5% |
Commute Time by Sex in Crewe
The most common commute times in Crewe are 5 to 9 minutes (122 commuters, 17.9%) for males and 20 to 24 minutes (161 commuters, 32.4%) for females.
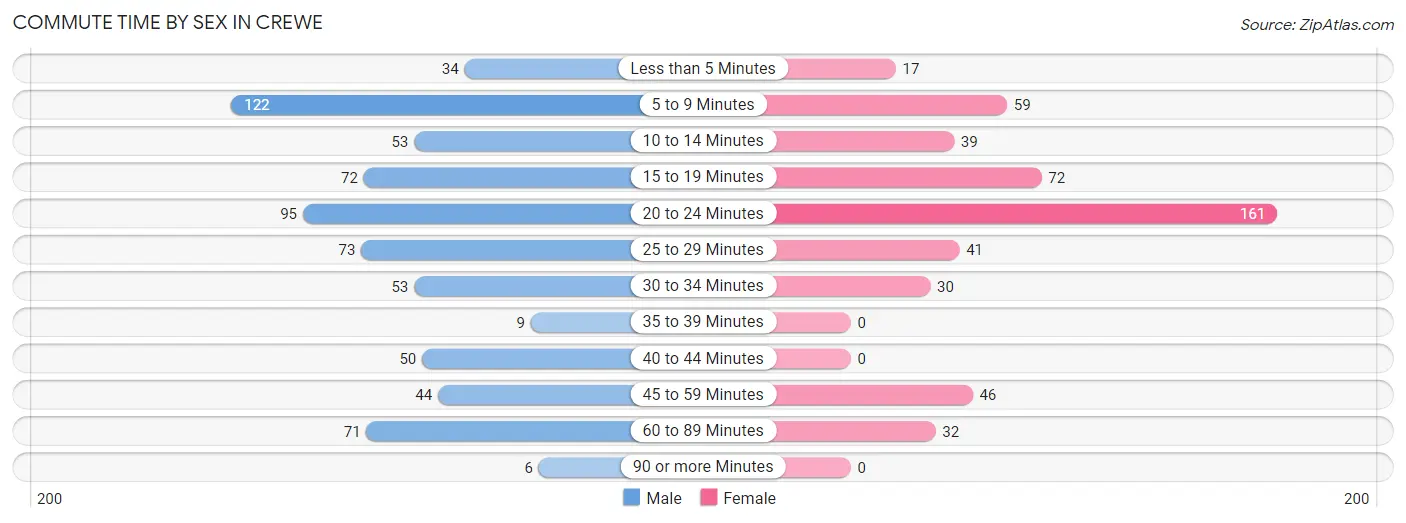
| Commute Time | Male | Female |
| Less than 5 Minutes | 34 (5.0%) | 17 (3.4%) |
| 5 to 9 Minutes | 122 (17.9%) | 59 (11.9%) |
| 10 to 14 Minutes | 53 (7.8%) | 39 (7.9%) |
| 15 to 19 Minutes | 72 (10.6%) | 72 (14.5%) |
| 20 to 24 Minutes | 95 (13.9%) | 161 (32.4%) |
| 25 to 29 Minutes | 73 (10.7%) | 41 (8.3%) |
| 30 to 34 Minutes | 53 (7.8%) | 30 (6.0%) |
| 35 to 39 Minutes | 9 (1.3%) | 0 (0.0%) |
| 40 to 44 Minutes | 50 (7.3%) | 0 (0.0%) |
| 45 to 59 Minutes | 44 (6.5%) | 46 (9.3%) |
| 60 to 89 Minutes | 71 (10.4%) | 32 (6.4%) |
| 90 or more Minutes | 6 (0.9%) | 0 (0.0%) |
Time of Departure to Work by Sex in Crewe
The most frequent times of departure to work in Crewe are 6:30 AM to 6:59 AM (133, 19.5%) for males and 7:00 AM to 7:29 AM (87, 17.5%) for females.
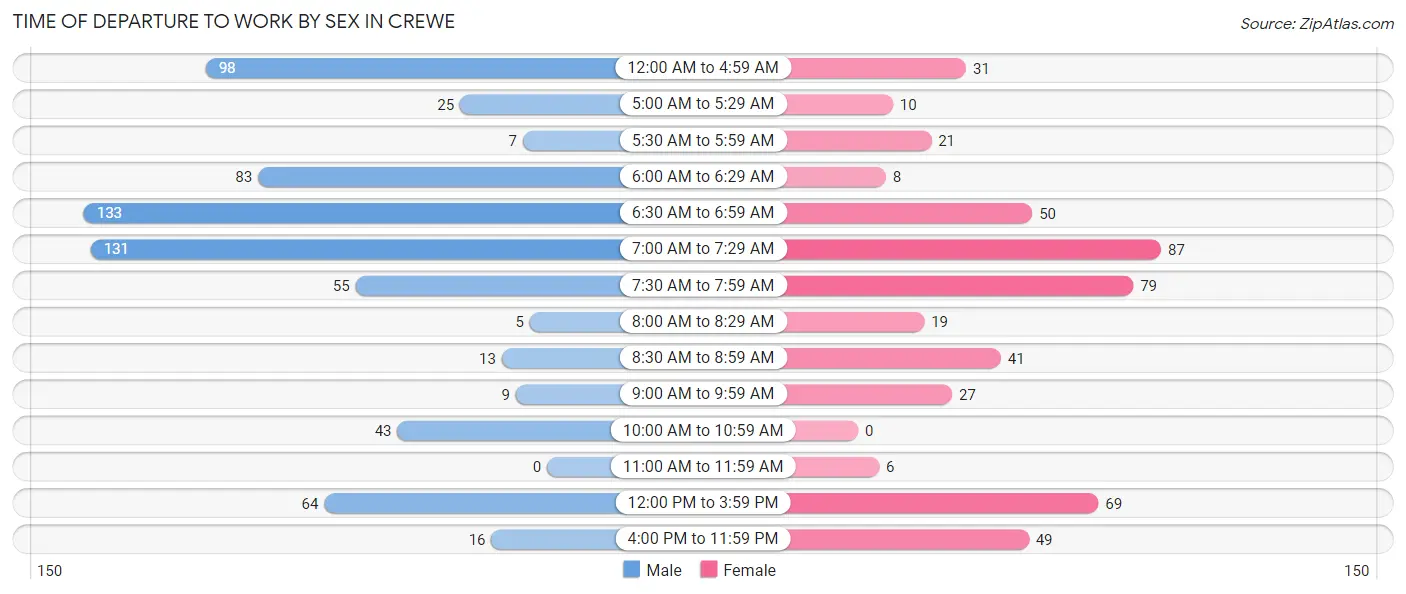
| Time of Departure | Male | Female |
| 12:00 AM to 4:59 AM | 98 (14.4%) | 31 (6.2%) |
| 5:00 AM to 5:29 AM | 25 (3.7%) | 10 (2.0%) |
| 5:30 AM to 5:59 AM | 7 (1.0%) | 21 (4.2%) |
| 6:00 AM to 6:29 AM | 83 (12.2%) | 8 (1.6%) |
| 6:30 AM to 6:59 AM | 133 (19.5%) | 50 (10.1%) |
| 7:00 AM to 7:29 AM | 131 (19.2%) | 87 (17.5%) |
| 7:30 AM to 7:59 AM | 55 (8.1%) | 79 (15.9%) |
| 8:00 AM to 8:29 AM | 5 (0.7%) | 19 (3.8%) |
| 8:30 AM to 8:59 AM | 13 (1.9%) | 41 (8.3%) |
| 9:00 AM to 9:59 AM | 9 (1.3%) | 27 (5.4%) |
| 10:00 AM to 10:59 AM | 43 (6.3%) | 0 (0.0%) |
| 11:00 AM to 11:59 AM | 0 (0.0%) | 6 (1.2%) |
| 12:00 PM to 3:59 PM | 64 (9.4%) | 69 (13.9%) |
| 4:00 PM to 11:59 PM | 16 (2.4%) | 49 (9.9%) |
| Total | 682 (100.0%) | 497 (100.0%) |
Housing Occupancy in Crewe
Occupancy by Ownership in Crewe
Of the total 1,186 dwellings in Crewe, owner-occupied units account for 648 (54.6%), while renter-occupied units make up 538 (45.4%).
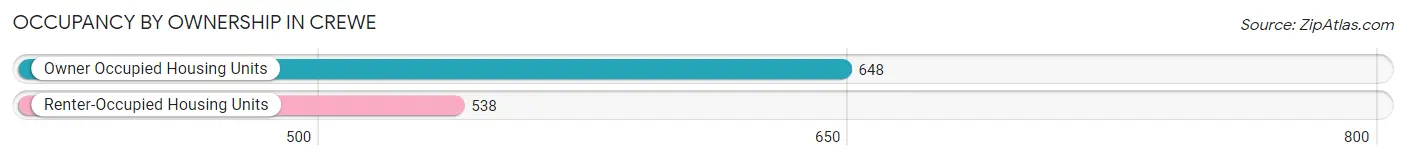
| Occupancy | # Housing Units | % Housing Units |
| Owner Occupied Housing Units | 648 | 54.6% |
| Renter-Occupied Housing Units | 538 | 45.4% |
| Total Occupied Housing Units | 1,186 | 100.0% |
Occupancy by Household Size in Crewe
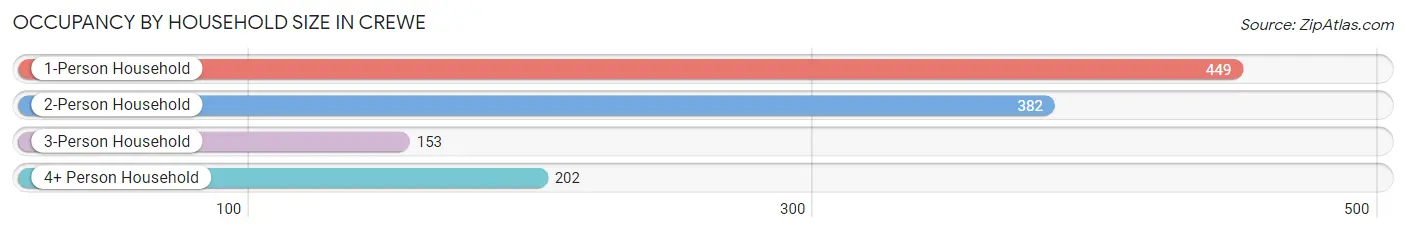
| Household Size | # Housing Units | % Housing Units |
| 1-Person Household | 449 | 37.9% |
| 2-Person Household | 382 | 32.2% |
| 3-Person Household | 153 | 12.9% |
| 4+ Person Household | 202 | 17.0% |
| Total Housing Units | 1,186 | 100.0% |
Occupancy by Ownership by Household Size in Crewe
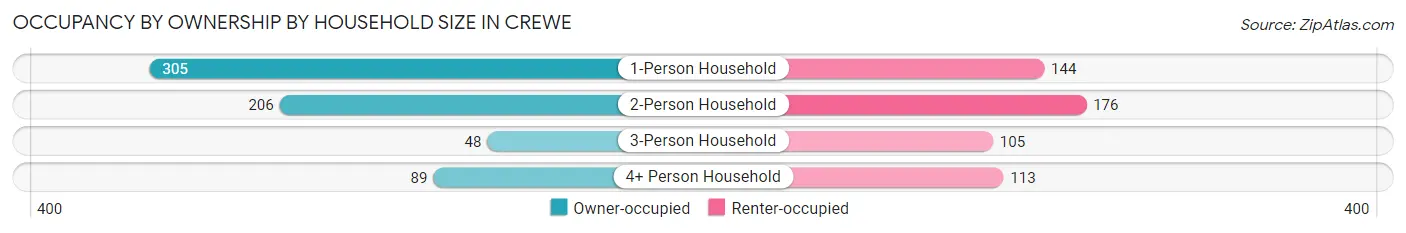
| Household Size | Owner-occupied | Renter-occupied |
| 1-Person Household | 305 (67.9%) | 144 (32.1%) |
| 2-Person Household | 206 (53.9%) | 176 (46.1%) |
| 3-Person Household | 48 (31.4%) | 105 (68.6%) |
| 4+ Person Household | 89 (44.1%) | 113 (55.9%) |
| Total Housing Units | 648 (54.6%) | 538 (45.4%) |
Occupancy by Educational Attainment in Crewe
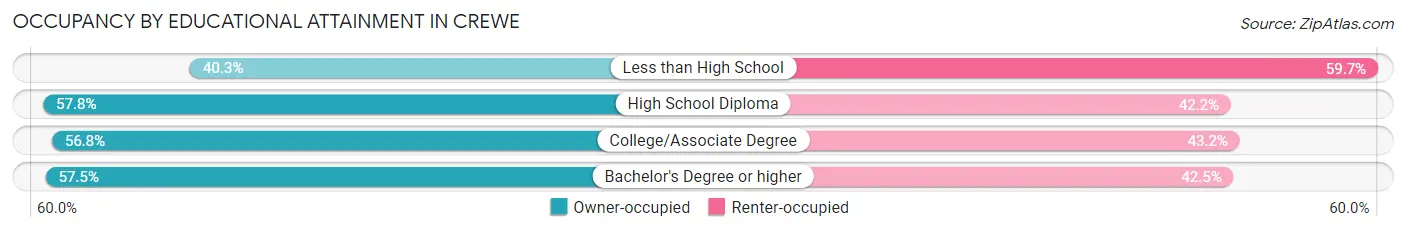
| Household Size | Owner-occupied | Renter-occupied |
| Less than High School | 75 (40.3%) | 111 (59.7%) |
| High School Diploma | 200 (57.8%) | 146 (42.2%) |
| College/Associate Degree | 235 (56.8%) | 179 (43.2%) |
| Bachelor's Degree or higher | 138 (57.5%) | 102 (42.5%) |
Occupancy by Age of Householder in Crewe
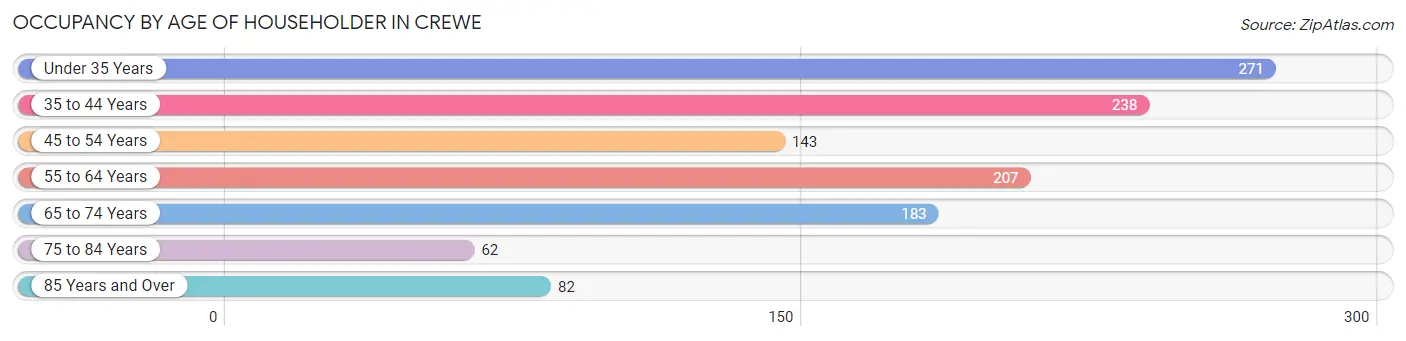
| Age Bracket | # Households | % Households |
| Under 35 Years | 271 | 22.9% |
| 35 to 44 Years | 238 | 20.1% |
| 45 to 54 Years | 143 | 12.1% |
| 55 to 64 Years | 207 | 17.4% |
| 65 to 74 Years | 183 | 15.4% |
| 75 to 84 Years | 62 | 5.2% |
| 85 Years and Over | 82 | 6.9% |
| Total | 1,186 | 100.0% |
Housing Finances in Crewe
Median Income by Occupancy in Crewe
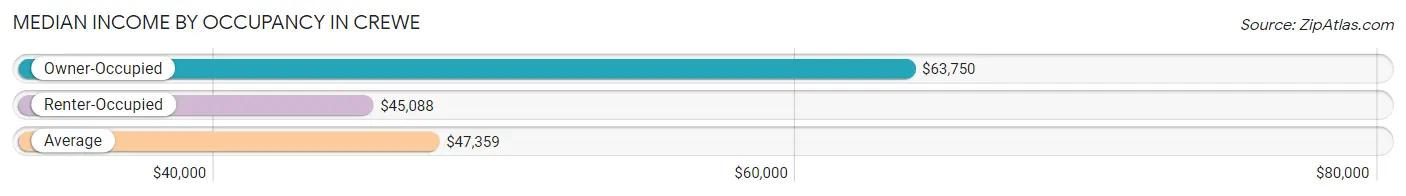
| Occupancy Type | # Households | Median Income |
| Owner-Occupied | 648 (54.6%) | $63,750 |
| Renter-Occupied | 538 (45.4%) | $45,088 |
| Average | 1,186 (100.0%) | $47,359 |
Occupancy by Householder Income Bracket in Crewe
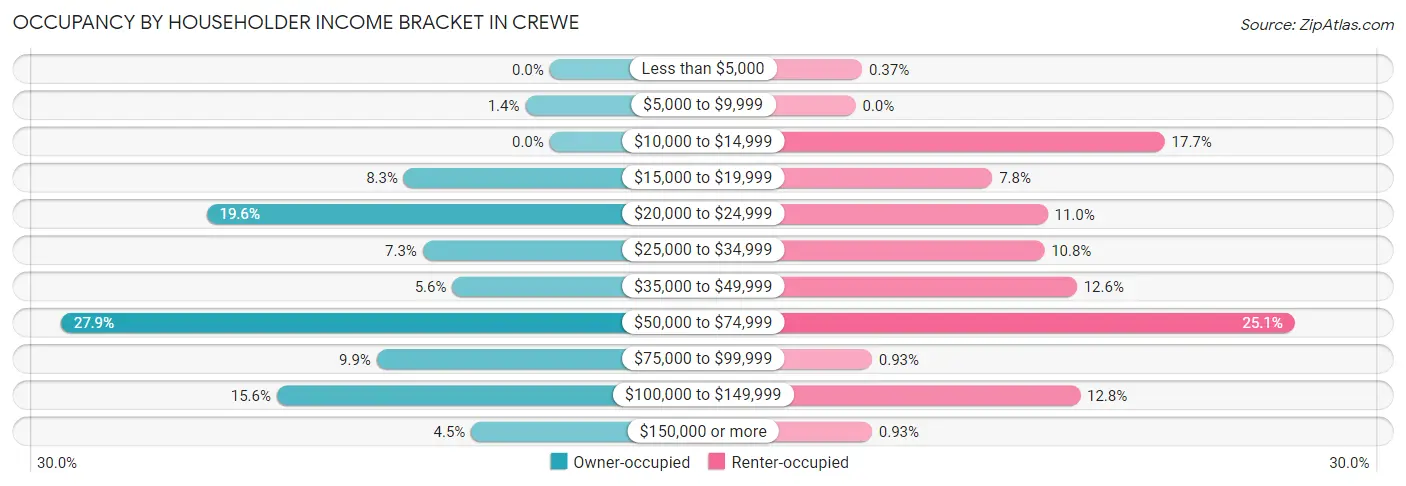
| Income Bracket | Owner-occupied | Renter-occupied |
| Less than $5,000 | 0 (0.0%) | 2 (0.4%) |
| $5,000 to $9,999 | 9 (1.4%) | 0 (0.0%) |
| $10,000 to $14,999 | 0 (0.0%) | 95 (17.7%) |
| $15,000 to $19,999 | 54 (8.3%) | 42 (7.8%) |
| $20,000 to $24,999 | 127 (19.6%) | 59 (11.0%) |
| $25,000 to $34,999 | 47 (7.2%) | 58 (10.8%) |
| $35,000 to $49,999 | 36 (5.6%) | 68 (12.6%) |
| $50,000 to $74,999 | 181 (27.9%) | 135 (25.1%) |
| $75,000 to $99,999 | 64 (9.9%) | 5 (0.9%) |
| $100,000 to $149,999 | 101 (15.6%) | 69 (12.8%) |
| $150,000 or more | 29 (4.5%) | 5 (0.9%) |
| Total | 648 (100.0%) | 538 (100.0%) |
Monthly Housing Cost Tiers in Crewe
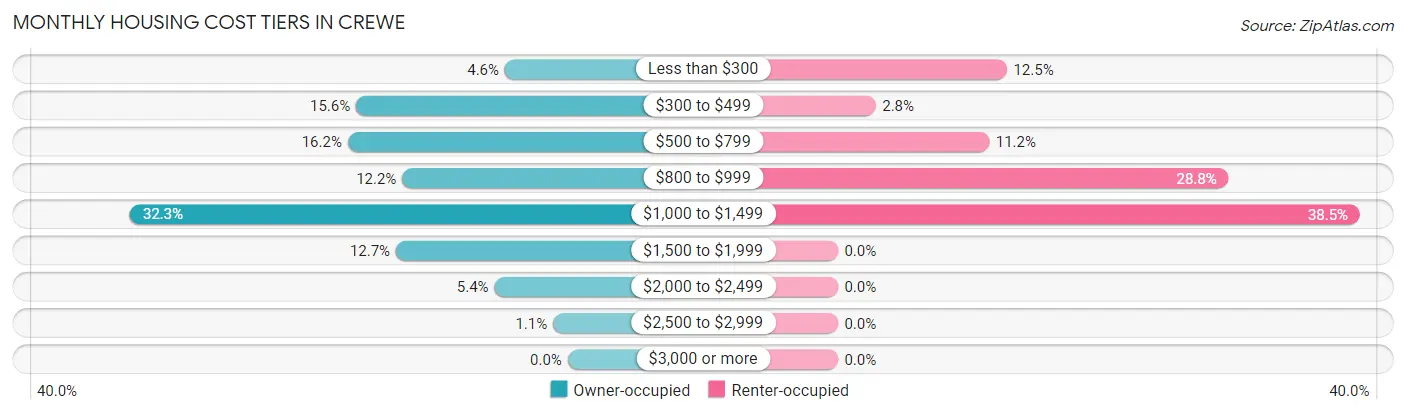
| Monthly Cost | Owner-occupied | Renter-occupied |
| Less than $300 | 30 (4.6%) | 67 (12.4%) |
| $300 to $499 | 101 (15.6%) | 15 (2.8%) |
| $500 to $799 | 105 (16.2%) | 60 (11.2%) |
| $800 to $999 | 79 (12.2%) | 155 (28.8%) |
| $1,000 to $1,499 | 209 (32.3%) | 207 (38.5%) |
| $1,500 to $1,999 | 82 (12.7%) | 0 (0.0%) |
| $2,000 to $2,499 | 35 (5.4%) | 0 (0.0%) |
| $2,500 to $2,999 | 7 (1.1%) | 0 (0.0%) |
| $3,000 or more | 0 (0.0%) | 0 (0.0%) |
| Total | 648 (100.0%) | 538 (100.0%) |
Physical Housing Characteristics in Crewe
Housing Structures in Crewe
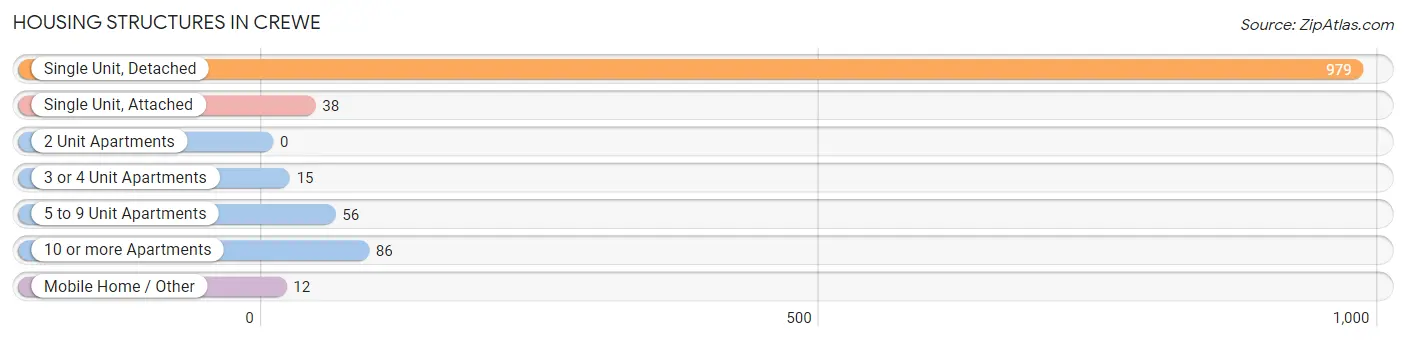
| Structure Type | # Housing Units | % Housing Units |
| Single Unit, Detached | 979 | 82.6% |
| Single Unit, Attached | 38 | 3.2% |
| 2 Unit Apartments | 0 | 0.0% |
| 3 or 4 Unit Apartments | 15 | 1.3% |
| 5 to 9 Unit Apartments | 56 | 4.7% |
| 10 or more Apartments | 86 | 7.2% |
| Mobile Home / Other | 12 | 1.0% |
| Total | 1,186 | 100.0% |
Housing Structures by Occupancy in Crewe
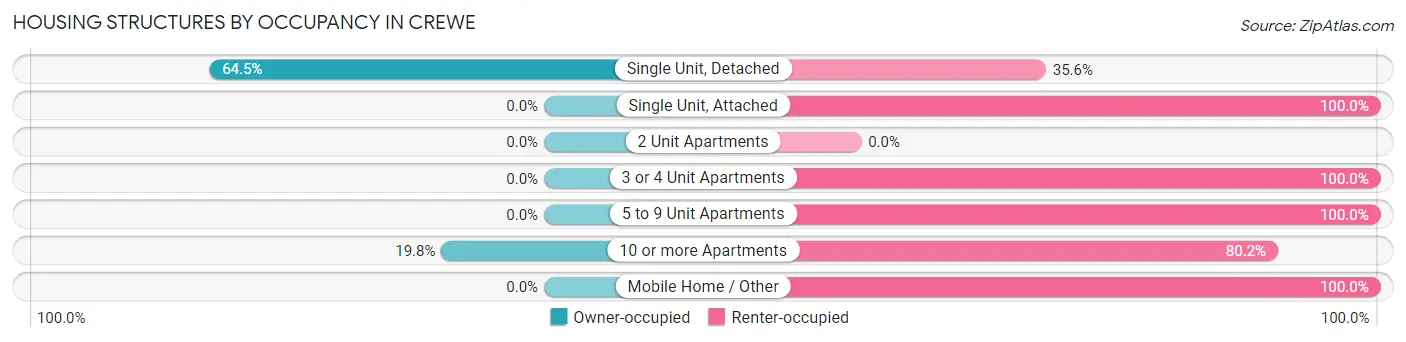
| Structure Type | Owner-occupied | Renter-occupied |
| Single Unit, Detached | 631 (64.4%) | 348 (35.5%) |
| Single Unit, Attached | 0 (0.0%) | 38 (100.0%) |
| 2 Unit Apartments | 0 (0.0%) | 0 (0.0%) |
| 3 or 4 Unit Apartments | 0 (0.0%) | 15 (100.0%) |
| 5 to 9 Unit Apartments | 0 (0.0%) | 56 (100.0%) |
| 10 or more Apartments | 17 (19.8%) | 69 (80.2%) |
| Mobile Home / Other | 0 (0.0%) | 12 (100.0%) |
| Total | 648 (54.6%) | 538 (45.4%) |
Housing Structures by Number of Rooms in Crewe
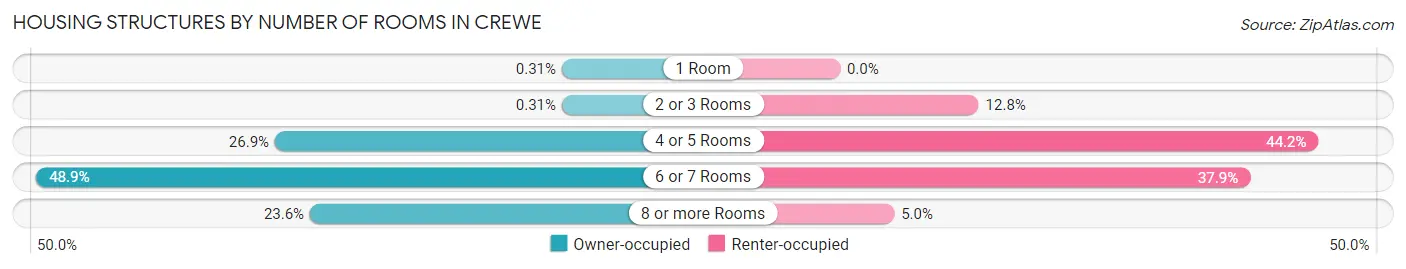
| Number of Rooms | Owner-occupied | Renter-occupied |
| 1 Room | 2 (0.3%) | 0 (0.0%) |
| 2 or 3 Rooms | 2 (0.3%) | 69 (12.8%) |
| 4 or 5 Rooms | 174 (26.9%) | 238 (44.2%) |
| 6 or 7 Rooms | 317 (48.9%) | 204 (37.9%) |
| 8 or more Rooms | 153 (23.6%) | 27 (5.0%) |
| Total | 648 (100.0%) | 538 (100.0%) |
Housing Structure by Heating Type in Crewe
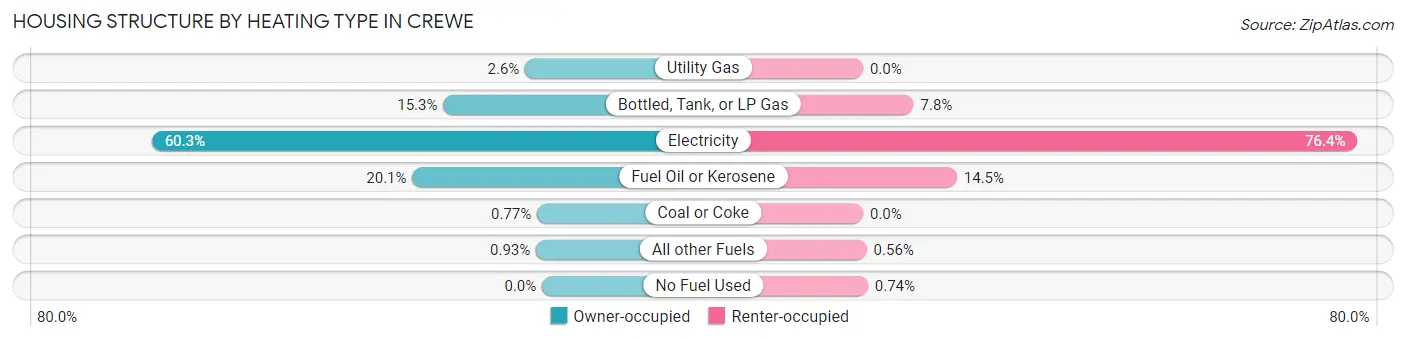
| Heating Type | Owner-occupied | Renter-occupied |
| Utility Gas | 17 (2.6%) | 0 (0.0%) |
| Bottled, Tank, or LP Gas | 99 (15.3%) | 42 (7.8%) |
| Electricity | 391 (60.3%) | 411 (76.4%) |
| Fuel Oil or Kerosene | 130 (20.1%) | 78 (14.5%) |
| Coal or Coke | 5 (0.8%) | 0 (0.0%) |
| All other Fuels | 6 (0.9%) | 3 (0.6%) |
| No Fuel Used | 0 (0.0%) | 4 (0.7%) |
| Total | 648 (100.0%) | 538 (100.0%) |
Household Vehicle Usage in Crewe
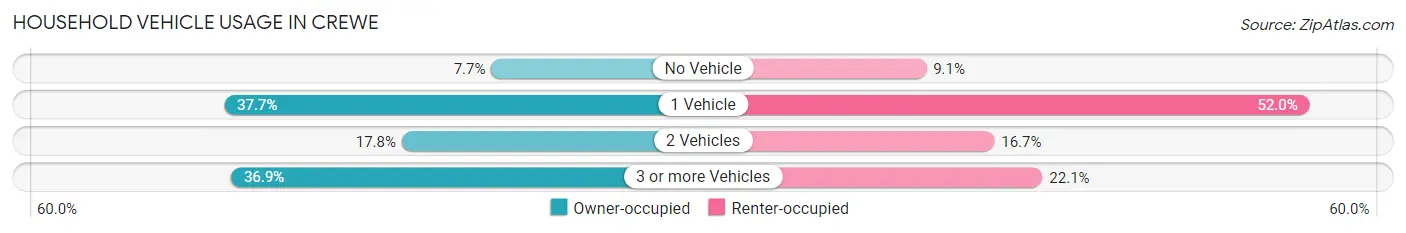
| Vehicles per Household | Owner-occupied | Renter-occupied |
| No Vehicle | 50 (7.7%) | 49 (9.1%) |
| 1 Vehicle | 244 (37.7%) | 280 (52.0%) |
| 2 Vehicles | 115 (17.7%) | 90 (16.7%) |
| 3 or more Vehicles | 239 (36.9%) | 119 (22.1%) |
| Total | 648 (100.0%) | 538 (100.0%) |
Real Estate & Mortgages in Crewe
Real Estate and Mortgage Overview in Crewe
| Characteristic | Without Mortgage | With Mortgage |
| Housing Units | 183 | 465 |
| Median Property Value | $115,900 | $134,900 |
| Median Household Income | - | - |
| Monthly Housing Costs | $392 | $0 |
| Real Estate Taxes | $632 | $0 |
Property Value by Mortgage Status in Crewe
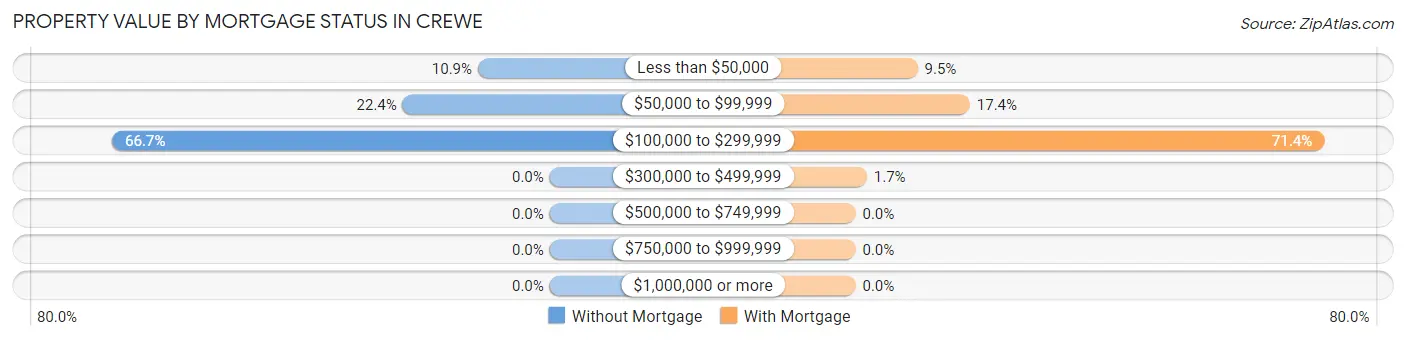
| Property Value | Without Mortgage | With Mortgage |
| Less than $50,000 | 20 (10.9%) | 44 (9.5%) |
| $50,000 to $99,999 | 41 (22.4%) | 81 (17.4%) |
| $100,000 to $299,999 | 122 (66.7%) | 332 (71.4%) |
| $300,000 to $499,999 | 0 (0.0%) | 8 (1.7%) |
| $500,000 to $749,999 | 0 (0.0%) | 0 (0.0%) |
| $750,000 to $999,999 | 0 (0.0%) | 0 (0.0%) |
| $1,000,000 or more | 0 (0.0%) | 0 (0.0%) |
| Total | 183 (100.0%) | 465 (100.0%) |
Household Income by Mortgage Status in Crewe
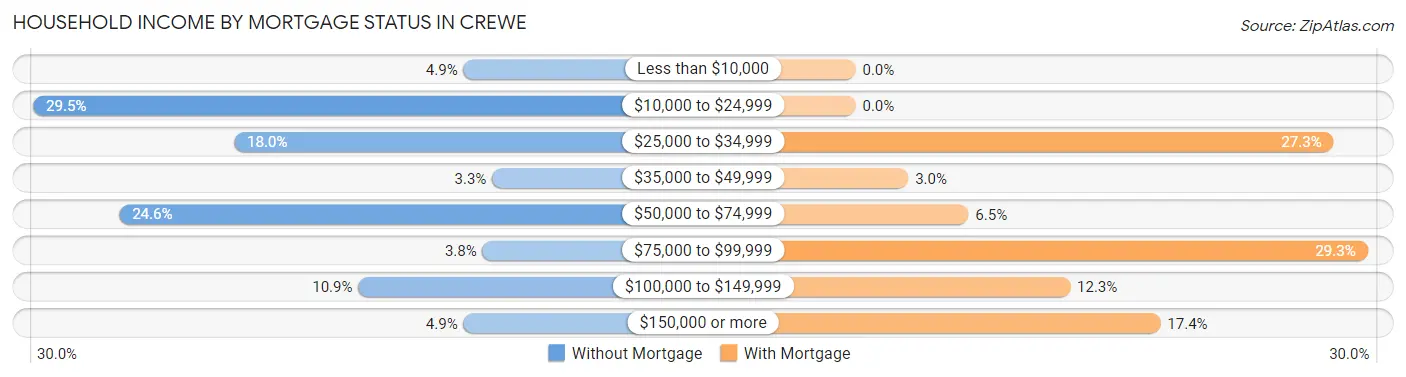
| Household Income | Without Mortgage | With Mortgage |
| Less than $10,000 | 9 (4.9%) | 0 (0.0%) |
| $10,000 to $24,999 | 54 (29.5%) | 0 (0.0%) |
| $25,000 to $34,999 | 33 (18.0%) | 127 (27.3%) |
| $35,000 to $49,999 | 6 (3.3%) | 14 (3.0%) |
| $50,000 to $74,999 | 45 (24.6%) | 30 (6.5%) |
| $75,000 to $99,999 | 7 (3.8%) | 136 (29.2%) |
| $100,000 to $149,999 | 20 (10.9%) | 57 (12.3%) |
| $150,000 or more | 9 (4.9%) | 81 (17.4%) |
| Total | 183 (100.0%) | 465 (100.0%) |
Property Value to Household Income Ratio in Crewe
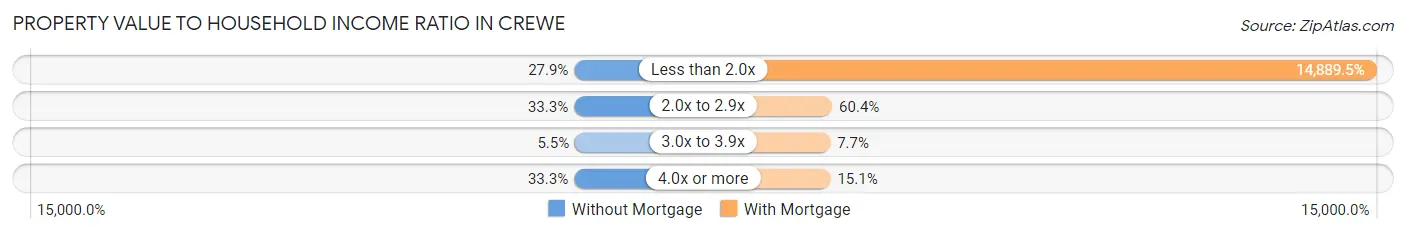
| Value-to-Income Ratio | Without Mortgage | With Mortgage |
| Less than 2.0x | 51 (27.9%) | 69,236 (14,889.5%) |
| 2.0x to 2.9x | 61 (33.3%) | 281 (60.4%) |
| 3.0x to 3.9x | 10 (5.5%) | 36 (7.7%) |
| 4.0x or more | 61 (33.3%) | 70 (15.0%) |
| Total | 183 (100.0%) | 465 (100.0%) |
Real Estate Taxes by Mortgage Status in Crewe
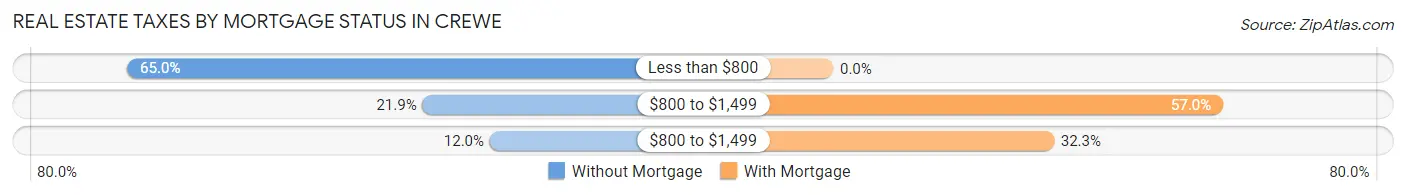
| Property Taxes | Without Mortgage | With Mortgage |
| Less than $800 | 119 (65.0%) | 0 (0.0%) |
| $800 to $1,499 | 40 (21.9%) | 265 (57.0%) |
| $800 to $1,499 | 22 (12.0%) | 150 (32.3%) |
| Total | 183 (100.0%) | 465 (100.0%) |
Health & Disability in Crewe
Health Insurance Coverage by Age in Crewe
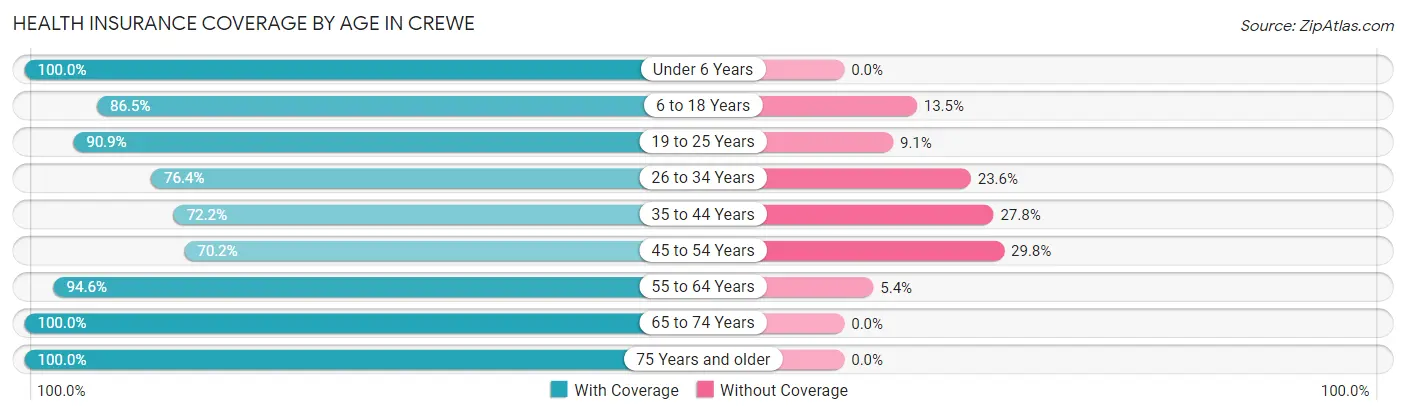
| Age Bracket | With Coverage | Without Coverage |
| Under 6 Years | 340 (100.0%) | 0 (0.0%) |
| 6 to 18 Years | 467 (86.5%) | 73 (13.5%) |
| 19 to 25 Years | 150 (90.9%) | 15 (9.1%) |
| 26 to 34 Years | 434 (76.4%) | 134 (23.6%) |
| 35 to 44 Years | 288 (72.2%) | 111 (27.8%) |
| 45 to 54 Years | 172 (70.2%) | 73 (29.8%) |
| 55 to 64 Years | 279 (94.6%) | 16 (5.4%) |
| 65 to 74 Years | 218 (100.0%) | 0 (0.0%) |
| 75 Years and older | 161 (100.0%) | 0 (0.0%) |
| Total | 2,509 (85.6%) | 422 (14.4%) |
Health Insurance Coverage by Citizenship Status in Crewe
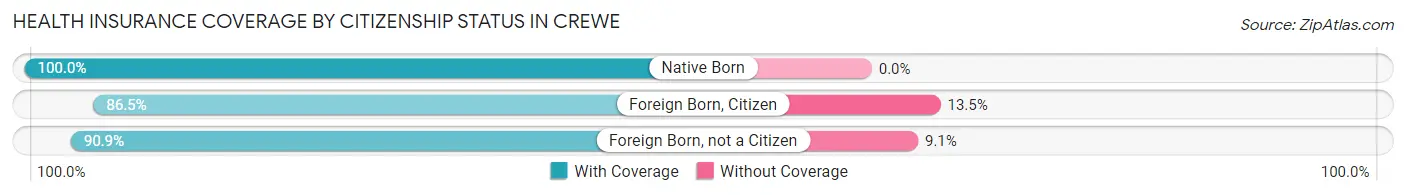
| Citizenship Status | With Coverage | Without Coverage |
| Native Born | 340 (100.0%) | 0 (0.0%) |
| Foreign Born, Citizen | 467 (86.5%) | 73 (13.5%) |
| Foreign Born, not a Citizen | 150 (90.9%) | 15 (9.1%) |
Health Insurance Coverage by Household Income in Crewe
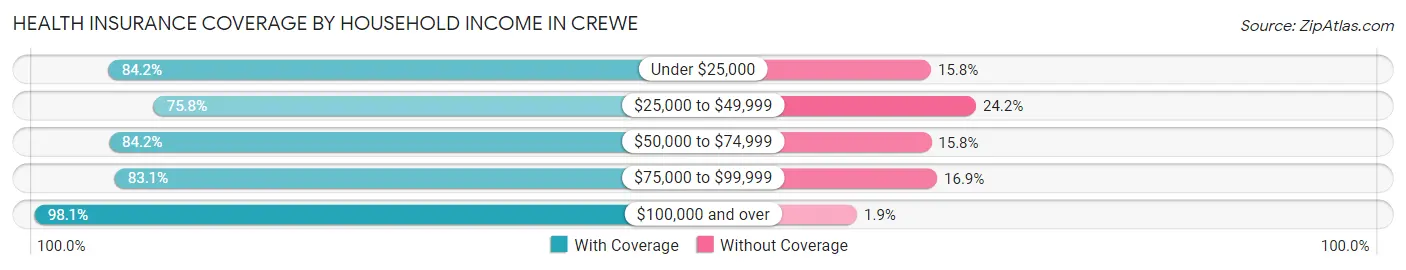
| Household Income | With Coverage | Without Coverage |
| Under $25,000 | 523 (84.2%) | 98 (15.8%) |
| $25,000 to $49,999 | 385 (75.8%) | 123 (24.2%) |
| $50,000 to $74,999 | 829 (84.2%) | 156 (15.8%) |
| $75,000 to $99,999 | 162 (83.1%) | 33 (16.9%) |
| $100,000 and over | 610 (98.1%) | 12 (1.9%) |
Public vs Private Health Insurance Coverage by Age in Crewe
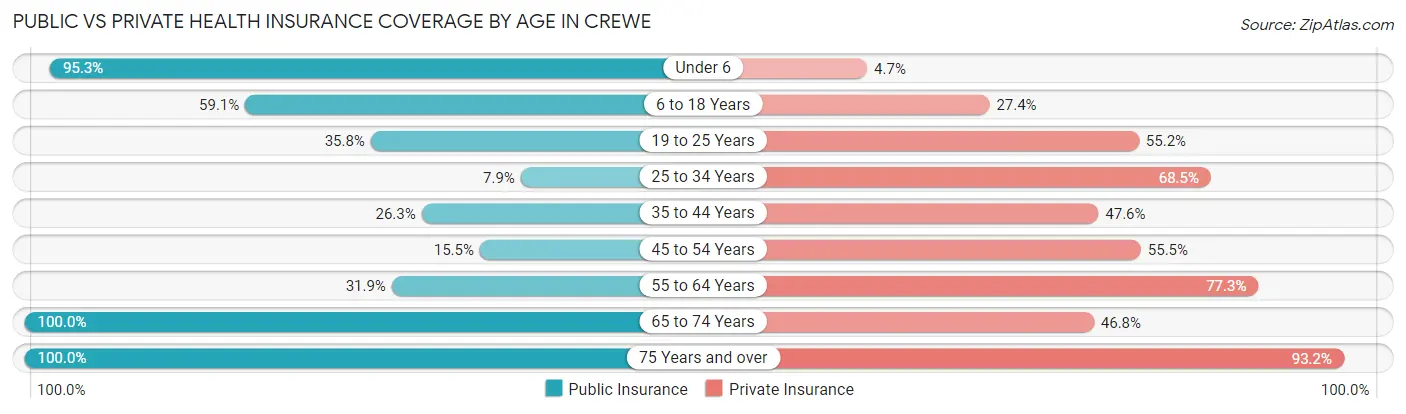
| Age Bracket | Public Insurance | Private Insurance |
| Under 6 | 324 (95.3%) | 16 (4.7%) |
| 6 to 18 Years | 319 (59.1%) | 148 (27.4%) |
| 19 to 25 Years | 59 (35.8%) | 91 (55.1%) |
| 25 to 34 Years | 45 (7.9%) | 389 (68.5%) |
| 35 to 44 Years | 105 (26.3%) | 190 (47.6%) |
| 45 to 54 Years | 38 (15.5%) | 136 (55.5%) |
| 55 to 64 Years | 94 (31.9%) | 228 (77.3%) |
| 65 to 74 Years | 218 (100.0%) | 102 (46.8%) |
| 75 Years and over | 161 (100.0%) | 150 (93.2%) |
| Total | 1,363 (46.5%) | 1,450 (49.5%) |
Disability Status by Sex by Age in Crewe
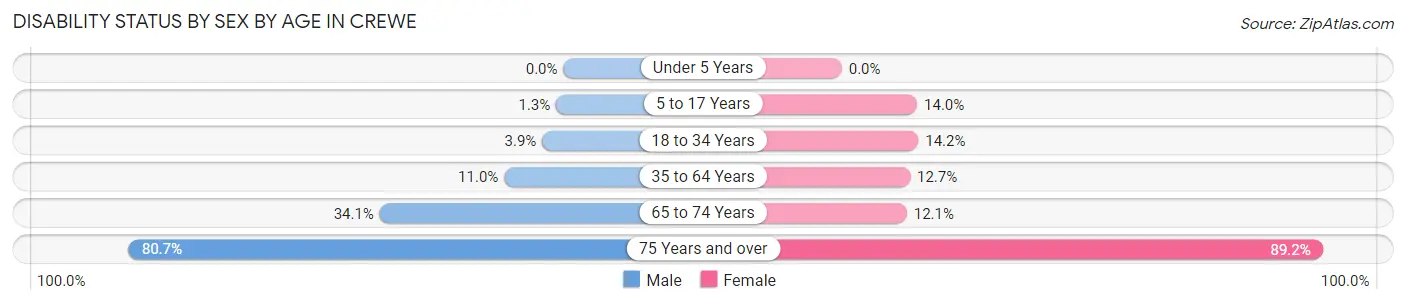
| Age Bracket | Male | Female |
| Under 5 Years | 0 (0.0%) | 0 (0.0%) |
| 5 to 17 Years | 4 (1.3%) | 52 (14.0%) |
| 18 to 34 Years | 17 (3.9%) | 46 (14.2%) |
| 35 to 64 Years | 52 (11.0%) | 59 (12.7%) |
| 65 to 74 Years | 15 (34.1%) | 21 (12.1%) |
| 75 Years and over | 25 (80.6%) | 116 (89.2%) |
Disability Class by Sex by Age in Crewe
Disability Class: Hearing Difficulty
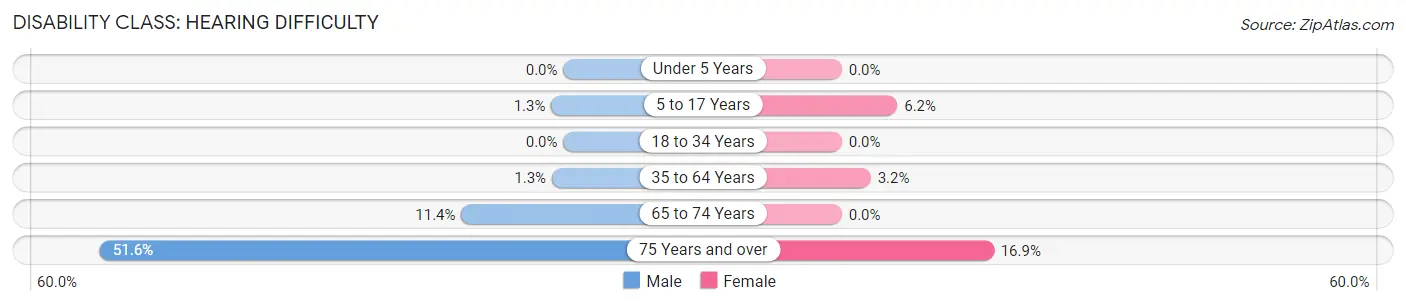
| Age Bracket | Male | Female |
| Under 5 Years | 0 (0.0%) | 0 (0.0%) |
| 5 to 17 Years | 4 (1.3%) | 23 (6.2%) |
| 18 to 34 Years | 0 (0.0%) | 0 (0.0%) |
| 35 to 64 Years | 6 (1.3%) | 15 (3.2%) |
| 65 to 74 Years | 5 (11.4%) | 0 (0.0%) |
| 75 Years and over | 16 (51.6%) | 22 (16.9%) |
Disability Class: Vision Difficulty
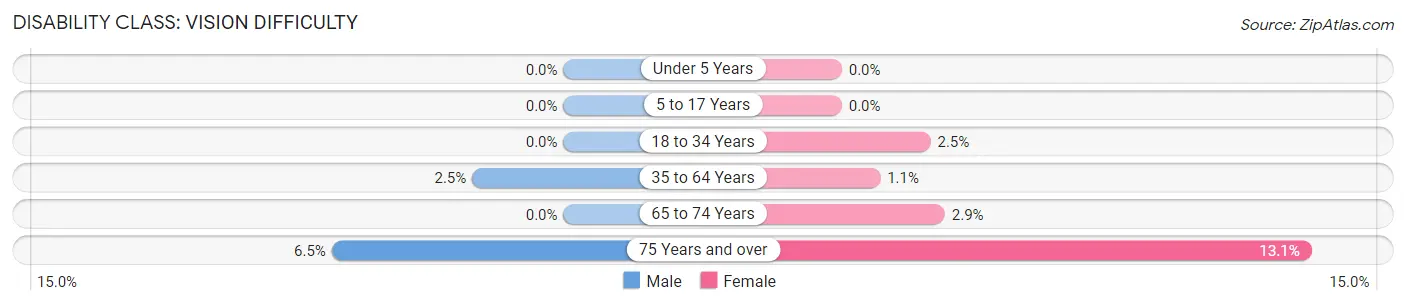
| Age Bracket | Male | Female |
| Under 5 Years | 0 (0.0%) | 0 (0.0%) |
| 5 to 17 Years | 0 (0.0%) | 0 (0.0%) |
| 18 to 34 Years | 0 (0.0%) | 8 (2.5%) |
| 35 to 64 Years | 12 (2.5%) | 5 (1.1%) |
| 65 to 74 Years | 0 (0.0%) | 5 (2.9%) |
| 75 Years and over | 2 (6.5%) | 17 (13.1%) |
Disability Class: Cognitive Difficulty
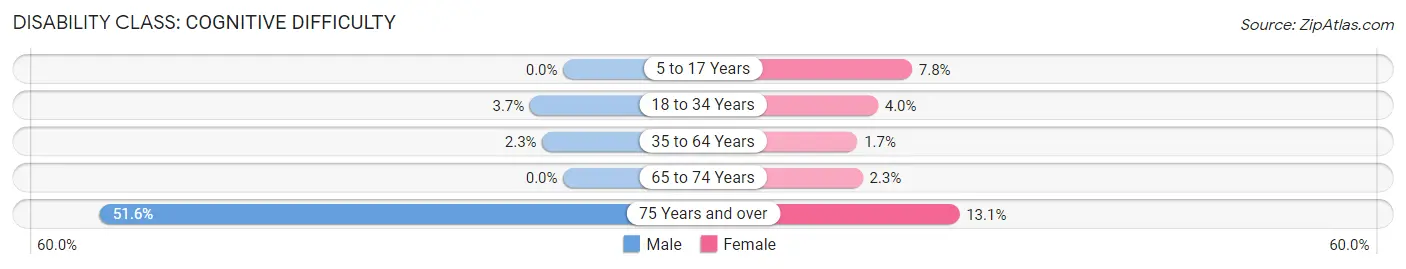
| Age Bracket | Male | Female |
| 5 to 17 Years | 0 (0.0%) | 29 (7.8%) |
| 18 to 34 Years | 16 (3.7%) | 13 (4.0%) |
| 35 to 64 Years | 11 (2.3%) | 8 (1.7%) |
| 65 to 74 Years | 0 (0.0%) | 4 (2.3%) |
| 75 Years and over | 16 (51.6%) | 17 (13.1%) |
Disability Class: Ambulatory Difficulty
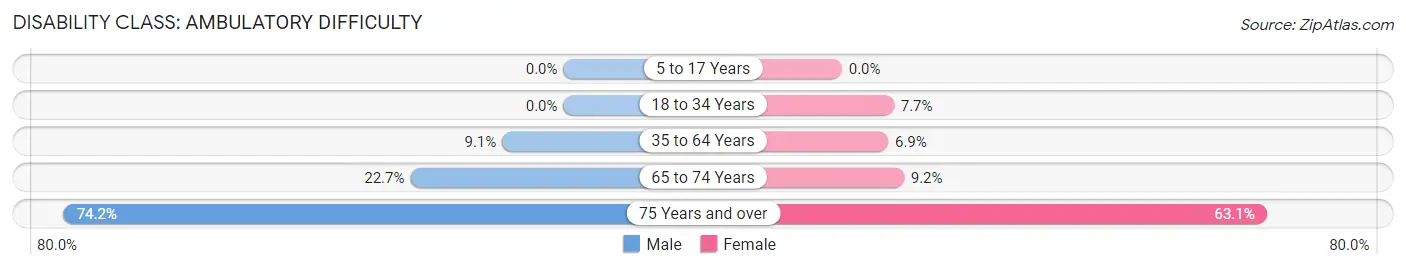
| Age Bracket | Male | Female |
| 5 to 17 Years | 0 (0.0%) | 0 (0.0%) |
| 18 to 34 Years | 0 (0.0%) | 25 (7.7%) |
| 35 to 64 Years | 43 (9.1%) | 32 (6.9%) |
| 65 to 74 Years | 10 (22.7%) | 16 (9.2%) |
| 75 Years and over | 23 (74.2%) | 82 (63.1%) |
Disability Class: Self-Care Difficulty
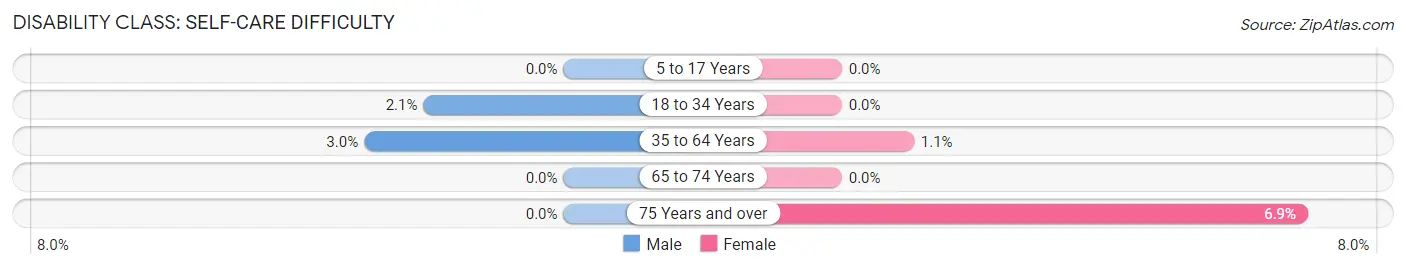
| Age Bracket | Male | Female |
| 5 to 17 Years | 0 (0.0%) | 0 (0.0%) |
| 18 to 34 Years | 9 (2.1%) | 0 (0.0%) |
| 35 to 64 Years | 14 (3.0%) | 5 (1.1%) |
| 65 to 74 Years | 0 (0.0%) | 0 (0.0%) |
| 75 Years and over | 0 (0.0%) | 9 (6.9%) |
Technology Access in Crewe
Computing Device Access in Crewe
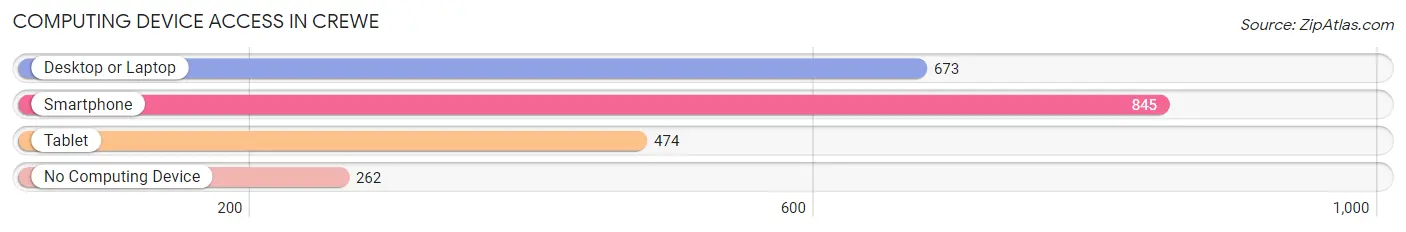
| Device Type | # Households | % Households |
| Desktop or Laptop | 673 | 56.8% |
| Smartphone | 845 | 71.3% |
| Tablet | 474 | 40.0% |
| No Computing Device | 262 | 22.1% |
| Total | 1,186 | 100.0% |
Internet Access in Crewe
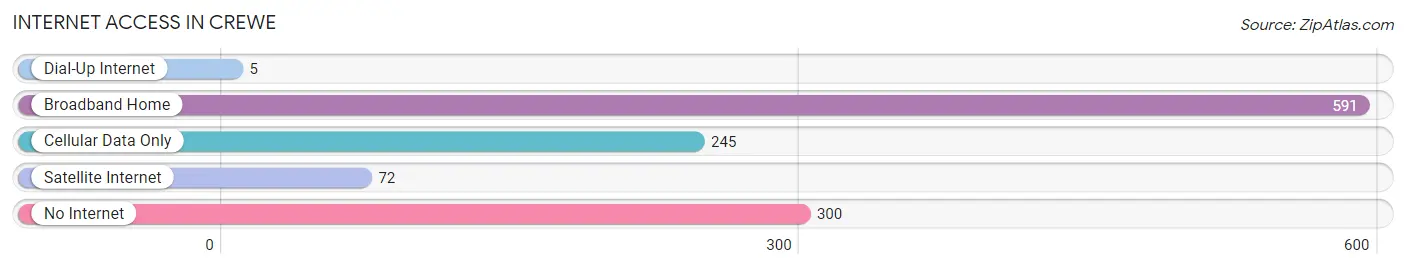
| Internet Type | # Households | % Households |
| Dial-Up Internet | 5 | 0.4% |
| Broadband Home | 591 | 49.8% |
| Cellular Data Only | 245 | 20.7% |
| Satellite Internet | 72 | 6.1% |
| No Internet | 300 | 25.3% |
| Total | 1,186 | 100.0% |
Crewe Summary
Crewe, Virginia is a small town located in Nottoway County, Virginia. It is situated in the south-central part of the state, approximately 50 miles south of Richmond and 40 miles north of Lynchburg. The town was founded in 1883 and is named after the English town of Crewe, Cheshire. The population of Crewe was 2,326 as of the 2010 census.
History
Crewe was founded in 1883 by the Richmond and Danville Railroad. The town was named after the English town of Crewe, Cheshire, which was the birthplace of the railroad's president, General William Mahone. The town was originally intended to be a railroad junction, but the plans were never realized.
The town was incorporated in 1887 and the first mayor was elected in 1888. The town quickly grew and by the early 1900s, it had become a thriving commercial center. The town was home to several businesses, including a bank, a hotel, a general store, a post office, and a variety of other stores.
In the early 1900s, Crewe was a popular destination for tourists. The town was home to several resorts, including the Crewe Hotel, which was built in 1906. The hotel was a popular destination for visitors from Richmond and other nearby cities.
In the 1920s, the town began to decline as the railroad industry began to decline. The town's population decreased and many of the businesses closed. The town was further impacted by the Great Depression and World War II.
Geography
Crewe is located in Nottoway County, Virginia. It is situated in the south-central part of the state, approximately 50 miles south of Richmond and 40 miles north of Lynchburg. The town is located on the banks of the Nottoway River.
The town has a total area of 1.3 square miles, all of which is land. The town is located in a rural area and is surrounded by farmland.
Economy
The economy of Crewe is largely based on agriculture. The town is home to several farms, which produce a variety of crops, including corn, soybeans, and wheat. The town is also home to several small businesses, including restaurants, retail stores, and service providers.
The town is also home to several manufacturing companies, including a furniture factory and a plastics factory. The town is also home to a number of trucking companies, which provide transportation services to the surrounding area.
Demographics
As of the 2010 census, the population of Crewe was 2,326. The racial makeup of the town was 79.2% White, 17.7% African American, 0.3% Native American, 0.2% Asian, 0.1% Pacific Islander, 0.7% from other races, and 1.9% from two or more races. Hispanic or Latino of any race were 1.7% of the population.
The median household income in Crewe was $37,917, and the median family income was $45,938. The per capita income in Crewe was $18,945. About 16.2% of the population was below the poverty line.
Common Questions
What is Per Capita Income in Crewe?
Per Capita income in Crewe is $24,445.
What is the Median Family Income in Crewe?
Median Family Income in Crewe is $55,978.
What is the Median Household income in Crewe?
Median Household Income in Crewe is $47,359.
What is Income or Wage Gap in Crewe?
Income or Wage Gap in Crewe is 31.8%.
Women in Crewe earn 68.2 cents for every dollar earned by a man.
What is Inequality or Gini Index in Crewe?
Inequality or Gini Index in Crewe is 0.39.
What is the Total Population of Crewe?
Total Population of Crewe is 2,931.
What is the Total Male Population of Crewe?
Total Male Population of Crewe is 1,386.
What is the Total Female Population of Crewe?
Total Female Population of Crewe is 1,545.
What is the Ratio of Males per 100 Females in Crewe?
There are 89.71 Males per 100 Females in Crewe.
What is the Ratio of Females per 100 Males in Crewe?
There are 111.47 Females per 100 Males in Crewe.
What is the Median Population Age in Crewe?
Median Population Age in Crewe is 31.5 Years.
What is the Average Family Size in Crewe
Average Family Size in Crewe is 3.3 People.
What is the Average Household Size in Crewe
Average Household Size in Crewe is 2.5 People.
How Large is the Labor Force in Crewe?
There are 1,393 People in the Labor Forcein in Crewe.
What is the Percentage of People in the Labor Force in Crewe?
64.4% of People are in the Labor Force in Crewe.
What is the Unemployment Rate in Crewe?
Unemployment Rate in Crewe is 9.0%.