Coeburn, VA Map & Demographics
Coeburn Map
Coeburn Overview
$26,968
PER CAPITA INCOME
$53,434
AVG FAMILY INCOME
$53,528
AVG HOUSEHOLD INCOME
37.1%
WAGE / INCOME GAP [ % ]
62.9¢/ $1
WAGE / INCOME GAP [ $ ]
0.40
INEQUALITY / GINI INDEX
1,533
TOTAL POPULATION
733
MALE POPULATION
800
FEMALE POPULATION
91.62
MALES / 100 FEMALES
109.14
FEMALES / 100 MALES
44.6
MEDIAN AGE
2.5
AVG FAMILY SIZE
2.3
AVG HOUSEHOLD SIZE
568
LABOR FORCE [ PEOPLE ]
43.8%
PERCENT IN LABOR FORCE
11.4%
UNEMPLOYMENT RATE
Coeburn Zip Codes
Coeburn Area Codes
Income in Coeburn
Income Overview in Coeburn
Per Capita Income in Coeburn is $26,968, while median incomes of families and households are $53,434 and $53,528 respectively.
| Characteristic | Number | Measure |
| Per Capita Income | 1,533 | $26,968 |
| Median Family Income | 521 | $53,434 |
| Mean Family Income | 521 | $68,036 |
| Median Household Income | 670 | $53,528 |
| Mean Household Income | 670 | $61,940 |
| Income Deficit | 521 | $0 |
| Wage / Income Gap (%) | 1,533 | 37.15% |
| Wage / Income Gap ($) | 1,533 | 62.85¢ per $1 |
| Gini / Inequality Index | 1,533 | 0.40 |
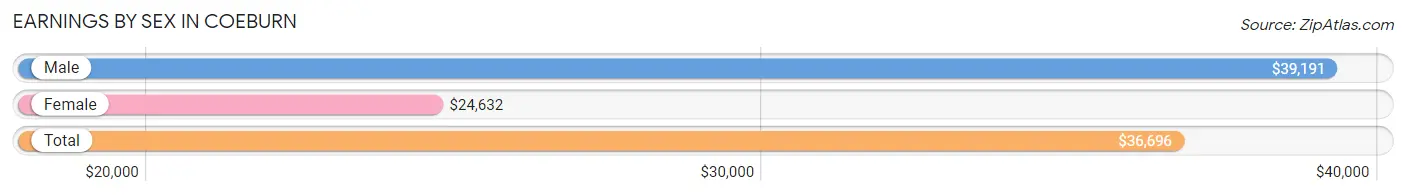
Earnings by Sex in Coeburn
Average Earnings in Coeburn are $36,696, $39,191 for men and $24,632 for women, a difference of 37.1%.
| Sex | Number | Average Earnings |
| Male | 319 (47.0%) | $39,191 |
| Female | 360 (53.0%) | $24,632 |
| Total | 679 (100.0%) | $36,696 |
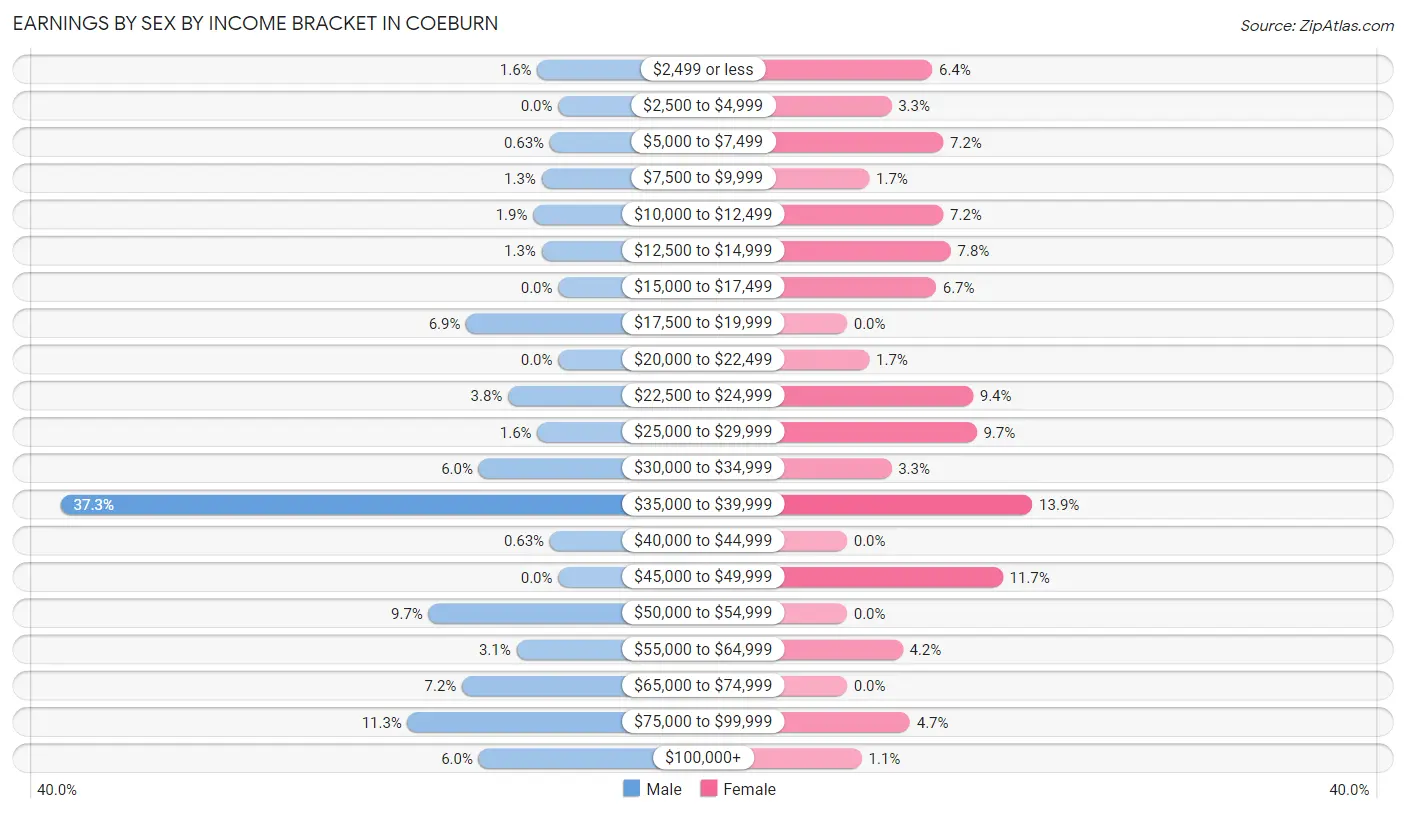
Earnings by Sex by Income Bracket in Coeburn
The most common earnings brackets in Coeburn are $35,000 to $39,999 for men (119 | 37.3%) and $35,000 to $39,999 for women (50 | 13.9%).
| Income | Male | Female |
| $2,499 or less | 5 (1.6%) | 23 (6.4%) |
| $2,500 to $4,999 | 0 (0.0%) | 12 (3.3%) |
| $5,000 to $7,499 | 2 (0.6%) | 26 (7.2%) |
| $7,500 to $9,999 | 4 (1.3%) | 6 (1.7%) |
| $10,000 to $12,499 | 6 (1.9%) | 26 (7.2%) |
| $12,500 to $14,999 | 4 (1.3%) | 28 (7.8%) |
| $15,000 to $17,499 | 0 (0.0%) | 24 (6.7%) |
| $17,500 to $19,999 | 22 (6.9%) | 0 (0.0%) |
| $20,000 to $22,499 | 0 (0.0%) | 6 (1.7%) |
| $22,500 to $24,999 | 12 (3.8%) | 34 (9.4%) |
| $25,000 to $29,999 | 5 (1.6%) | 35 (9.7%) |
| $30,000 to $34,999 | 19 (6.0%) | 12 (3.3%) |
| $35,000 to $39,999 | 119 (37.3%) | 50 (13.9%) |
| $40,000 to $44,999 | 2 (0.6%) | 0 (0.0%) |
| $45,000 to $49,999 | 0 (0.0%) | 42 (11.7%) |
| $50,000 to $54,999 | 31 (9.7%) | 0 (0.0%) |
| $55,000 to $64,999 | 10 (3.1%) | 15 (4.2%) |
| $65,000 to $74,999 | 23 (7.2%) | 0 (0.0%) |
| $75,000 to $99,999 | 36 (11.3%) | 17 (4.7%) |
| $100,000+ | 19 (6.0%) | 4 (1.1%) |
| Total | 319 (100.0%) | 360 (100.0%) |
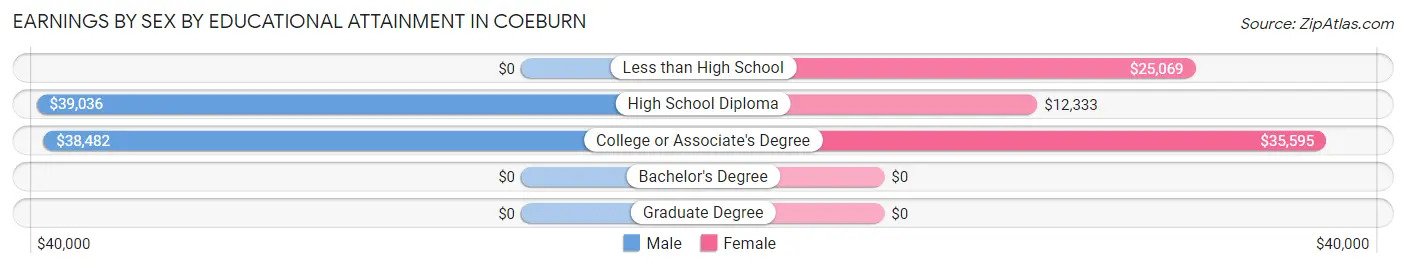
Earnings by Sex by Educational Attainment in Coeburn
Average earnings in Coeburn are $39,328 for men and $25,857 for women, a difference of 34.3%. Men with an educational attainment of high school diploma enjoy the highest average annual earnings of $39,036, while those with college or associate's degree education earn the least with $38,482. Women with an educational attainment of college or associate's degree earn the most with the average annual earnings of $35,595, while those with high school diploma education have the smallest earnings of $12,333.
| Educational Attainment | Male Income | Female Income |
| Less than High School | - | - |
| High School Diploma | $39,036 | $12,333 |
| College or Associate's Degree | $38,482 | $35,595 |
| Bachelor's Degree | - | - |
| Graduate Degree | - | - |
| Total | $39,328 | $25,857 |
Family Income in Coeburn
Family Income Brackets in Coeburn
According to the Coeburn family income data, there are 182 families falling into the $50,000 to $74,999 income range, which is the most common income bracket and makes up 34.9% of all families. Conversely, the $15,000 to $24,999 income bracket is the least frequent group with only 20 families (3.8%) belonging to this category.
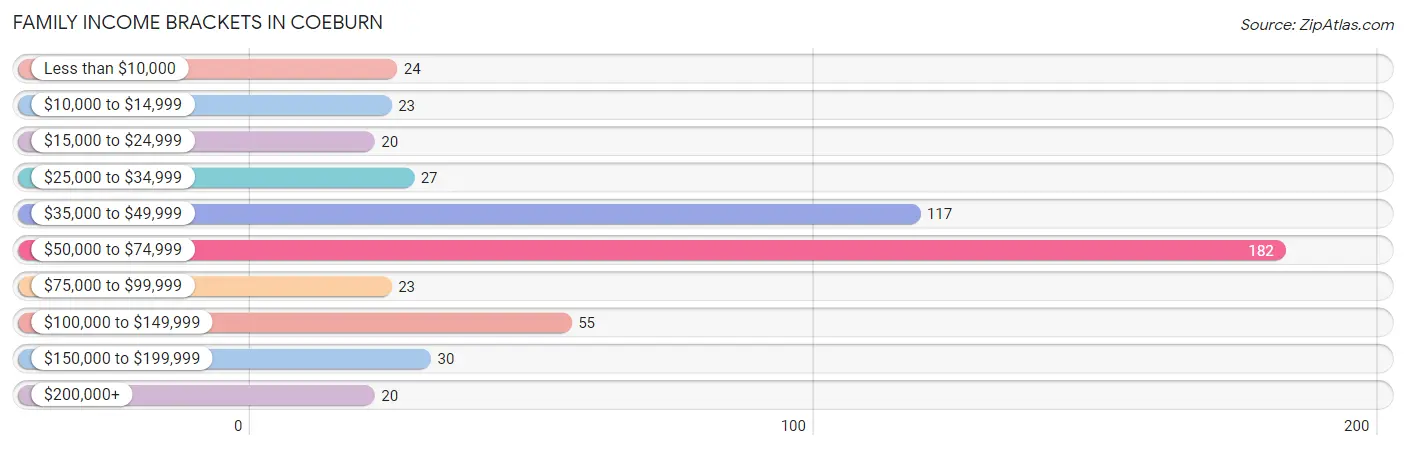
| Income Bracket | # Families | % Families |
| Less than $10,000 | 24 | 4.6% |
| $10,000 to $14,999 | 23 | 4.4% |
| $15,000 to $24,999 | 20 | 3.8% |
| $25,000 to $34,999 | 27 | 5.2% |
| $35,000 to $49,999 | 117 | 22.5% |
| $50,000 to $74,999 | 182 | 34.9% |
| $75,000 to $99,999 | 23 | 4.4% |
| $100,000 to $149,999 | 55 | 10.6% |
| $150,000 to $199,999 | 30 | 5.8% |
| $200,000+ | 20 | 3.8% |
Family Income by Famaliy Size in Coeburn
4-person families (53 | 10.2%) account for the highest median family income in Coeburn with $102,788 per family, while 4-person families (53 | 10.2%) have the highest median income of $25,697 per family member.
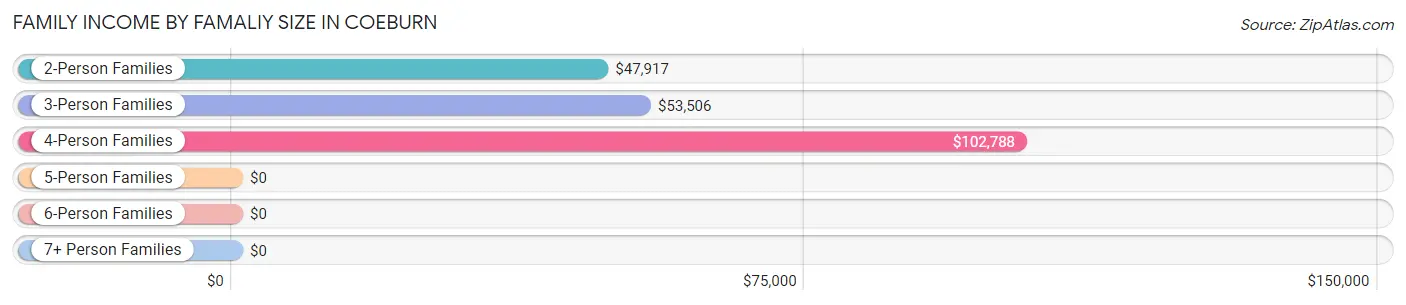
| Income Bracket | # Families | Median Income |
| 2-Person Families | 222 (42.6%) | $47,917 |
| 3-Person Families | 226 (43.4%) | $53,506 |
| 4-Person Families | 53 (10.2%) | $102,788 |
| 5-Person Families | 14 (2.7%) | $0 |
| 6-Person Families | 0 (0.0%) | $0 |
| 7+ Person Families | 6 (1.1%) | $0 |
| Total | 521 (100.0%) | $53,434 |
Family Income by Number of Earners in Coeburn
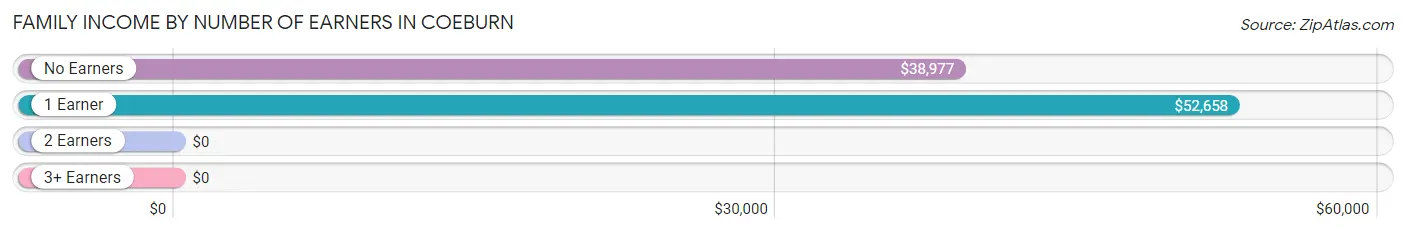
| Number of Earners | # Families | Median Income |
| No Earners | 160 (30.7%) | $38,977 |
| 1 Earner | 197 (37.8%) | $52,658 |
| 2 Earners | 153 (29.4%) | $0 |
| 3+ Earners | 11 (2.1%) | $0 |
| Total | 521 (100.0%) | $53,434 |
Household Income in Coeburn
Household Income Brackets in Coeburn
With 254 households falling in the category, the $50,000 to $74,999 income range is the most frequent in Coeburn, accounting for 37.9% of all households. In contrast, only 20 households (3.0%) fall into the $200,000+ income bracket, making it the least populous group.
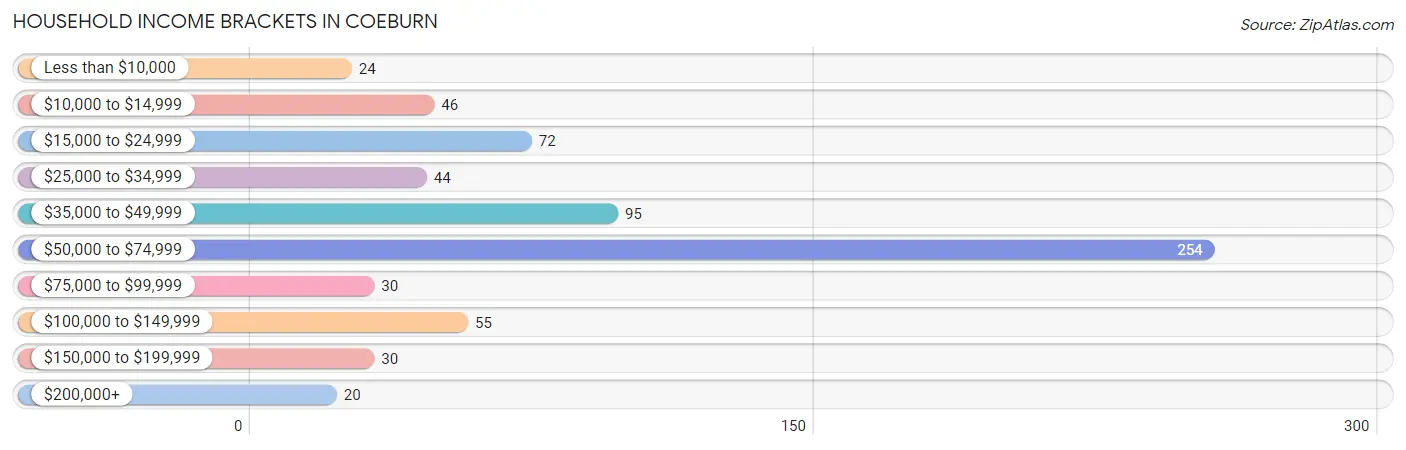
| Income Bracket | # Households | % Households |
| Less than $10,000 | 24 | 3.6% |
| $10,000 to $14,999 | 46 | 6.9% |
| $15,000 to $24,999 | 72 | 10.7% |
| $25,000 to $34,999 | 44 | 6.6% |
| $35,000 to $49,999 | 95 | 14.2% |
| $50,000 to $74,999 | 254 | 37.9% |
| $75,000 to $99,999 | 30 | 4.5% |
| $100,000 to $149,999 | 55 | 8.2% |
| $150,000 to $199,999 | 30 | 4.5% |
| $200,000+ | 20 | 3.0% |
Household Income by Householder Age in Coeburn
The median household income in Coeburn is $53,528, with the highest median household income of $54,195 found in the 25 to 44 years age bracket for the primary householder. A total of 234 households (34.9%) fall into this category. Meanwhile, the 15 to 24 years age bracket for the primary householder has the lowest median household income of $0, with 15 households (2.2%) in this group.
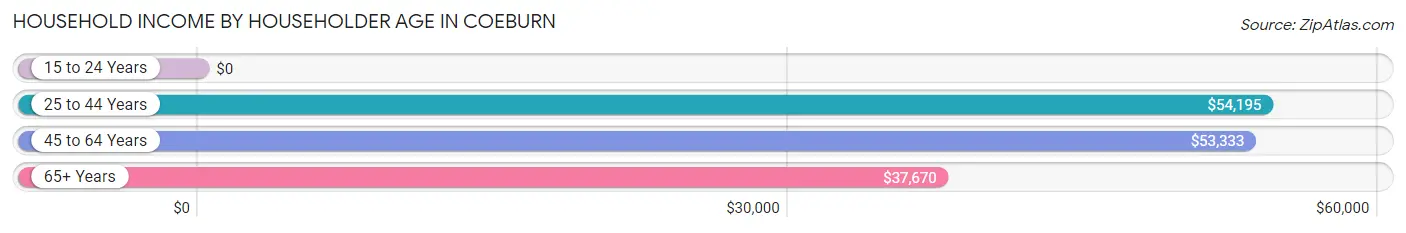
| Income Bracket | # Households | Median Income |
| 15 to 24 Years | 15 (2.2%) | $0 |
| 25 to 44 Years | 234 (34.9%) | $54,195 |
| 45 to 64 Years | 266 (39.7%) | $53,333 |
| 65+ Years | 155 (23.1%) | $37,670 |
| Total | 670 (100.0%) | $53,528 |
Poverty in Coeburn
Income Below Poverty by Sex and Age in Coeburn
With 11.1% poverty level for males and 18.5% for females among the residents of Coeburn, 12 to 14 year old males and under 5 year old females are the most vulnerable to poverty, with 14 males (100.0%) and 24 females (100.0%) in their respective age groups living below the poverty level.
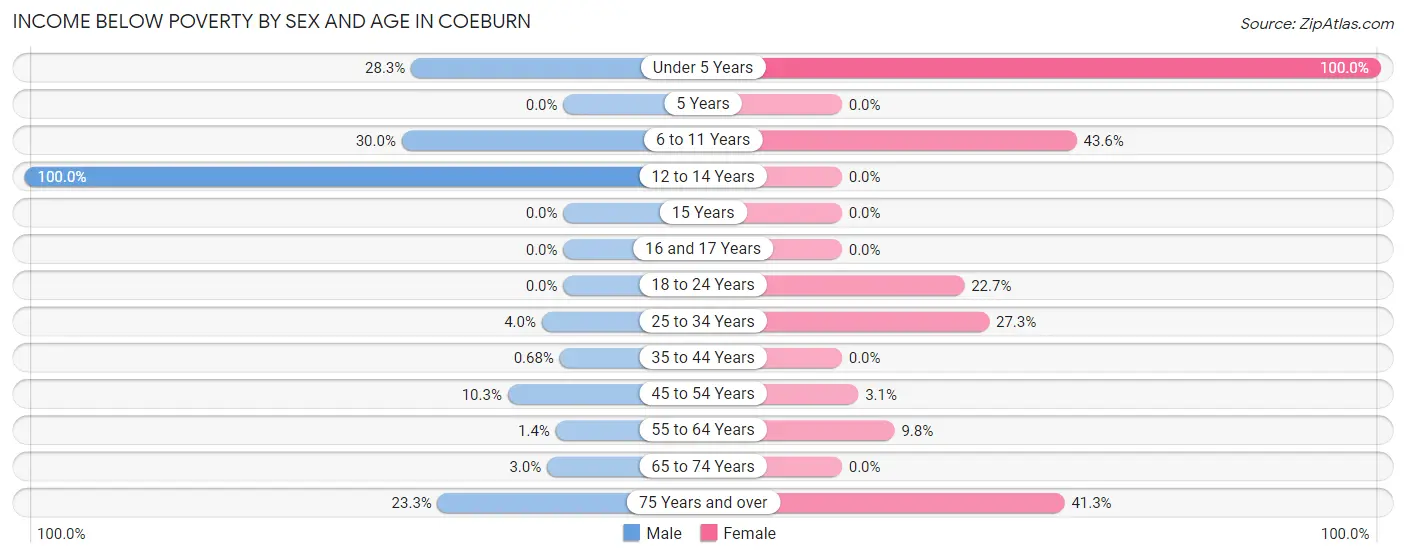
| Age Bracket | Male | Female |
| Under 5 Years | 13 (28.3%) | 24 (100.0%) |
| 5 Years | 0 (0.0%) | 0 (0.0%) |
| 6 to 11 Years | 18 (30.0%) | 17 (43.6%) |
| 12 to 14 Years | 14 (100.0%) | 0 (0.0%) |
| 15 Years | 0 (0.0%) | 0 (0.0%) |
| 16 and 17 Years | 0 (0.0%) | 0 (0.0%) |
| 18 to 24 Years | 0 (0.0%) | 15 (22.7%) |
| 25 to 34 Years | 2 (4.0%) | 47 (27.3%) |
| 35 to 44 Years | 1 (0.7%) | 0 (0.0%) |
| 45 to 54 Years | 16 (10.3%) | 4 (3.0%) |
| 55 to 64 Years | 1 (1.4%) | 9 (9.8%) |
| 65 to 74 Years | 2 (3.0%) | 0 (0.0%) |
| 75 Years and over | 14 (23.3%) | 31 (41.3%) |
| Total | 81 (11.1%) | 147 (18.5%) |
Income Above Poverty by Sex and Age in Coeburn
According to the poverty statistics in Coeburn, males aged 15 years and females aged 12 to 14 years are the age groups that are most secure financially, with 100.0% of males and 100.0% of females in these age groups living above the poverty line.
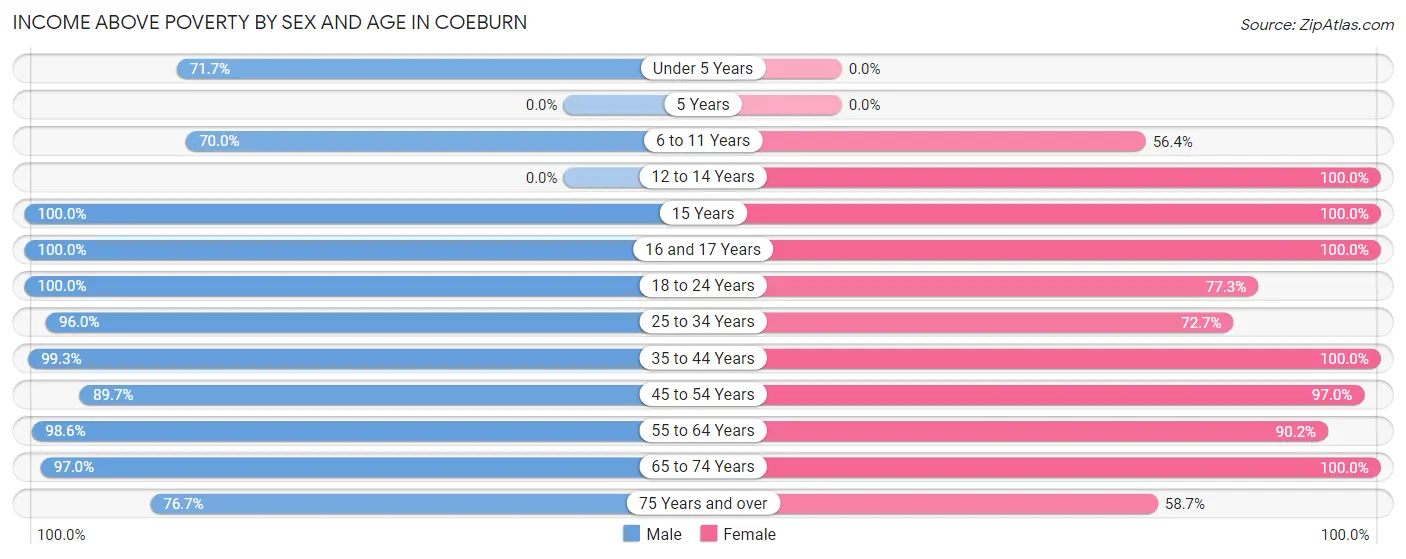
| Age Bracket | Male | Female |
| Under 5 Years | 33 (71.7%) | 0 (0.0%) |
| 5 Years | 0 (0.0%) | 0 (0.0%) |
| 6 to 11 Years | 42 (70.0%) | 22 (56.4%) |
| 12 to 14 Years | 0 (0.0%) | 5 (100.0%) |
| 15 Years | 33 (100.0%) | 8 (100.0%) |
| 16 and 17 Years | 4 (100.0%) | 46 (100.0%) |
| 18 to 24 Years | 27 (100.0%) | 51 (77.3%) |
| 25 to 34 Years | 48 (96.0%) | 125 (72.7%) |
| 35 to 44 Years | 147 (99.3%) | 60 (100.0%) |
| 45 to 54 Years | 139 (89.7%) | 127 (97.0%) |
| 55 to 64 Years | 69 (98.6%) | 83 (90.2%) |
| 65 to 74 Years | 64 (97.0%) | 75 (100.0%) |
| 75 Years and over | 46 (76.7%) | 44 (58.7%) |
| Total | 652 (88.9%) | 646 (81.5%) |
Income Below Poverty Among Married-Couple Families in Coeburn
The poverty statistics for married-couple families in Coeburn show that 4.3% or 16 of the total 373 families live below the poverty line. Families with no children have the highest poverty rate of 7.6%, comprising of 16 families. On the other hand, families with 1 or 2 children have the lowest poverty rate of 0.0%, which includes 0 families.
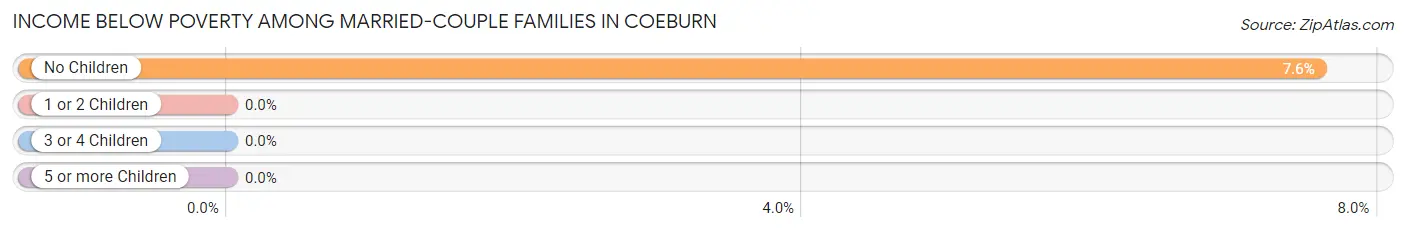
| Children | Above Poverty | Below Poverty |
| No Children | 195 (92.4%) | 16 (7.6%) |
| 1 or 2 Children | 156 (100.0%) | 0 (0.0%) |
| 3 or 4 Children | 6 (100.0%) | 0 (0.0%) |
| 5 or more Children | 0 (0.0%) | 0 (0.0%) |
| Total | 357 (95.7%) | 16 (4.3%) |
Income Below Poverty Among Single-Parent Households in Coeburn
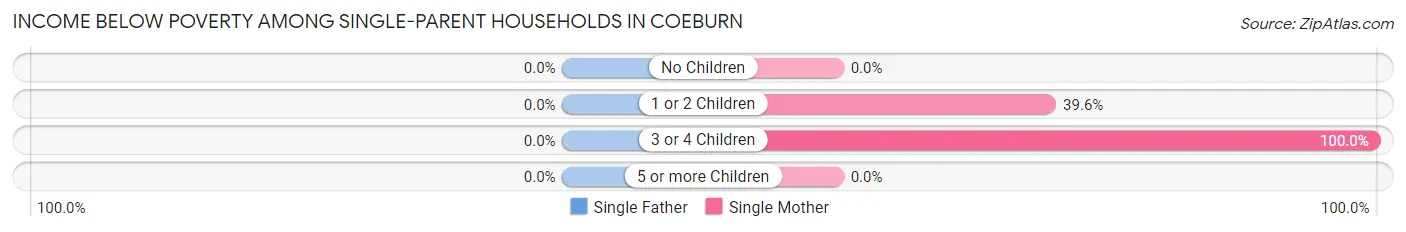
| Children | Single Father | Single Mother |
| No Children | 0 (0.0%) | 0 (0.0%) |
| 1 or 2 Children | 0 (0.0%) | 38 (39.6%) |
| 3 or 4 Children | 0 (0.0%) | 9 (100.0%) |
| 5 or more Children | 0 (0.0%) | 0 (0.0%) |
| Total | 0 (0.0%) | 47 (37.6%) |
Income Below Poverty Among Married-Couple vs Single-Parent Households in Coeburn
The poverty data for Coeburn shows that 16 of the married-couple family households (4.3%) and 47 of the single-parent households (31.8%) are living below the poverty level. Within the married-couple family households, those with no children have the highest poverty rate, with 16 households (7.6%) falling below the poverty line. Among the single-parent households, those with 3 or 4 children have the highest poverty rate, with 9 household (100.0%) living below poverty.
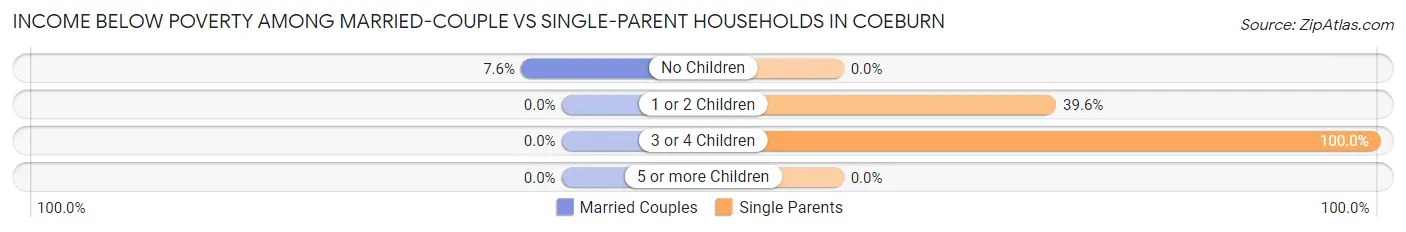
| Children | Married-Couple Families | Single-Parent Households |
| No Children | 16 (7.6%) | 0 (0.0%) |
| 1 or 2 Children | 0 (0.0%) | 38 (39.6%) |
| 3 or 4 Children | 0 (0.0%) | 9 (100.0%) |
| 5 or more Children | 0 (0.0%) | 0 (0.0%) |
| Total | 16 (4.3%) | 47 (31.8%) |
Race in Coeburn
The most populous races in Coeburn are White / Caucasian (1,403 | 91.5%), Black / African American (107 | 7.0%), and Two or more Races (16 | 1.0%).
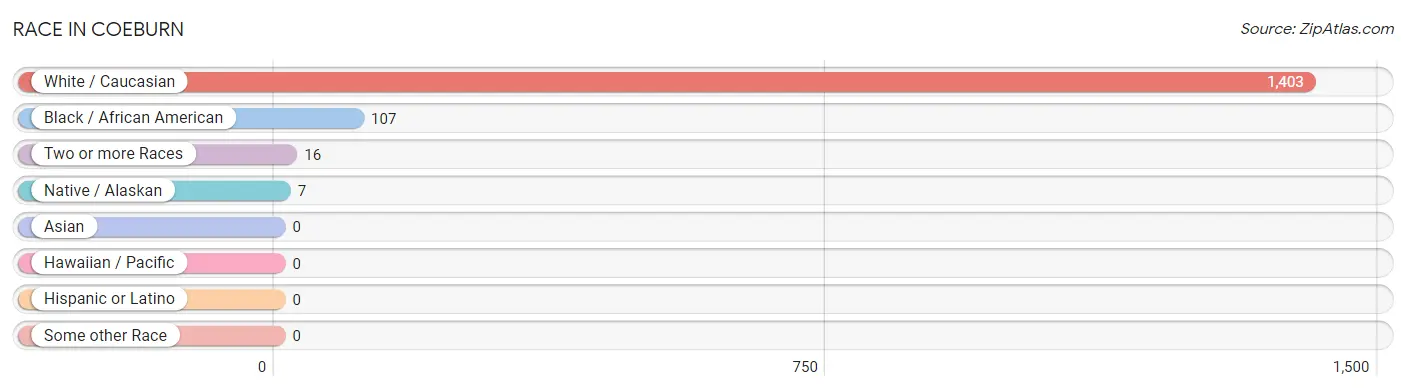
| Race | # Population | % Population |
| Asian | 0 | 0.0% |
| Black / African American | 107 | 7.0% |
| Hawaiian / Pacific | 0 | 0.0% |
| Hispanic or Latino | 0 | 0.0% |
| Native / Alaskan | 7 | 0.5% |
| White / Caucasian | 1,403 | 91.5% |
| Two or more Races | 16 | 1.0% |
| Some other Race | 0 | 0.0% |
| Total | 1,533 | 100.0% |
Ancestry in Coeburn
The most populous ancestries reported in Coeburn are American (525 | 34.3%), Irish (208 | 13.6%), English (139 | 9.1%), German (63 | 4.1%), and European (62 | 4.0%), together accounting for 65.0% of all Coeburn residents.
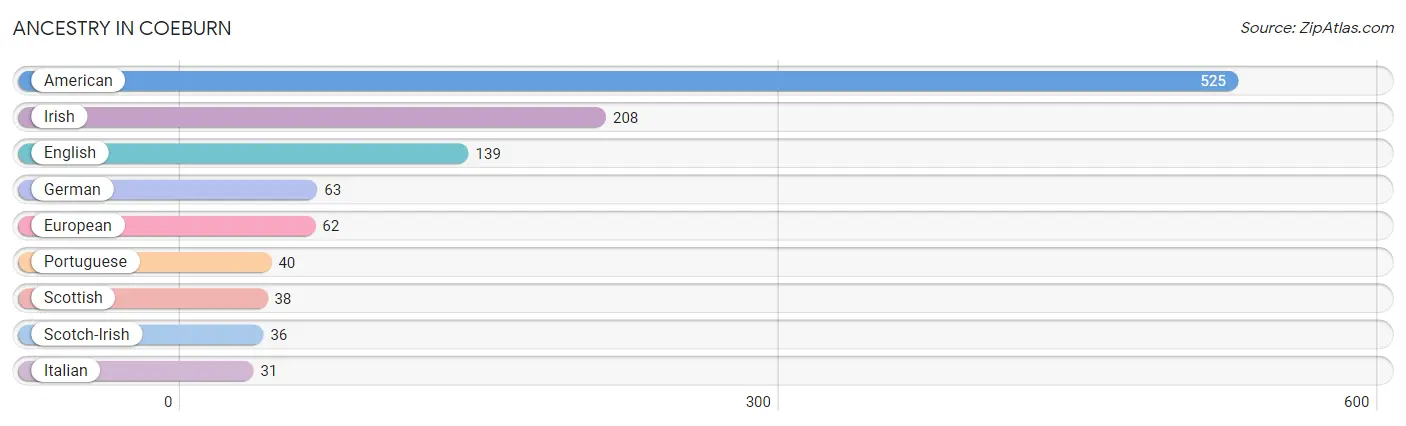
| Ancestry | # Population | % Population |
| American | 525 | 34.3% |
| English | 139 | 9.1% |
| European | 62 | 4.0% |
| German | 63 | 4.1% |
| Irish | 208 | 13.6% |
| Italian | 31 | 2.0% |
| Portuguese | 40 | 2.6% |
| Scotch-Irish | 36 | 2.4% |
| Scottish | 38 | 2.5% | View All 9 Rows |
Immigrants in Coeburn

| Immigration Origin | # Population | % Population | View All 0 Rows |
Sex and Age in Coeburn
Sex and Age in Coeburn
The most populous age groups in Coeburn are 40 to 44 Years (118 | 16.1%) for men and 25 to 29 Years (118 | 14.7%) for women.
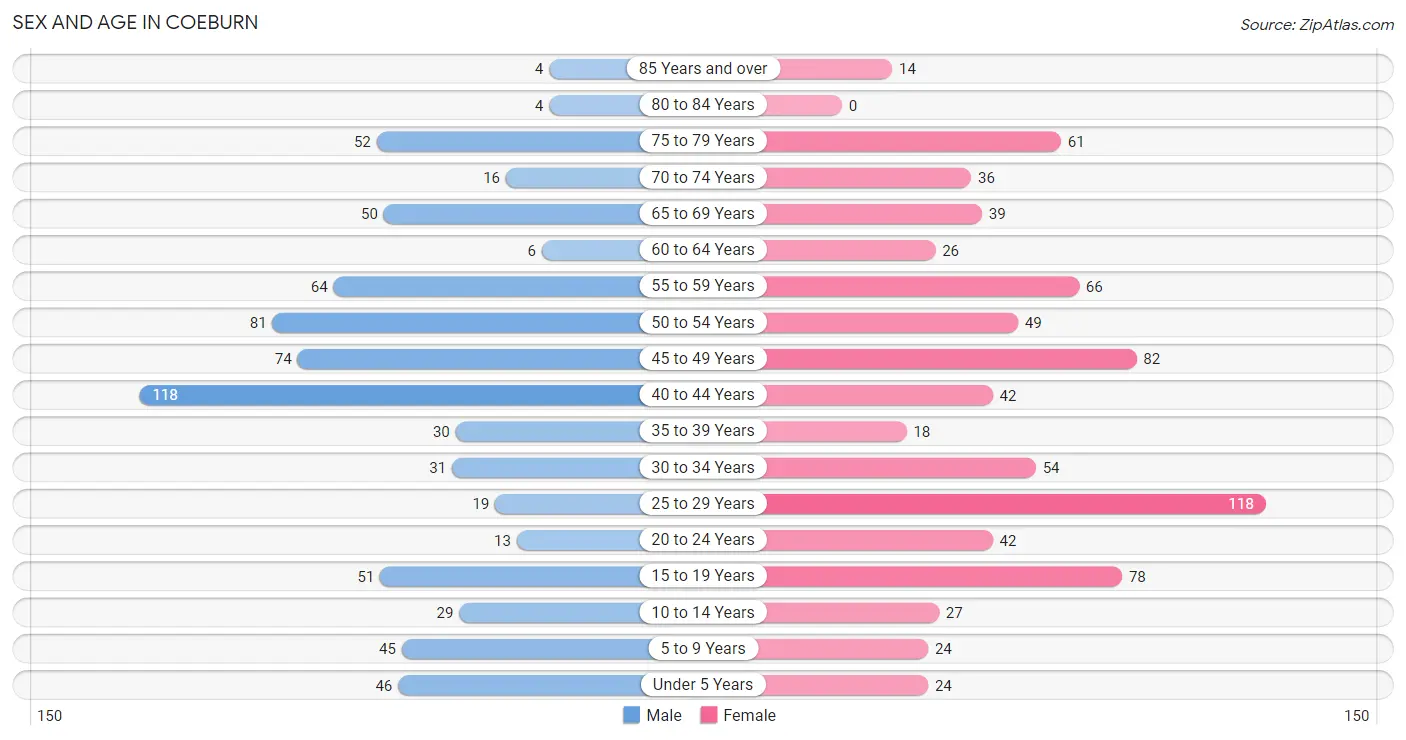
| Age Bracket | Male | Female |
| Under 5 Years | 46 (6.3%) | 24 (3.0%) |
| 5 to 9 Years | 45 (6.1%) | 24 (3.0%) |
| 10 to 14 Years | 29 (4.0%) | 27 (3.4%) |
| 15 to 19 Years | 51 (7.0%) | 78 (9.8%) |
| 20 to 24 Years | 13 (1.8%) | 42 (5.2%) |
| 25 to 29 Years | 19 (2.6%) | 118 (14.7%) |
| 30 to 34 Years | 31 (4.2%) | 54 (6.8%) |
| 35 to 39 Years | 30 (4.1%) | 18 (2.2%) |
| 40 to 44 Years | 118 (16.1%) | 42 (5.2%) |
| 45 to 49 Years | 74 (10.1%) | 82 (10.2%) |
| 50 to 54 Years | 81 (11.1%) | 49 (6.1%) |
| 55 to 59 Years | 64 (8.7%) | 66 (8.3%) |
| 60 to 64 Years | 6 (0.8%) | 26 (3.3%) |
| 65 to 69 Years | 50 (6.8%) | 39 (4.9%) |
| 70 to 74 Years | 16 (2.2%) | 36 (4.5%) |
| 75 to 79 Years | 52 (7.1%) | 61 (7.6%) |
| 80 to 84 Years | 4 (0.5%) | 0 (0.0%) |
| 85 Years and over | 4 (0.5%) | 14 (1.8%) |
| Total | 733 (100.0%) | 800 (100.0%) |
Families and Households in Coeburn
Median Family Size in Coeburn
The median family size in Coeburn is 2.51 persons per family, with single male/father families (23 | 4.4%) accounting for the largest median family size of 4 persons per family. On the other hand, single female/mother families (125 | 24.0%) represent the smallest median family size with 2.37 persons per family.
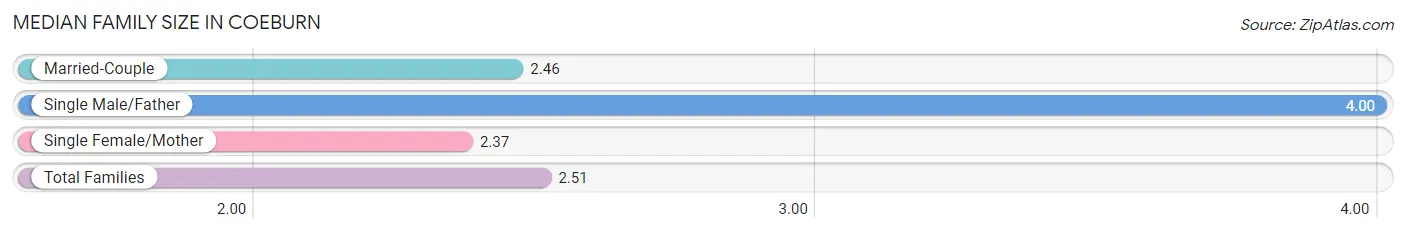
| Family Type | # Families | Family Size |
| Married-Couple | 373 (71.6%) | 2.46 |
| Single Male/Father | 23 (4.4%) | 4.00 |
| Single Female/Mother | 125 (24.0%) | 2.37 |
| Total Families | 521 (100.0%) | 2.51 |
Median Household Size in Coeburn
The median household size in Coeburn is 2.27 persons per household, with single male/father households (23 | 3.4%) accounting for the largest median household size of 4 persons per household. non-family households (149 | 22.2%) represent the smallest median household size with 1.28 persons per household.
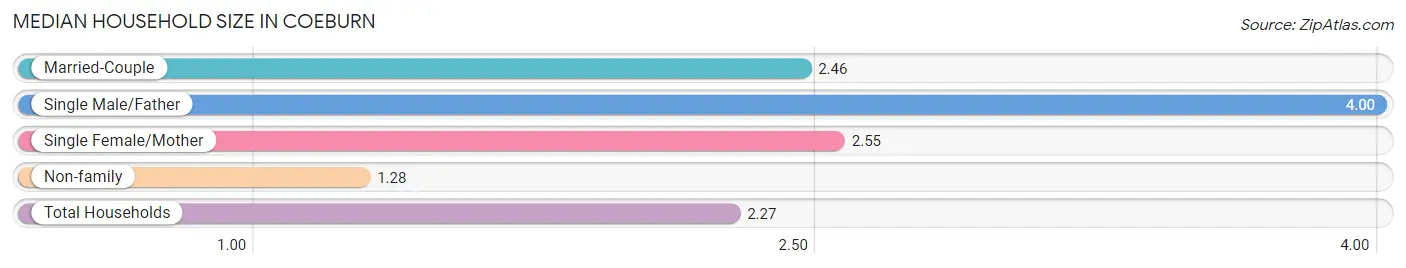
| Household Type | # Households | Household Size |
| Married-Couple | 373 (55.7%) | 2.46 |
| Single Male/Father | 23 (3.4%) | 4.00 |
| Single Female/Mother | 125 (18.7%) | 2.55 |
| Non-family | 149 (22.2%) | 1.28 |
| Total Households | 670 (100.0%) | 2.27 |
Household Size by Marriage Status in Coeburn
Out of a total of 670 households in Coeburn, 521 (77.8%) are family households, while 149 (22.2%) are nonfamily households. The most numerous type of family households are 2-person households, comprising 217, and the most common type of nonfamily households are 1-person households, comprising 131.
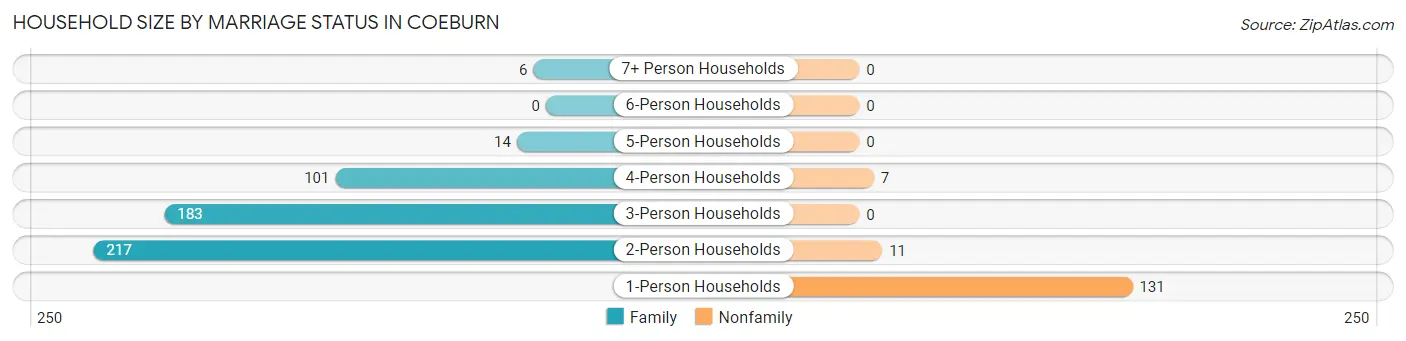
| Household Size | Family Households | Nonfamily Households |
| 1-Person Households | - | 131 (19.6%) |
| 2-Person Households | 217 (32.4%) | 11 (1.6%) |
| 3-Person Households | 183 (27.3%) | 0 (0.0%) |
| 4-Person Households | 101 (15.1%) | 7 (1.0%) |
| 5-Person Households | 14 (2.1%) | 0 (0.0%) |
| 6-Person Households | 0 (0.0%) | 0 (0.0%) |
| 7+ Person Households | 6 (0.9%) | 0 (0.0%) |
| Total | 521 (77.8%) | 149 (22.2%) |
Female Fertility in Coeburn
Fertility by Age in Coeburn
Average fertility rate in Coeburn is 9.0 births per 1,000 women. Women in the age bracket of 20 to 34 years have the highest fertility rate with 19.0 births per 1,000 women. Women in the age bracket of 20 to 34 years acount for 100.0% of all women with births.
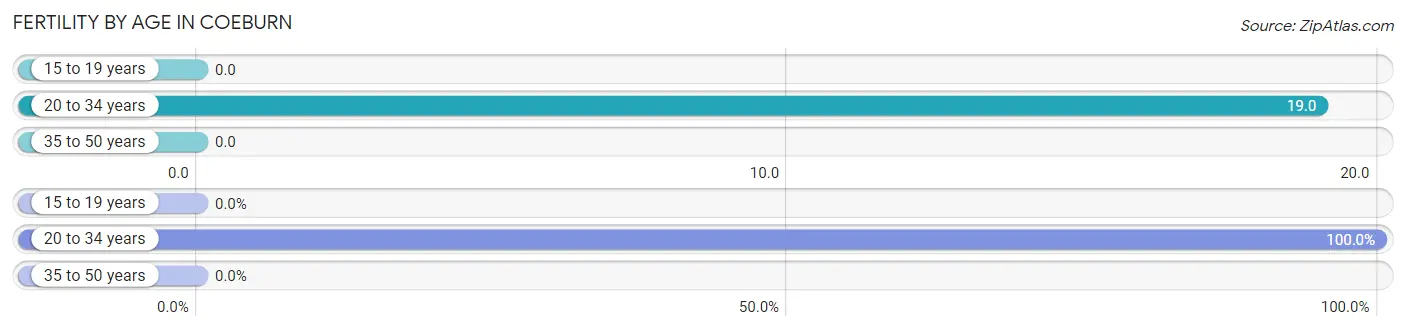
| Age Bracket | Women with Births | Births / 1,000 Women |
| 15 to 19 years | 0 (0.0%) | 0.0 |
| 20 to 34 years | 4 (100.0%) | 19.0 |
| 35 to 50 years | 0 (0.0%) | 0.0 |
| Total | 4 (100.0%) | 9.0 |
Fertility by Age by Marriage Status in Coeburn
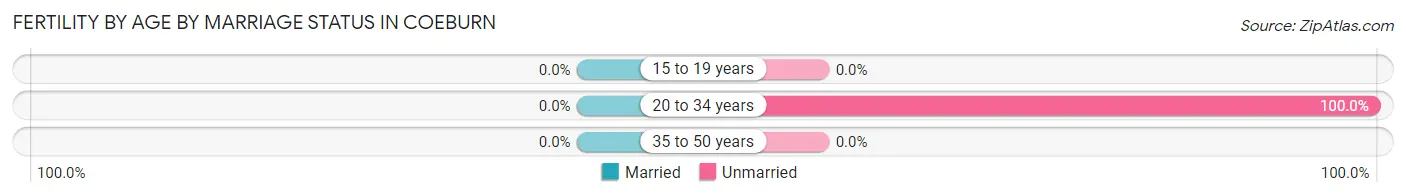
| Age Bracket | Married | Unmarried |
| 15 to 19 years | 0 (0.0%) | 0 (0.0%) |
| 20 to 34 years | 0 (0.0%) | 4 (100.0%) |
| 35 to 50 years | 0 (0.0%) | 0 (0.0%) |
| Total | 0 (0.0%) | 4 (100.0%) |
Fertility by Education in Coeburn
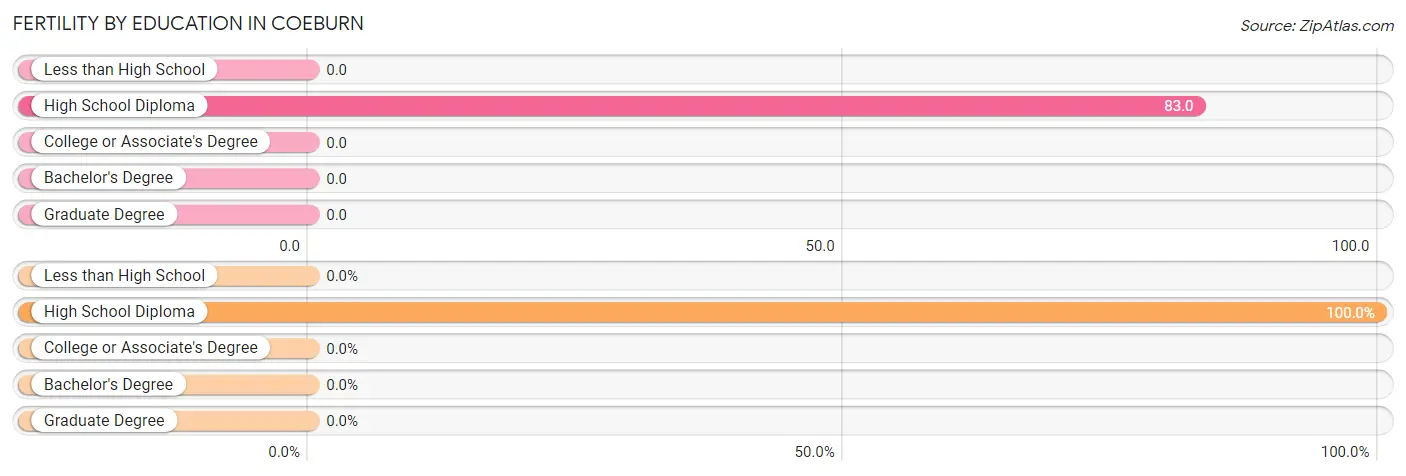
| Educational Attainment | Women with Births | Births / 1,000 Women |
| Less than High School | 0 (0.0%) | 0.0 |
| High School Diploma | 4 (100.0%) | 83.0 |
| College or Associate's Degree | 0 (0.0%) | 0.0 |
| Bachelor's Degree | 0 (0.0%) | 0.0 |
| Graduate Degree | 0 (0.0%) | 0.0 |
| Total | 4 (100.0%) | 9.0 |
Fertility by Education by Marriage Status in Coeburn
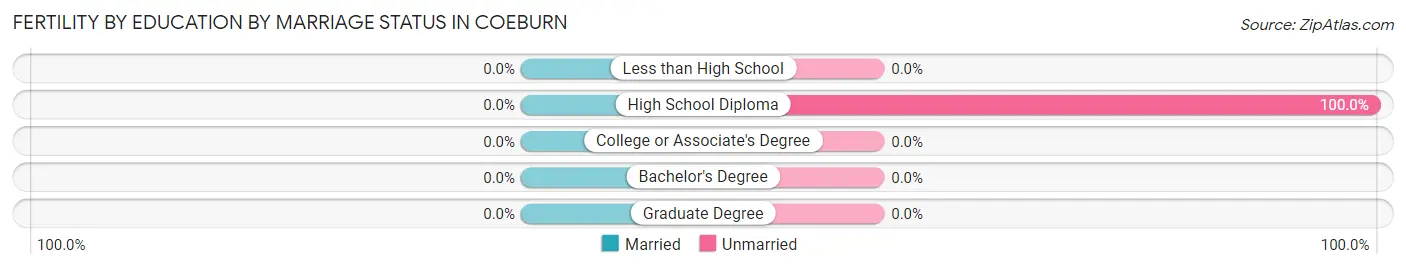
| Educational Attainment | Married | Unmarried |
| Less than High School | 0 (0.0%) | 0 (0.0%) |
| High School Diploma | 0 (0.0%) | 4 (100.0%) |
| College or Associate's Degree | 0 (0.0%) | 0 (0.0%) |
| Bachelor's Degree | 0 (0.0%) | 0 (0.0%) |
| Graduate Degree | 0 (0.0%) | 0 (0.0%) |
| Total | 0 (0.0%) | 4 (100.0%) |
Employment Characteristics in Coeburn
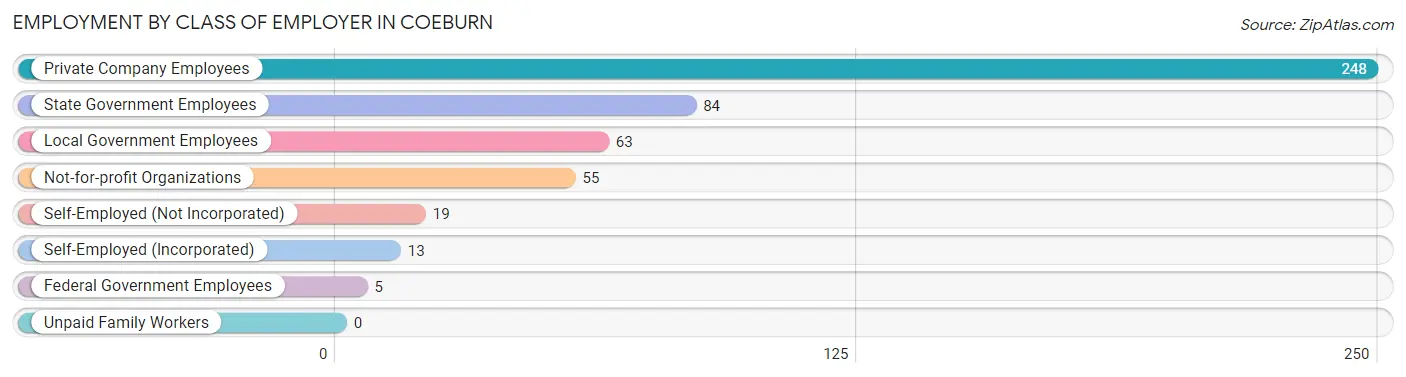
Employment by Class of Employer in Coeburn
Among the 487 employed individuals in Coeburn, private company employees (248 | 50.9%), state government employees (84 | 17.2%), and local government employees (63 | 12.9%) make up the most common classes of employment.
| Employer Class | # Employees | % Employees |
| Private Company Employees | 248 | 50.9% |
| Self-Employed (Incorporated) | 13 | 2.7% |
| Self-Employed (Not Incorporated) | 19 | 3.9% |
| Not-for-profit Organizations | 55 | 11.3% |
| Local Government Employees | 63 | 12.9% |
| State Government Employees | 84 | 17.2% |
| Federal Government Employees | 5 | 1.0% |
| Unpaid Family Workers | 0 | 0.0% |
| Total | 487 | 100.0% |
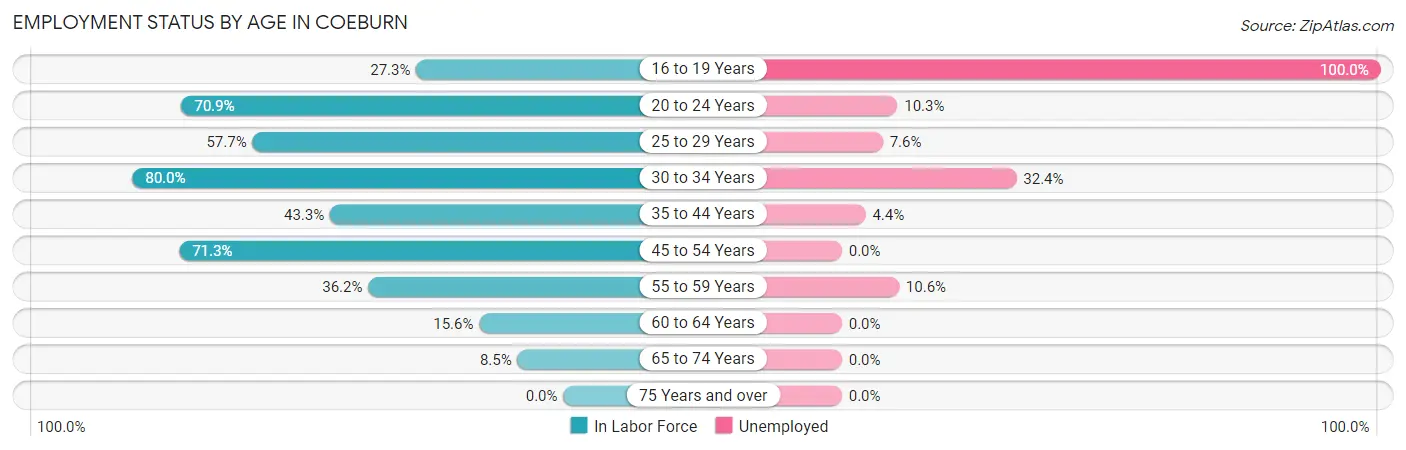
Employment Status by Age in Coeburn
According to the labor force statistics for Coeburn, out of the total population over 16 years of age (1,297), 43.8% or 568 individuals are in the labor force, with 11.4% or 65 of them unemployed. The age group with the highest labor force participation rate is 30 to 34 years, with 80.0% or 68 individuals in the labor force. Within the labor force, the 16 to 19 years age range has the highest percentage of unemployed individuals, with 100.0% or 24 of them being unemployed.
| Age Bracket | In Labor Force | Unemployed |
| 16 to 19 Years | 24 (27.3%) | 24 (100.0%) |
| 20 to 24 Years | 39 (70.9%) | 4 (10.3%) |
| 25 to 29 Years | 79 (57.7%) | 6 (7.6%) |
| 30 to 34 Years | 68 (80.0%) | 22 (32.4%) |
| 35 to 44 Years | 90 (43.3%) | 4 (4.4%) |
| 45 to 54 Years | 204 (71.3%) | 0 (0.0%) |
| 55 to 59 Years | 47 (36.2%) | 5 (10.6%) |
| 60 to 64 Years | 5 (15.6%) | 0 (0.0%) |
| 65 to 74 Years | 12 (8.5%) | 0 (0.0%) |
| 75 Years and over | 0 (0.0%) | 0 (0.0%) |
| Total | 568 (43.8%) | 65 (11.4%) |
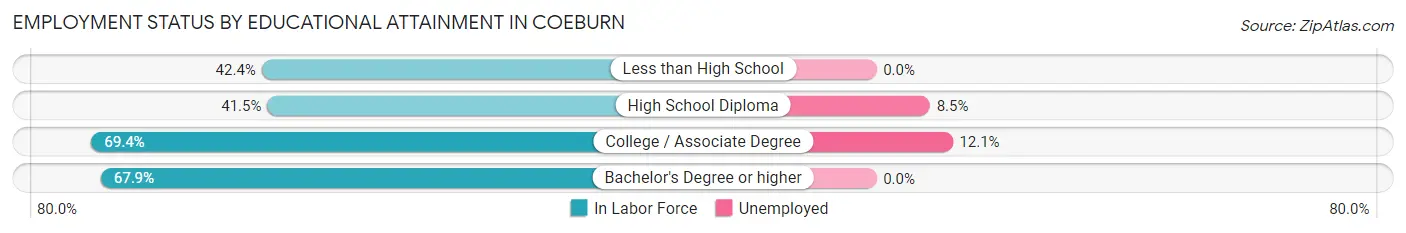
Employment Status by Educational Attainment in Coeburn
According to labor force statistics for Coeburn, 56.2% of individuals (493) out of the total population between 25 and 64 years of age (878) are in the labor force, with 7.5% or 37 of them being unemployed. The group with the highest labor force participation rate are those with the educational attainment of college / associate degree, with 69.4% or 215 individuals in the labor force. Within the labor force, individuals with college / associate degree education have the highest percentage of unemployment, with 12.1% or 26 of them being unemployed.
| Educational Attainment | In Labor Force | Unemployed |
| Less than High School | 42 (42.4%) | 0 (0.0%) |
| High School Diploma | 130 (41.5%) | 27 (8.5%) |
| College / Associate Degree | 215 (69.4%) | 38 (12.1%) |
| Bachelor's Degree or higher | 106 (67.9%) | 0 (0.0%) |
| Total | 493 (56.2%) | 66 (7.5%) |
Employment Occupations by Sex in Coeburn
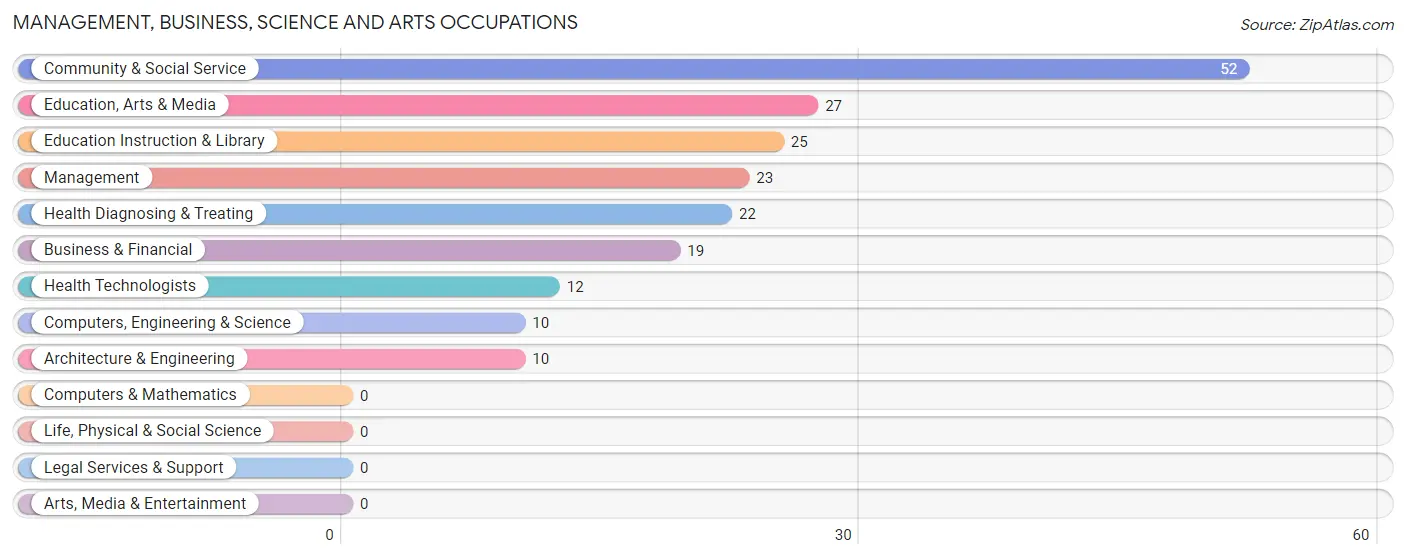
Management, Business, Science and Arts Occupations
The most common Management, Business, Science and Arts occupations in Coeburn are Community & Social Service (52 | 10.3%), Education, Arts & Media (27 | 5.4%), Education Instruction & Library (25 | 5.0%), Management (23 | 4.6%), and Health Diagnosing & Treating (22 | 4.4%).
Management, Business, Science and Arts Occupations by Sex
Within the Management, Business, Science and Arts occupations in Coeburn, the most male-oriented occupations are Computers, Engineering & Science (100.0%), Architecture & Engineering (100.0%), and Business & Financial (84.2%), while the most female-oriented occupations are Management (100.0%), Health Diagnosing & Treating (100.0%), and Health Technologists (100.0%).
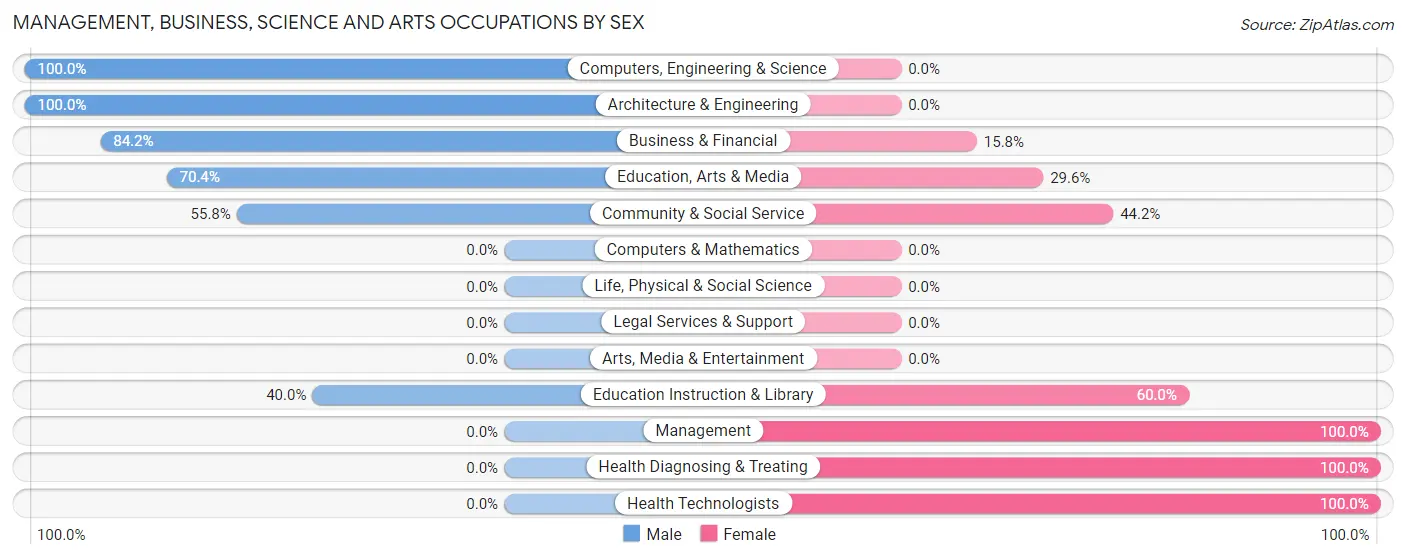
| Occupation | Male | Female |
| Management | 0 (0.0%) | 23 (100.0%) |
| Business & Financial | 16 (84.2%) | 3 (15.8%) |
| Computers, Engineering & Science | 10 (100.0%) | 0 (0.0%) |
| Computers & Mathematics | 0 (0.0%) | 0 (0.0%) |
| Architecture & Engineering | 10 (100.0%) | 0 (0.0%) |
| Life, Physical & Social Science | 0 (0.0%) | 0 (0.0%) |
| Community & Social Service | 29 (55.8%) | 23 (44.2%) |
| Education, Arts & Media | 19 (70.4%) | 8 (29.6%) |
| Legal Services & Support | 0 (0.0%) | 0 (0.0%) |
| Education Instruction & Library | 10 (40.0%) | 15 (60.0%) |
| Arts, Media & Entertainment | 0 (0.0%) | 0 (0.0%) |
| Health Diagnosing & Treating | 0 (0.0%) | 22 (100.0%) |
| Health Technologists | 0 (0.0%) | 12 (100.0%) |
| Total (Category) | 55 (43.6%) | 71 (56.4%) |
| Total (Overall) | 223 (44.3%) | 280 (55.7%) |
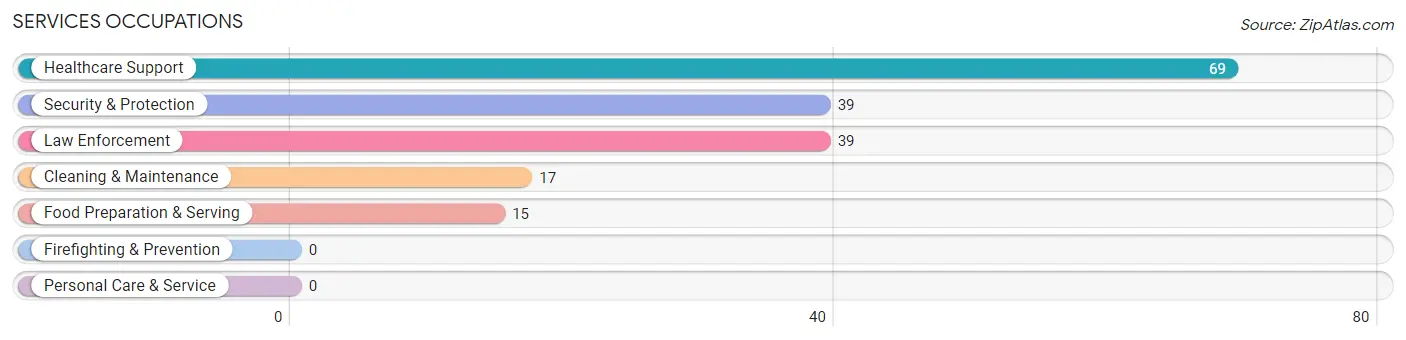
Services Occupations
The most common Services occupations in Coeburn are Healthcare Support (69 | 13.7%), Security & Protection (39 | 7.7%), Law Enforcement (39 | 7.7%), Cleaning & Maintenance (17 | 3.4%), and Food Preparation & Serving (15 | 3.0%).
Services Occupations by Sex
Within the Services occupations in Coeburn, the most male-oriented occupations are Security & Protection (51.3%), Law Enforcement (51.3%), and Cleaning & Maintenance (29.4%), while the most female-oriented occupations are Healthcare Support (100.0%), Food Preparation & Serving (100.0%), and Cleaning & Maintenance (70.6%).
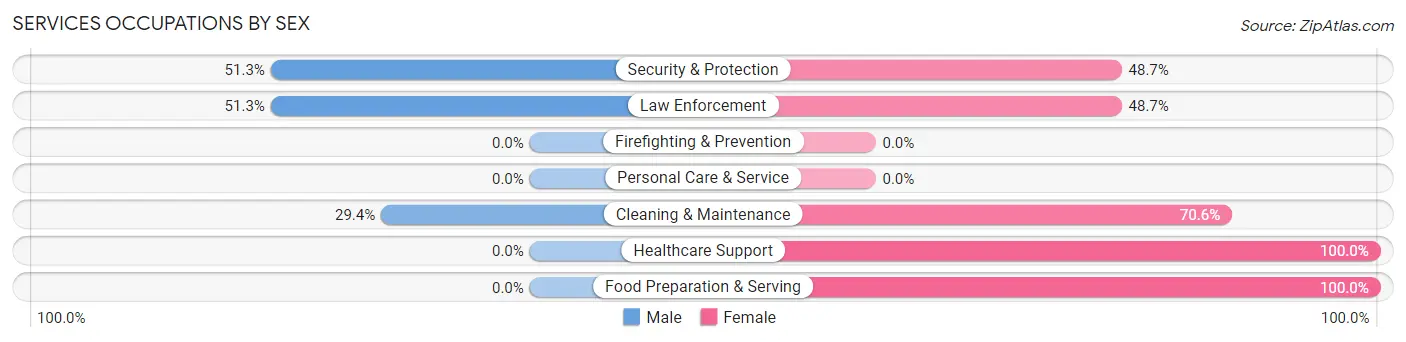
| Occupation | Male | Female |
| Healthcare Support | 0 (0.0%) | 69 (100.0%) |
| Security & Protection | 20 (51.3%) | 19 (48.7%) |
| Firefighting & Prevention | 0 (0.0%) | 0 (0.0%) |
| Law Enforcement | 20 (51.3%) | 19 (48.7%) |
| Food Preparation & Serving | 0 (0.0%) | 15 (100.0%) |
| Cleaning & Maintenance | 5 (29.4%) | 12 (70.6%) |
| Personal Care & Service | 0 (0.0%) | 0 (0.0%) |
| Total (Category) | 25 (17.9%) | 115 (82.1%) |
| Total (Overall) | 223 (44.3%) | 280 (55.7%) |
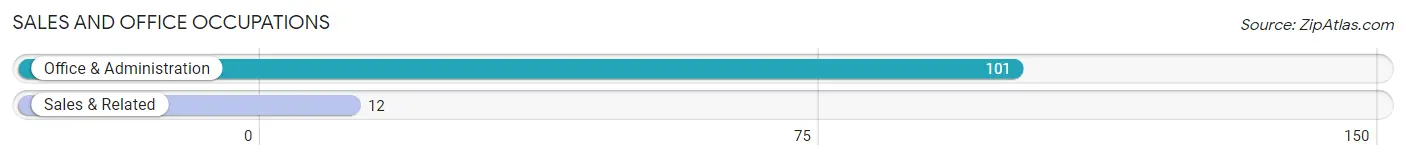
Sales and Office Occupations
The most common Sales and Office occupations in Coeburn are Office & Administration (101 | 20.1%), and Sales & Related (12 | 2.4%).
Sales and Office Occupations by Sex
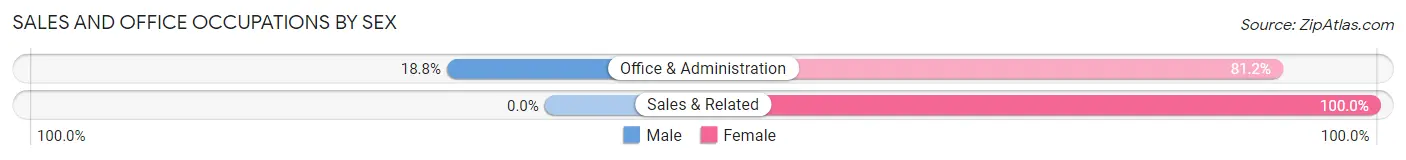
| Occupation | Male | Female |
| Sales & Related | 0 (0.0%) | 12 (100.0%) |
| Office & Administration | 19 (18.8%) | 82 (81.2%) |
| Total (Category) | 19 (16.8%) | 94 (83.2%) |
| Total (Overall) | 223 (44.3%) | 280 (55.7%) |
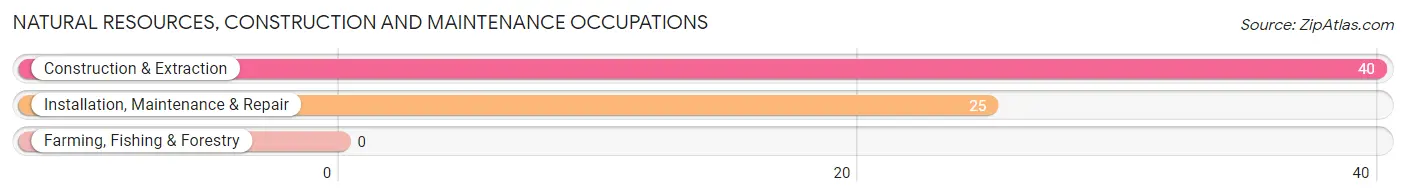
Natural Resources, Construction and Maintenance Occupations
The most common Natural Resources, Construction and Maintenance occupations in Coeburn are Construction & Extraction (40 | 8.0%), and Installation, Maintenance & Repair (25 | 5.0%).
Natural Resources, Construction and Maintenance Occupations by Sex
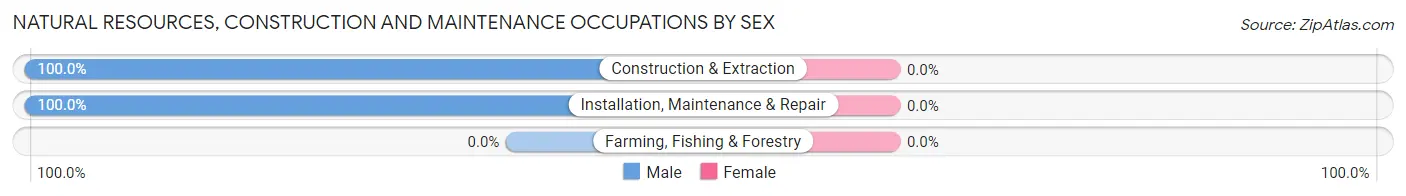
| Occupation | Male | Female |
| Farming, Fishing & Forestry | 0 (0.0%) | 0 (0.0%) |
| Construction & Extraction | 40 (100.0%) | 0 (0.0%) |
| Installation, Maintenance & Repair | 25 (100.0%) | 0 (0.0%) |
| Total (Category) | 65 (100.0%) | 0 (0.0%) |
| Total (Overall) | 223 (44.3%) | 280 (55.7%) |
Production, Transportation and Moving Occupations
The most common Production, Transportation and Moving occupations in Coeburn are Production (31 | 6.2%), Material Moving (21 | 4.2%), and Transportation (7 | 1.4%).
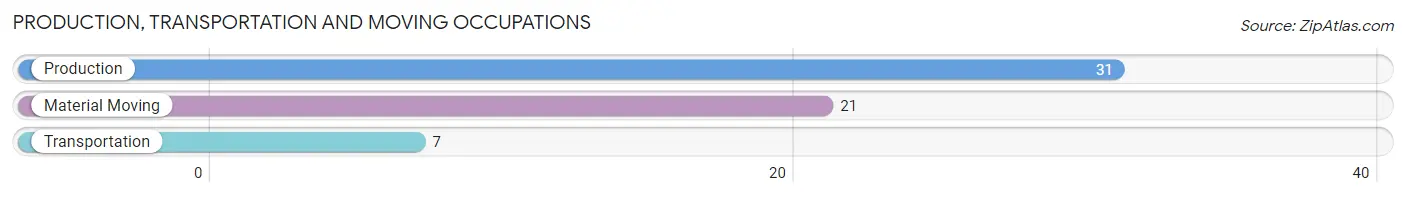
Production, Transportation and Moving Occupations by Sex
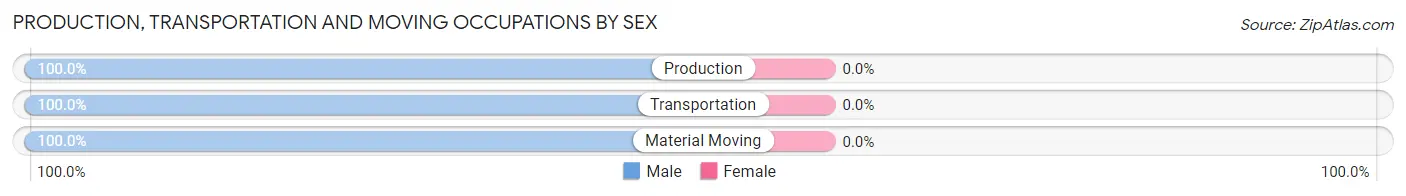
| Occupation | Male | Female |
| Production | 31 (100.0%) | 0 (0.0%) |
| Transportation | 7 (100.0%) | 0 (0.0%) |
| Material Moving | 21 (100.0%) | 0 (0.0%) |
| Total (Category) | 59 (100.0%) | 0 (0.0%) |
| Total (Overall) | 223 (44.3%) | 280 (55.7%) |
Employment Industries by Sex in Coeburn
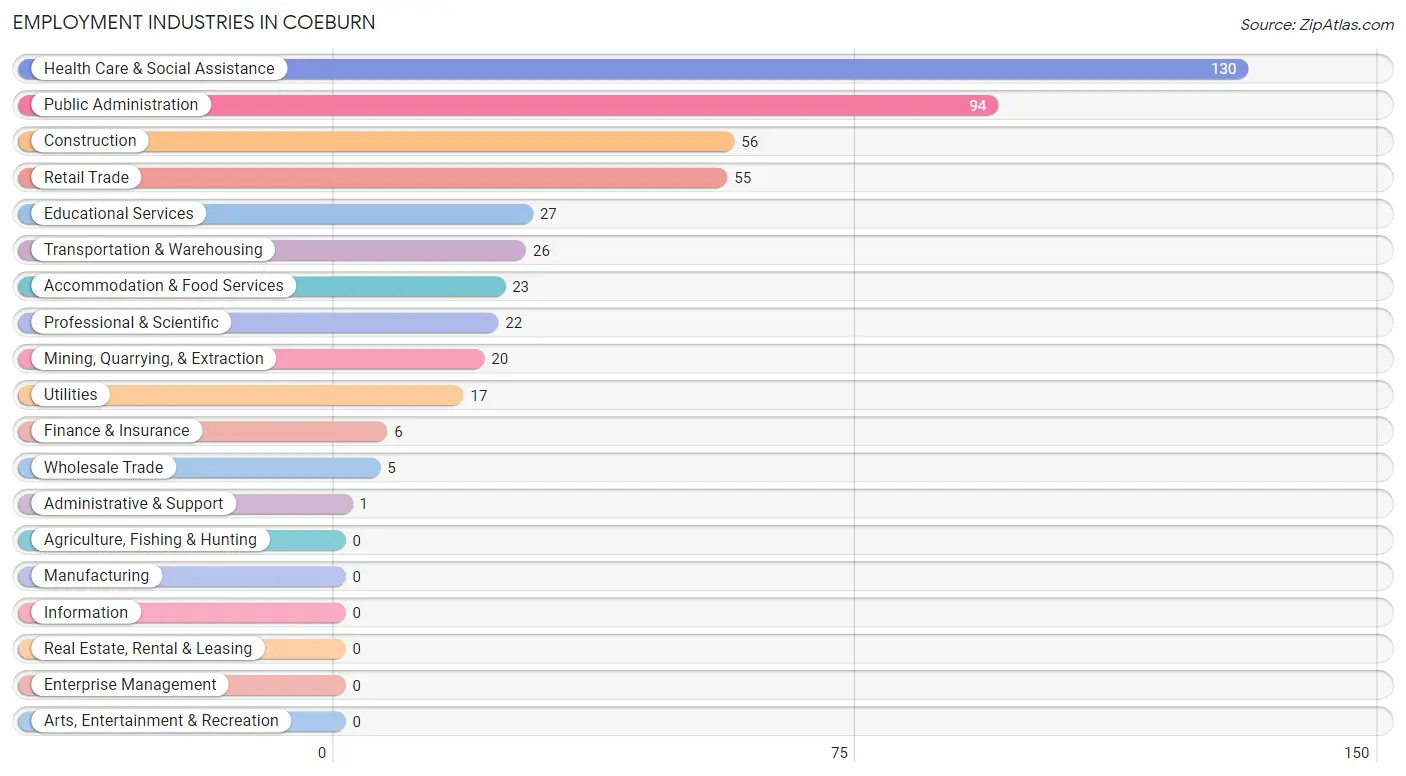
Employment Industries in Coeburn
The major employment industries in Coeburn include Health Care & Social Assistance (130 | 25.8%), Public Administration (94 | 18.7%), Construction (56 | 11.1%), Retail Trade (55 | 10.9%), and Educational Services (27 | 5.4%).
Employment Industries by Sex in Coeburn
The Coeburn industries that see more men than women are Mining, Quarrying, & Extraction (100.0%), Wholesale Trade (100.0%), and Transportation & Warehousing (100.0%), whereas the industries that tend to have a higher number of women are Finance & Insurance (100.0%), Accommodation & Food Services (100.0%), and Retail Trade (92.7%).
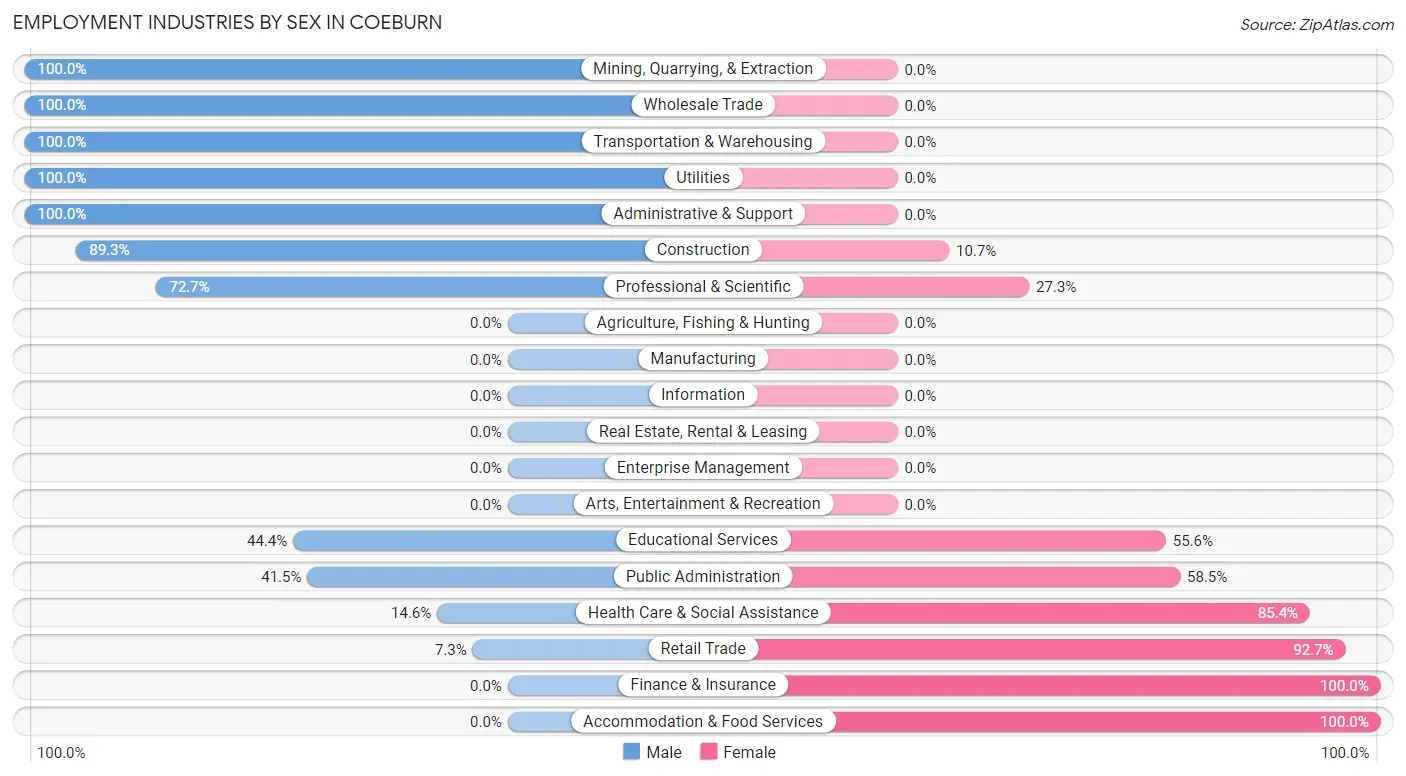
| Industry | Male | Female |
| Agriculture, Fishing & Hunting | 0 (0.0%) | 0 (0.0%) |
| Mining, Quarrying, & Extraction | 20 (100.0%) | 0 (0.0%) |
| Construction | 50 (89.3%) | 6 (10.7%) |
| Manufacturing | 0 (0.0%) | 0 (0.0%) |
| Wholesale Trade | 5 (100.0%) | 0 (0.0%) |
| Retail Trade | 4 (7.3%) | 51 (92.7%) |
| Transportation & Warehousing | 26 (100.0%) | 0 (0.0%) |
| Utilities | 17 (100.0%) | 0 (0.0%) |
| Information | 0 (0.0%) | 0 (0.0%) |
| Finance & Insurance | 0 (0.0%) | 6 (100.0%) |
| Real Estate, Rental & Leasing | 0 (0.0%) | 0 (0.0%) |
| Professional & Scientific | 16 (72.7%) | 6 (27.3%) |
| Enterprise Management | 0 (0.0%) | 0 (0.0%) |
| Administrative & Support | 1 (100.0%) | 0 (0.0%) |
| Educational Services | 12 (44.4%) | 15 (55.6%) |
| Health Care & Social Assistance | 19 (14.6%) | 111 (85.4%) |
| Arts, Entertainment & Recreation | 0 (0.0%) | 0 (0.0%) |
| Accommodation & Food Services | 0 (0.0%) | 23 (100.0%) |
| Public Administration | 39 (41.5%) | 55 (58.5%) |
| Total | 223 (44.3%) | 280 (55.7%) |
Education in Coeburn
School Enrollment in Coeburn
The most common levels of schooling among the 338 students in Coeburn are high school (105 | 31.1%), college / undergraduate (78 | 23.1%), and elementary school (69 | 20.4%).
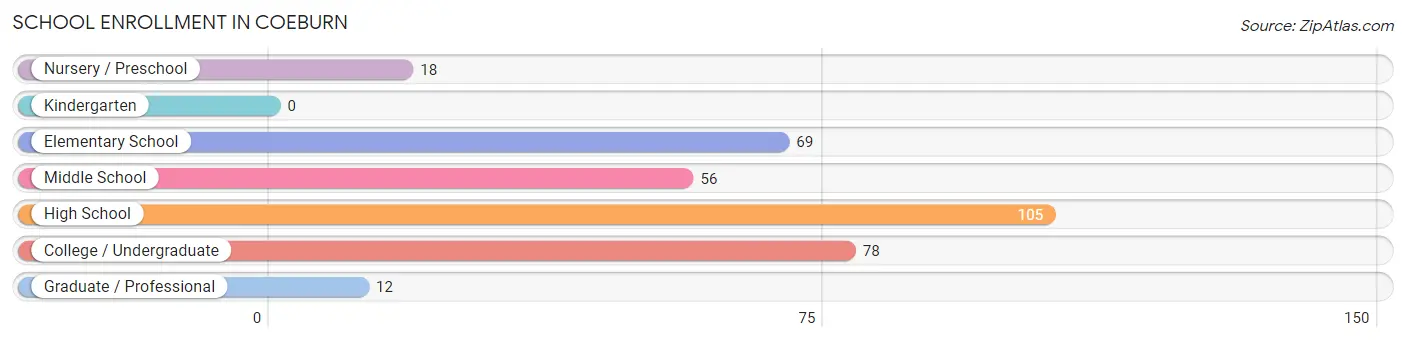
| School Level | # Students | % Students |
| Nursery / Preschool | 18 | 5.3% |
| Kindergarten | 0 | 0.0% |
| Elementary School | 69 | 20.4% |
| Middle School | 56 | 16.6% |
| High School | 105 | 31.1% |
| College / Undergraduate | 78 | 23.1% |
| Graduate / Professional | 12 | 3.5% |
| Total | 338 | 100.0% |
School Enrollment by Age by Funding Source in Coeburn
Out of a total of 338 students who are enrolled in schools in Coeburn, 58 (17.2%) attend a private institution, while the remaining 280 (82.8%) are enrolled in public schools. The age group of 18 to 19 year olds has the highest likelihood of being enrolled in private schools, with 14 (100.0% in the age bracket) enrolled. Conversely, the age group of 3 to 4 year olds has the lowest likelihood of being enrolled in a private school, with 18 (100.0% in the age bracket) attending a public institution.
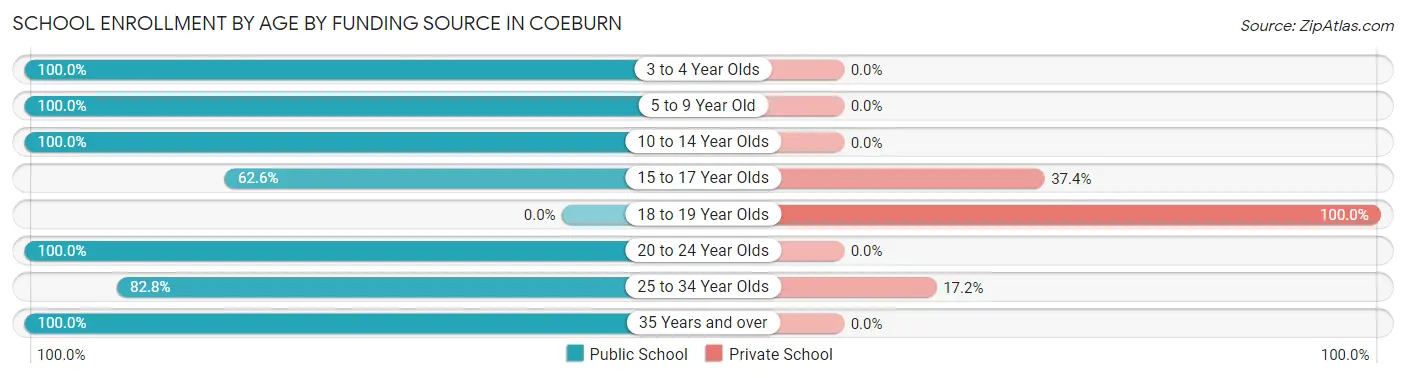
| Age Bracket | Public School | Private School |
| 3 to 4 Year Olds | 18 (100.0%) | 0 (0.0%) |
| 5 to 9 Year Old | 69 (100.0%) | 0 (0.0%) |
| 10 to 14 Year Olds | 56 (100.0%) | 0 (0.0%) |
| 15 to 17 Year Olds | 57 (62.6%) | 34 (37.4%) |
| 18 to 19 Year Olds | 0 (0.0%) | 14 (100.0%) |
| 20 to 24 Year Olds | 12 (100.0%) | 0 (0.0%) |
| 25 to 34 Year Olds | 48 (82.8%) | 10 (17.2%) |
| 35 Years and over | 20 (100.0%) | 0 (0.0%) |
| Total | 280 (82.8%) | 58 (17.2%) |
Educational Attainment by Field of Study in Coeburn
Business (47 | 22.1%), education (38 | 17.8%), computers & mathematics (35 | 16.4%), science & technology (25 | 11.7%), and liberal arts & history (19 | 8.9%) are the most common fields of study among 213 individuals in Coeburn who have obtained a bachelor's degree or higher.
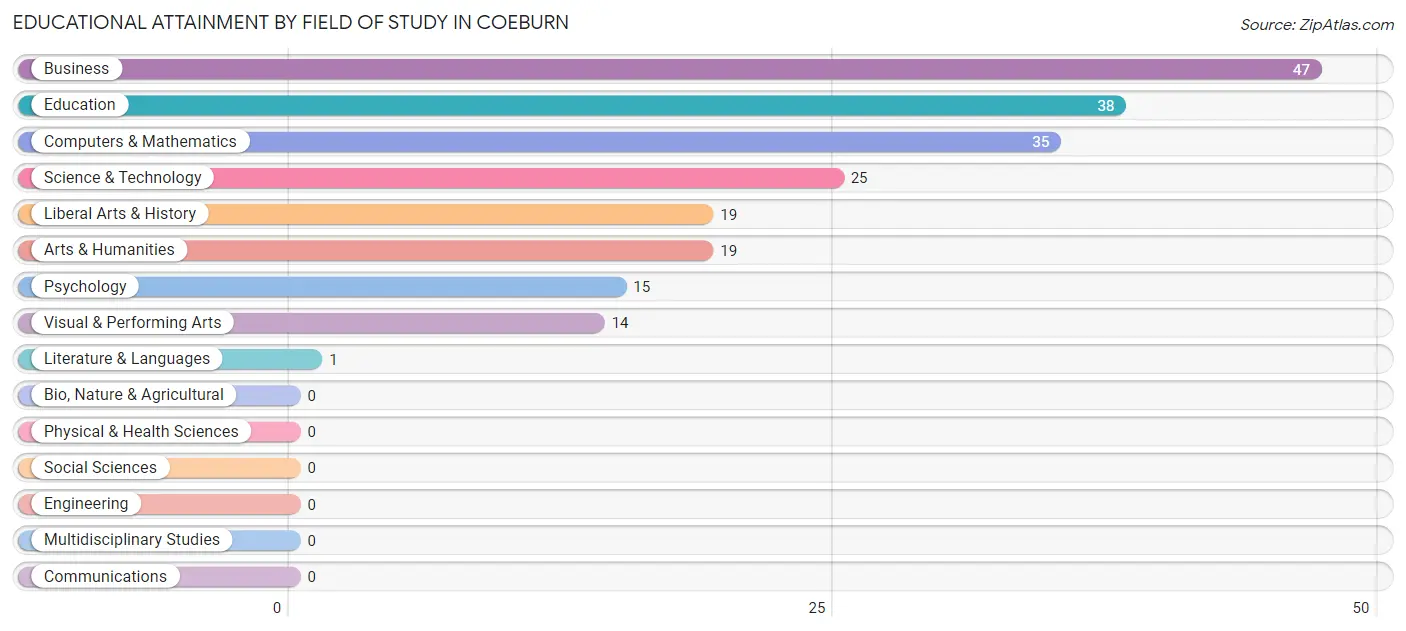
| Field of Study | # Graduates | % Graduates |
| Computers & Mathematics | 35 | 16.4% |
| Bio, Nature & Agricultural | 0 | 0.0% |
| Physical & Health Sciences | 0 | 0.0% |
| Psychology | 15 | 7.0% |
| Social Sciences | 0 | 0.0% |
| Engineering | 0 | 0.0% |
| Multidisciplinary Studies | 0 | 0.0% |
| Science & Technology | 25 | 11.7% |
| Business | 47 | 22.1% |
| Education | 38 | 17.8% |
| Literature & Languages | 1 | 0.5% |
| Liberal Arts & History | 19 | 8.9% |
| Visual & Performing Arts | 14 | 6.6% |
| Communications | 0 | 0.0% |
| Arts & Humanities | 19 | 8.9% |
| Total | 213 | 100.0% |
Transportation & Commute in Coeburn
Vehicle Availability by Sex in Coeburn
The most prevalent vehicle ownership categories in Coeburn are males with 2 vehicles (128, accounting for 59.5%) and females with 2 vehicles (123, making up 47.6%).
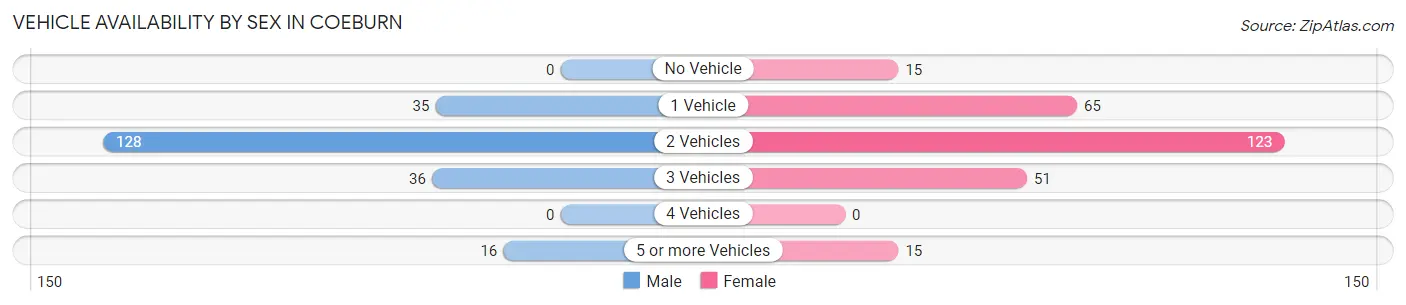
| Vehicles Available | Male | Female |
| No Vehicle | 0 (0.0%) | 15 (5.6%) |
| 1 Vehicle | 35 (16.3%) | 65 (24.2%) |
| 2 Vehicles | 128 (59.5%) | 123 (45.7%) |
| 3 Vehicles | 36 (16.7%) | 51 (19.0%) |
| 4 Vehicles | 0 (0.0%) | 0 (0.0%) |
| 5 or more Vehicles | 16 (7.4%) | 15 (5.6%) |
| Total | 215 (100.0%) | 269 (100.0%) |
Commute Time in Coeburn
The most frequently occuring commute durations in Coeburn are 10 to 14 minutes (112 commuters, 23.1%), less than 5 minutes (89 commuters, 18.4%), and 15 to 19 minutes (88 commuters, 18.2%).
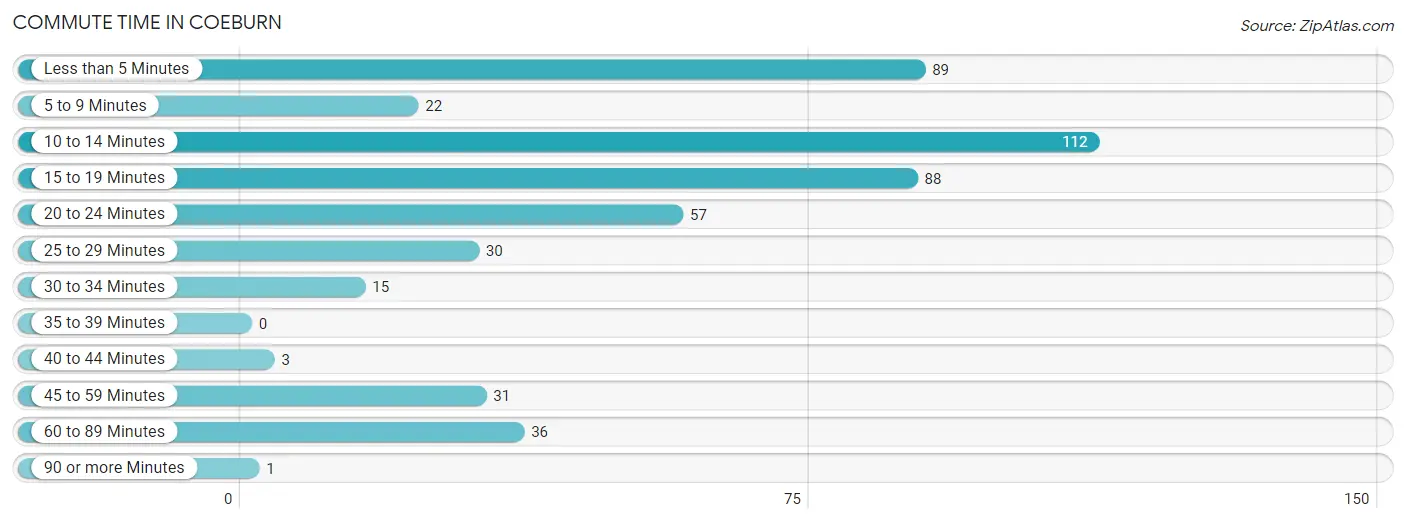
| Commute Time | # Commuters | % Commuters |
| Less than 5 Minutes | 89 | 18.4% |
| 5 to 9 Minutes | 22 | 4.5% |
| 10 to 14 Minutes | 112 | 23.1% |
| 15 to 19 Minutes | 88 | 18.2% |
| 20 to 24 Minutes | 57 | 11.8% |
| 25 to 29 Minutes | 30 | 6.2% |
| 30 to 34 Minutes | 15 | 3.1% |
| 35 to 39 Minutes | 0 | 0.0% |
| 40 to 44 Minutes | 3 | 0.6% |
| 45 to 59 Minutes | 31 | 6.4% |
| 60 to 89 Minutes | 36 | 7.4% |
| 90 or more Minutes | 1 | 0.2% |
Commute Time by Sex in Coeburn
The most common commute times in Coeburn are less than 5 minutes (48 commuters, 22.0%) for males and 15 to 19 minutes (70 commuters, 26.3%) for females.
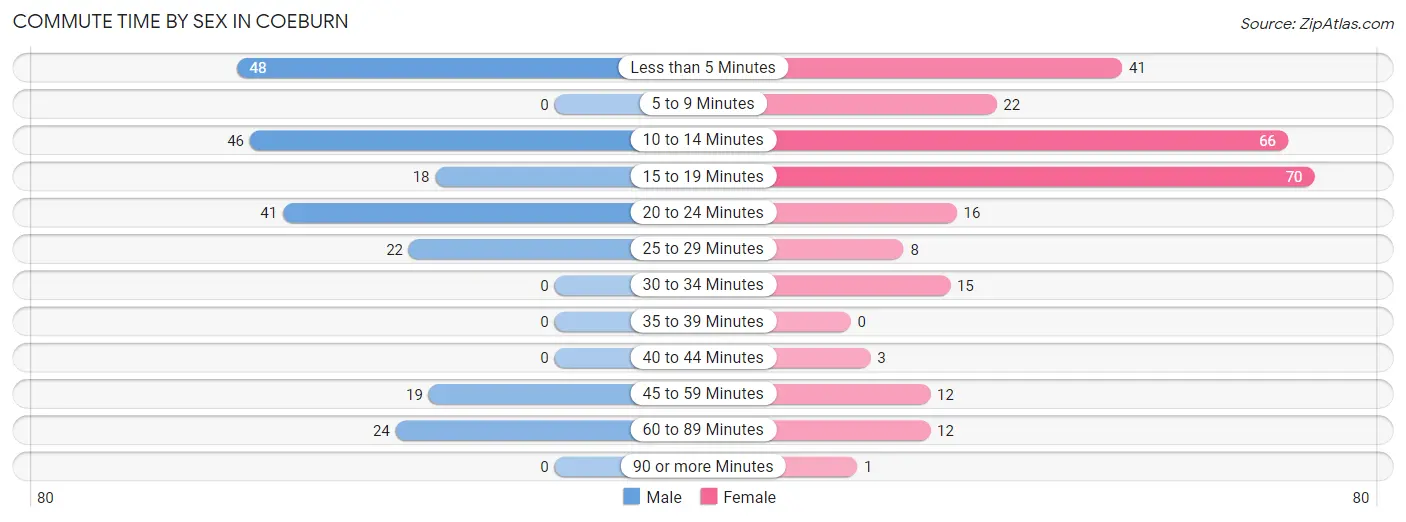
| Commute Time | Male | Female |
| Less than 5 Minutes | 48 (22.0%) | 41 (15.4%) |
| 5 to 9 Minutes | 0 (0.0%) | 22 (8.3%) |
| 10 to 14 Minutes | 46 (21.1%) | 66 (24.8%) |
| 15 to 19 Minutes | 18 (8.3%) | 70 (26.3%) |
| 20 to 24 Minutes | 41 (18.8%) | 16 (6.0%) |
| 25 to 29 Minutes | 22 (10.1%) | 8 (3.0%) |
| 30 to 34 Minutes | 0 (0.0%) | 15 (5.6%) |
| 35 to 39 Minutes | 0 (0.0%) | 0 (0.0%) |
| 40 to 44 Minutes | 0 (0.0%) | 3 (1.1%) |
| 45 to 59 Minutes | 19 (8.7%) | 12 (4.5%) |
| 60 to 89 Minutes | 24 (11.0%) | 12 (4.5%) |
| 90 or more Minutes | 0 (0.0%) | 1 (0.4%) |
Time of Departure to Work by Sex in Coeburn
The most frequent times of departure to work in Coeburn are 12:00 AM to 4:59 AM (48, 22.0%) for males and 7:30 AM to 7:59 AM (77, 28.9%) for females.
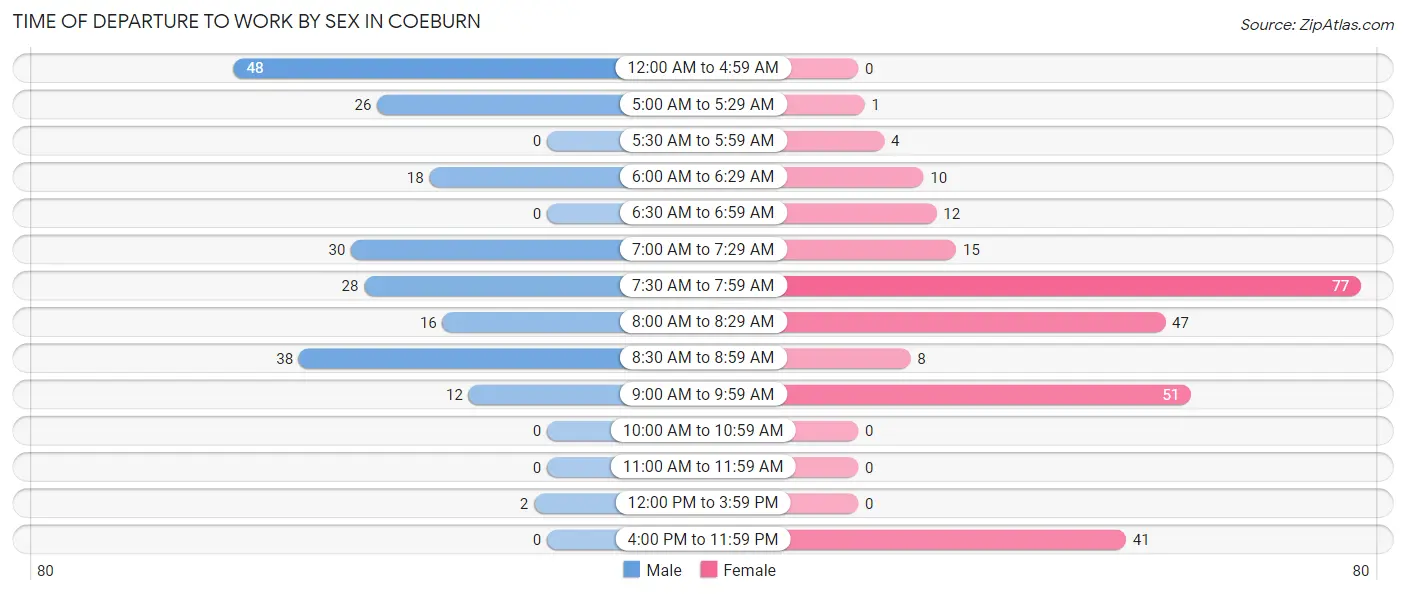
| Time of Departure | Male | Female |
| 12:00 AM to 4:59 AM | 48 (22.0%) | 0 (0.0%) |
| 5:00 AM to 5:29 AM | 26 (11.9%) | 1 (0.4%) |
| 5:30 AM to 5:59 AM | 0 (0.0%) | 4 (1.5%) |
| 6:00 AM to 6:29 AM | 18 (8.3%) | 10 (3.8%) |
| 6:30 AM to 6:59 AM | 0 (0.0%) | 12 (4.5%) |
| 7:00 AM to 7:29 AM | 30 (13.8%) | 15 (5.6%) |
| 7:30 AM to 7:59 AM | 28 (12.8%) | 77 (28.9%) |
| 8:00 AM to 8:29 AM | 16 (7.3%) | 47 (17.7%) |
| 8:30 AM to 8:59 AM | 38 (17.4%) | 8 (3.0%) |
| 9:00 AM to 9:59 AM | 12 (5.5%) | 51 (19.2%) |
| 10:00 AM to 10:59 AM | 0 (0.0%) | 0 (0.0%) |
| 11:00 AM to 11:59 AM | 0 (0.0%) | 0 (0.0%) |
| 12:00 PM to 3:59 PM | 2 (0.9%) | 0 (0.0%) |
| 4:00 PM to 11:59 PM | 0 (0.0%) | 41 (15.4%) |
| Total | 218 (100.0%) | 266 (100.0%) |
Housing Occupancy in Coeburn
Occupancy by Ownership in Coeburn
Of the total 670 dwellings in Coeburn, owner-occupied units account for 444 (66.3%), while renter-occupied units make up 226 (33.7%).
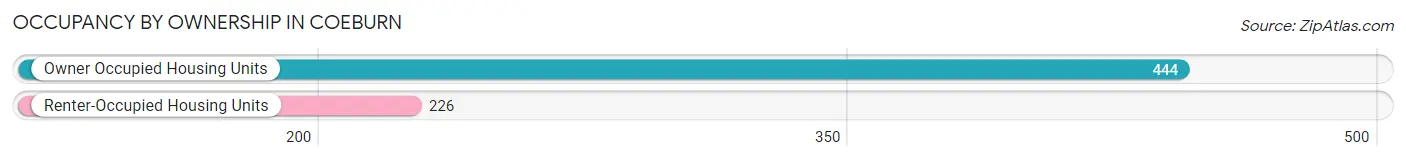
| Occupancy | # Housing Units | % Housing Units |
| Owner Occupied Housing Units | 444 | 66.3% |
| Renter-Occupied Housing Units | 226 | 33.7% |
| Total Occupied Housing Units | 670 | 100.0% |
Occupancy by Household Size in Coeburn
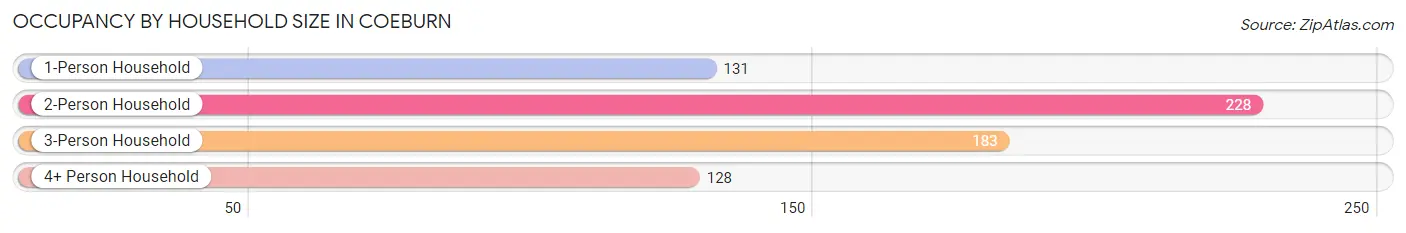
| Household Size | # Housing Units | % Housing Units |
| 1-Person Household | 131 | 19.6% |
| 2-Person Household | 228 | 34.0% |
| 3-Person Household | 183 | 27.3% |
| 4+ Person Household | 128 | 19.1% |
| Total Housing Units | 670 | 100.0% |
Occupancy by Ownership by Household Size in Coeburn
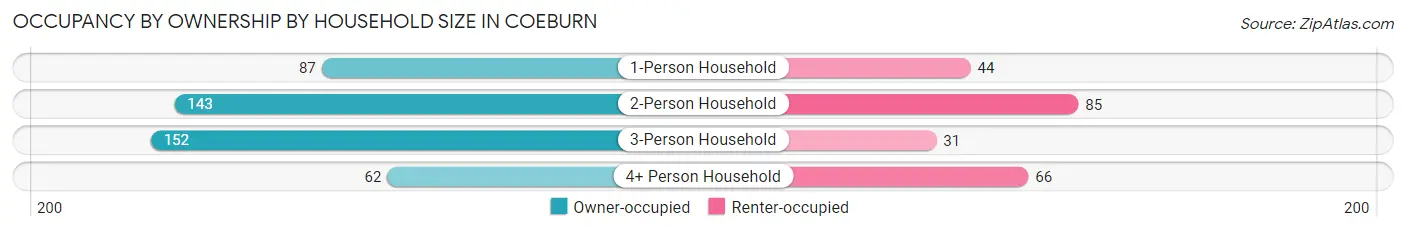
| Household Size | Owner-occupied | Renter-occupied |
| 1-Person Household | 87 (66.4%) | 44 (33.6%) |
| 2-Person Household | 143 (62.7%) | 85 (37.3%) |
| 3-Person Household | 152 (83.1%) | 31 (16.9%) |
| 4+ Person Household | 62 (48.4%) | 66 (51.6%) |
| Total Housing Units | 444 (66.3%) | 226 (33.7%) |
Occupancy by Educational Attainment in Coeburn
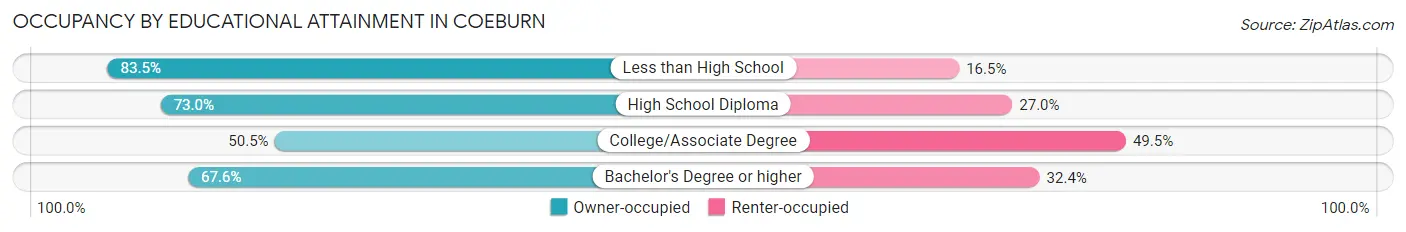
| Household Size | Owner-occupied | Renter-occupied |
| Less than High School | 71 (83.5%) | 14 (16.5%) |
| High School Diploma | 192 (73.0%) | 71 (27.0%) |
| College/Associate Degree | 108 (50.5%) | 106 (49.5%) |
| Bachelor's Degree or higher | 73 (67.6%) | 35 (32.4%) |
Occupancy by Age of Householder in Coeburn
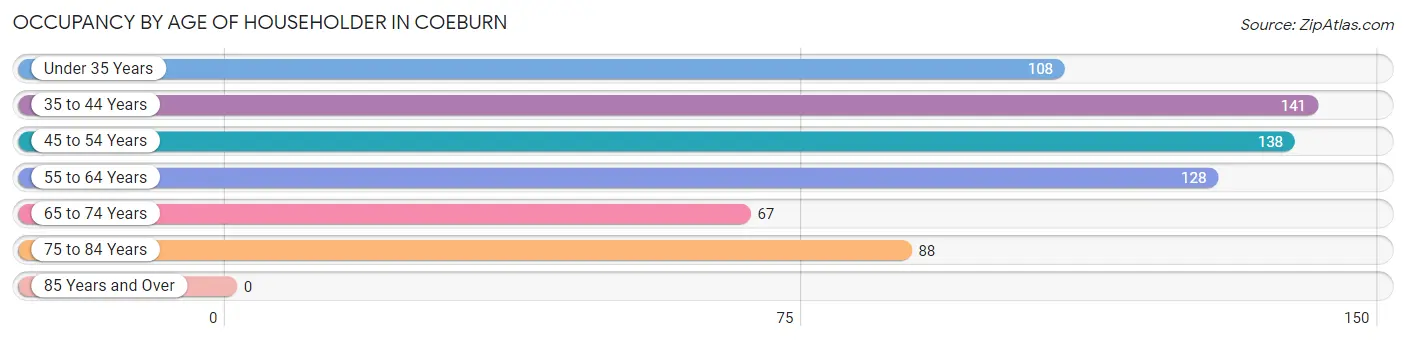
| Age Bracket | # Households | % Households |
| Under 35 Years | 108 | 16.1% |
| 35 to 44 Years | 141 | 21.0% |
| 45 to 54 Years | 138 | 20.6% |
| 55 to 64 Years | 128 | 19.1% |
| 65 to 74 Years | 67 | 10.0% |
| 75 to 84 Years | 88 | 13.1% |
| 85 Years and Over | 0 | 0.0% |
| Total | 670 | 100.0% |
Housing Finances in Coeburn
Median Income by Occupancy in Coeburn
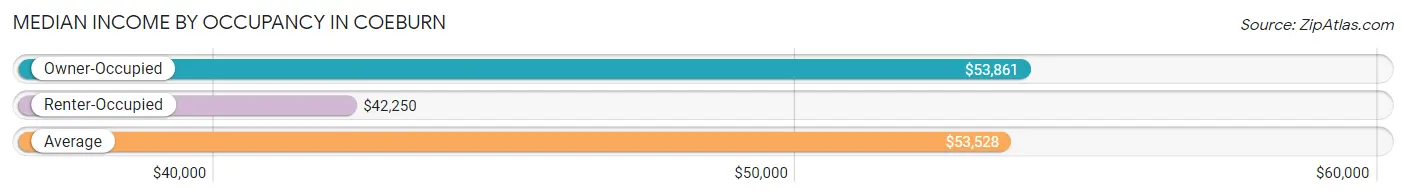
| Occupancy Type | # Households | Median Income |
| Owner-Occupied | 444 (66.3%) | $53,861 |
| Renter-Occupied | 226 (33.7%) | $42,250 |
| Average | 670 (100.0%) | $53,528 |
Occupancy by Householder Income Bracket in Coeburn
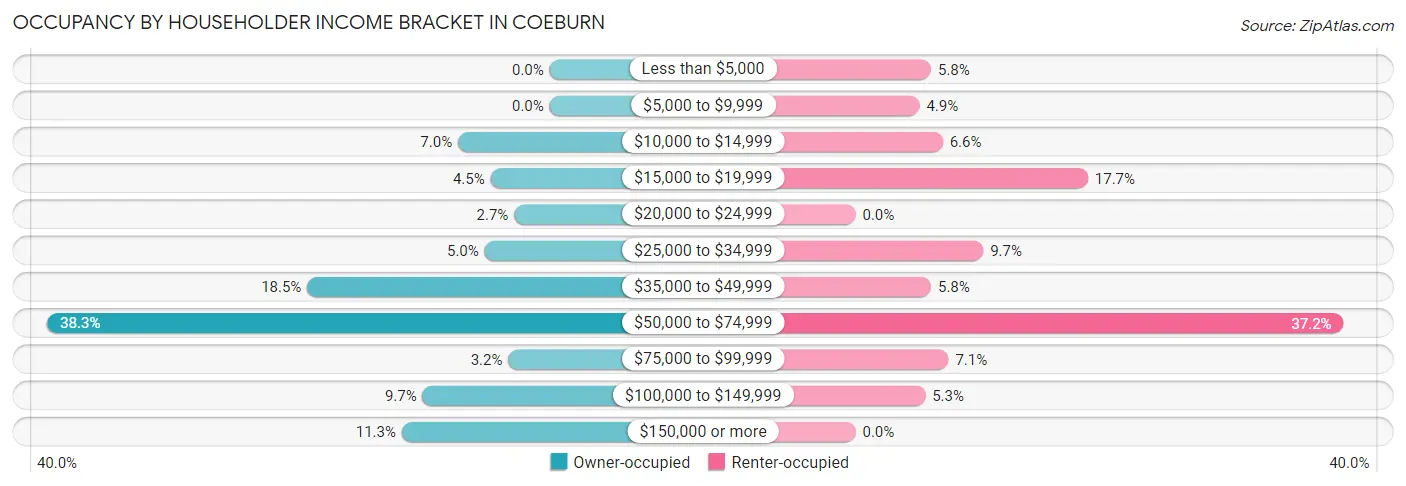
| Income Bracket | Owner-occupied | Renter-occupied |
| Less than $5,000 | 0 (0.0%) | 13 (5.8%) |
| $5,000 to $9,999 | 0 (0.0%) | 11 (4.9%) |
| $10,000 to $14,999 | 31 (7.0%) | 15 (6.6%) |
| $15,000 to $19,999 | 20 (4.5%) | 40 (17.7%) |
| $20,000 to $24,999 | 12 (2.7%) | 0 (0.0%) |
| $25,000 to $34,999 | 22 (5.0%) | 22 (9.7%) |
| $35,000 to $49,999 | 82 (18.5%) | 13 (5.8%) |
| $50,000 to $74,999 | 170 (38.3%) | 84 (37.2%) |
| $75,000 to $99,999 | 14 (3.2%) | 16 (7.1%) |
| $100,000 to $149,999 | 43 (9.7%) | 12 (5.3%) |
| $150,000 or more | 50 (11.3%) | 0 (0.0%) |
| Total | 444 (100.0%) | 226 (100.0%) |
Monthly Housing Cost Tiers in Coeburn
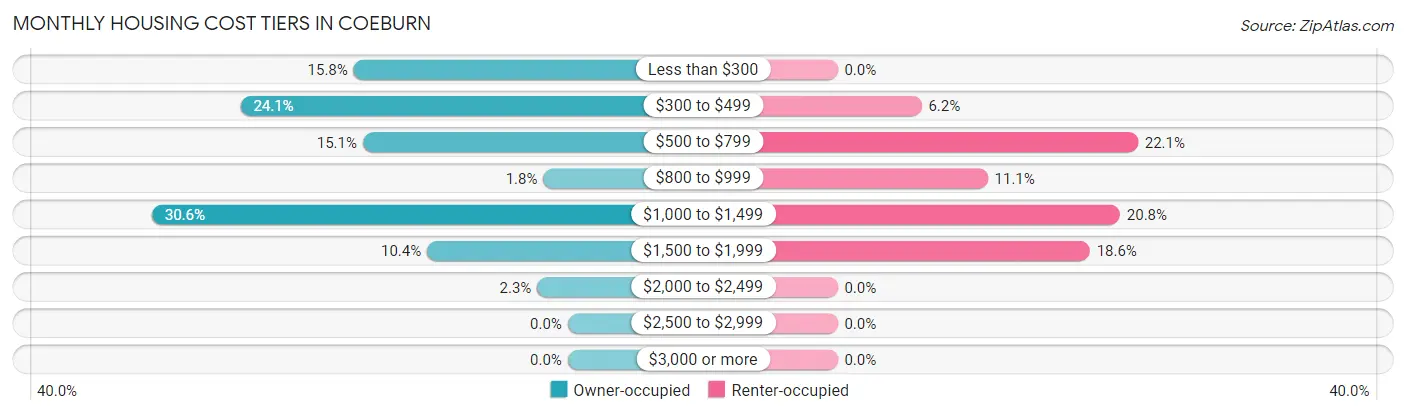
| Monthly Cost | Owner-occupied | Renter-occupied |
| Less than $300 | 70 (15.8%) | 0 (0.0%) |
| $300 to $499 | 107 (24.1%) | 14 (6.2%) |
| $500 to $799 | 67 (15.1%) | 50 (22.1%) |
| $800 to $999 | 8 (1.8%) | 25 (11.1%) |
| $1,000 to $1,499 | 136 (30.6%) | 47 (20.8%) |
| $1,500 to $1,999 | 46 (10.4%) | 42 (18.6%) |
| $2,000 to $2,499 | 10 (2.2%) | 0 (0.0%) |
| $2,500 to $2,999 | 0 (0.0%) | 0 (0.0%) |
| $3,000 or more | 0 (0.0%) | 0 (0.0%) |
| Total | 444 (100.0%) | 226 (100.0%) |
Physical Housing Characteristics in Coeburn
Housing Structures in Coeburn
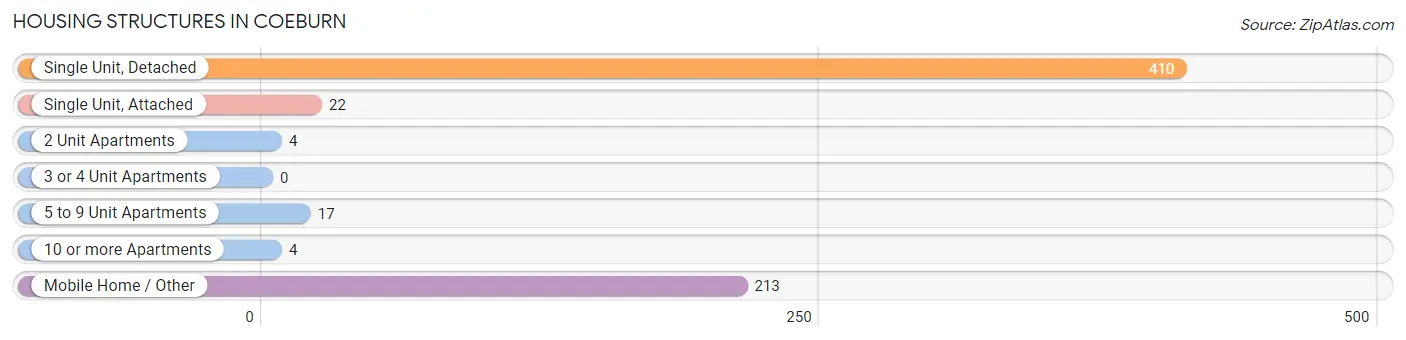
| Structure Type | # Housing Units | % Housing Units |
| Single Unit, Detached | 410 | 61.2% |
| Single Unit, Attached | 22 | 3.3% |
| 2 Unit Apartments | 4 | 0.6% |
| 3 or 4 Unit Apartments | 0 | 0.0% |
| 5 to 9 Unit Apartments | 17 | 2.5% |
| 10 or more Apartments | 4 | 0.6% |
| Mobile Home / Other | 213 | 31.8% |
| Total | 670 | 100.0% |
Housing Structures by Occupancy in Coeburn
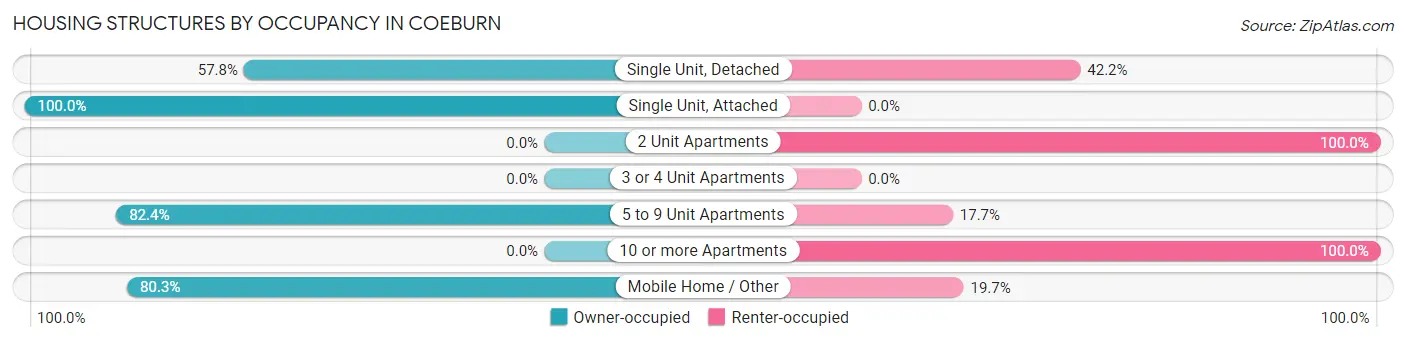
| Structure Type | Owner-occupied | Renter-occupied |
| Single Unit, Detached | 237 (57.8%) | 173 (42.2%) |
| Single Unit, Attached | 22 (100.0%) | 0 (0.0%) |
| 2 Unit Apartments | 0 (0.0%) | 4 (100.0%) |
| 3 or 4 Unit Apartments | 0 (0.0%) | 0 (0.0%) |
| 5 to 9 Unit Apartments | 14 (82.4%) | 3 (17.6%) |
| 10 or more Apartments | 0 (0.0%) | 4 (100.0%) |
| Mobile Home / Other | 171 (80.3%) | 42 (19.7%) |
| Total | 444 (66.3%) | 226 (33.7%) |
Housing Structures by Number of Rooms in Coeburn
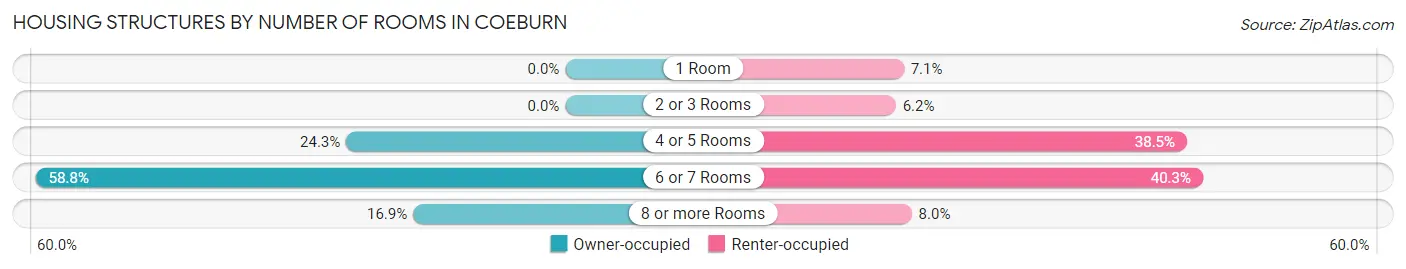
| Number of Rooms | Owner-occupied | Renter-occupied |
| 1 Room | 0 (0.0%) | 16 (7.1%) |
| 2 or 3 Rooms | 0 (0.0%) | 14 (6.2%) |
| 4 or 5 Rooms | 108 (24.3%) | 87 (38.5%) |
| 6 or 7 Rooms | 261 (58.8%) | 91 (40.3%) |
| 8 or more Rooms | 75 (16.9%) | 18 (8.0%) |
| Total | 444 (100.0%) | 226 (100.0%) |
Housing Structure by Heating Type in Coeburn
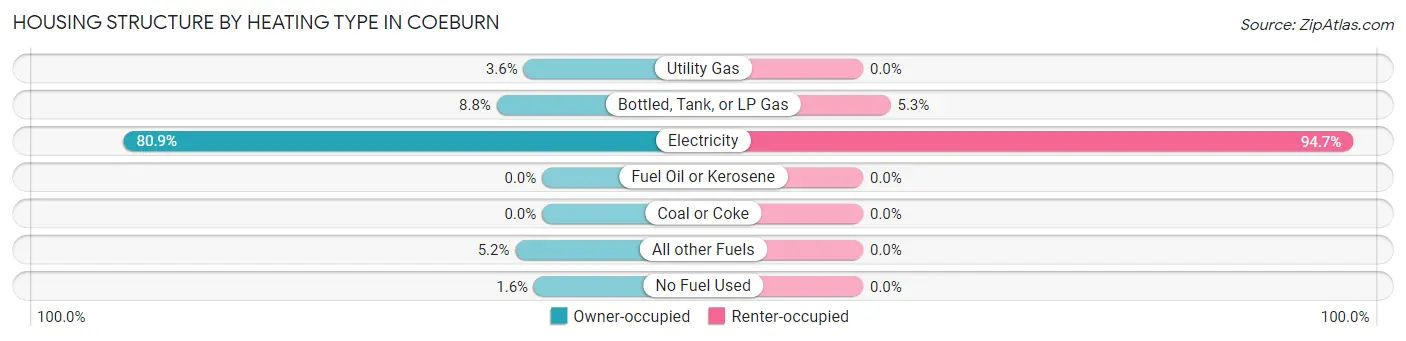
| Heating Type | Owner-occupied | Renter-occupied |
| Utility Gas | 16 (3.6%) | 0 (0.0%) |
| Bottled, Tank, or LP Gas | 39 (8.8%) | 12 (5.3%) |
| Electricity | 359 (80.9%) | 214 (94.7%) |
| Fuel Oil or Kerosene | 0 (0.0%) | 0 (0.0%) |
| Coal or Coke | 0 (0.0%) | 0 (0.0%) |
| All other Fuels | 23 (5.2%) | 0 (0.0%) |
| No Fuel Used | 7 (1.6%) | 0 (0.0%) |
| Total | 444 (100.0%) | 226 (100.0%) |
Household Vehicle Usage in Coeburn
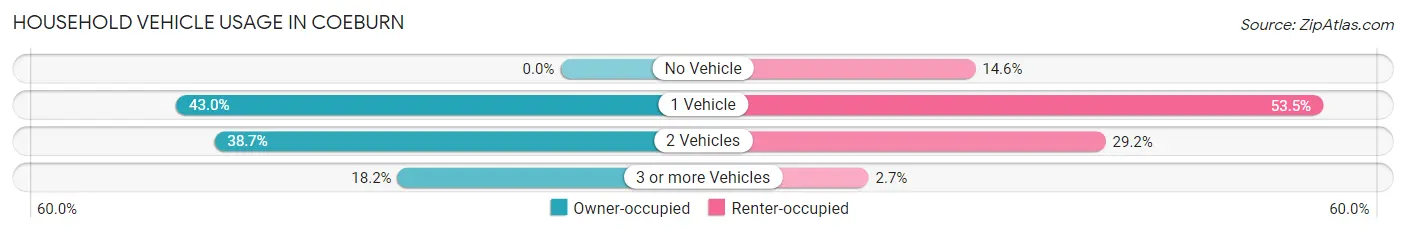
| Vehicles per Household | Owner-occupied | Renter-occupied |
| No Vehicle | 0 (0.0%) | 33 (14.6%) |
| 1 Vehicle | 191 (43.0%) | 121 (53.5%) |
| 2 Vehicles | 172 (38.7%) | 66 (29.2%) |
| 3 or more Vehicles | 81 (18.2%) | 6 (2.6%) |
| Total | 444 (100.0%) | 226 (100.0%) |
Real Estate & Mortgages in Coeburn
Real Estate and Mortgage Overview in Coeburn
| Characteristic | Without Mortgage | With Mortgage |
| Housing Units | 226 | 218 |
| Median Property Value | $74,400 | $119,800 |
| Median Household Income | $47,708 | $30 |
| Monthly Housing Costs | $350 | $0 |
| Real Estate Taxes | $533 | $18 |
Property Value by Mortgage Status in Coeburn
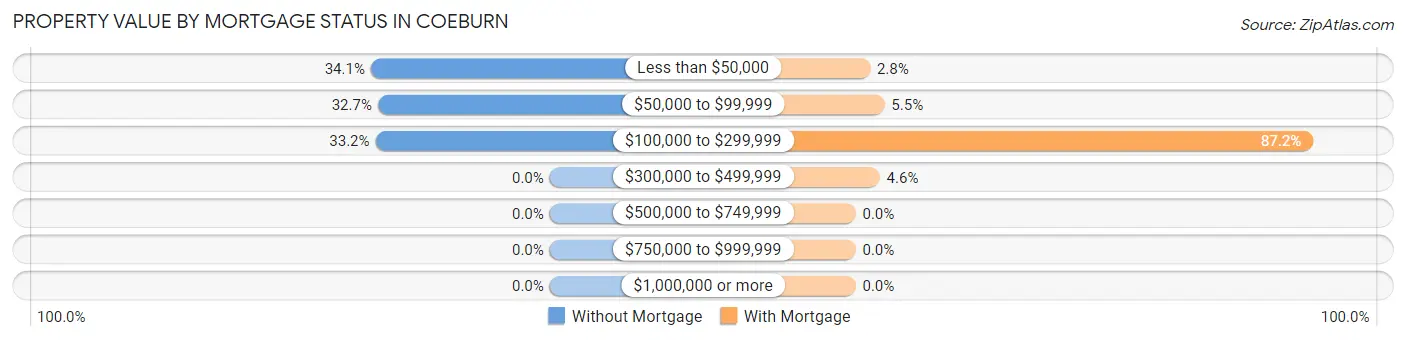
| Property Value | Without Mortgage | With Mortgage |
| Less than $50,000 | 77 (34.1%) | 6 (2.8%) |
| $50,000 to $99,999 | 74 (32.7%) | 12 (5.5%) |
| $100,000 to $299,999 | 75 (33.2%) | 190 (87.2%) |
| $300,000 to $499,999 | 0 (0.0%) | 10 (4.6%) |
| $500,000 to $749,999 | 0 (0.0%) | 0 (0.0%) |
| $750,000 to $999,999 | 0 (0.0%) | 0 (0.0%) |
| $1,000,000 or more | 0 (0.0%) | 0 (0.0%) |
| Total | 226 (100.0%) | 218 (100.0%) |
Household Income by Mortgage Status in Coeburn
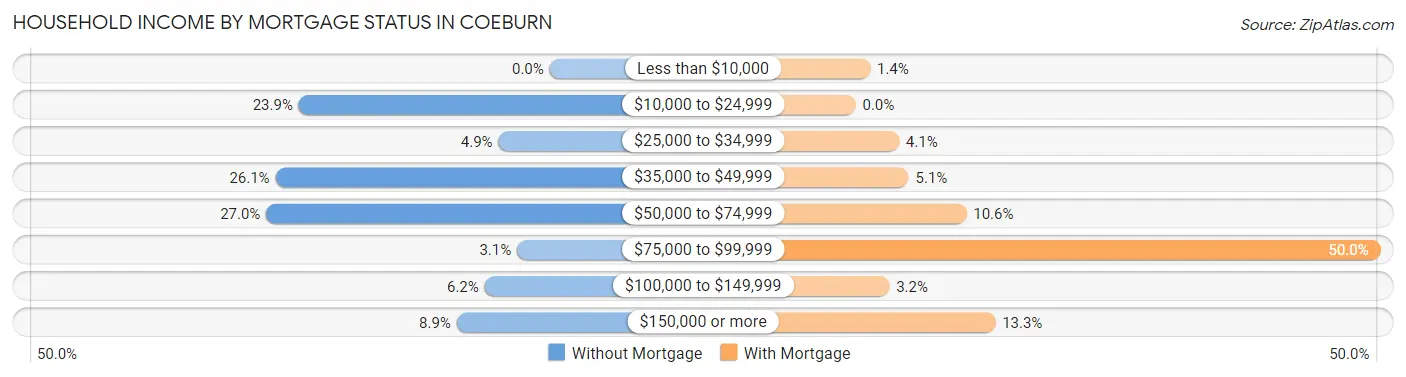
| Household Income | Without Mortgage | With Mortgage |
| Less than $10,000 | 0 (0.0%) | 3 (1.4%) |
| $10,000 to $24,999 | 54 (23.9%) | 0 (0.0%) |
| $25,000 to $34,999 | 11 (4.9%) | 9 (4.1%) |
| $35,000 to $49,999 | 59 (26.1%) | 11 (5.1%) |
| $50,000 to $74,999 | 61 (27.0%) | 23 (10.5%) |
| $75,000 to $99,999 | 7 (3.1%) | 109 (50.0%) |
| $100,000 to $149,999 | 14 (6.2%) | 7 (3.2%) |
| $150,000 or more | 20 (8.8%) | 29 (13.3%) |
| Total | 226 (100.0%) | 218 (100.0%) |
Property Value to Household Income Ratio in Coeburn
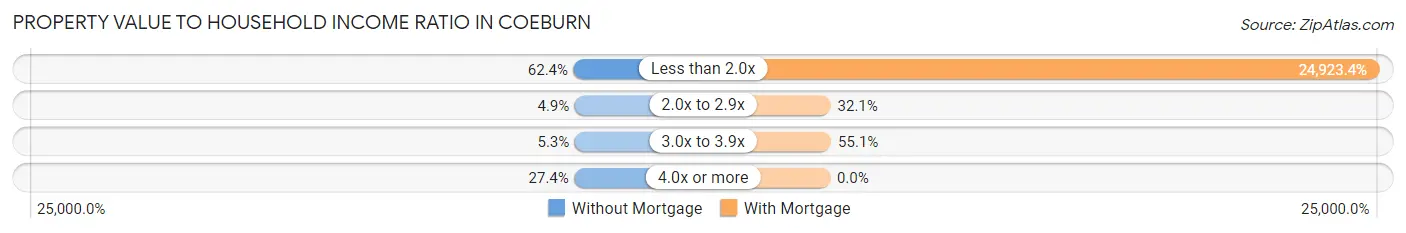
| Value-to-Income Ratio | Without Mortgage | With Mortgage |
| Less than 2.0x | 141 (62.4%) | 54,333 (24,923.4%) |
| 2.0x to 2.9x | 11 (4.9%) | 70 (32.1%) |
| 3.0x to 3.9x | 12 (5.3%) | 120 (55.0%) |
| 4.0x or more | 62 (27.4%) | 0 (0.0%) |
| Total | 226 (100.0%) | 218 (100.0%) |
Real Estate Taxes by Mortgage Status in Coeburn
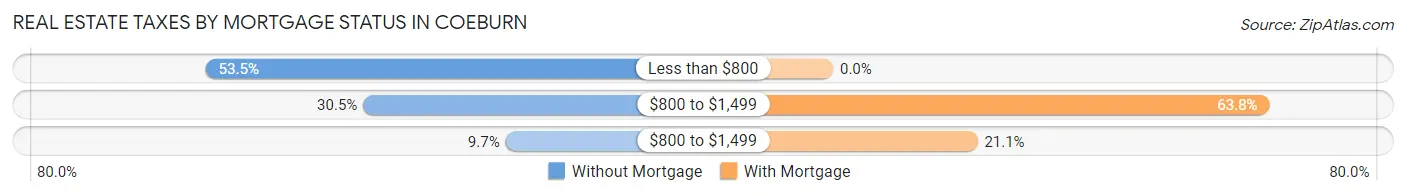
| Property Taxes | Without Mortgage | With Mortgage |
| Less than $800 | 121 (53.5%) | 0 (0.0%) |
| $800 to $1,499 | 69 (30.5%) | 139 (63.8%) |
| $800 to $1,499 | 22 (9.7%) | 46 (21.1%) |
| Total | 226 (100.0%) | 218 (100.0%) |
Health & Disability in Coeburn
Health Insurance Coverage by Age in Coeburn
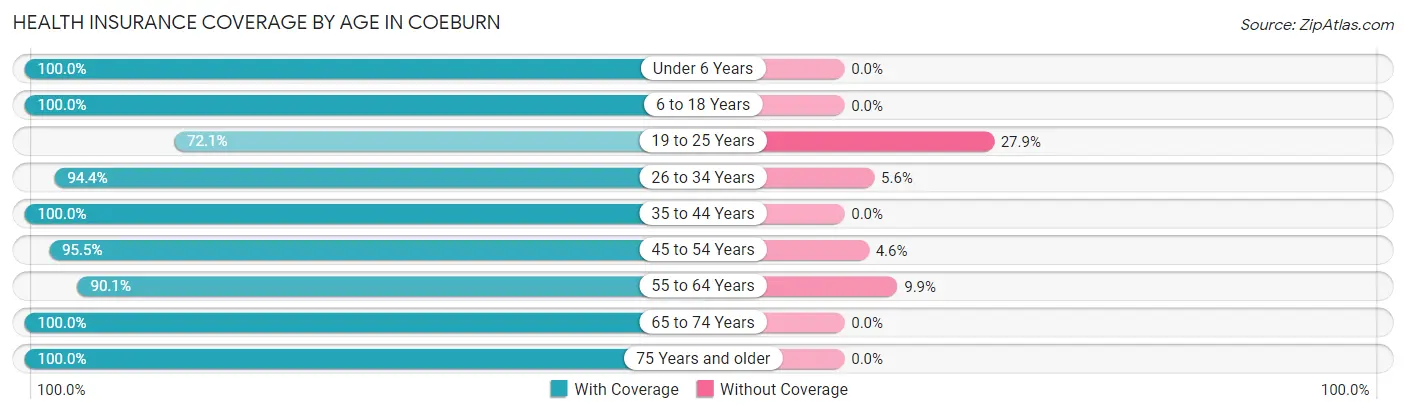
| Age Bracket | With Coverage | Without Coverage |
| Under 6 Years | 70 (100.0%) | 0 (0.0%) |
| 6 to 18 Years | 254 (100.0%) | 0 (0.0%) |
| 19 to 25 Years | 44 (72.1%) | 17 (27.9%) |
| 26 to 34 Years | 204 (94.4%) | 12 (5.6%) |
| 35 to 44 Years | 208 (100.0%) | 0 (0.0%) |
| 45 to 54 Years | 273 (95.5%) | 13 (4.5%) |
| 55 to 64 Years | 146 (90.1%) | 16 (9.9%) |
| 65 to 74 Years | 141 (100.0%) | 0 (0.0%) |
| 75 Years and older | 135 (100.0%) | 0 (0.0%) |
| Total | 1,475 (96.2%) | 58 (3.8%) |
Health Insurance Coverage by Citizenship Status in Coeburn
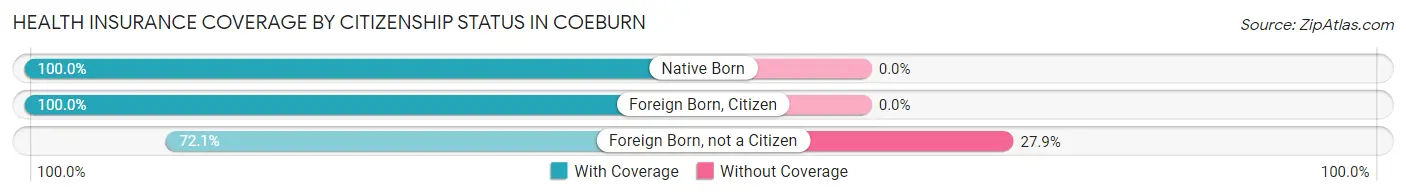
| Citizenship Status | With Coverage | Without Coverage |
| Native Born | 70 (100.0%) | 0 (0.0%) |
| Foreign Born, Citizen | 254 (100.0%) | 0 (0.0%) |
| Foreign Born, not a Citizen | 44 (72.1%) | 17 (27.9%) |
Health Insurance Coverage by Household Income in Coeburn
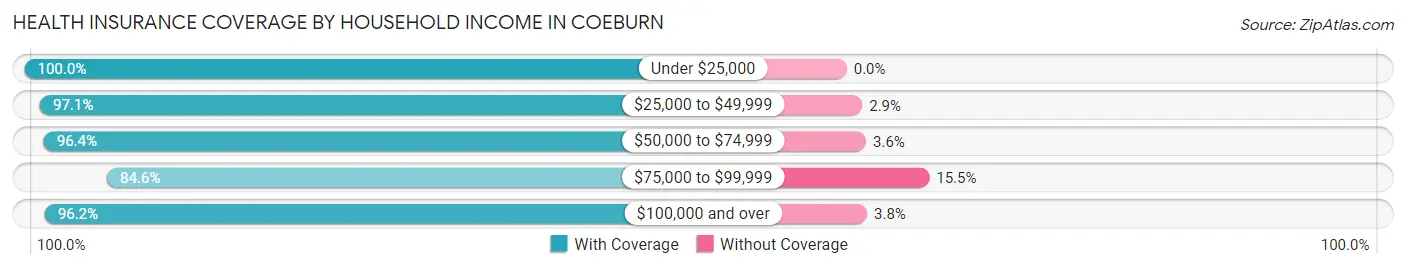
| Household Income | With Coverage | Without Coverage |
| Under $25,000 | 237 (100.0%) | 0 (0.0%) |
| $25,000 to $49,999 | 268 (97.1%) | 8 (2.9%) |
| $50,000 to $74,999 | 561 (96.4%) | 21 (3.6%) |
| $75,000 to $99,999 | 93 (84.6%) | 17 (15.4%) |
| $100,000 and over | 304 (96.2%) | 12 (3.8%) |
Public vs Private Health Insurance Coverage by Age in Coeburn
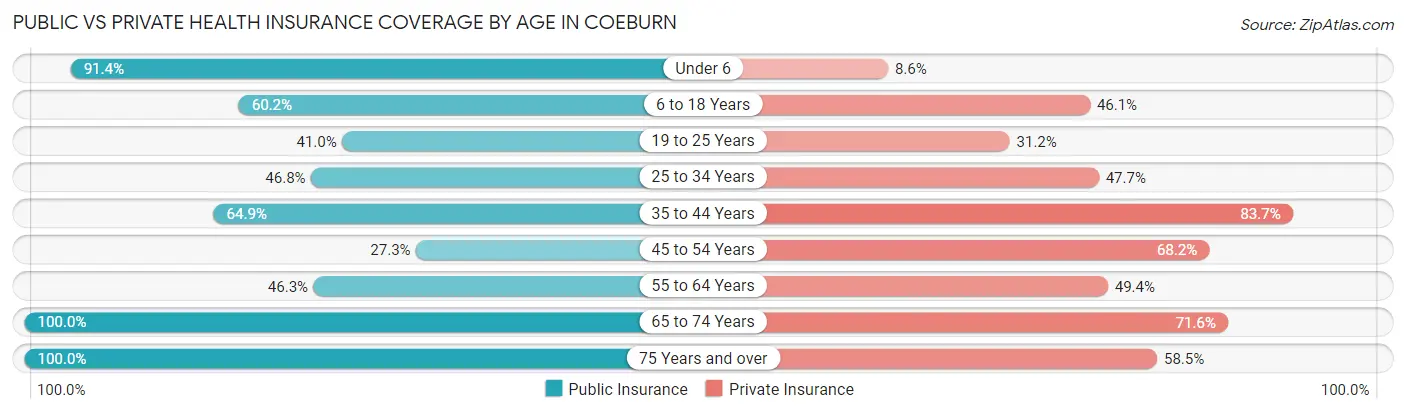
| Age Bracket | Public Insurance | Private Insurance |
| Under 6 | 64 (91.4%) | 6 (8.6%) |
| 6 to 18 Years | 153 (60.2%) | 117 (46.1%) |
| 19 to 25 Years | 25 (41.0%) | 19 (31.1%) |
| 25 to 34 Years | 101 (46.8%) | 103 (47.7%) |
| 35 to 44 Years | 135 (64.9%) | 174 (83.7%) |
| 45 to 54 Years | 78 (27.3%) | 195 (68.2%) |
| 55 to 64 Years | 75 (46.3%) | 80 (49.4%) |
| 65 to 74 Years | 141 (100.0%) | 101 (71.6%) |
| 75 Years and over | 135 (100.0%) | 79 (58.5%) |
| Total | 907 (59.2%) | 874 (57.0%) |
Disability Status by Sex by Age in Coeburn
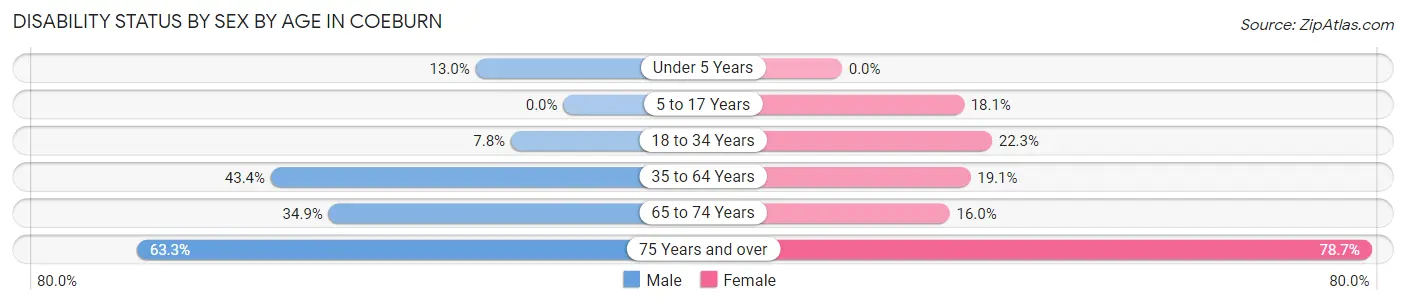
| Age Bracket | Male | Female |
| Under 5 Years | 6 (13.0%) | 0 (0.0%) |
| 5 to 17 Years | 0 (0.0%) | 19 (18.1%) |
| 18 to 34 Years | 6 (7.8%) | 53 (22.3%) |
| 35 to 64 Years | 162 (43.4%) | 54 (19.1%) |
| 65 to 74 Years | 23 (34.8%) | 12 (16.0%) |
| 75 Years and over | 38 (63.3%) | 59 (78.7%) |
Disability Class by Sex by Age in Coeburn
Disability Class: Hearing Difficulty
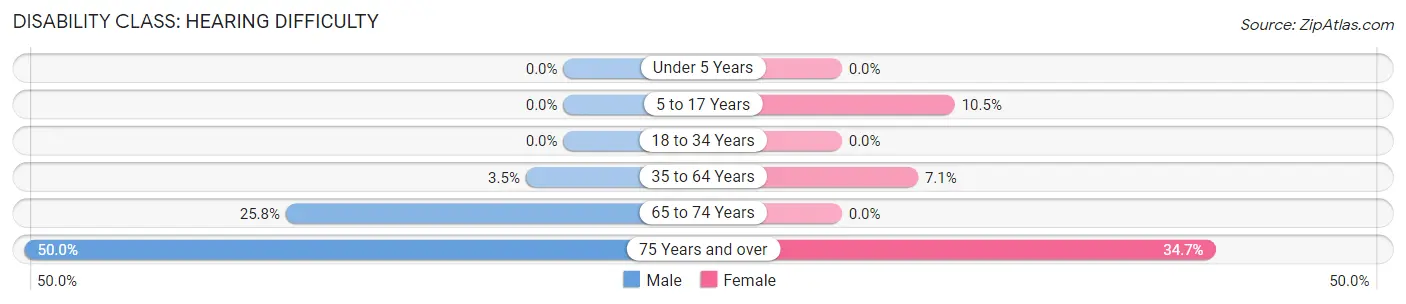
| Age Bracket | Male | Female |
| Under 5 Years | 0 (0.0%) | 0 (0.0%) |
| 5 to 17 Years | 0 (0.0%) | 11 (10.5%) |
| 18 to 34 Years | 0 (0.0%) | 0 (0.0%) |
| 35 to 64 Years | 13 (3.5%) | 20 (7.1%) |
| 65 to 74 Years | 17 (25.8%) | 0 (0.0%) |
| 75 Years and over | 30 (50.0%) | 26 (34.7%) |
Disability Class: Vision Difficulty
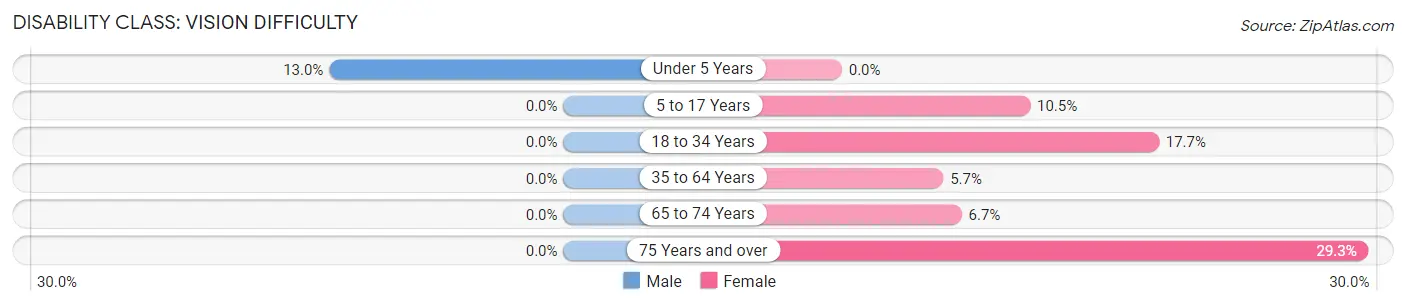
| Age Bracket | Male | Female |
| Under 5 Years | 6 (13.0%) | 0 (0.0%) |
| 5 to 17 Years | 0 (0.0%) | 11 (10.5%) |
| 18 to 34 Years | 0 (0.0%) | 42 (17.6%) |
| 35 to 64 Years | 0 (0.0%) | 16 (5.7%) |
| 65 to 74 Years | 0 (0.0%) | 5 (6.7%) |
| 75 Years and over | 0 (0.0%) | 22 (29.3%) |
Disability Class: Cognitive Difficulty
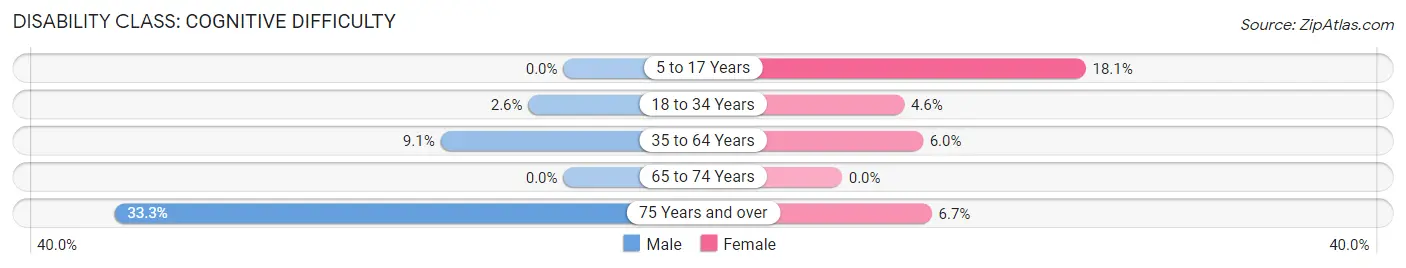
| Age Bracket | Male | Female |
| 5 to 17 Years | 0 (0.0%) | 19 (18.1%) |
| 18 to 34 Years | 2 (2.6%) | 11 (4.6%) |
| 35 to 64 Years | 34 (9.1%) | 17 (6.0%) |
| 65 to 74 Years | 0 (0.0%) | 0 (0.0%) |
| 75 Years and over | 20 (33.3%) | 5 (6.7%) |
Disability Class: Ambulatory Difficulty
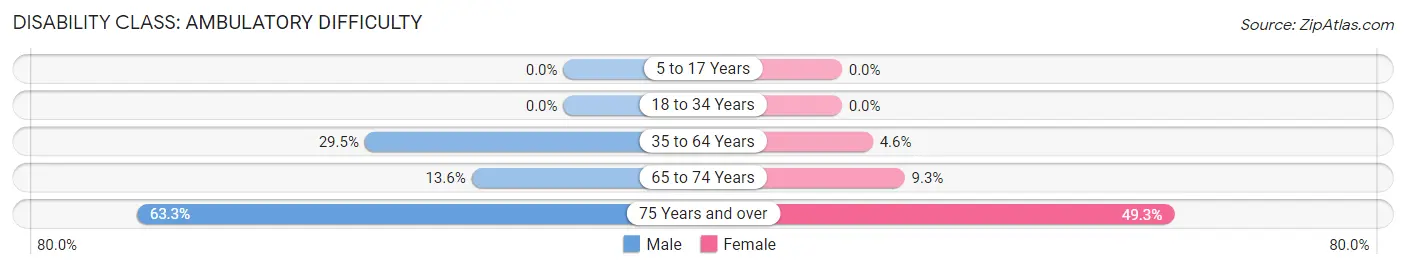
| Age Bracket | Male | Female |
| 5 to 17 Years | 0 (0.0%) | 0 (0.0%) |
| 18 to 34 Years | 0 (0.0%) | 0 (0.0%) |
| 35 to 64 Years | 110 (29.5%) | 13 (4.6%) |
| 65 to 74 Years | 9 (13.6%) | 7 (9.3%) |
| 75 Years and over | 38 (63.3%) | 37 (49.3%) |
Disability Class: Self-Care Difficulty
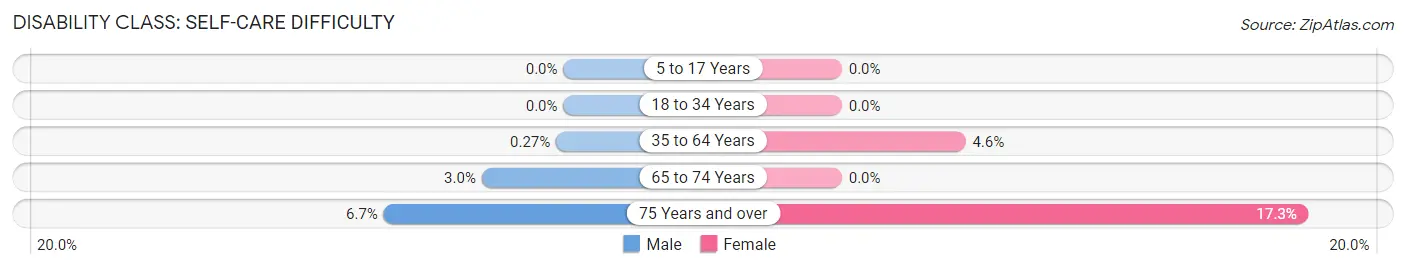
| Age Bracket | Male | Female |
| 5 to 17 Years | 0 (0.0%) | 0 (0.0%) |
| 18 to 34 Years | 0 (0.0%) | 0 (0.0%) |
| 35 to 64 Years | 1 (0.3%) | 13 (4.6%) |
| 65 to 74 Years | 2 (3.0%) | 0 (0.0%) |
| 75 Years and over | 4 (6.7%) | 13 (17.3%) |
Technology Access in Coeburn
Computing Device Access in Coeburn
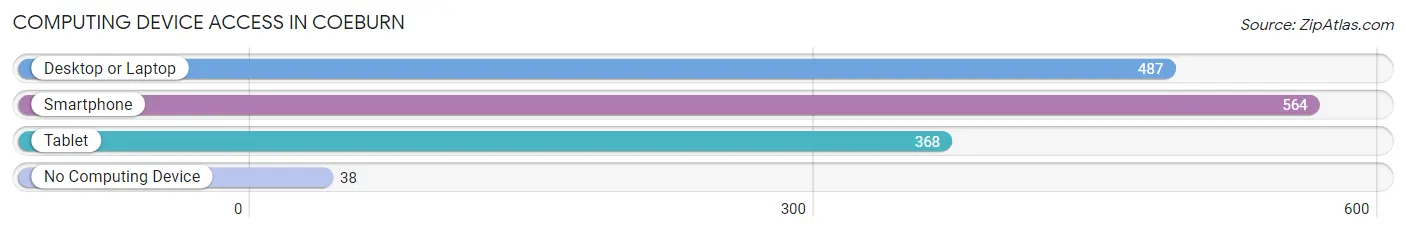
| Device Type | # Households | % Households |
| Desktop or Laptop | 487 | 72.7% |
| Smartphone | 564 | 84.2% |
| Tablet | 368 | 54.9% |
| No Computing Device | 38 | 5.7% |
| Total | 670 | 100.0% |
Internet Access in Coeburn
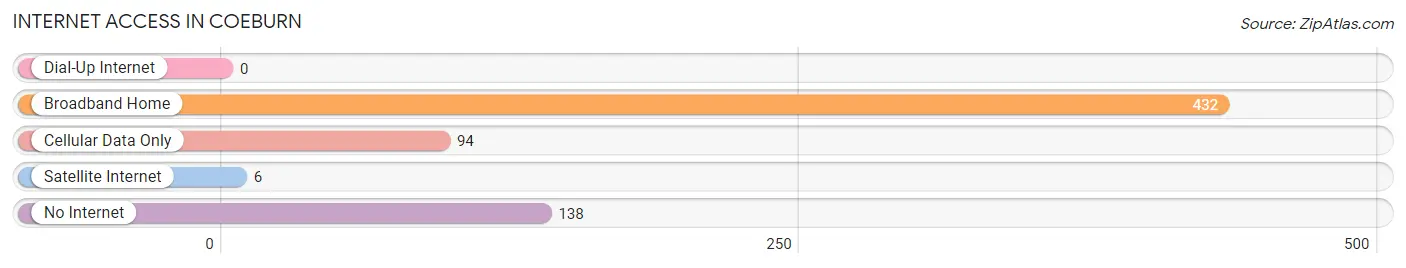
| Internet Type | # Households | % Households |
| Dial-Up Internet | 0 | 0.0% |
| Broadband Home | 432 | 64.5% |
| Cellular Data Only | 94 | 14.0% |
| Satellite Internet | 6 | 0.9% |
| No Internet | 138 | 20.6% |
| Total | 670 | 100.0% |
Coeburn Summary
Coeburn, Virginia is a small town located in the Appalachian Mountains of Southwest Virginia. It is situated in Wise County, and is part of the Big Stone Gap Micropolitan Statistical Area. The town was founded in 1883 and has a population of 1,788 as of the 2010 census.
History
Coeburn was founded in 1883 by the Virginia and Tennessee Railroad. The town was named after the Coe family, who owned the land on which the town was built. The town was originally known as Coe’s Station, but the name was changed to Coeburn in 1884.
The town was a major coal mining center in the late 19th and early 20th centuries. The coal industry was the main source of employment for the town’s residents. The town was also home to several sawmills and other industries.
In the early 20th century, Coeburn was a popular tourist destination. The town was home to several hotels, restaurants, and other attractions. The town was also home to the Coeburn Opera House, which hosted performances by some of the most famous performers of the time.
Geography
Coeburn is located in the Appalachian Mountains of Southwest Virginia. The town is situated in Wise County, and is part of the Big Stone Gap Micropolitan Statistical Area. The town is located at an elevation of 1,845 feet above sea level.
The town is located near the Clinch River, which is a major tributary of the Tennessee River. The town is also located near the Cumberland Mountains, which are part of the Appalachian Mountain Range.
The town is located near several state parks, including Natural Tunnel State Park, High Knob Recreation Area, and Cumberland Gap National Historical Park.
Economy
Coeburn’s economy is largely based on the coal industry. The town is home to several coal mines, and the coal industry is the main source of employment for the town’s residents.
The town is also home to several sawmills and other industries. The town is home to several retail stores, restaurants, and other businesses.
Demographics
As of the 2010 census, Coeburn had a population of 1,788. The town has a median household income of $25,972, and a median family income of $31,250. The town has a poverty rate of 24.3%.
The town is predominantly white, with 92.3% of the population identifying as white. The town is also home to a small African American population, with 4.2% of the population identifying as African American. The town is also home to a small Hispanic population, with 1.7% of the population identifying as Hispanic or Latino.
Conclusion
Coeburn, Virginia is a small town located in the Appalachian Mountains of Southwest Virginia. The town was founded in 1883 and has a population of 1,788 as of the 2010 census. The town’s economy is largely based on the coal industry, and the town is also home to several sawmills and other industries. The town is predominantly white, with 92.3% of the population identifying as white. The town has a median household income of $25,972, and a poverty rate of 24.3%.
Common Questions
What is Per Capita Income in Coeburn?
Per Capita income in Coeburn is $26,968.
What is the Median Family Income in Coeburn?
Median Family Income in Coeburn is $53,434.
What is the Median Household income in Coeburn?
Median Household Income in Coeburn is $53,528.
What is Income or Wage Gap in Coeburn?
Income or Wage Gap in Coeburn is 37.1%.
Women in Coeburn earn 62.9 cents for every dollar earned by a man.
What is Inequality or Gini Index in Coeburn?
Inequality or Gini Index in Coeburn is 0.40.
What is the Total Population of Coeburn?
Total Population of Coeburn is 1,533.
What is the Total Male Population of Coeburn?
Total Male Population of Coeburn is 733.
What is the Total Female Population of Coeburn?
Total Female Population of Coeburn is 800.
What is the Ratio of Males per 100 Females in Coeburn?
There are 91.62 Males per 100 Females in Coeburn.
What is the Ratio of Females per 100 Males in Coeburn?
There are 109.14 Females per 100 Males in Coeburn.
What is the Median Population Age in Coeburn?
Median Population Age in Coeburn is 44.6 Years.
What is the Average Family Size in Coeburn
Average Family Size in Coeburn is 2.5 People.
What is the Average Household Size in Coeburn
Average Household Size in Coeburn is 2.3 People.
How Large is the Labor Force in Coeburn?
There are 568 People in the Labor Forcein in Coeburn.
What is the Percentage of People in the Labor Force in Coeburn?
43.8% of People are in the Labor Force in Coeburn.
What is the Unemployment Rate in Coeburn?
Unemployment Rate in Coeburn is 11.4%.