Cloverdale, VA Map & Demographics
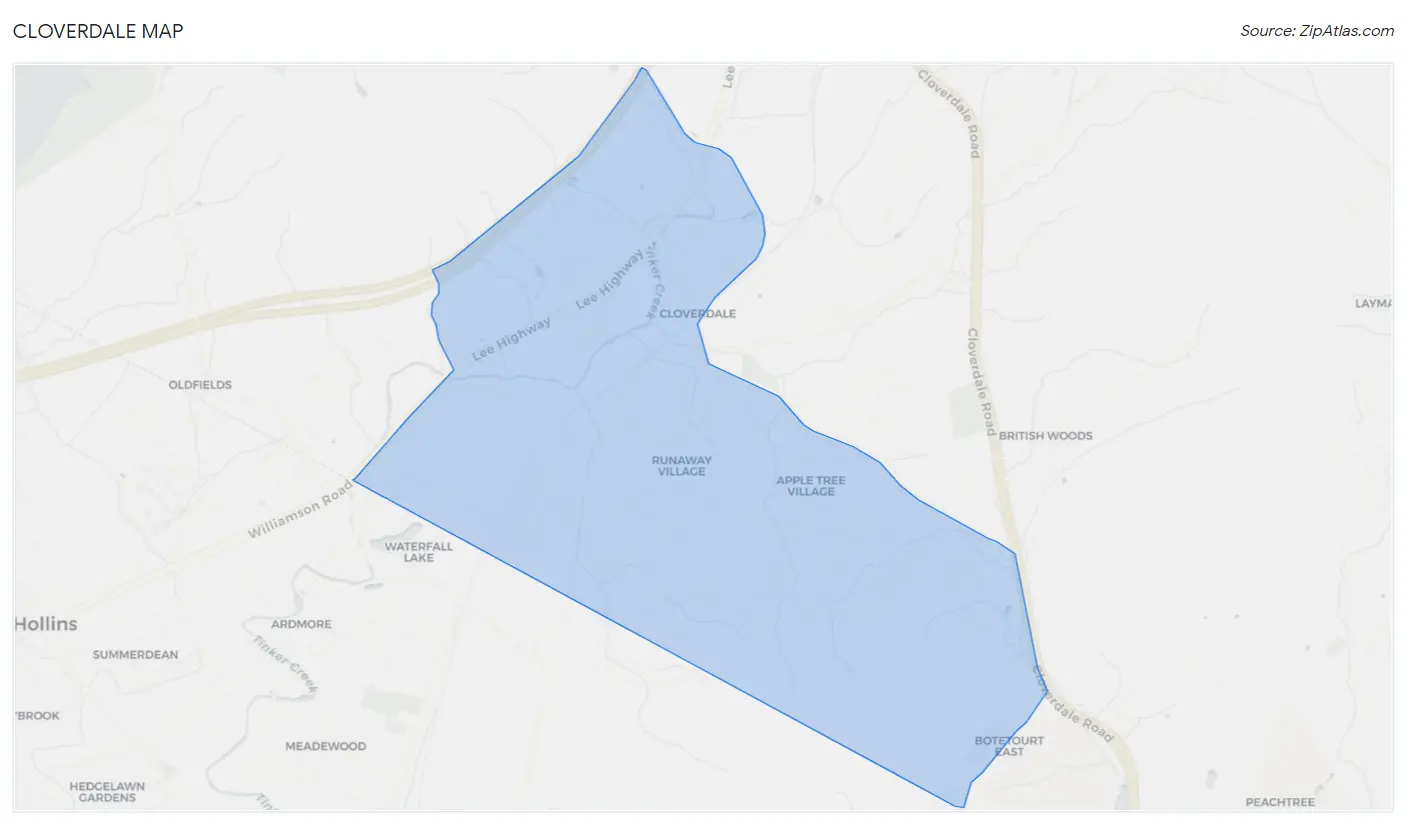
Cloverdale Map
Cloverdale Overview
$36,940
PER CAPITA INCOME
$86,310
AVG FAMILY INCOME
$64,929
AVG HOUSEHOLD INCOME
26.4%
WAGE / INCOME GAP [ % ]
73.6¢/ $1
WAGE / INCOME GAP [ $ ]
0.40
INEQUALITY / GINI INDEX
3,501
TOTAL POPULATION
1,680
MALE POPULATION
1,821
FEMALE POPULATION
92.26
MALES / 100 FEMALES
108.39
FEMALES / 100 MALES
50.9
MEDIAN AGE
3.2
AVG FAMILY SIZE
2.4
AVG HOUSEHOLD SIZE
1,858
LABOR FORCE [ PEOPLE ]
60.2%
PERCENT IN LABOR FORCE
5.1%
UNEMPLOYMENT RATE
Cloverdale Zip Codes
Cloverdale Area Codes
Income in Cloverdale
Income Overview in Cloverdale
Per Capita Income in Cloverdale is $36,940, while median incomes of families and households are $86,310 and $64,929 respectively.
| Characteristic | Number | Measure |
| Per Capita Income | 3,501 | $36,940 |
| Median Family Income | 902 | $86,310 |
| Mean Family Income | 902 | $99,343 |
| Median Household Income | 1,458 | $64,929 |
| Mean Household Income | 1,458 | $79,683 |
| Income Deficit | 902 | $0 |
| Wage / Income Gap (%) | 3,501 | 26.44% |
| Wage / Income Gap ($) | 3,501 | 73.56¢ per $1 |
| Gini / Inequality Index | 3,501 | 0.40 |
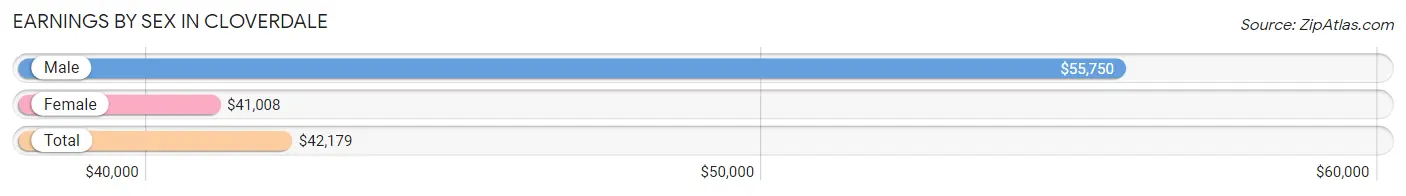
Earnings by Sex in Cloverdale
Average Earnings in Cloverdale are $42,179, $55,750 for men and $41,008 for women, a difference of 26.4%.
| Sex | Number | Average Earnings |
| Male | 958 (50.6%) | $55,750 |
| Female | 935 (49.4%) | $41,008 |
| Total | 1,893 (100.0%) | $42,179 |
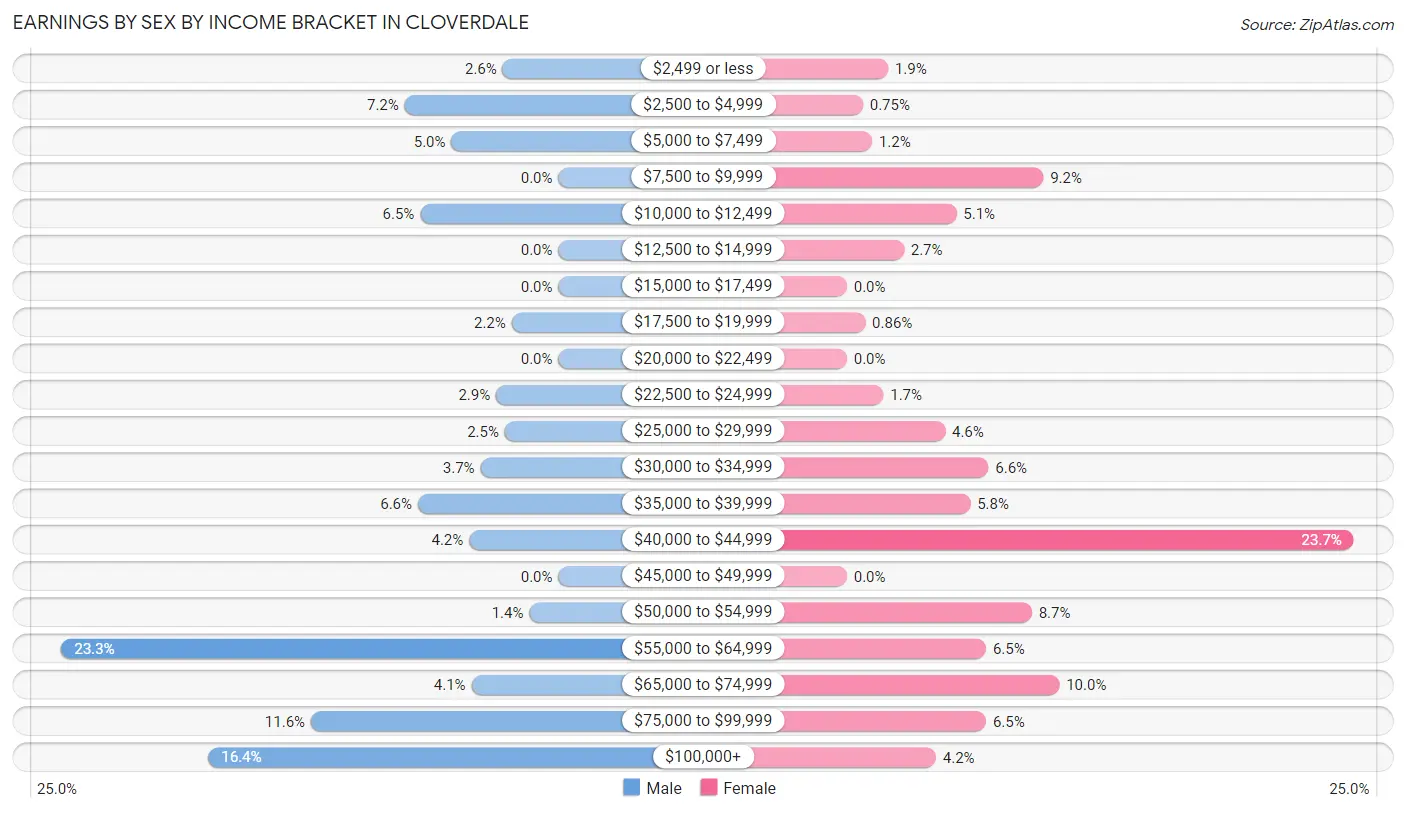
Earnings by Sex by Income Bracket in Cloverdale
The most common earnings brackets in Cloverdale are $55,000 to $64,999 for men (223 | 23.3%) and $40,000 to $44,999 for women (222 | 23.7%).
| Income | Male | Female |
| $2,499 or less | 25 (2.6%) | 18 (1.9%) |
| $2,500 to $4,999 | 69 (7.2%) | 7 (0.7%) |
| $5,000 to $7,499 | 48 (5.0%) | 11 (1.2%) |
| $7,500 to $9,999 | 0 (0.0%) | 86 (9.2%) |
| $10,000 to $12,499 | 62 (6.5%) | 48 (5.1%) |
| $12,500 to $14,999 | 0 (0.0%) | 25 (2.7%) |
| $15,000 to $17,499 | 0 (0.0%) | 0 (0.0%) |
| $17,500 to $19,999 | 21 (2.2%) | 8 (0.9%) |
| $20,000 to $22,499 | 0 (0.0%) | 0 (0.0%) |
| $22,500 to $24,999 | 28 (2.9%) | 16 (1.7%) |
| $25,000 to $29,999 | 24 (2.5%) | 43 (4.6%) |
| $30,000 to $34,999 | 35 (3.6%) | 62 (6.6%) |
| $35,000 to $39,999 | 63 (6.6%) | 54 (5.8%) |
| $40,000 to $44,999 | 40 (4.2%) | 222 (23.7%) |
| $45,000 to $49,999 | 0 (0.0%) | 0 (0.0%) |
| $50,000 to $54,999 | 13 (1.4%) | 81 (8.7%) |
| $55,000 to $64,999 | 223 (23.3%) | 61 (6.5%) |
| $65,000 to $74,999 | 39 (4.1%) | 93 (10.0%) |
| $75,000 to $99,999 | 111 (11.6%) | 61 (6.5%) |
| $100,000+ | 157 (16.4%) | 39 (4.2%) |
| Total | 958 (100.0%) | 935 (100.0%) |
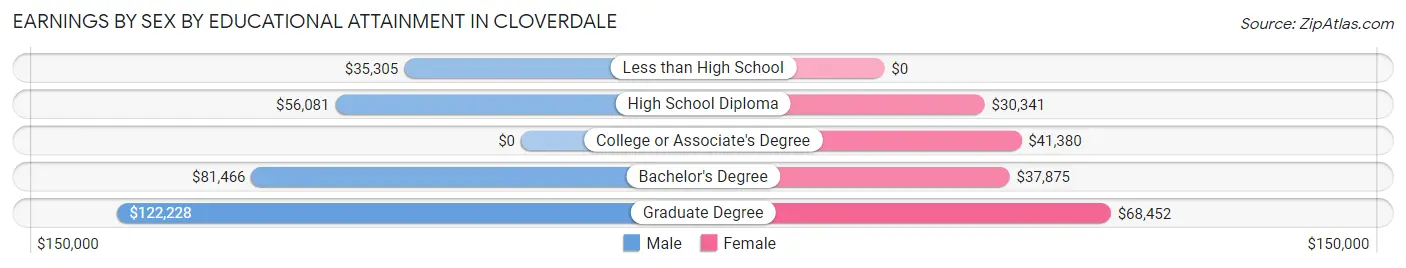
Earnings by Sex by Educational Attainment in Cloverdale
Average earnings in Cloverdale are $56,176 for men and $41,199 for women, a difference of 26.7%. Men with an educational attainment of graduate degree enjoy the highest average annual earnings of $122,228, while those with less than high school education earn the least with $35,305. Women with an educational attainment of graduate degree earn the most with the average annual earnings of $68,452, while those with high school diploma education have the smallest earnings of $30,341.
| Educational Attainment | Male Income | Female Income |
| Less than High School | $35,305 | $0 |
| High School Diploma | $56,081 | $30,341 |
| College or Associate's Degree | - | - |
| Bachelor's Degree | $81,466 | $37,875 |
| Graduate Degree | $122,228 | $68,452 |
| Total | $56,176 | $41,199 |
Family Income in Cloverdale
Family Income Brackets in Cloverdale
According to the Cloverdale family income data, there are 288 families falling into the $75,000 to $99,999 income range, which is the most common income bracket and makes up 31.9% of all families.
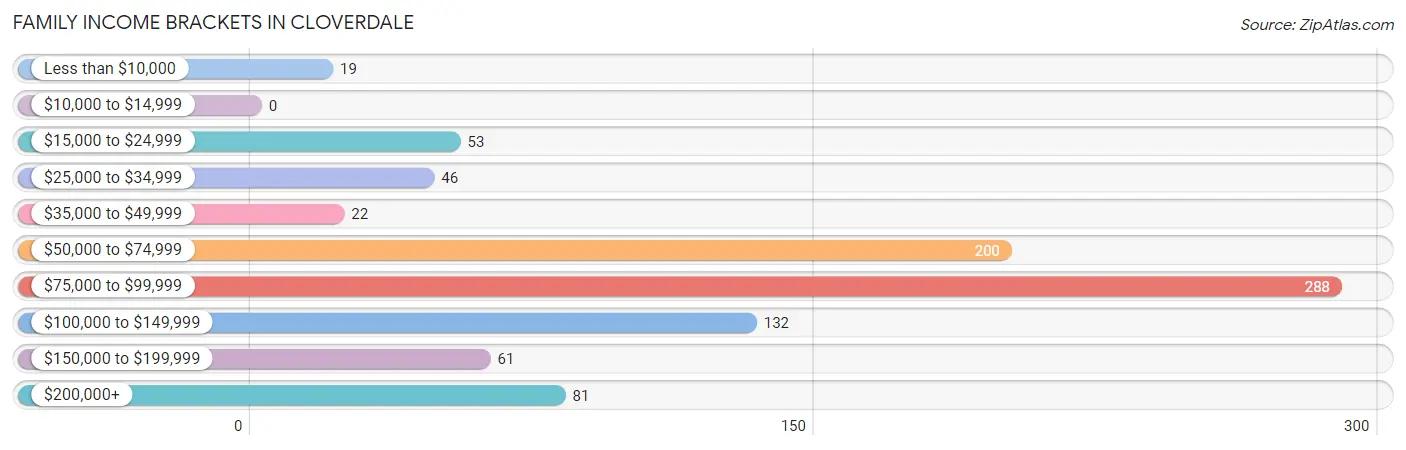
| Income Bracket | # Families | % Families |
| Less than $10,000 | 19 | 2.1% |
| $10,000 to $14,999 | 0 | 0.0% |
| $15,000 to $24,999 | 53 | 5.9% |
| $25,000 to $34,999 | 46 | 5.1% |
| $35,000 to $49,999 | 22 | 2.4% |
| $50,000 to $74,999 | 200 | 22.2% |
| $75,000 to $99,999 | 288 | 31.9% |
| $100,000 to $149,999 | 132 | 14.6% |
| $150,000 to $199,999 | 61 | 6.8% |
| $200,000+ | 81 | 9.0% |
Family Income by Famaliy Size in Cloverdale
4-person families (134 | 14.9%) account for the highest median family income in Cloverdale with $125,250 per family, while 2-person families (516 | 57.2%) have the highest median income of $37,322 per family member.
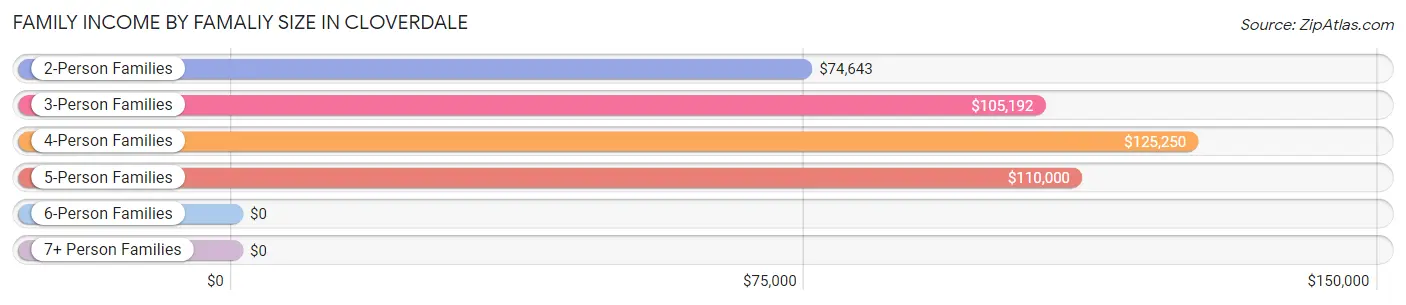
| Income Bracket | # Families | Median Income |
| 2-Person Families | 516 (57.2%) | $74,643 |
| 3-Person Families | 206 (22.8%) | $105,192 |
| 4-Person Families | 134 (14.9%) | $125,250 |
| 5-Person Families | 46 (5.1%) | $110,000 |
| 6-Person Families | 0 (0.0%) | $0 |
| 7+ Person Families | 0 (0.0%) | $0 |
| Total | 902 (100.0%) | $86,310 |
Family Income by Number of Earners in Cloverdale
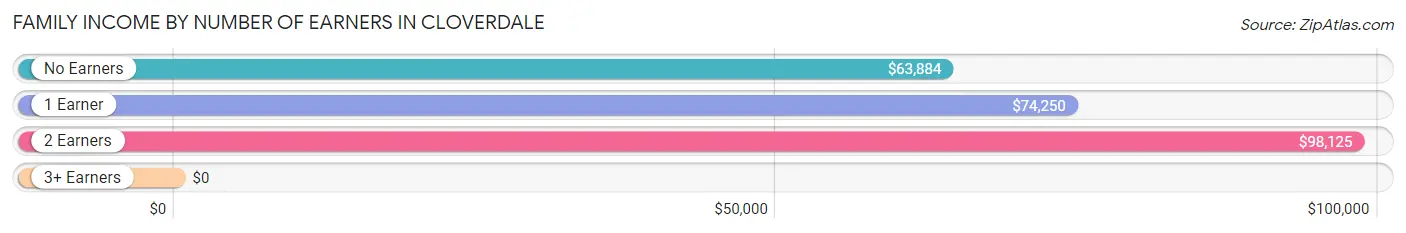
| Number of Earners | # Families | Median Income |
| No Earners | 221 (24.5%) | $63,884 |
| 1 Earner | 198 (22.0%) | $74,250 |
| 2 Earners | 394 (43.7%) | $98,125 |
| 3+ Earners | 89 (9.9%) | $0 |
| Total | 902 (100.0%) | $86,310 |
Household Income in Cloverdale
Household Income Brackets in Cloverdale
With 408 households falling in the category, the $50,000 to $74,999 income range is the most frequent in Cloverdale, accounting for 28.0% of all households. In contrast, only 36 households (2.5%) fall into the $35,000 to $49,999 income bracket, making it the least populous group.
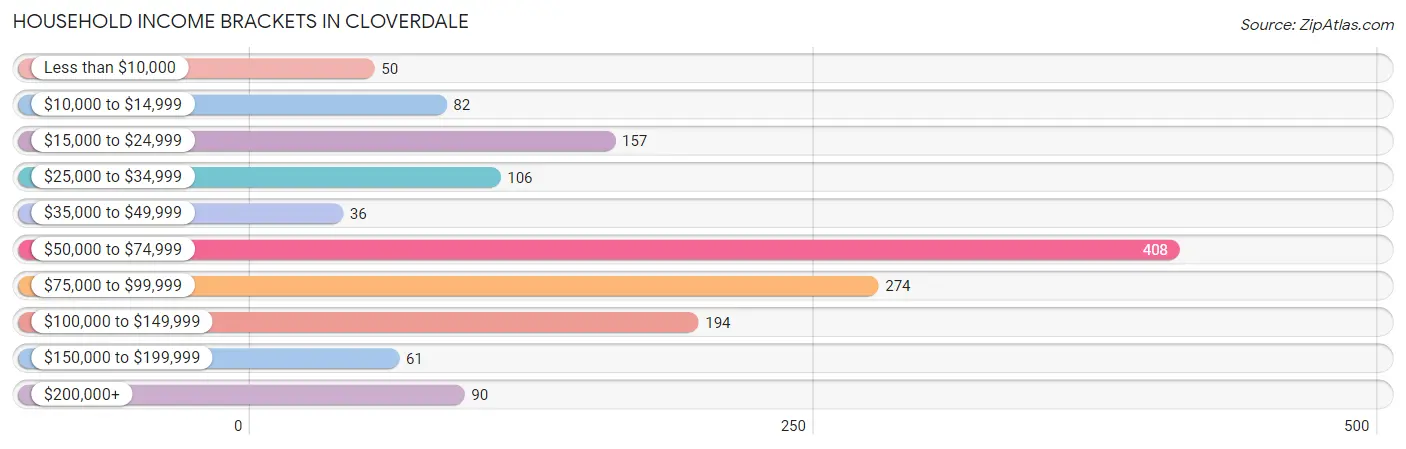
| Income Bracket | # Households | % Households |
| Less than $10,000 | 50 | 3.4% |
| $10,000 to $14,999 | 82 | 5.6% |
| $15,000 to $24,999 | 157 | 10.8% |
| $25,000 to $34,999 | 106 | 7.3% |
| $35,000 to $49,999 | 36 | 2.5% |
| $50,000 to $74,999 | 408 | 28.0% |
| $75,000 to $99,999 | 274 | 18.8% |
| $100,000 to $149,999 | 194 | 13.3% |
| $150,000 to $199,999 | 61 | 4.2% |
| $200,000+ | 90 | 6.2% |
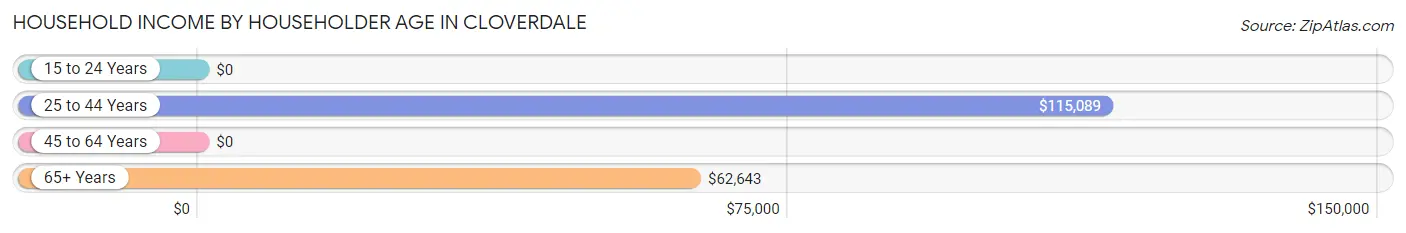
Household Income by Householder Age in Cloverdale
The median household income in Cloverdale is $64,929, with the highest median household income of $115,089 found in the 25 to 44 years age bracket for the primary householder. A total of 273 households (18.7%) fall into this category.
| Income Bracket | # Households | Median Income |
| 15 to 24 Years | 0 (0.0%) | $0 |
| 25 to 44 Years | 273 (18.7%) | $115,089 |
| 45 to 64 Years | 587 (40.3%) | $0 |
| 65+ Years | 598 (41.0%) | $62,643 |
| Total | 1,458 (100.0%) | $64,929 |
Poverty in Cloverdale
Income Below Poverty by Sex and Age in Cloverdale
With 5.9% poverty level for males and 7.0% for females among the residents of Cloverdale, 6 to 11 year old males and 45 to 54 year old females are the most vulnerable to poverty, with 38 males (35.8%) and 68 females (25.6%) in their respective age groups living below the poverty level.
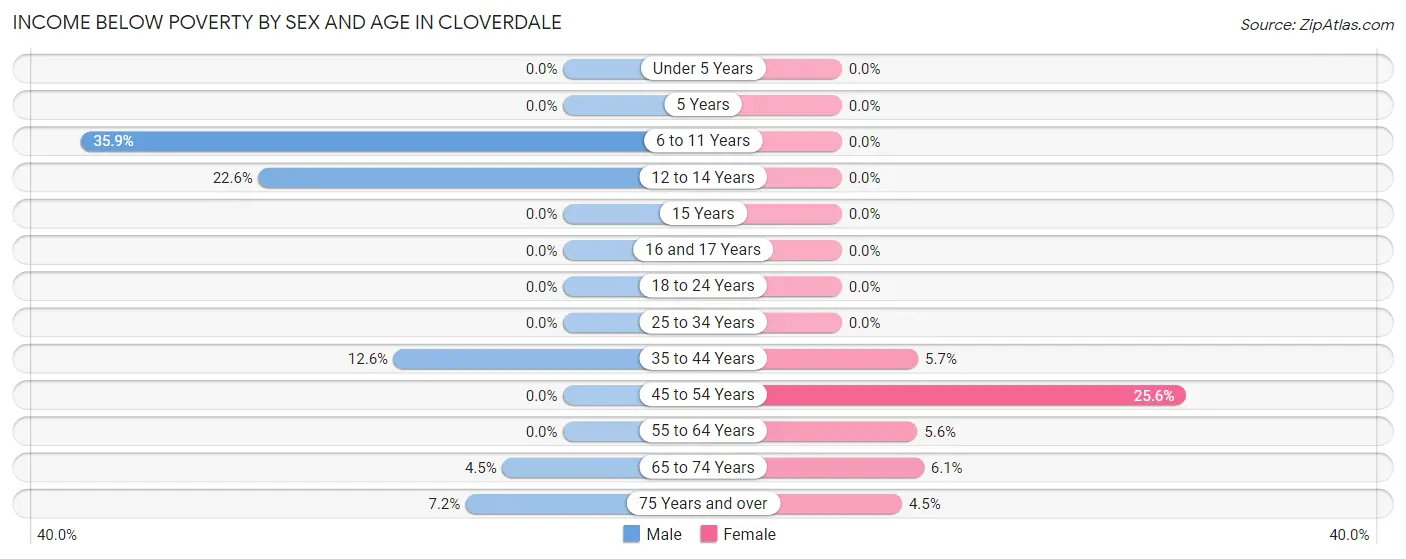
| Age Bracket | Male | Female |
| Under 5 Years | 0 (0.0%) | 0 (0.0%) |
| 5 Years | 0 (0.0%) | 0 (0.0%) |
| 6 to 11 Years | 38 (35.8%) | 0 (0.0%) |
| 12 to 14 Years | 19 (22.6%) | 0 (0.0%) |
| 15 Years | 0 (0.0%) | 0 (0.0%) |
| 16 and 17 Years | 0 (0.0%) | 0 (0.0%) |
| 18 to 24 Years | 0 (0.0%) | 0 (0.0%) |
| 25 to 34 Years | 0 (0.0%) | 0 (0.0%) |
| 35 to 44 Years | 19 (12.6%) | 19 (5.7%) |
| 45 to 54 Years | 0 (0.0%) | 68 (25.6%) |
| 55 to 64 Years | 0 (0.0%) | 11 (5.6%) |
| 65 to 74 Years | 11 (4.5%) | 17 (6.1%) |
| 75 Years and over | 13 (7.2%) | 13 (4.5%) |
| Total | 100 (5.9%) | 128 (7.0%) |
Income Above Poverty by Sex and Age in Cloverdale
According to the poverty statistics in Cloverdale, males aged under 5 years and females aged 5 years are the age groups that are most secure financially, with 100.0% of males and 100.0% of females in these age groups living above the poverty line.
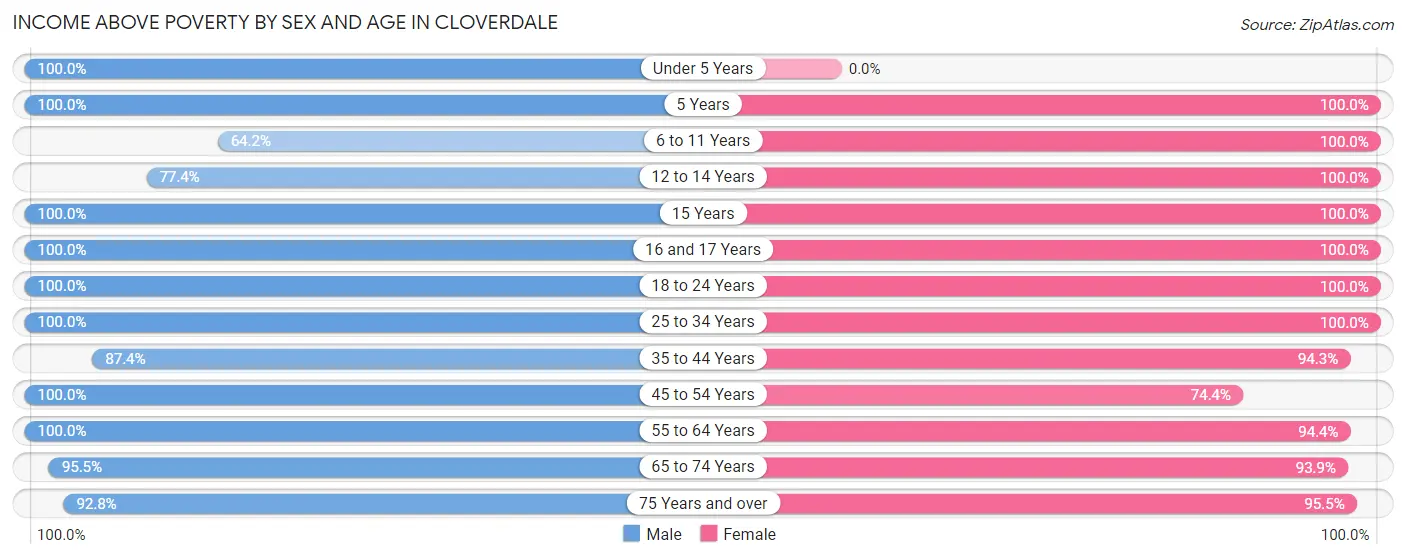
| Age Bracket | Male | Female |
| Under 5 Years | 7 (100.0%) | 0 (0.0%) |
| 5 Years | 7 (100.0%) | 20 (100.0%) |
| 6 to 11 Years | 68 (64.1%) | 130 (100.0%) |
| 12 to 14 Years | 65 (77.4%) | 18 (100.0%) |
| 15 Years | 22 (100.0%) | 20 (100.0%) |
| 16 and 17 Years | 28 (100.0%) | 6 (100.0%) |
| 18 to 24 Years | 100 (100.0%) | 126 (100.0%) |
| 25 to 34 Years | 229 (100.0%) | 134 (100.0%) |
| 35 to 44 Years | 132 (87.4%) | 316 (94.3%) |
| 45 to 54 Years | 170 (100.0%) | 198 (74.4%) |
| 55 to 64 Years | 352 (100.0%) | 185 (94.4%) |
| 65 to 74 Years | 233 (95.5%) | 262 (93.9%) |
| 75 Years and over | 167 (92.8%) | 278 (95.5%) |
| Total | 1,580 (94.1%) | 1,693 (93.0%) |
Income Below Poverty Among Married-Couple Families in Cloverdale
The poverty statistics for married-couple families in Cloverdale show that 1.7% or 11 of the total 631 families live below the poverty line. Families with no children have the highest poverty rate of 2.4%, comprising of 11 families. On the other hand, families with 1 or 2 children have the lowest poverty rate of 0.0%, which includes 0 families.
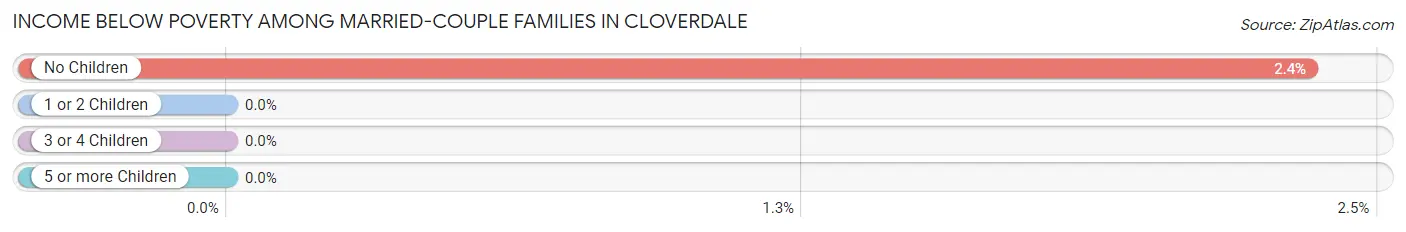
| Children | Above Poverty | Below Poverty |
| No Children | 457 (97.7%) | 11 (2.4%) |
| 1 or 2 Children | 163 (100.0%) | 0 (0.0%) |
| 3 or 4 Children | 0 (0.0%) | 0 (0.0%) |
| 5 or more Children | 0 (0.0%) | 0 (0.0%) |
| Total | 620 (98.3%) | 11 (1.7%) |
Income Below Poverty Among Single-Parent Households in Cloverdale
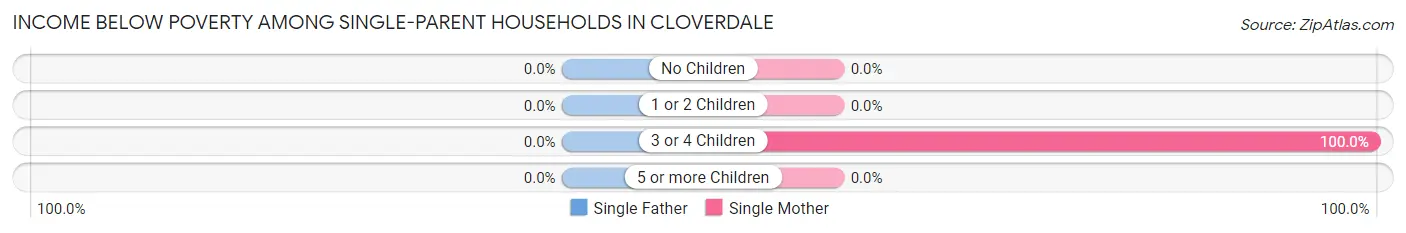
| Children | Single Father | Single Mother |
| No Children | 0 (0.0%) | 0 (0.0%) |
| 1 or 2 Children | 0 (0.0%) | 0 (0.0%) |
| 3 or 4 Children | 0 (0.0%) | 19 (100.0%) |
| 5 or more Children | 0 (0.0%) | 0 (0.0%) |
| Total | 0 (0.0%) | 19 (14.6%) |
Income Below Poverty Among Married-Couple vs Single-Parent Households in Cloverdale
The poverty data for Cloverdale shows that 11 of the married-couple family households (1.7%) and 19 of the single-parent households (7.0%) are living below the poverty level. Within the married-couple family households, those with no children have the highest poverty rate, with 11 households (2.4%) falling below the poverty line. Among the single-parent households, those with 3 or 4 children have the highest poverty rate, with 19 household (100.0%) living below poverty.
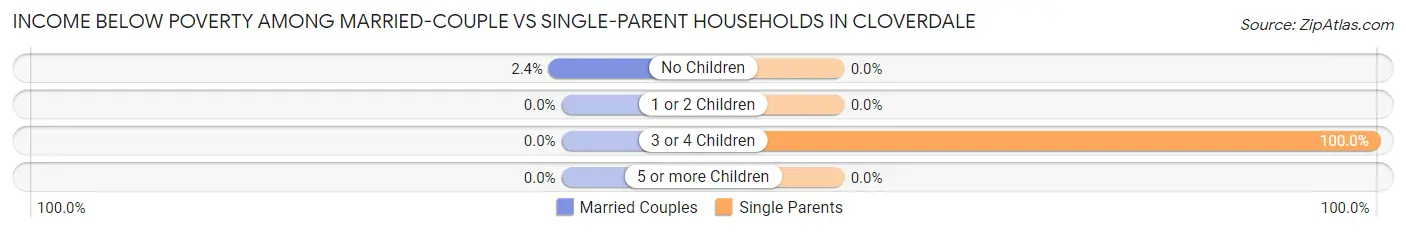
| Children | Married-Couple Families | Single-Parent Households |
| No Children | 11 (2.4%) | 0 (0.0%) |
| 1 or 2 Children | 0 (0.0%) | 0 (0.0%) |
| 3 or 4 Children | 0 (0.0%) | 19 (100.0%) |
| 5 or more Children | 0 (0.0%) | 0 (0.0%) |
| Total | 11 (1.7%) | 19 (7.0%) |
Race in Cloverdale
The most populous races in Cloverdale are White / Caucasian (3,098 | 88.5%), Black / African American (252 | 7.2%), and Hispanic or Latino (86 | 2.5%).
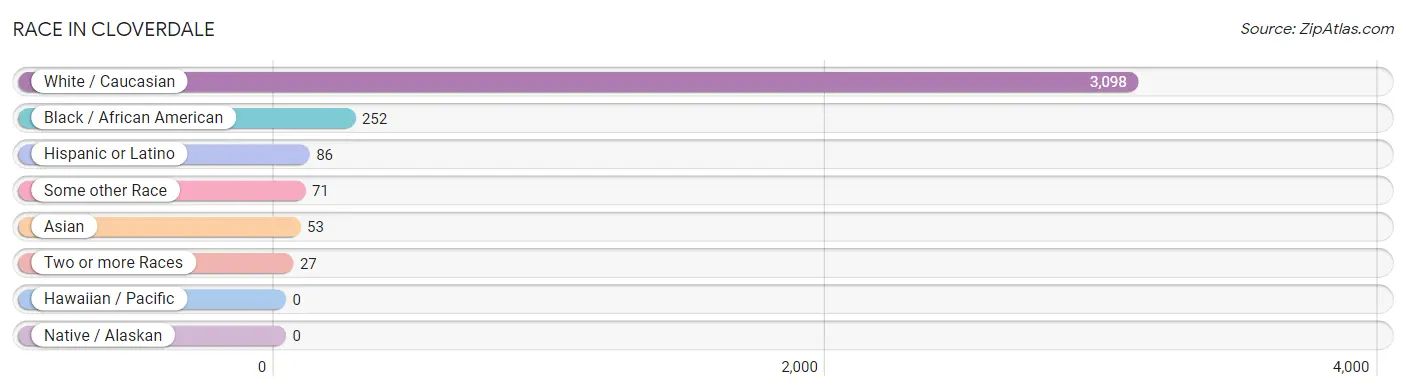
| Race | # Population | % Population |
| Asian | 53 | 1.5% |
| Black / African American | 252 | 7.2% |
| Hawaiian / Pacific | 0 | 0.0% |
| Hispanic or Latino | 86 | 2.5% |
| Native / Alaskan | 0 | 0.0% |
| White / Caucasian | 3,098 | 88.5% |
| Two or more Races | 27 | 0.8% |
| Some other Race | 71 | 2.0% |
| Total | 3,501 | 100.0% |
Ancestry in Cloverdale
The most populous ancestries reported in Cloverdale are American (544 | 15.5%), English (399 | 11.4%), Irish (312 | 8.9%), German (299 | 8.5%), and Scotch-Irish (283 | 8.1%), together accounting for 52.5% of all Cloverdale residents.
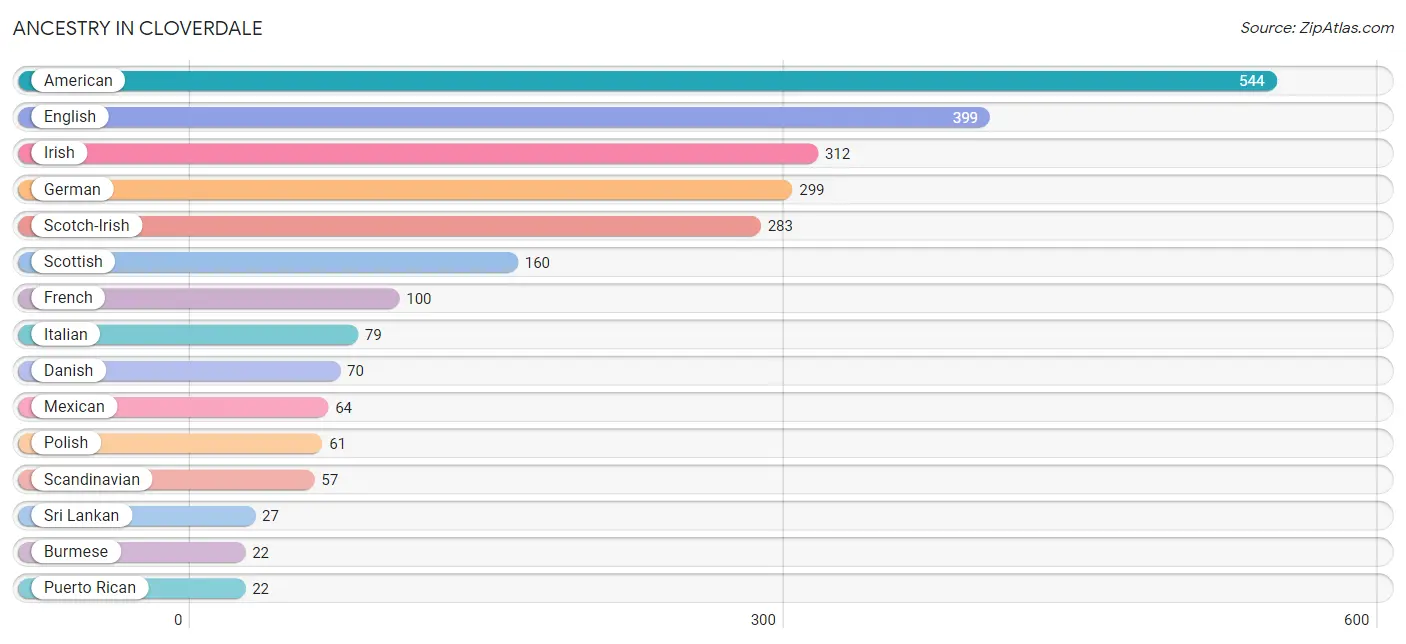
| Ancestry | # Population | % Population |
| American | 544 | 15.5% |
| Arab | 10 | 0.3% |
| Burmese | 22 | 0.6% |
| Czechoslovakian | 4 | 0.1% |
| Danish | 70 | 2.0% |
| Dutch | 12 | 0.3% |
| Eastern European | 5 | 0.1% |
| English | 399 | 11.4% |
| European | 13 | 0.4% |
| French | 100 | 2.9% |
| French Canadian | 10 | 0.3% |
| German | 299 | 8.5% |
| Irish | 312 | 8.9% |
| Italian | 79 | 2.3% |
| Lebanese | 10 | 0.3% |
| Mexican | 64 | 1.8% |
| Polish | 61 | 1.7% |
| Puerto Rican | 22 | 0.6% |
| Scandinavian | 57 | 1.6% |
| Scotch-Irish | 283 | 8.1% |
| Scottish | 160 | 4.6% |
| Sri Lankan | 27 | 0.8% |
| Swedish | 16 | 0.5% |
| Swiss | 10 | 0.3% |
| Thai | 18 | 0.5% | View All 25 Rows |
Immigrants in Cloverdale
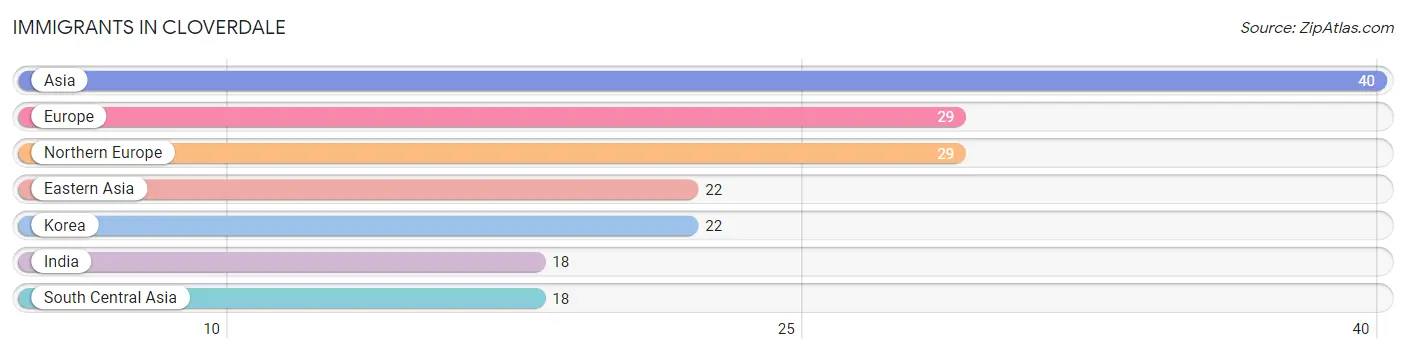
The most numerous immigrant groups reported in Cloverdale came from Asia (40 | 1.1%), Europe (29 | 0.8%), Northern Europe (29 | 0.8%), Eastern Asia (22 | 0.6%), and Korea (22 | 0.6%), together accounting for 4.1% of all Cloverdale residents.
| Immigration Origin | # Population | % Population |
| Asia | 40 | 1.1% |
| Eastern Asia | 22 | 0.6% |
| Europe | 29 | 0.8% |
| India | 18 | 0.5% |
| Korea | 22 | 0.6% |
| Northern Europe | 29 | 0.8% |
| South Central Asia | 18 | 0.5% | View All 7 Rows |
Sex and Age in Cloverdale
Sex and Age in Cloverdale
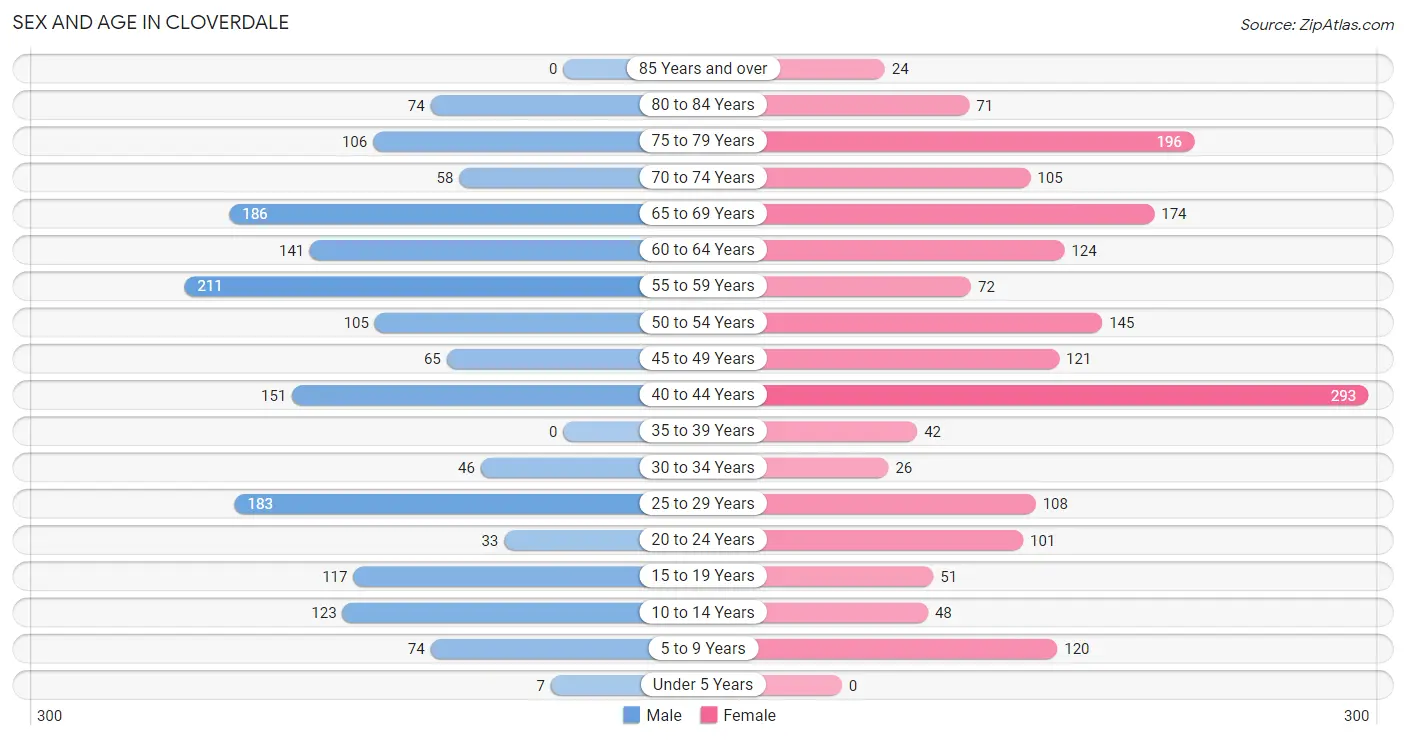
The most populous age groups in Cloverdale are 55 to 59 Years (211 | 12.6%) for men and 40 to 44 Years (293 | 16.1%) for women.
| Age Bracket | Male | Female |
| Under 5 Years | 7 (0.4%) | 0 (0.0%) |
| 5 to 9 Years | 74 (4.4%) | 120 (6.6%) |
| 10 to 14 Years | 123 (7.3%) | 48 (2.6%) |
| 15 to 19 Years | 117 (7.0%) | 51 (2.8%) |
| 20 to 24 Years | 33 (2.0%) | 101 (5.6%) |
| 25 to 29 Years | 183 (10.9%) | 108 (5.9%) |
| 30 to 34 Years | 46 (2.7%) | 26 (1.4%) |
| 35 to 39 Years | 0 (0.0%) | 42 (2.3%) |
| 40 to 44 Years | 151 (9.0%) | 293 (16.1%) |
| 45 to 49 Years | 65 (3.9%) | 121 (6.6%) |
| 50 to 54 Years | 105 (6.2%) | 145 (8.0%) |
| 55 to 59 Years | 211 (12.6%) | 72 (4.0%) |
| 60 to 64 Years | 141 (8.4%) | 124 (6.8%) |
| 65 to 69 Years | 186 (11.1%) | 174 (9.6%) |
| 70 to 74 Years | 58 (3.5%) | 105 (5.8%) |
| 75 to 79 Years | 106 (6.3%) | 196 (10.8%) |
| 80 to 84 Years | 74 (4.4%) | 71 (3.9%) |
| 85 Years and over | 0 (0.0%) | 24 (1.3%) |
| Total | 1,680 (100.0%) | 1,821 (100.0%) |
Families and Households in Cloverdale
Median Family Size in Cloverdale
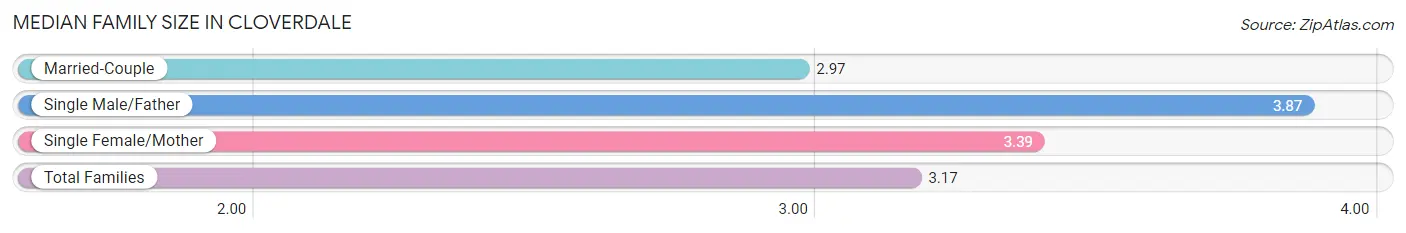
The median family size in Cloverdale is 3.17 persons per family, with single male/father families (141 | 15.6%) accounting for the largest median family size of 3.87 persons per family. On the other hand, married-couple families (631 | 70.0%) represent the smallest median family size with 2.97 persons per family.
| Family Type | # Families | Family Size |
| Married-Couple | 631 (70.0%) | 2.97 |
| Single Male/Father | 141 (15.6%) | 3.87 |
| Single Female/Mother | 130 (14.4%) | 3.39 |
| Total Families | 902 (100.0%) | 3.17 |
Median Household Size in Cloverdale
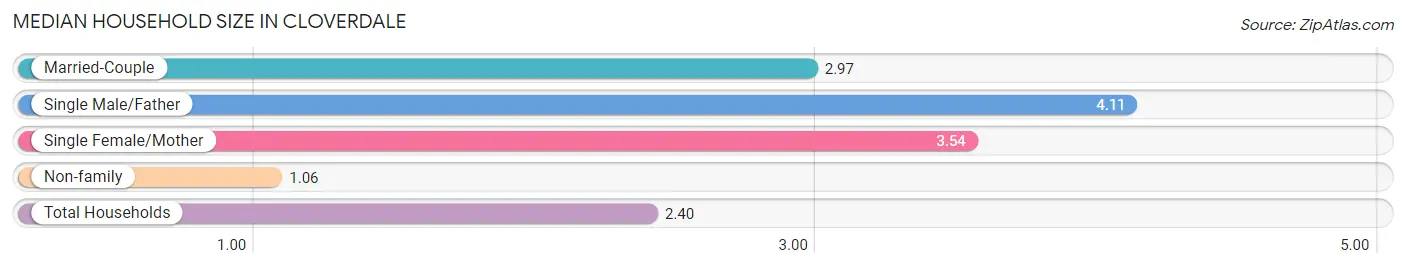
The median household size in Cloverdale is 2.40 persons per household, with single male/father households (141 | 9.7%) accounting for the largest median household size of 4.11 persons per household. non-family households (556 | 38.1%) represent the smallest median household size with 1.06 persons per household.
| Household Type | # Households | Household Size |
| Married-Couple | 631 (43.3%) | 2.97 |
| Single Male/Father | 141 (9.7%) | 4.11 |
| Single Female/Mother | 130 (8.9%) | 3.54 |
| Non-family | 556 (38.1%) | 1.06 |
| Total Households | 1,458 (100.0%) | 2.40 |
Household Size by Marriage Status in Cloverdale
Out of a total of 1,458 households in Cloverdale, 902 (61.9%) are family households, while 556 (38.1%) are nonfamily households. The most numerous type of family households are 2-person households, comprising 516, and the most common type of nonfamily households are 1-person households, comprising 532.
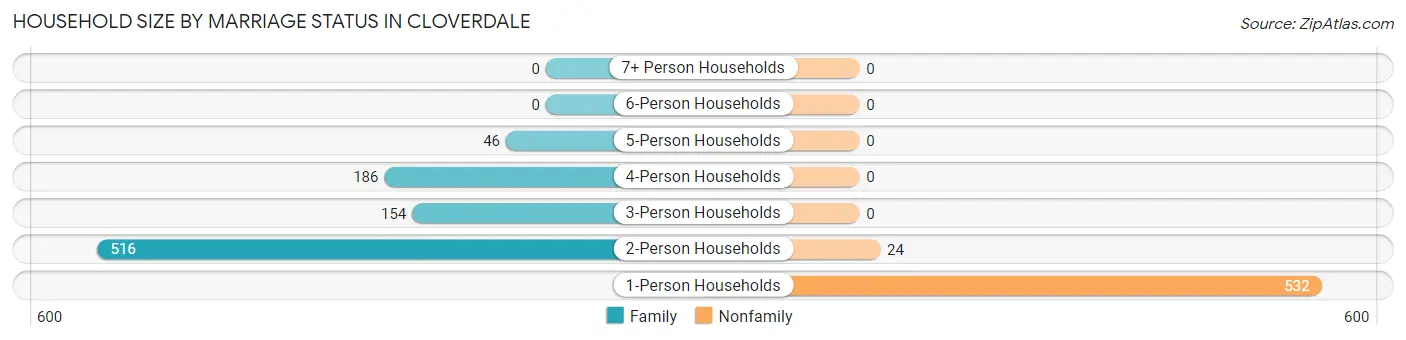
| Household Size | Family Households | Nonfamily Households |
| 1-Person Households | - | 532 (36.5%) |
| 2-Person Households | 516 (35.4%) | 24 (1.7%) |
| 3-Person Households | 154 (10.6%) | 0 (0.0%) |
| 4-Person Households | 186 (12.8%) | 0 (0.0%) |
| 5-Person Households | 46 (3.2%) | 0 (0.0%) |
| 6-Person Households | 0 (0.0%) | 0 (0.0%) |
| 7+ Person Households | 0 (0.0%) | 0 (0.0%) |
| Total | 902 (61.9%) | 556 (38.1%) |
Female Fertility in Cloverdale
Fertility by Age in Cloverdale
| Age Bracket | Women with Births | Births / 1,000 Women |
| 15 to 19 years | 0 (0.0%) | 0.0 |
| 20 to 34 years | 0 (0.0%) | 0.0 |
| 35 to 50 years | 0 (0.0%) | 0.0 |
| Total | 0 (0.0%) | 0.0 |
Fertility by Age by Marriage Status in Cloverdale
| Age Bracket | Married | Unmarried |
| 15 to 19 years | 0 (0.0%) | 0 (0.0%) |
| 20 to 34 years | 0 (0.0%) | 0 (0.0%) |
| 35 to 50 years | 0 (0.0%) | 0 (0.0%) |
| Total | 0 (0.0%) | 0 (0.0%) |
Fertility by Education in Cloverdale
| Educational Attainment | Women with Births | Births / 1,000 Women |
| Less than High School | 0 (0.0%) | 0.0 |
| High School Diploma | 0 (0.0%) | 0.0 |
| College or Associate's Degree | 0 (0.0%) | 0.0 |
| Bachelor's Degree | 0 (0.0%) | 0.0 |
| Graduate Degree | 0 (0.0%) | 0.0 |
| Total | 0 (0.0%) | 0.0 |
Fertility by Education by Marriage Status in Cloverdale
| Educational Attainment | Married | Unmarried |
| Less than High School | 0 (0.0%) | 0 (0.0%) |
| High School Diploma | 0 (0.0%) | 0 (0.0%) |
| College or Associate's Degree | 0 (0.0%) | 0 (0.0%) |
| Bachelor's Degree | 0 (0.0%) | 0 (0.0%) |
| Graduate Degree | 0 (0.0%) | 0 (0.0%) |
| Total | 0 (0.0%) | 0 (0.0%) |
Employment Characteristics in Cloverdale
Employment by Class of Employer in Cloverdale
Among the 1,601 employed individuals in Cloverdale, private company employees (1,196 | 74.7%), local government employees (149 | 9.3%), and self-employed (not incorporated) (74 | 4.6%) make up the most common classes of employment.
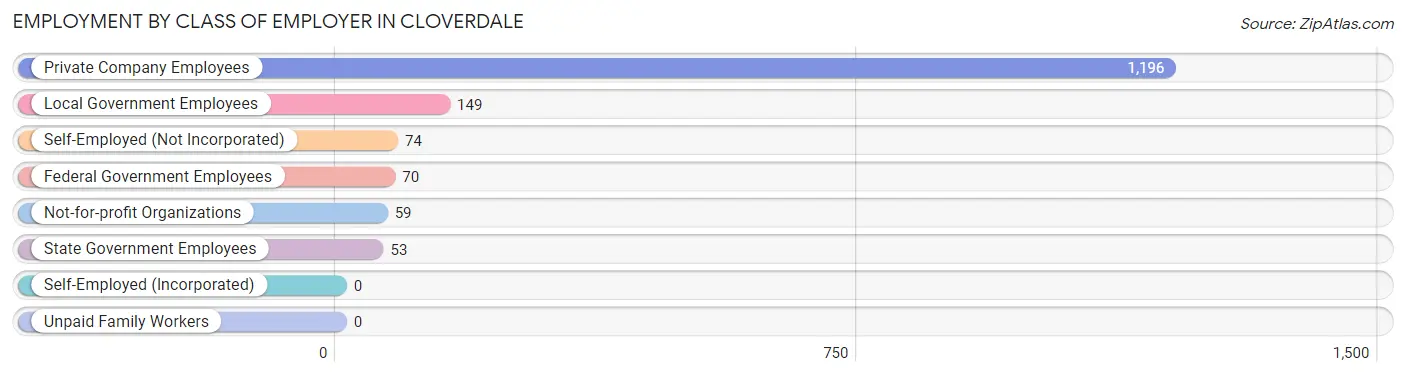
| Employer Class | # Employees | % Employees |
| Private Company Employees | 1,196 | 74.7% |
| Self-Employed (Incorporated) | 0 | 0.0% |
| Self-Employed (Not Incorporated) | 74 | 4.6% |
| Not-for-profit Organizations | 59 | 3.7% |
| Local Government Employees | 149 | 9.3% |
| State Government Employees | 53 | 3.3% |
| Federal Government Employees | 70 | 4.4% |
| Unpaid Family Workers | 0 | 0.0% |
| Total | 1,601 | 100.0% |
Employment Status by Age in Cloverdale
According to the labor force statistics for Cloverdale, out of the total population over 16 years of age (3,087), 60.2% or 1,858 individuals are in the labor force, with 5.1% or 95 of them unemployed. The age group with the highest labor force participation rate is 20 to 24 years, with 100.0% or 134 individuals in the labor force. Within the labor force, the 16 to 19 years age range has the highest percentage of unemployed individuals, with 100.0% or 25 of them being unemployed.
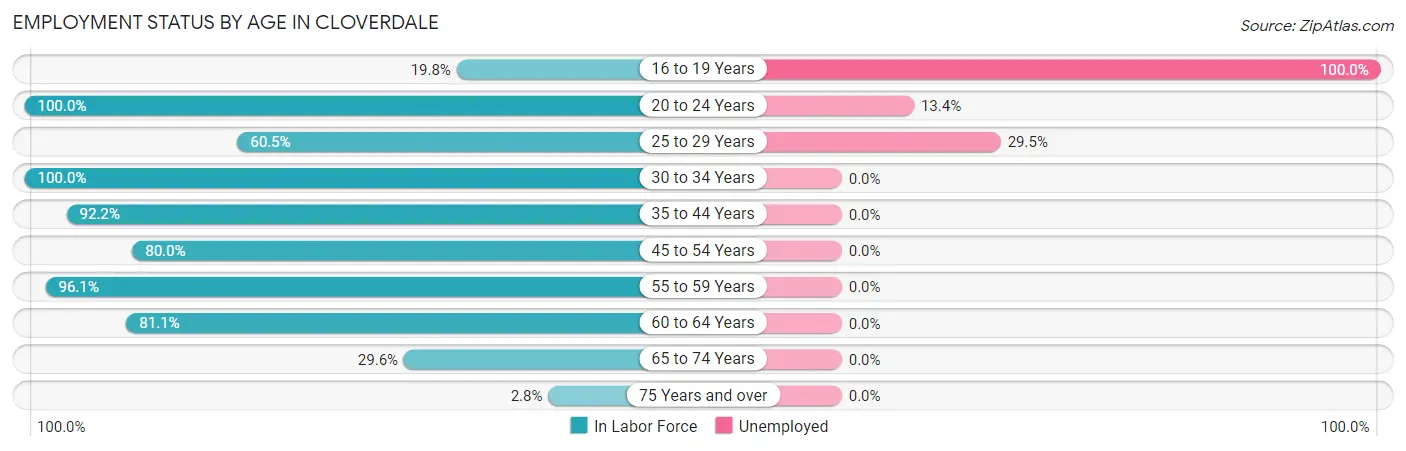
| Age Bracket | In Labor Force | Unemployed |
| 16 to 19 Years | 25 (19.8%) | 25 (100.0%) |
| 20 to 24 Years | 134 (100.0%) | 18 (13.4%) |
| 25 to 29 Years | 176 (60.5%) | 52 (29.5%) |
| 30 to 34 Years | 72 (100.0%) | 0 (0.0%) |
| 35 to 44 Years | 448 (92.2%) | 0 (0.0%) |
| 45 to 54 Years | 349 (80.0%) | 0 (0.0%) |
| 55 to 59 Years | 272 (96.1%) | 0 (0.0%) |
| 60 to 64 Years | 215 (81.1%) | 0 (0.0%) |
| 65 to 74 Years | 155 (29.6%) | 0 (0.0%) |
| 75 Years and over | 13 (2.8%) | 0 (0.0%) |
| Total | 1,858 (60.2%) | 95 (5.1%) |
Employment Status by Educational Attainment in Cloverdale
According to labor force statistics for Cloverdale, 83.6% of individuals (1,532) out of the total population between 25 and 64 years of age (1,833) are in the labor force, with 3.4% or 52 of them being unemployed. The group with the highest labor force participation rate are those with the educational attainment of college / associate degree, with 95.2% or 598 individuals in the labor force. Within the labor force, individuals with college / associate degree education have the highest percentage of unemployment, with 8.7% or 52 of them being unemployed.
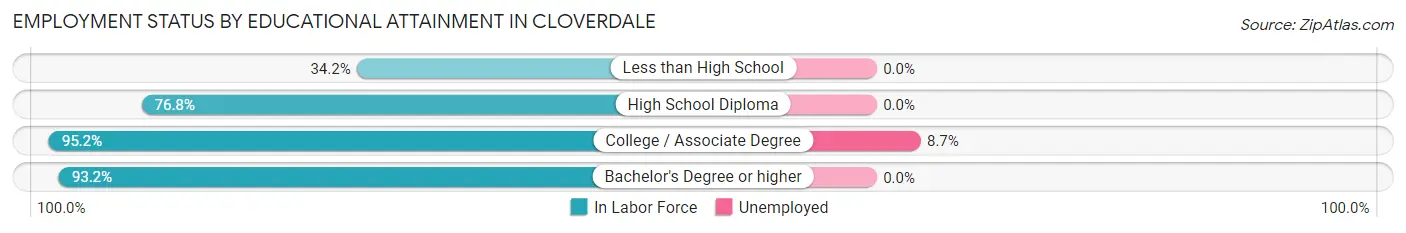
| Educational Attainment | In Labor Force | Unemployed |
| Less than High School | 53 (34.2%) | 0 (0.0%) |
| High School Diploma | 456 (76.8%) | 0 (0.0%) |
| College / Associate Degree | 598 (95.2%) | 55 (8.7%) |
| Bachelor's Degree or higher | 425 (93.2%) | 0 (0.0%) |
| Total | 1,532 (83.6%) | 62 (3.4%) |
Employment Occupations by Sex in Cloverdale
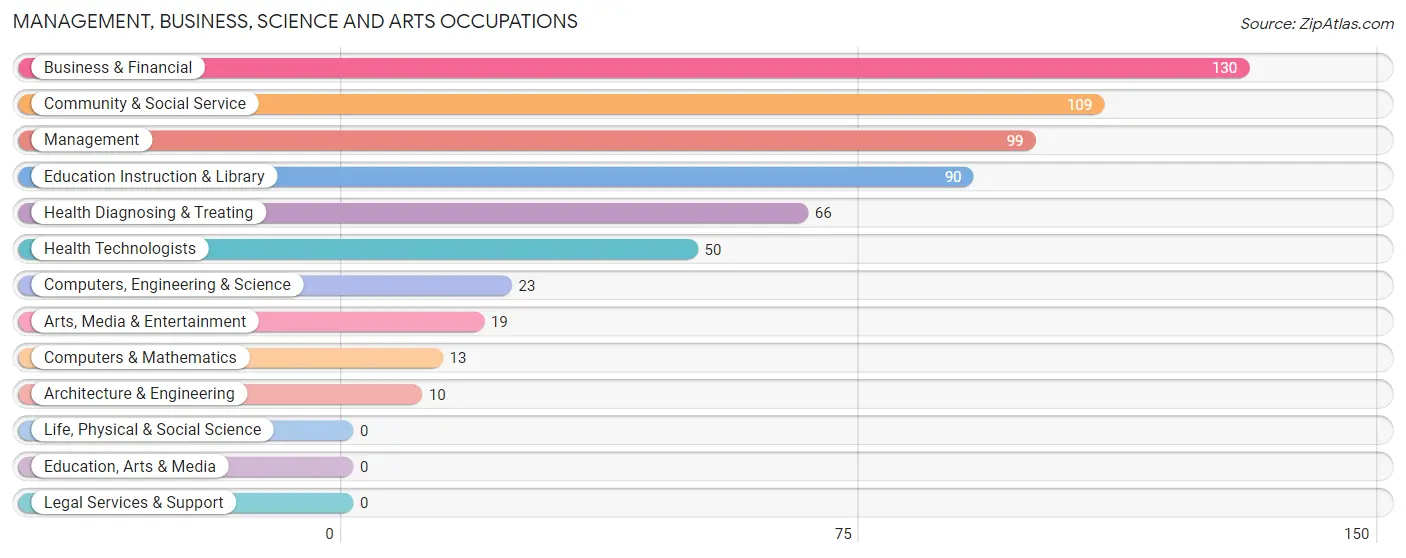
Management, Business, Science and Arts Occupations
The most common Management, Business, Science and Arts occupations in Cloverdale are Business & Financial (130 | 7.4%), Community & Social Service (109 | 6.2%), Management (99 | 5.7%), Education Instruction & Library (90 | 5.1%), and Health Diagnosing & Treating (66 | 3.8%).
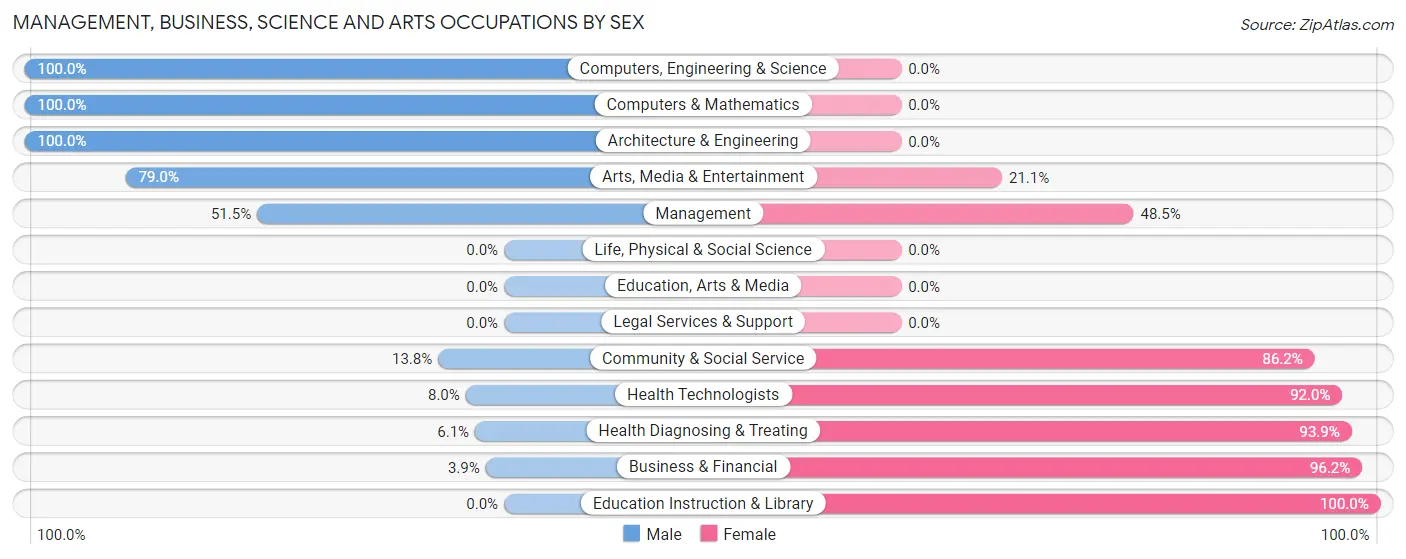
Management, Business, Science and Arts Occupations by Sex
Within the Management, Business, Science and Arts occupations in Cloverdale, the most male-oriented occupations are Computers, Engineering & Science (100.0%), Computers & Mathematics (100.0%), and Architecture & Engineering (100.0%), while the most female-oriented occupations are Education Instruction & Library (100.0%), Business & Financial (96.2%), and Health Diagnosing & Treating (93.9%).
| Occupation | Male | Female |
| Management | 51 (51.5%) | 48 (48.5%) |
| Business & Financial | 5 (3.8%) | 125 (96.2%) |
| Computers, Engineering & Science | 23 (100.0%) | 0 (0.0%) |
| Computers & Mathematics | 13 (100.0%) | 0 (0.0%) |
| Architecture & Engineering | 10 (100.0%) | 0 (0.0%) |
| Life, Physical & Social Science | 0 (0.0%) | 0 (0.0%) |
| Community & Social Service | 15 (13.8%) | 94 (86.2%) |
| Education, Arts & Media | 0 (0.0%) | 0 (0.0%) |
| Legal Services & Support | 0 (0.0%) | 0 (0.0%) |
| Education Instruction & Library | 0 (0.0%) | 90 (100.0%) |
| Arts, Media & Entertainment | 15 (78.9%) | 4 (21.0%) |
| Health Diagnosing & Treating | 4 (6.1%) | 62 (93.9%) |
| Health Technologists | 4 (8.0%) | 46 (92.0%) |
| Total (Category) | 98 (23.0%) | 329 (77.0%) |
| Total (Overall) | 892 (51.0%) | 858 (49.0%) |
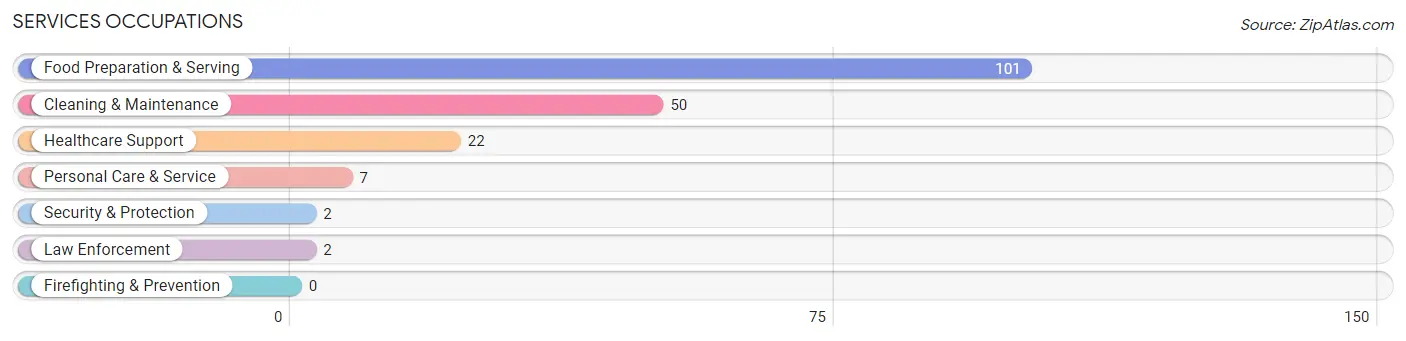
Services Occupations
The most common Services occupations in Cloverdale are Food Preparation & Serving (101 | 5.8%), Cleaning & Maintenance (50 | 2.9%), Healthcare Support (22 | 1.3%), Personal Care & Service (7 | 0.4%), and Security & Protection (2 | 0.1%).
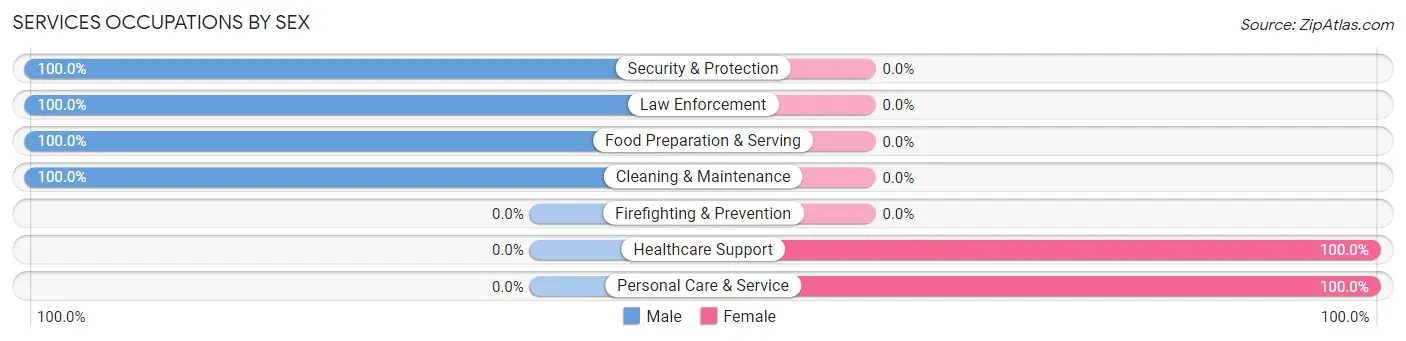
Services Occupations by Sex
Within the Services occupations in Cloverdale, the most male-oriented occupations are Security & Protection (100.0%), Law Enforcement (100.0%), and Food Preparation & Serving (100.0%), while the most female-oriented occupations are Healthcare Support (100.0%), and Personal Care & Service (100.0%).
| Occupation | Male | Female |
| Healthcare Support | 0 (0.0%) | 22 (100.0%) |
| Security & Protection | 2 (100.0%) | 0 (0.0%) |
| Firefighting & Prevention | 0 (0.0%) | 0 (0.0%) |
| Law Enforcement | 2 (100.0%) | 0 (0.0%) |
| Food Preparation & Serving | 101 (100.0%) | 0 (0.0%) |
| Cleaning & Maintenance | 50 (100.0%) | 0 (0.0%) |
| Personal Care & Service | 0 (0.0%) | 7 (100.0%) |
| Total (Category) | 153 (84.1%) | 29 (15.9%) |
| Total (Overall) | 892 (51.0%) | 858 (49.0%) |
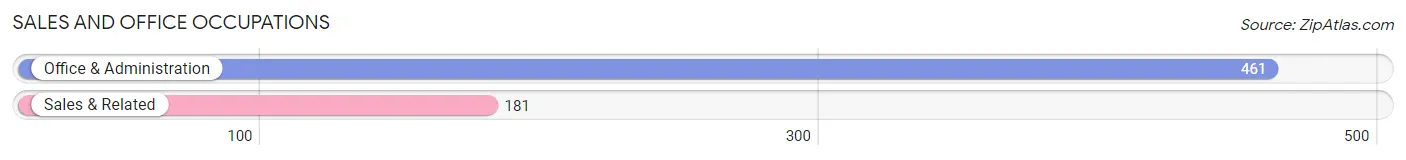
Sales and Office Occupations
The most common Sales and Office occupations in Cloverdale are Office & Administration (461 | 26.3%), and Sales & Related (181 | 10.3%).
Sales and Office Occupations by Sex
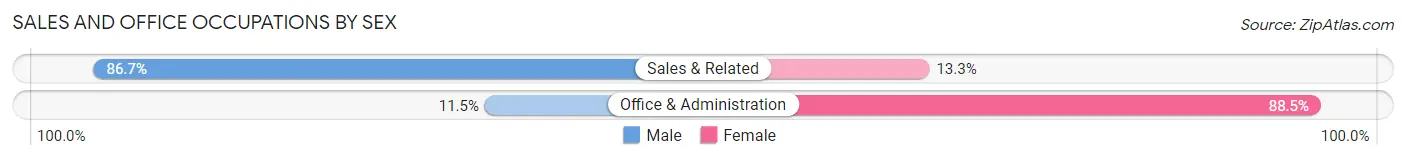
| Occupation | Male | Female |
| Sales & Related | 157 (86.7%) | 24 (13.3%) |
| Office & Administration | 53 (11.5%) | 408 (88.5%) |
| Total (Category) | 210 (32.7%) | 432 (67.3%) |
| Total (Overall) | 892 (51.0%) | 858 (49.0%) |
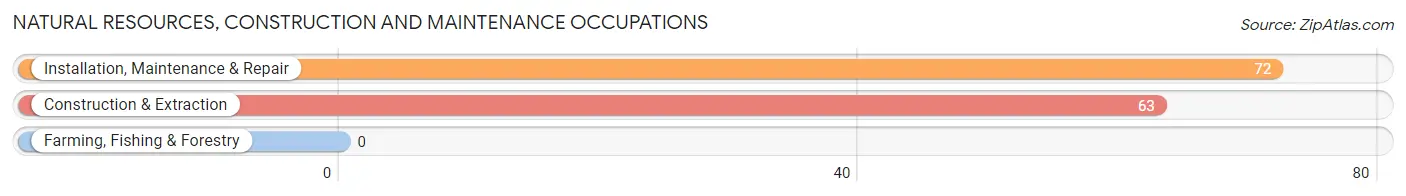
Natural Resources, Construction and Maintenance Occupations
The most common Natural Resources, Construction and Maintenance occupations in Cloverdale are Installation, Maintenance & Repair (72 | 4.1%), and Construction & Extraction (63 | 3.6%).
Natural Resources, Construction and Maintenance Occupations by Sex
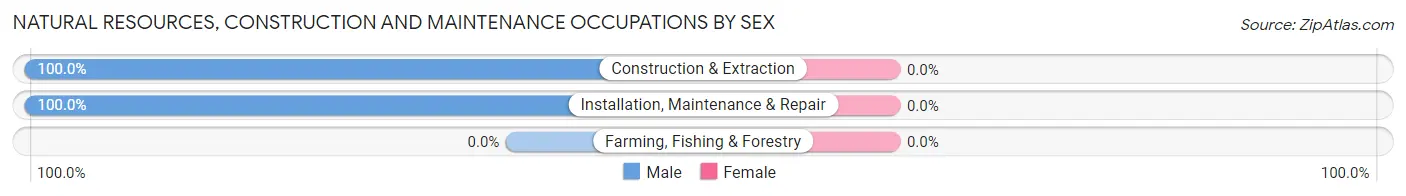
| Occupation | Male | Female |
| Farming, Fishing & Forestry | 0 (0.0%) | 0 (0.0%) |
| Construction & Extraction | 63 (100.0%) | 0 (0.0%) |
| Installation, Maintenance & Repair | 72 (100.0%) | 0 (0.0%) |
| Total (Category) | 135 (100.0%) | 0 (0.0%) |
| Total (Overall) | 892 (51.0%) | 858 (49.0%) |
Production, Transportation and Moving Occupations
The most common Production, Transportation and Moving occupations in Cloverdale are Transportation (264 | 15.1%), Production (53 | 3.0%), and Material Moving (47 | 2.7%).
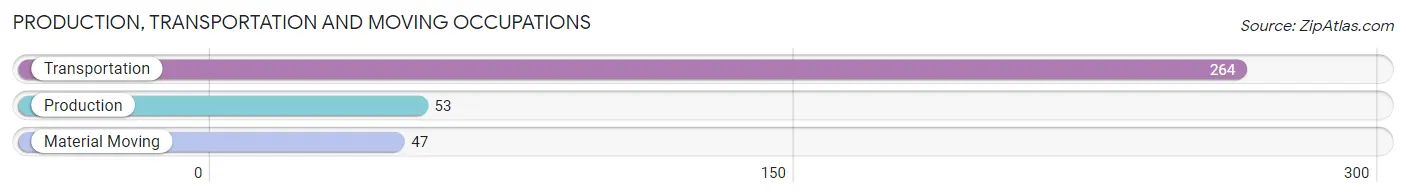
Production, Transportation and Moving Occupations by Sex
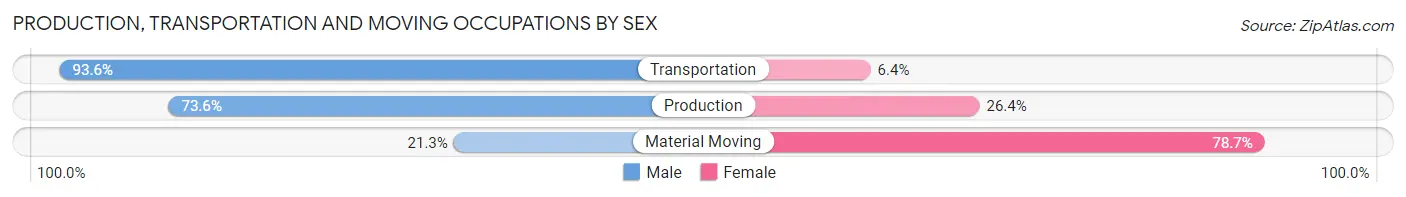
| Occupation | Male | Female |
| Production | 39 (73.6%) | 14 (26.4%) |
| Transportation | 247 (93.6%) | 17 (6.4%) |
| Material Moving | 10 (21.3%) | 37 (78.7%) |
| Total (Category) | 296 (81.3%) | 68 (18.7%) |
| Total (Overall) | 892 (51.0%) | 858 (49.0%) |
Employment Industries by Sex in Cloverdale
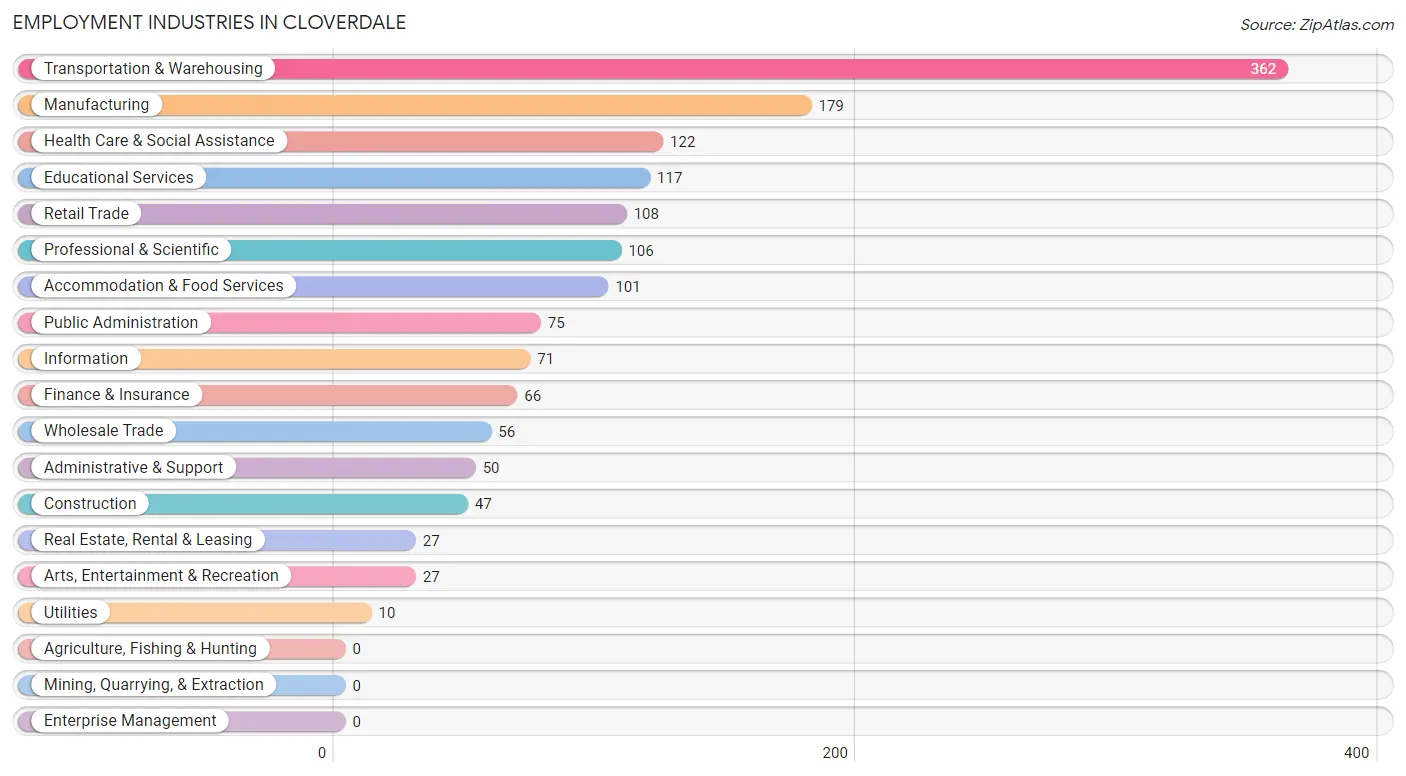
Employment Industries in Cloverdale
The major employment industries in Cloverdale include Transportation & Warehousing (362 | 20.7%), Manufacturing (179 | 10.2%), Health Care & Social Assistance (122 | 7.0%), Educational Services (117 | 6.7%), and Retail Trade (108 | 6.2%).
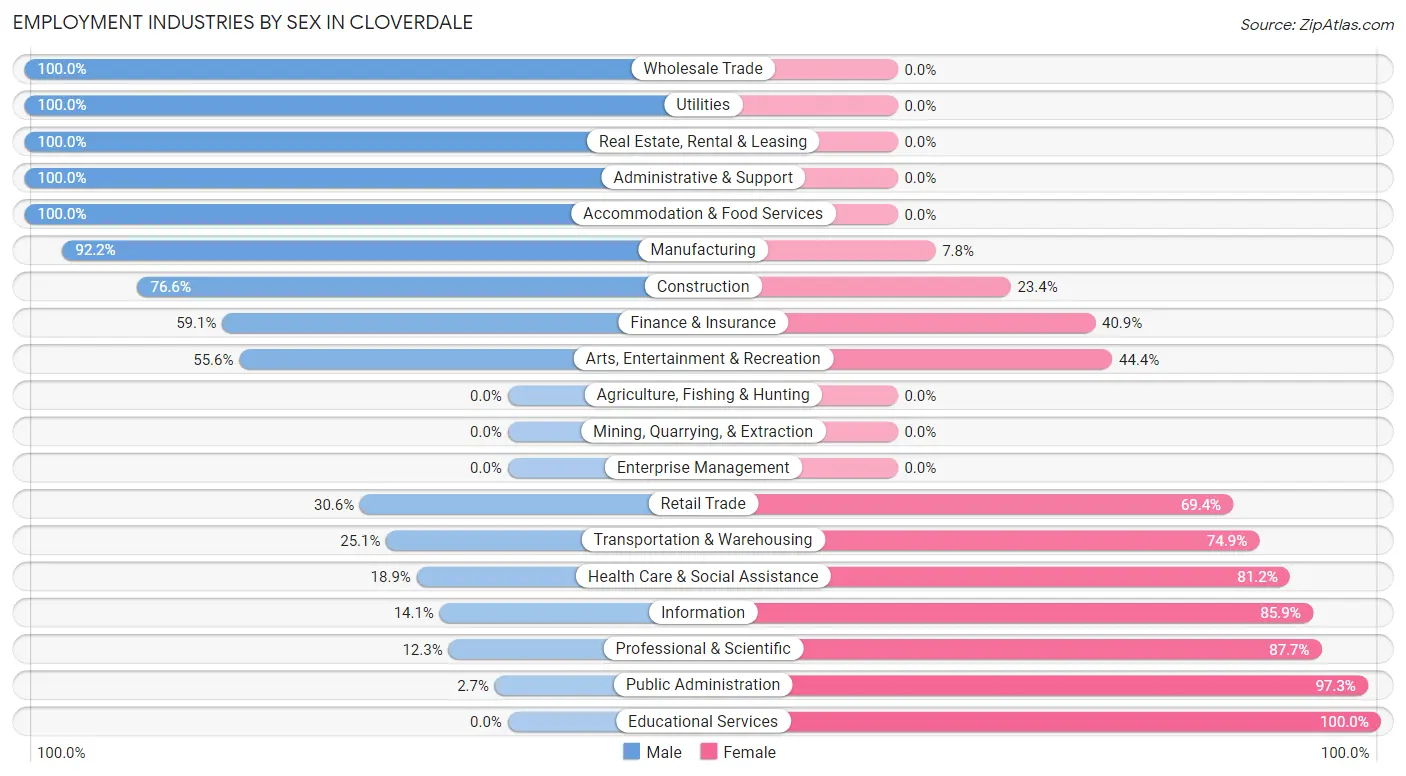
Employment Industries by Sex in Cloverdale
The Cloverdale industries that see more men than women are Wholesale Trade (100.0%), Utilities (100.0%), and Real Estate, Rental & Leasing (100.0%), whereas the industries that tend to have a higher number of women are Educational Services (100.0%), Public Administration (97.3%), and Professional & Scientific (87.7%).
| Industry | Male | Female |
| Agriculture, Fishing & Hunting | 0 (0.0%) | 0 (0.0%) |
| Mining, Quarrying, & Extraction | 0 (0.0%) | 0 (0.0%) |
| Construction | 36 (76.6%) | 11 (23.4%) |
| Manufacturing | 165 (92.2%) | 14 (7.8%) |
| Wholesale Trade | 56 (100.0%) | 0 (0.0%) |
| Retail Trade | 33 (30.6%) | 75 (69.4%) |
| Transportation & Warehousing | 91 (25.1%) | 271 (74.9%) |
| Utilities | 10 (100.0%) | 0 (0.0%) |
| Information | 10 (14.1%) | 61 (85.9%) |
| Finance & Insurance | 39 (59.1%) | 27 (40.9%) |
| Real Estate, Rental & Leasing | 27 (100.0%) | 0 (0.0%) |
| Professional & Scientific | 13 (12.3%) | 93 (87.7%) |
| Enterprise Management | 0 (0.0%) | 0 (0.0%) |
| Administrative & Support | 50 (100.0%) | 0 (0.0%) |
| Educational Services | 0 (0.0%) | 117 (100.0%) |
| Health Care & Social Assistance | 23 (18.9%) | 99 (81.1%) |
| Arts, Entertainment & Recreation | 15 (55.6%) | 12 (44.4%) |
| Accommodation & Food Services | 101 (100.0%) | 0 (0.0%) |
| Public Administration | 2 (2.7%) | 73 (97.3%) |
| Total | 892 (51.0%) | 858 (49.0%) |
Education in Cloverdale
School Enrollment in Cloverdale
The most common levels of schooling among the 564 students in Cloverdale are high school (193 | 34.2%), elementary school (143 | 25.4%), and middle school (114 | 20.2%).
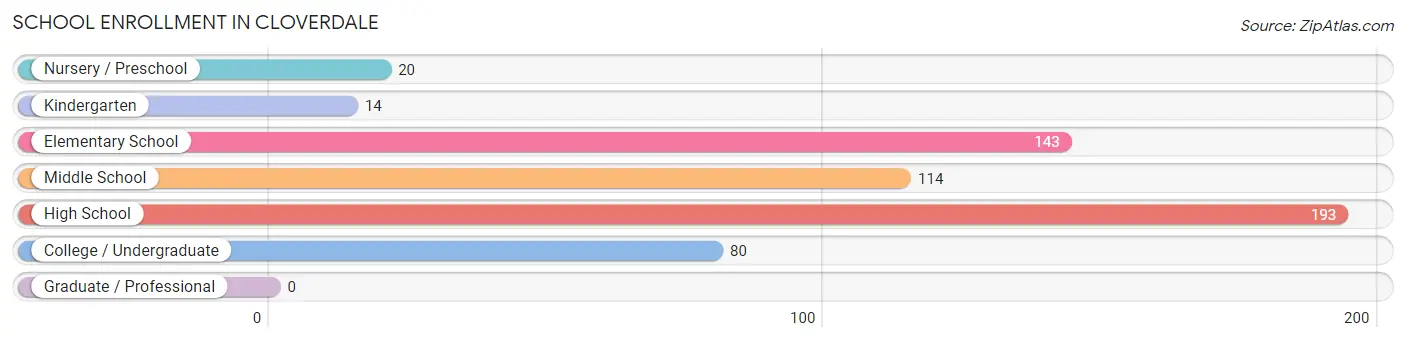
| School Level | # Students | % Students |
| Nursery / Preschool | 20 | 3.5% |
| Kindergarten | 14 | 2.5% |
| Elementary School | 143 | 25.4% |
| Middle School | 114 | 20.2% |
| High School | 193 | 34.2% |
| College / Undergraduate | 80 | 14.2% |
| Graduate / Professional | 0 | 0.0% |
| Total | 564 | 100.0% |
School Enrollment by Age by Funding Source in Cloverdale
Out of a total of 564 students who are enrolled in schools in Cloverdale, 37 (6.6%) attend a private institution, while the remaining 527 (93.4%) are enrolled in public schools. The age group of 5 to 9 year old has the highest likelihood of being enrolled in private schools, with 27 (15.9% in the age bracket) enrolled. Conversely, the age group of 18 to 19 year olds has the lowest likelihood of being enrolled in a private school, with 92 (100.0% in the age bracket) attending a public institution.
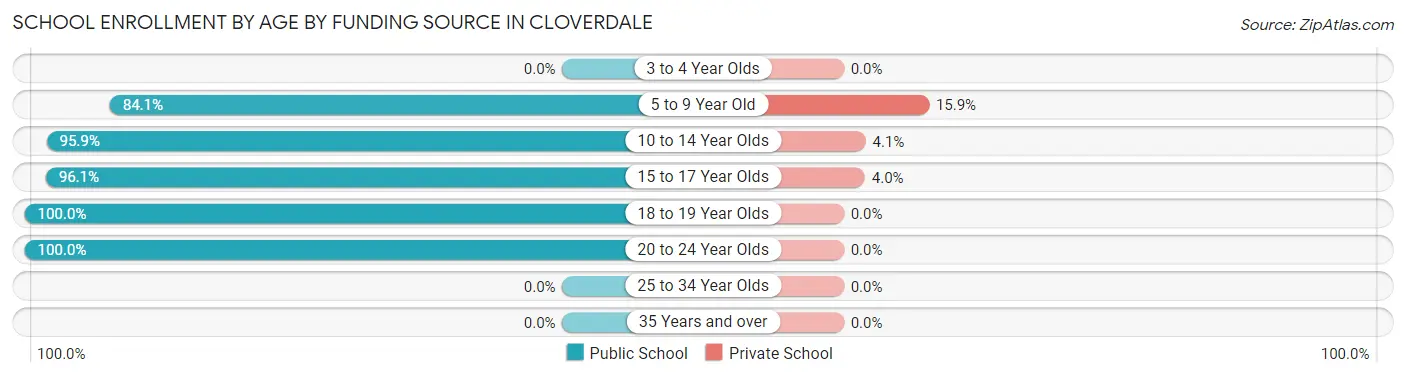
| Age Bracket | Public School | Private School |
| 3 to 4 Year Olds | 0 (0.0%) | 0 (0.0%) |
| 5 to 9 Year Old | 143 (84.1%) | 27 (15.9%) |
| 10 to 14 Year Olds | 164 (95.9%) | 7 (4.1%) |
| 15 to 17 Year Olds | 73 (96.1%) | 3 (4.0%) |
| 18 to 19 Year Olds | 92 (100.0%) | 0 (0.0%) |
| 20 to 24 Year Olds | 55 (100.0%) | 0 (0.0%) |
| 25 to 34 Year Olds | 0 (0.0%) | 0 (0.0%) |
| 35 Years and over | 0 (0.0%) | 0 (0.0%) |
| Total | 527 (93.4%) | 37 (6.6%) |
Educational Attainment by Field of Study in Cloverdale
Business (223 | 28.7%), education (94 | 12.1%), liberal arts & history (61 | 7.9%), psychology (54 | 7.0%), and science & technology (53 | 6.8%) are the most common fields of study among 776 individuals in Cloverdale who have obtained a bachelor's degree or higher.
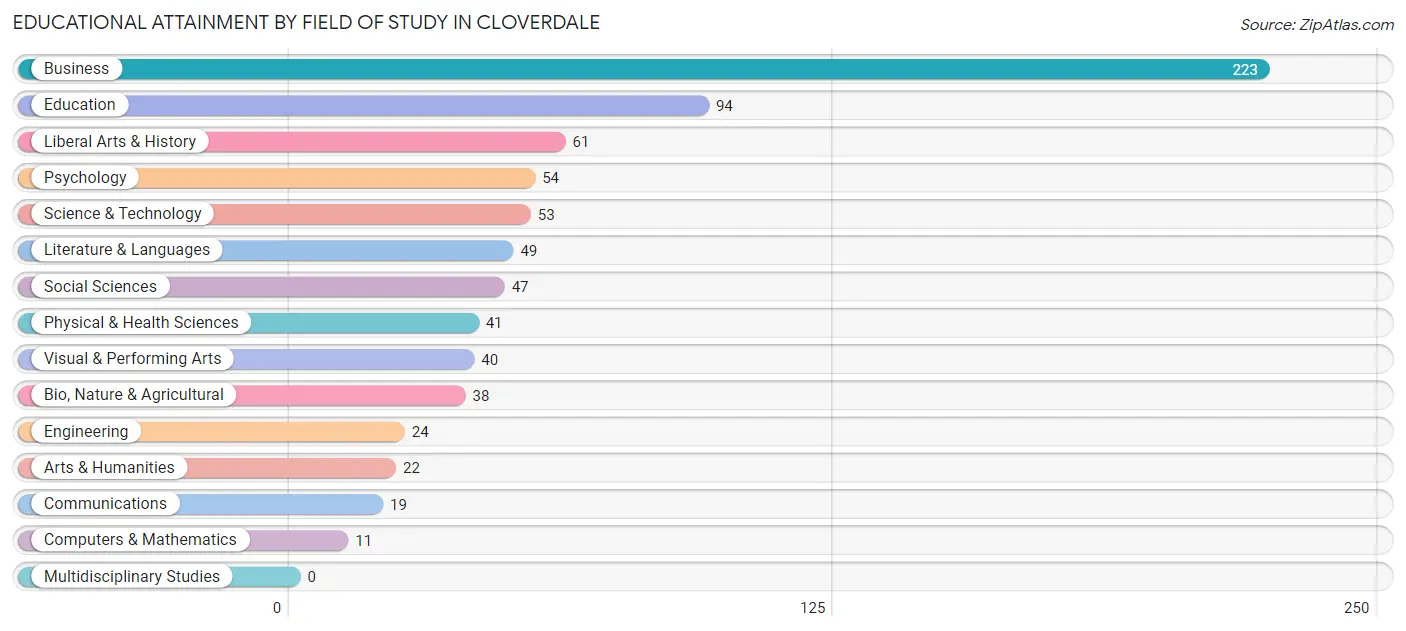
| Field of Study | # Graduates | % Graduates |
| Computers & Mathematics | 11 | 1.4% |
| Bio, Nature & Agricultural | 38 | 4.9% |
| Physical & Health Sciences | 41 | 5.3% |
| Psychology | 54 | 7.0% |
| Social Sciences | 47 | 6.1% |
| Engineering | 24 | 3.1% |
| Multidisciplinary Studies | 0 | 0.0% |
| Science & Technology | 53 | 6.8% |
| Business | 223 | 28.7% |
| Education | 94 | 12.1% |
| Literature & Languages | 49 | 6.3% |
| Liberal Arts & History | 61 | 7.9% |
| Visual & Performing Arts | 40 | 5.1% |
| Communications | 19 | 2.5% |
| Arts & Humanities | 22 | 2.8% |
| Total | 776 | 100.0% |
Transportation & Commute in Cloverdale
Vehicle Availability by Sex in Cloverdale
The most prevalent vehicle ownership categories in Cloverdale are males with 2 vehicles (416, accounting for 56.0%) and females with 2 vehicles (380, making up 48.5%).
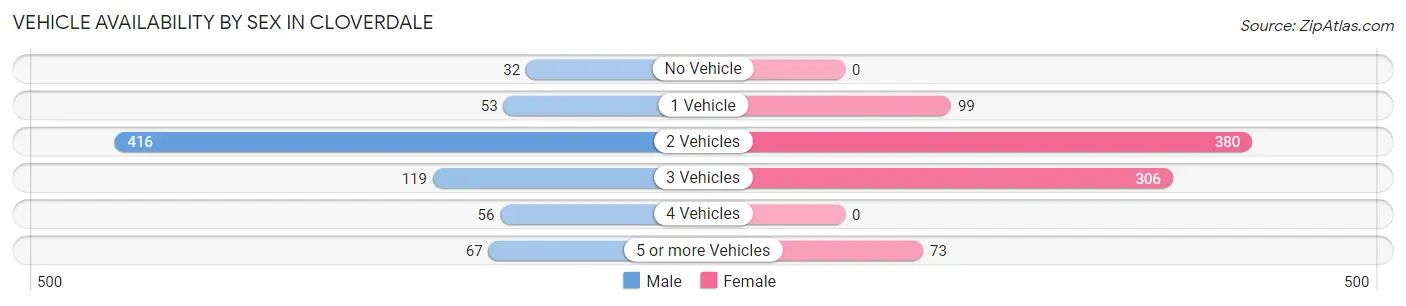
| Vehicles Available | Male | Female |
| No Vehicle | 32 (4.3%) | 0 (0.0%) |
| 1 Vehicle | 53 (7.1%) | 99 (11.5%) |
| 2 Vehicles | 416 (56.0%) | 380 (44.3%) |
| 3 Vehicles | 119 (16.0%) | 306 (35.7%) |
| 4 Vehicles | 56 (7.5%) | 0 (0.0%) |
| 5 or more Vehicles | 67 (9.0%) | 73 (8.5%) |
| Total | 743 (100.0%) | 858 (100.0%) |
Commute Time in Cloverdale
The most frequently occuring commute durations in Cloverdale are 15 to 19 minutes (384 commuters, 26.4%), 20 to 24 minutes (327 commuters, 22.5%), and 10 to 14 minutes (318 commuters, 21.9%).
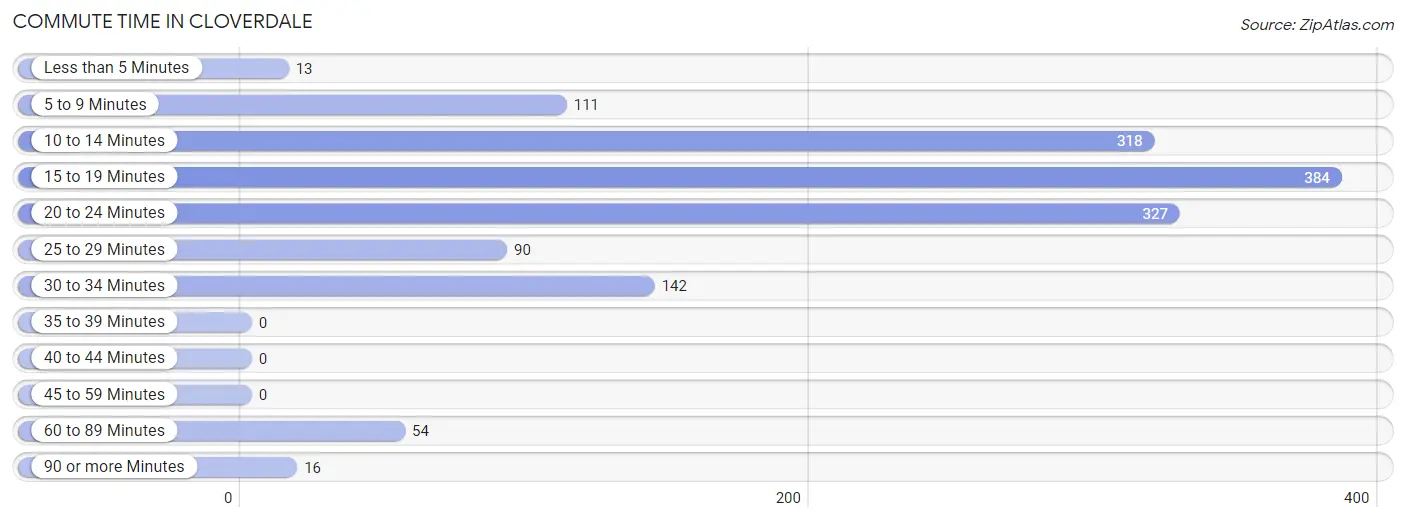
| Commute Time | # Commuters | % Commuters |
| Less than 5 Minutes | 13 | 0.9% |
| 5 to 9 Minutes | 111 | 7.6% |
| 10 to 14 Minutes | 318 | 21.9% |
| 15 to 19 Minutes | 384 | 26.4% |
| 20 to 24 Minutes | 327 | 22.5% |
| 25 to 29 Minutes | 90 | 6.2% |
| 30 to 34 Minutes | 142 | 9.8% |
| 35 to 39 Minutes | 0 | 0.0% |
| 40 to 44 Minutes | 0 | 0.0% |
| 45 to 59 Minutes | 0 | 0.0% |
| 60 to 89 Minutes | 54 | 3.7% |
| 90 or more Minutes | 16 | 1.1% |
Commute Time by Sex in Cloverdale
The most common commute times in Cloverdale are 15 to 19 minutes (268 commuters, 37.5%) for males and 10 to 14 minutes (234 commuters, 31.6%) for females.
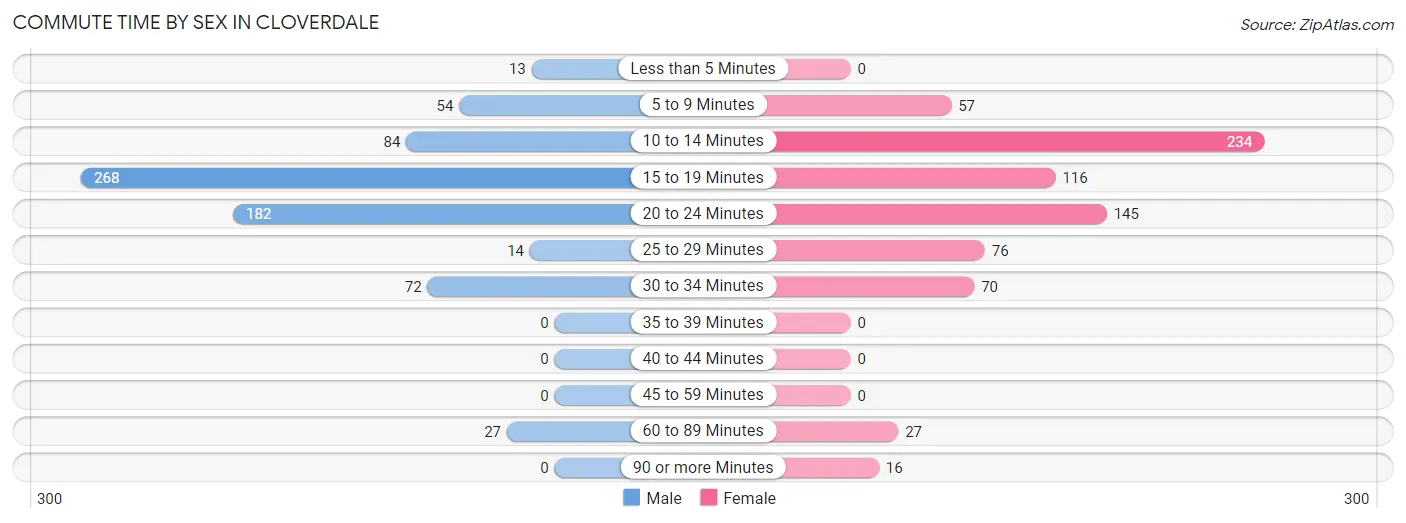
| Commute Time | Male | Female |
| Less than 5 Minutes | 13 (1.8%) | 0 (0.0%) |
| 5 to 9 Minutes | 54 (7.6%) | 57 (7.7%) |
| 10 to 14 Minutes | 84 (11.8%) | 234 (31.6%) |
| 15 to 19 Minutes | 268 (37.5%) | 116 (15.7%) |
| 20 to 24 Minutes | 182 (25.5%) | 145 (19.6%) |
| 25 to 29 Minutes | 14 (2.0%) | 76 (10.3%) |
| 30 to 34 Minutes | 72 (10.1%) | 70 (9.5%) |
| 35 to 39 Minutes | 0 (0.0%) | 0 (0.0%) |
| 40 to 44 Minutes | 0 (0.0%) | 0 (0.0%) |
| 45 to 59 Minutes | 0 (0.0%) | 0 (0.0%) |
| 60 to 89 Minutes | 27 (3.8%) | 27 (3.6%) |
| 90 or more Minutes | 0 (0.0%) | 16 (2.2%) |
Time of Departure to Work by Sex in Cloverdale
The most frequent times of departure to work in Cloverdale are 7:30 AM to 7:59 AM (187, 26.2%) for males and 8:30 AM to 8:59 AM (182, 24.6%) for females.
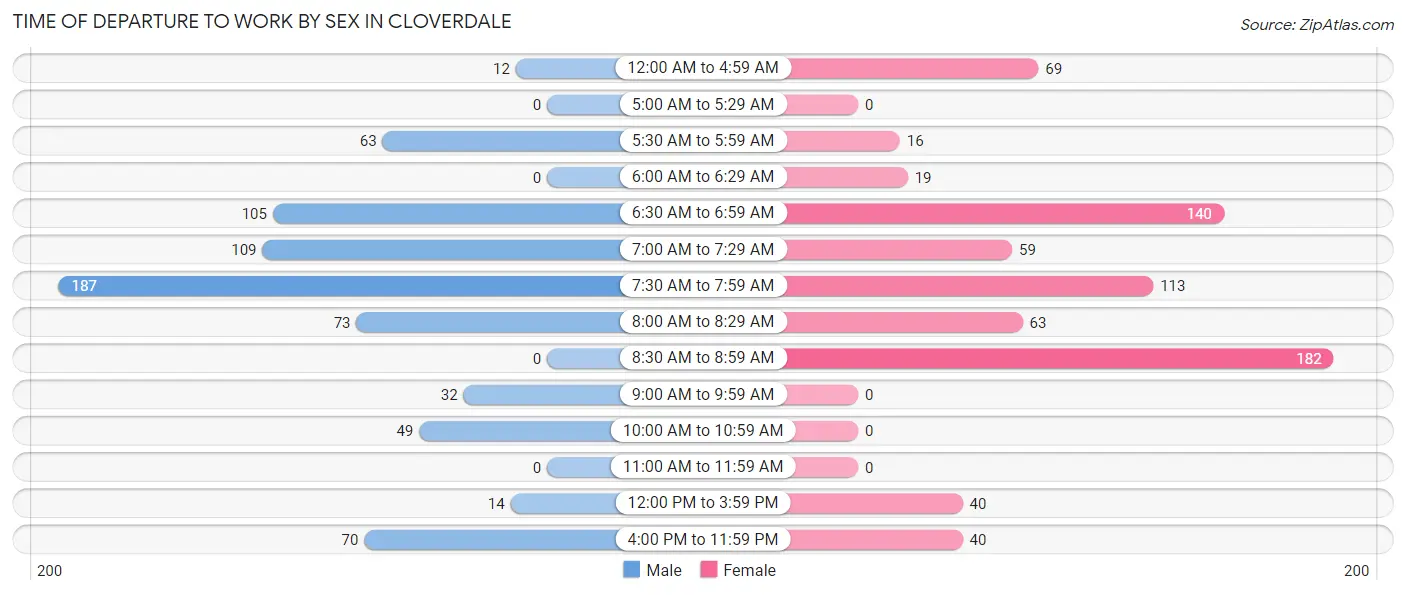
| Time of Departure | Male | Female |
| 12:00 AM to 4:59 AM | 12 (1.7%) | 69 (9.3%) |
| 5:00 AM to 5:29 AM | 0 (0.0%) | 0 (0.0%) |
| 5:30 AM to 5:59 AM | 63 (8.8%) | 16 (2.2%) |
| 6:00 AM to 6:29 AM | 0 (0.0%) | 19 (2.6%) |
| 6:30 AM to 6:59 AM | 105 (14.7%) | 140 (18.9%) |
| 7:00 AM to 7:29 AM | 109 (15.3%) | 59 (8.0%) |
| 7:30 AM to 7:59 AM | 187 (26.2%) | 113 (15.2%) |
| 8:00 AM to 8:29 AM | 73 (10.2%) | 63 (8.5%) |
| 8:30 AM to 8:59 AM | 0 (0.0%) | 182 (24.6%) |
| 9:00 AM to 9:59 AM | 32 (4.5%) | 0 (0.0%) |
| 10:00 AM to 10:59 AM | 49 (6.9%) | 0 (0.0%) |
| 11:00 AM to 11:59 AM | 0 (0.0%) | 0 (0.0%) |
| 12:00 PM to 3:59 PM | 14 (2.0%) | 40 (5.4%) |
| 4:00 PM to 11:59 PM | 70 (9.8%) | 40 (5.4%) |
| Total | 714 (100.0%) | 741 (100.0%) |
Housing Occupancy in Cloverdale
Occupancy by Ownership in Cloverdale
Of the total 1,458 dwellings in Cloverdale, owner-occupied units account for 1,013 (69.5%), while renter-occupied units make up 445 (30.5%).
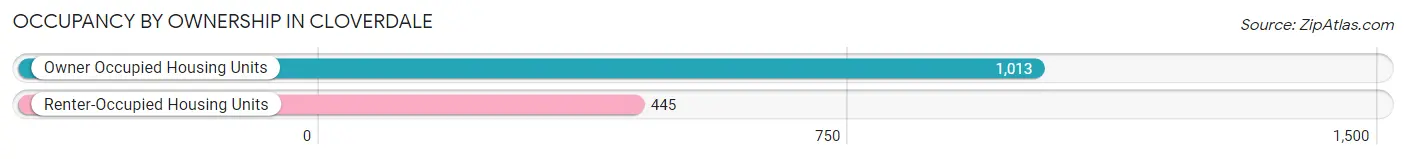
| Occupancy | # Housing Units | % Housing Units |
| Owner Occupied Housing Units | 1,013 | 69.5% |
| Renter-Occupied Housing Units | 445 | 30.5% |
| Total Occupied Housing Units | 1,458 | 100.0% |
Occupancy by Household Size in Cloverdale
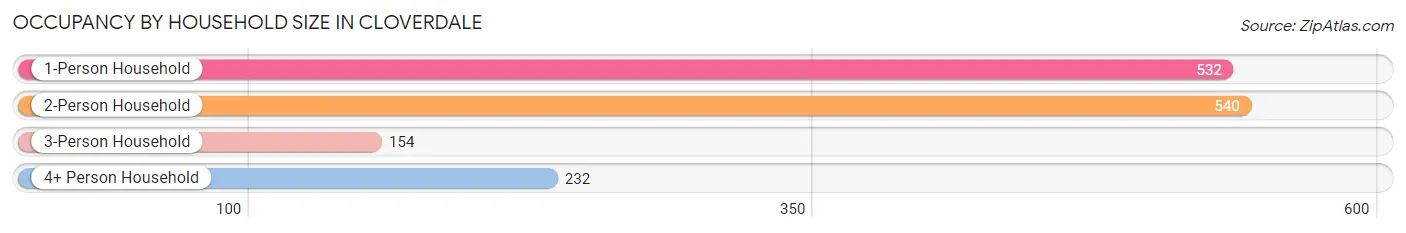
| Household Size | # Housing Units | % Housing Units |
| 1-Person Household | 532 | 36.5% |
| 2-Person Household | 540 | 37.0% |
| 3-Person Household | 154 | 10.6% |
| 4+ Person Household | 232 | 15.9% |
| Total Housing Units | 1,458 | 100.0% |
Occupancy by Ownership by Household Size in Cloverdale
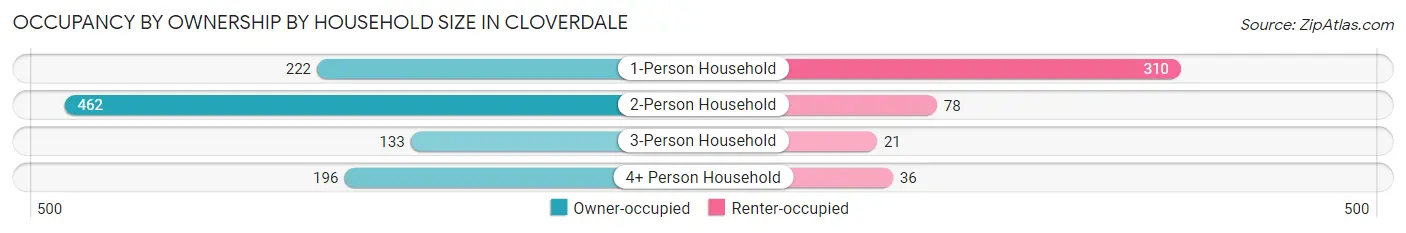
| Household Size | Owner-occupied | Renter-occupied |
| 1-Person Household | 222 (41.7%) | 310 (58.3%) |
| 2-Person Household | 462 (85.6%) | 78 (14.4%) |
| 3-Person Household | 133 (86.4%) | 21 (13.6%) |
| 4+ Person Household | 196 (84.5%) | 36 (15.5%) |
| Total Housing Units | 1,013 (69.5%) | 445 (30.5%) |
Occupancy by Educational Attainment in Cloverdale
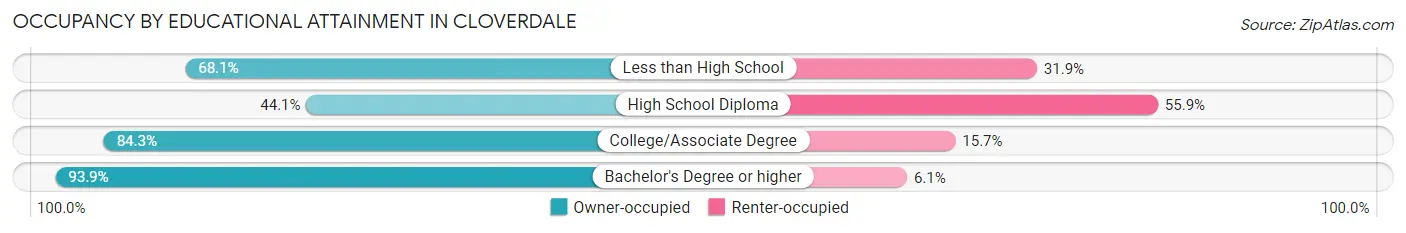
| Household Size | Owner-occupied | Renter-occupied |
| Less than High School | 124 (68.1%) | 58 (31.9%) |
| High School Diploma | 245 (44.1%) | 310 (55.9%) |
| College/Associate Degree | 290 (84.3%) | 54 (15.7%) |
| Bachelor's Degree or higher | 354 (93.9%) | 23 (6.1%) |
Occupancy by Age of Householder in Cloverdale
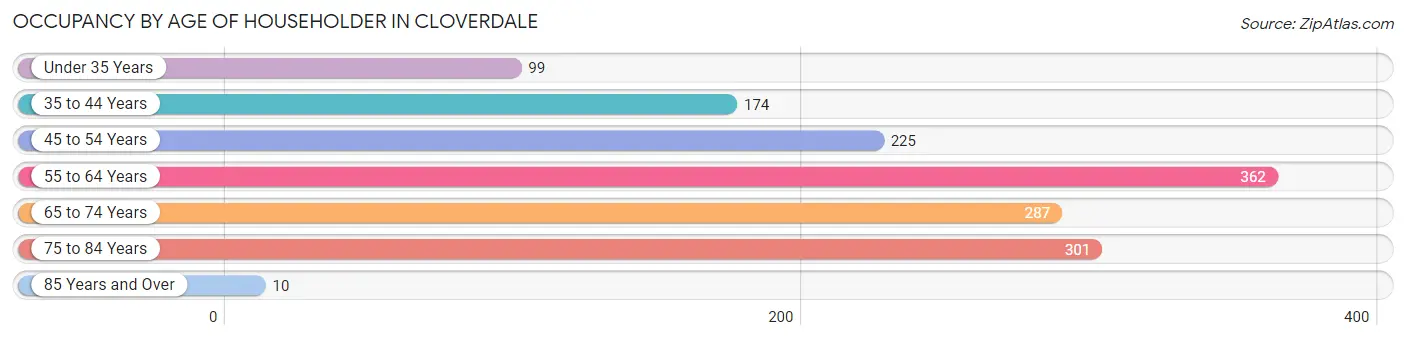
| Age Bracket | # Households | % Households |
| Under 35 Years | 99 | 6.8% |
| 35 to 44 Years | 174 | 11.9% |
| 45 to 54 Years | 225 | 15.4% |
| 55 to 64 Years | 362 | 24.8% |
| 65 to 74 Years | 287 | 19.7% |
| 75 to 84 Years | 301 | 20.6% |
| 85 Years and Over | 10 | 0.7% |
| Total | 1,458 | 100.0% |
Housing Finances in Cloverdale
Median Income by Occupancy in Cloverdale
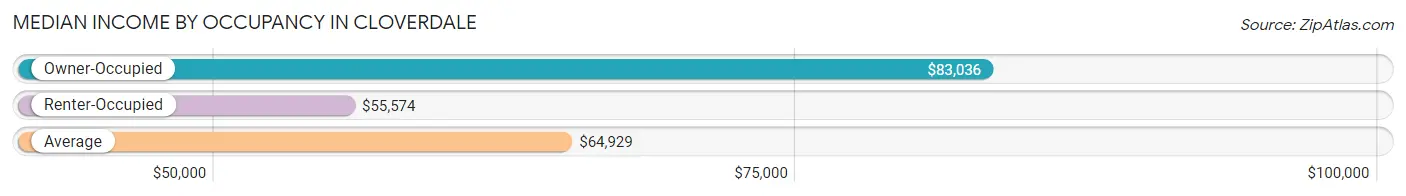
| Occupancy Type | # Households | Median Income |
| Owner-Occupied | 1,013 (69.5%) | $83,036 |
| Renter-Occupied | 445 (30.5%) | $55,574 |
| Average | 1,458 (100.0%) | $64,929 |
Occupancy by Householder Income Bracket in Cloverdale
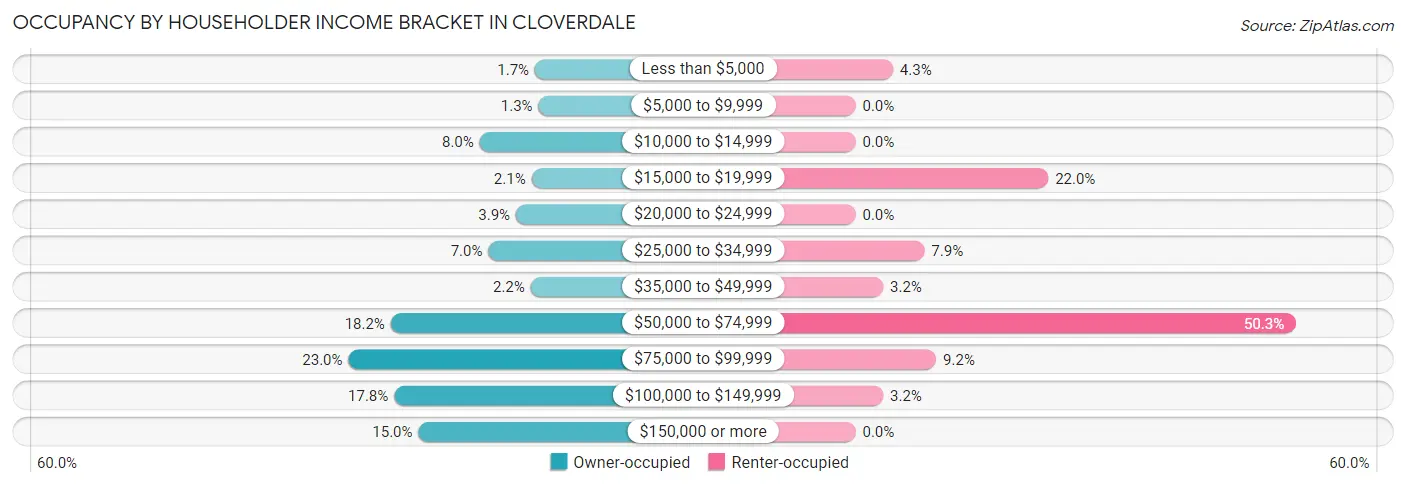
| Income Bracket | Owner-occupied | Renter-occupied |
| Less than $5,000 | 17 (1.7%) | 19 (4.3%) |
| $5,000 to $9,999 | 13 (1.3%) | 0 (0.0%) |
| $10,000 to $14,999 | 81 (8.0%) | 0 (0.0%) |
| $15,000 to $19,999 | 21 (2.1%) | 98 (22.0%) |
| $20,000 to $24,999 | 39 (3.8%) | 0 (0.0%) |
| $25,000 to $34,999 | 71 (7.0%) | 35 (7.9%) |
| $35,000 to $49,999 | 22 (2.2%) | 14 (3.2%) |
| $50,000 to $74,999 | 184 (18.2%) | 224 (50.3%) |
| $75,000 to $99,999 | 233 (23.0%) | 41 (9.2%) |
| $100,000 to $149,999 | 180 (17.8%) | 14 (3.2%) |
| $150,000 or more | 152 (15.0%) | 0 (0.0%) |
| Total | 1,013 (100.0%) | 445 (100.0%) |
Monthly Housing Cost Tiers in Cloverdale
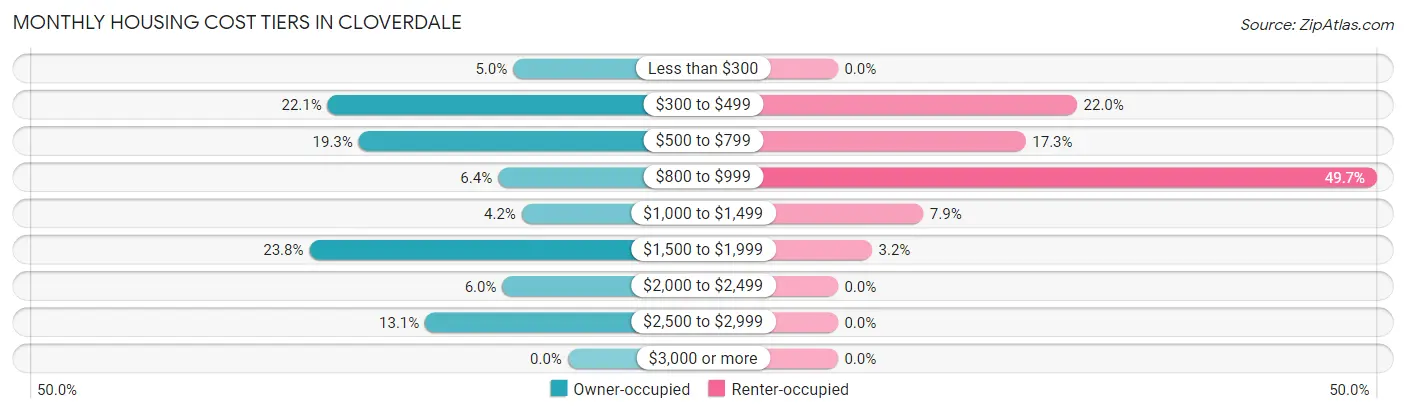
| Monthly Cost | Owner-occupied | Renter-occupied |
| Less than $300 | 51 (5.0%) | 0 (0.0%) |
| $300 to $499 | 224 (22.1%) | 98 (22.0%) |
| $500 to $799 | 195 (19.3%) | 77 (17.3%) |
| $800 to $999 | 65 (6.4%) | 221 (49.7%) |
| $1,000 to $1,499 | 43 (4.2%) | 35 (7.9%) |
| $1,500 to $1,999 | 241 (23.8%) | 14 (3.2%) |
| $2,000 to $2,499 | 61 (6.0%) | 0 (0.0%) |
| $2,500 to $2,999 | 133 (13.1%) | 0 (0.0%) |
| $3,000 or more | 0 (0.0%) | 0 (0.0%) |
| Total | 1,013 (100.0%) | 445 (100.0%) |
Physical Housing Characteristics in Cloverdale
Housing Structures in Cloverdale
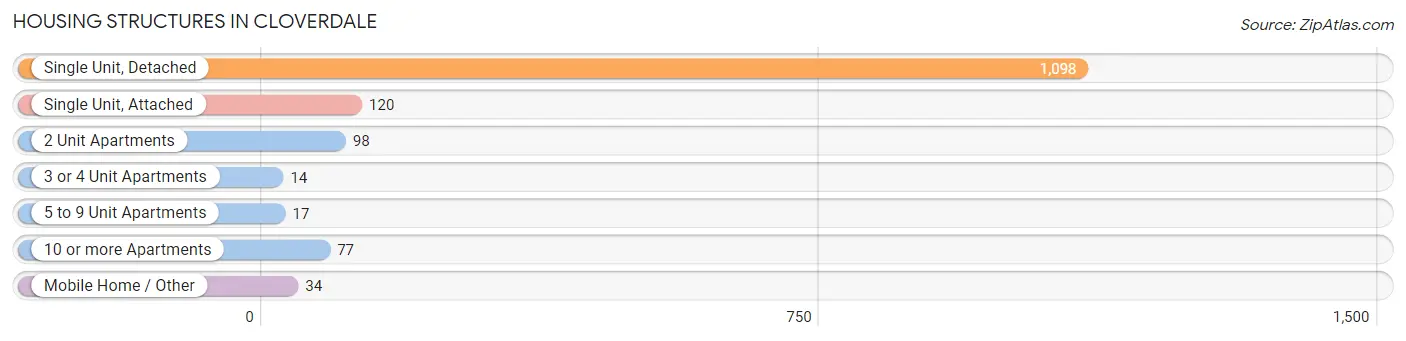
| Structure Type | # Housing Units | % Housing Units |
| Single Unit, Detached | 1,098 | 75.3% |
| Single Unit, Attached | 120 | 8.2% |
| 2 Unit Apartments | 98 | 6.7% |
| 3 or 4 Unit Apartments | 14 | 1.0% |
| 5 to 9 Unit Apartments | 17 | 1.2% |
| 10 or more Apartments | 77 | 5.3% |
| Mobile Home / Other | 34 | 2.3% |
| Total | 1,458 | 100.0% |
Housing Structures by Occupancy in Cloverdale
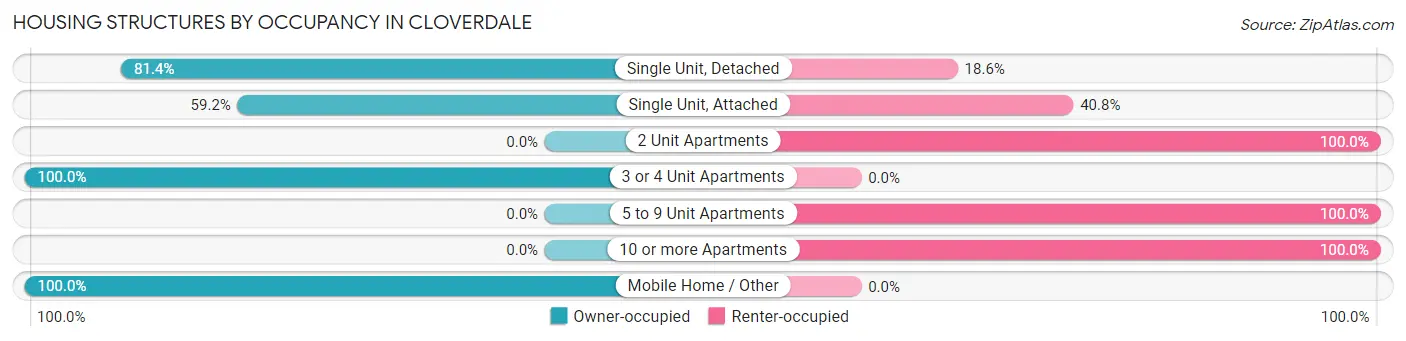
| Structure Type | Owner-occupied | Renter-occupied |
| Single Unit, Detached | 894 (81.4%) | 204 (18.6%) |
| Single Unit, Attached | 71 (59.2%) | 49 (40.8%) |
| 2 Unit Apartments | 0 (0.0%) | 98 (100.0%) |
| 3 or 4 Unit Apartments | 14 (100.0%) | 0 (0.0%) |
| 5 to 9 Unit Apartments | 0 (0.0%) | 17 (100.0%) |
| 10 or more Apartments | 0 (0.0%) | 77 (100.0%) |
| Mobile Home / Other | 34 (100.0%) | 0 (0.0%) |
| Total | 1,013 (69.5%) | 445 (30.5%) |
Housing Structures by Number of Rooms in Cloverdale
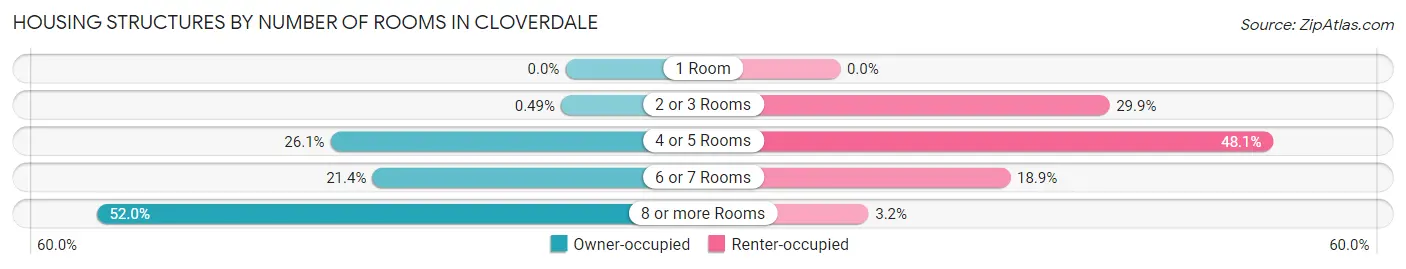
| Number of Rooms | Owner-occupied | Renter-occupied |
| 1 Room | 0 (0.0%) | 0 (0.0%) |
| 2 or 3 Rooms | 5 (0.5%) | 133 (29.9%) |
| 4 or 5 Rooms | 264 (26.1%) | 214 (48.1%) |
| 6 or 7 Rooms | 217 (21.4%) | 84 (18.9%) |
| 8 or more Rooms | 527 (52.0%) | 14 (3.2%) |
| Total | 1,013 (100.0%) | 445 (100.0%) |
Housing Structure by Heating Type in Cloverdale
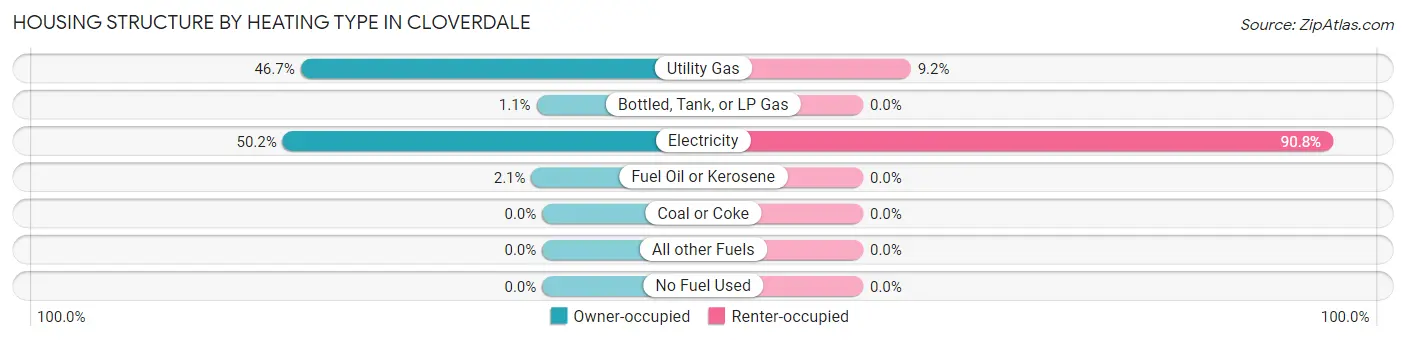
| Heating Type | Owner-occupied | Renter-occupied |
| Utility Gas | 473 (46.7%) | 41 (9.2%) |
| Bottled, Tank, or LP Gas | 11 (1.1%) | 0 (0.0%) |
| Electricity | 508 (50.1%) | 404 (90.8%) |
| Fuel Oil or Kerosene | 21 (2.1%) | 0 (0.0%) |
| Coal or Coke | 0 (0.0%) | 0 (0.0%) |
| All other Fuels | 0 (0.0%) | 0 (0.0%) |
| No Fuel Used | 0 (0.0%) | 0 (0.0%) |
| Total | 1,013 (100.0%) | 445 (100.0%) |
Household Vehicle Usage in Cloverdale
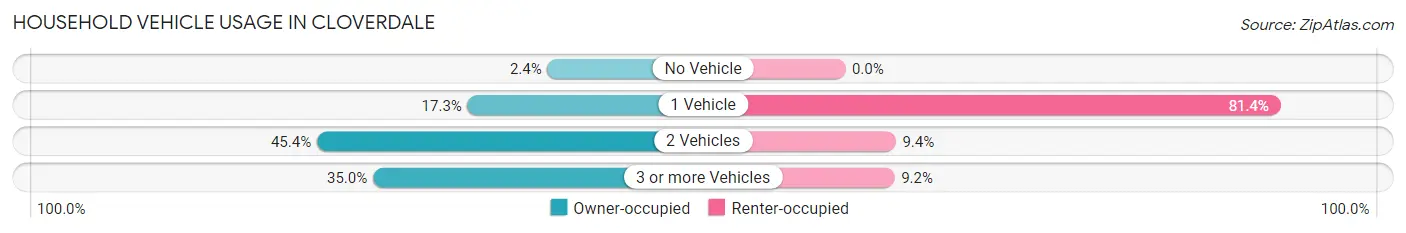
| Vehicles per Household | Owner-occupied | Renter-occupied |
| No Vehicle | 24 (2.4%) | 0 (0.0%) |
| 1 Vehicle | 175 (17.3%) | 362 (81.4%) |
| 2 Vehicles | 460 (45.4%) | 42 (9.4%) |
| 3 or more Vehicles | 354 (34.9%) | 41 (9.2%) |
| Total | 1,013 (100.0%) | 445 (100.0%) |
Real Estate & Mortgages in Cloverdale
Real Estate and Mortgage Overview in Cloverdale
| Characteristic | Without Mortgage | With Mortgage |
| Housing Units | 457 | 556 |
| Median Property Value | $303,200 | $340,000 |
| Median Household Income | $73,059 | $100 |
| Monthly Housing Costs | $473 | $0 |
| Real Estate Taxes | $1,838 | $0 |
Property Value by Mortgage Status in Cloverdale
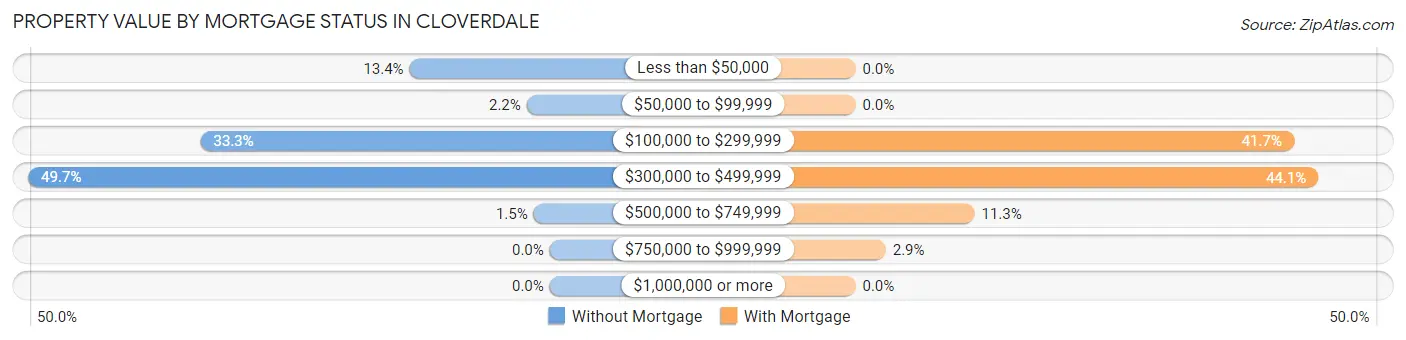
| Property Value | Without Mortgage | With Mortgage |
| Less than $50,000 | 61 (13.4%) | 0 (0.0%) |
| $50,000 to $99,999 | 10 (2.2%) | 0 (0.0%) |
| $100,000 to $299,999 | 152 (33.3%) | 232 (41.7%) |
| $300,000 to $499,999 | 227 (49.7%) | 245 (44.1%) |
| $500,000 to $749,999 | 7 (1.5%) | 63 (11.3%) |
| $750,000 to $999,999 | 0 (0.0%) | 16 (2.9%) |
| $1,000,000 or more | 0 (0.0%) | 0 (0.0%) |
| Total | 457 (100.0%) | 556 (100.0%) |
Household Income by Mortgage Status in Cloverdale
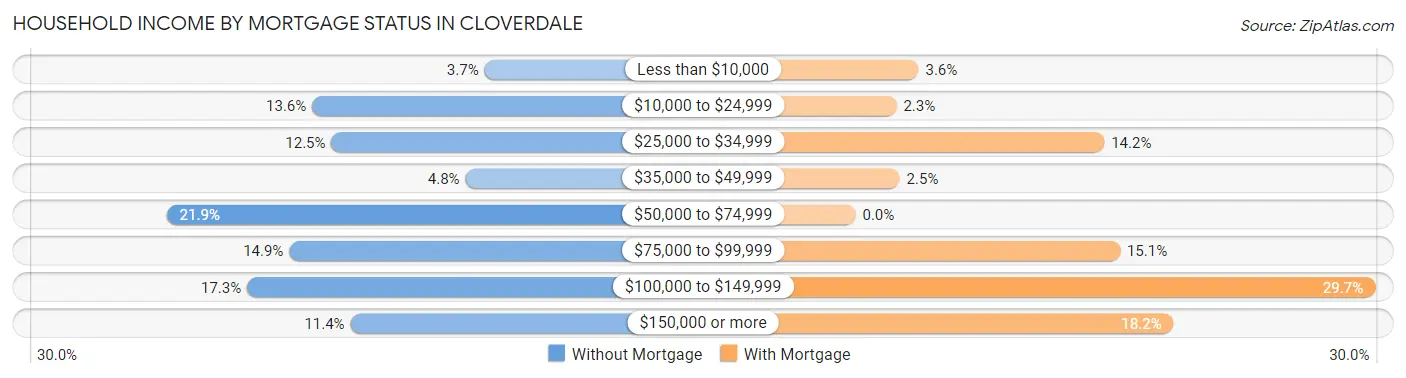
| Household Income | Without Mortgage | With Mortgage |
| Less than $10,000 | 17 (3.7%) | 20 (3.6%) |
| $10,000 to $24,999 | 62 (13.6%) | 13 (2.3%) |
| $25,000 to $34,999 | 57 (12.5%) | 79 (14.2%) |
| $35,000 to $49,999 | 22 (4.8%) | 14 (2.5%) |
| $50,000 to $74,999 | 100 (21.9%) | 0 (0.0%) |
| $75,000 to $99,999 | 68 (14.9%) | 84 (15.1%) |
| $100,000 to $149,999 | 79 (17.3%) | 165 (29.7%) |
| $150,000 or more | 52 (11.4%) | 101 (18.2%) |
| Total | 457 (100.0%) | 556 (100.0%) |
Property Value to Household Income Ratio in Cloverdale
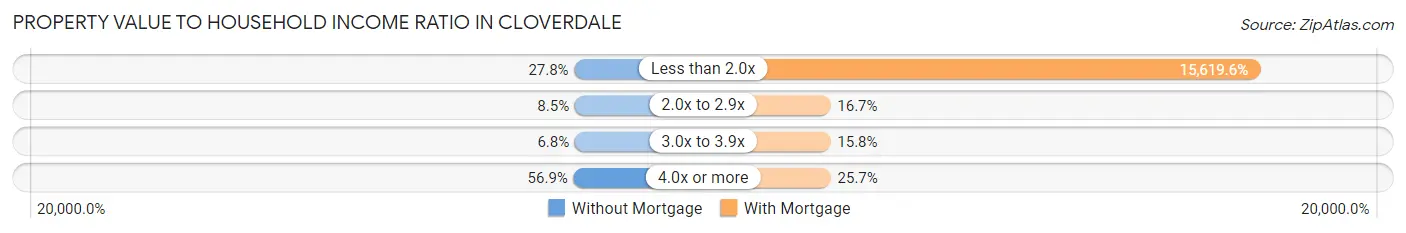
| Value-to-Income Ratio | Without Mortgage | With Mortgage |
| Less than 2.0x | 127 (27.8%) | 86,845 (15,619.6%) |
| 2.0x to 2.9x | 39 (8.5%) | 93 (16.7%) |
| 3.0x to 3.9x | 31 (6.8%) | 88 (15.8%) |
| 4.0x or more | 260 (56.9%) | 143 (25.7%) |
| Total | 457 (100.0%) | 556 (100.0%) |
Real Estate Taxes by Mortgage Status in Cloverdale
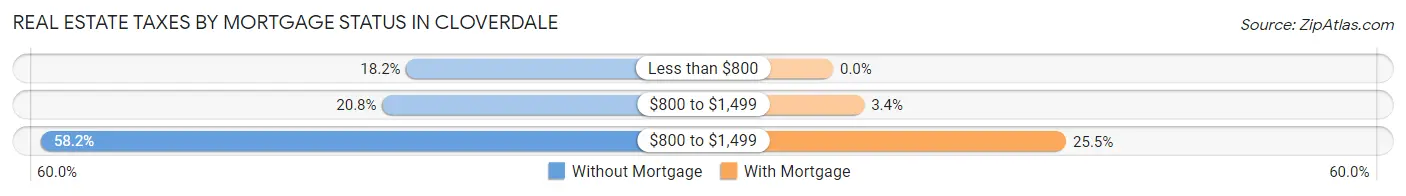
| Property Taxes | Without Mortgage | With Mortgage |
| Less than $800 | 83 (18.2%) | 0 (0.0%) |
| $800 to $1,499 | 95 (20.8%) | 19 (3.4%) |
| $800 to $1,499 | 266 (58.2%) | 142 (25.5%) |
| Total | 457 (100.0%) | 556 (100.0%) |
Health & Disability in Cloverdale
Health Insurance Coverage by Age in Cloverdale
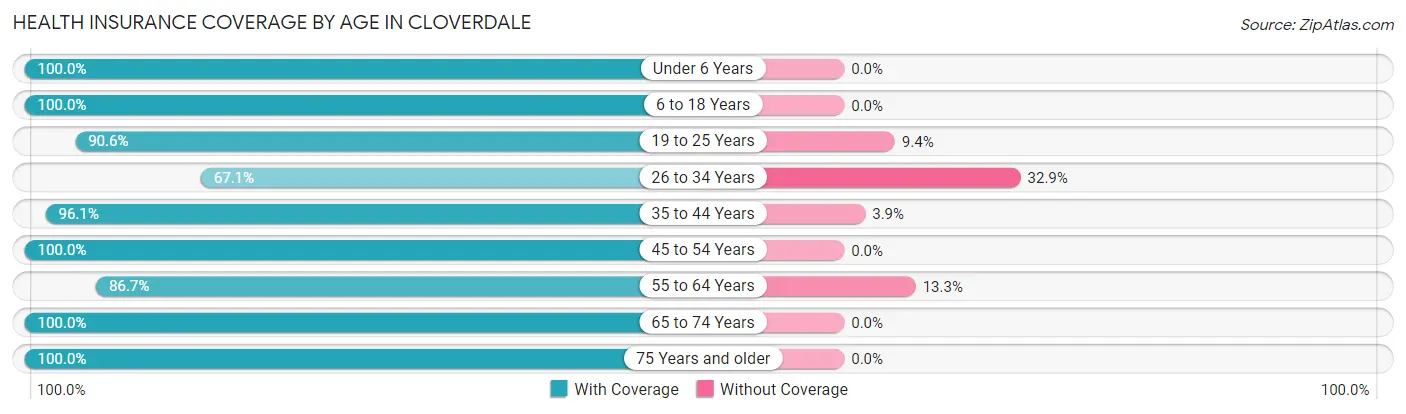
| Age Bracket | With Coverage | Without Coverage |
| Under 6 Years | 34 (100.0%) | 0 (0.0%) |
| 6 to 18 Years | 481 (100.0%) | 0 (0.0%) |
| 19 to 25 Years | 259 (90.6%) | 27 (9.4%) |
| 26 to 34 Years | 149 (67.1%) | 73 (32.9%) |
| 35 to 44 Years | 467 (96.1%) | 19 (3.9%) |
| 45 to 54 Years | 436 (100.0%) | 0 (0.0%) |
| 55 to 64 Years | 475 (86.7%) | 73 (13.3%) |
| 65 to 74 Years | 523 (100.0%) | 0 (0.0%) |
| 75 Years and older | 471 (100.0%) | 0 (0.0%) |
| Total | 3,295 (94.5%) | 192 (5.5%) |
Health Insurance Coverage by Citizenship Status in Cloverdale
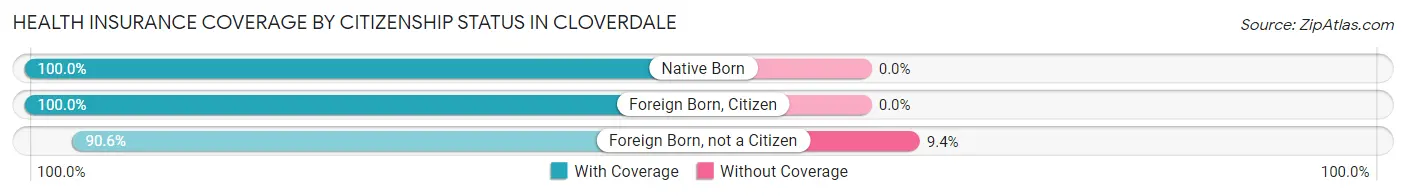
| Citizenship Status | With Coverage | Without Coverage |
| Native Born | 34 (100.0%) | 0 (0.0%) |
| Foreign Born, Citizen | 481 (100.0%) | 0 (0.0%) |
| Foreign Born, not a Citizen | 259 (90.6%) | 27 (9.4%) |
Health Insurance Coverage by Household Income in Cloverdale
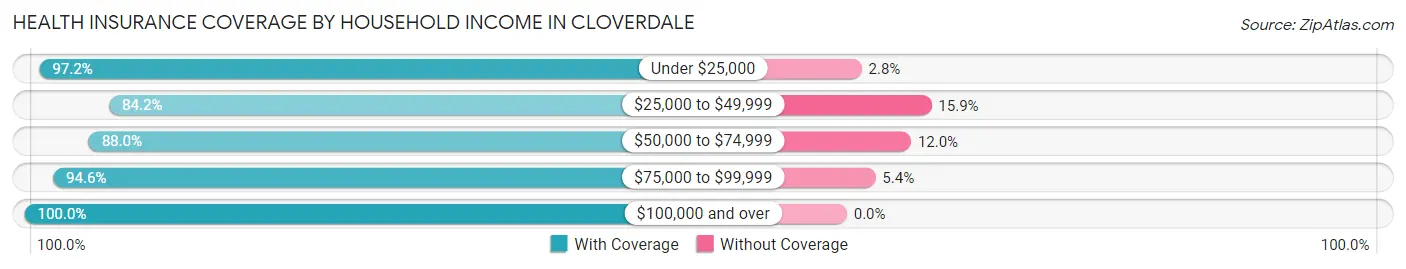
| Household Income | With Coverage | Without Coverage |
| Under $25,000 | 385 (97.2%) | 11 (2.8%) |
| $25,000 to $49,999 | 207 (84.2%) | 39 (15.9%) |
| $50,000 to $74,999 | 666 (88.0%) | 91 (12.0%) |
| $75,000 to $99,999 | 900 (94.6%) | 51 (5.4%) |
| $100,000 and over | 1,137 (100.0%) | 0 (0.0%) |
Public vs Private Health Insurance Coverage by Age in Cloverdale
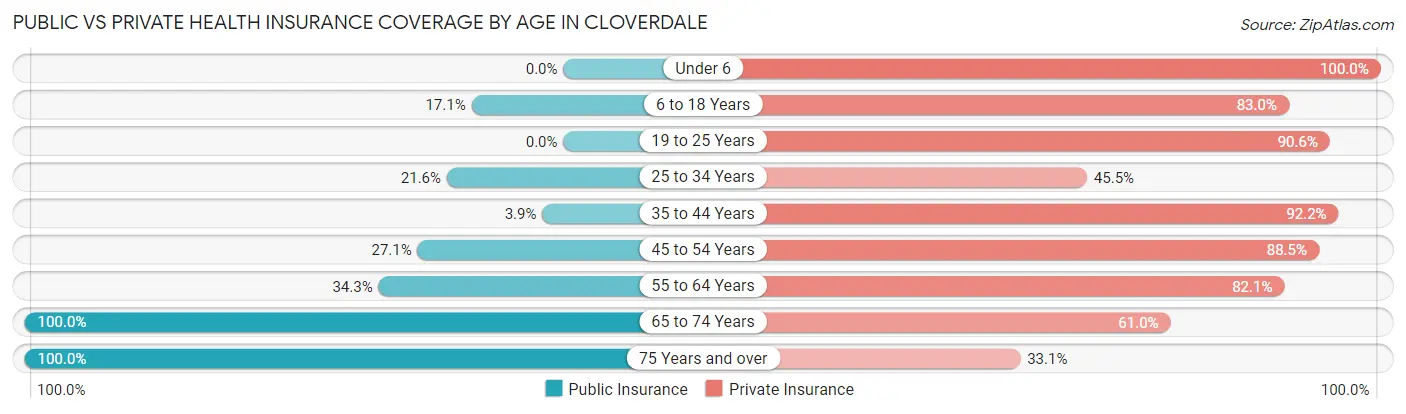
| Age Bracket | Public Insurance | Private Insurance |
| Under 6 | 0 (0.0%) | 34 (100.0%) |
| 6 to 18 Years | 82 (17.1%) | 399 (83.0%) |
| 19 to 25 Years | 0 (0.0%) | 259 (90.6%) |
| 25 to 34 Years | 48 (21.6%) | 101 (45.5%) |
| 35 to 44 Years | 19 (3.9%) | 448 (92.2%) |
| 45 to 54 Years | 118 (27.1%) | 386 (88.5%) |
| 55 to 64 Years | 188 (34.3%) | 450 (82.1%) |
| 65 to 74 Years | 523 (100.0%) | 319 (61.0%) |
| 75 Years and over | 471 (100.0%) | 156 (33.1%) |
| Total | 1,449 (41.5%) | 2,552 (73.2%) |
Disability Status by Sex by Age in Cloverdale
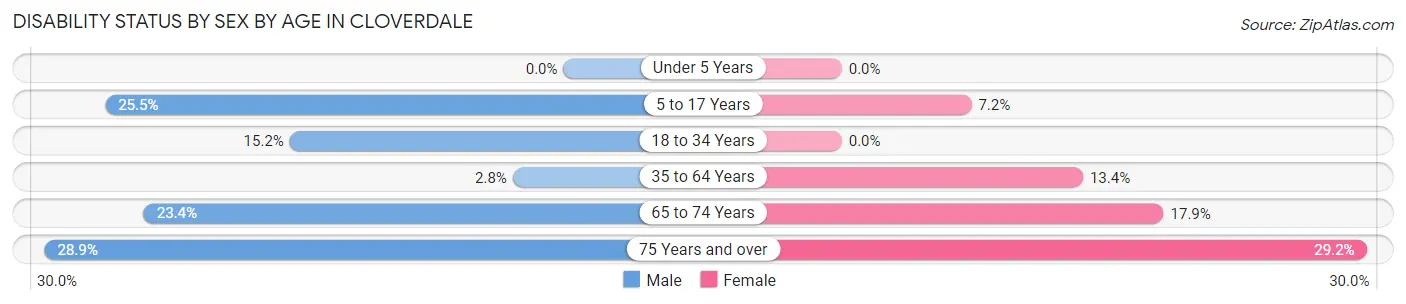
| Age Bracket | Male | Female |
| Under 5 Years | 0 (0.0%) | 0 (0.0%) |
| 5 to 17 Years | 63 (25.5%) | 14 (7.2%) |
| 18 to 34 Years | 48 (15.2%) | 0 (0.0%) |
| 35 to 64 Years | 19 (2.8%) | 107 (13.4%) |
| 65 to 74 Years | 57 (23.4%) | 50 (17.9%) |
| 75 Years and over | 52 (28.9%) | 85 (29.2%) |
Disability Class by Sex by Age in Cloverdale
Disability Class: Hearing Difficulty
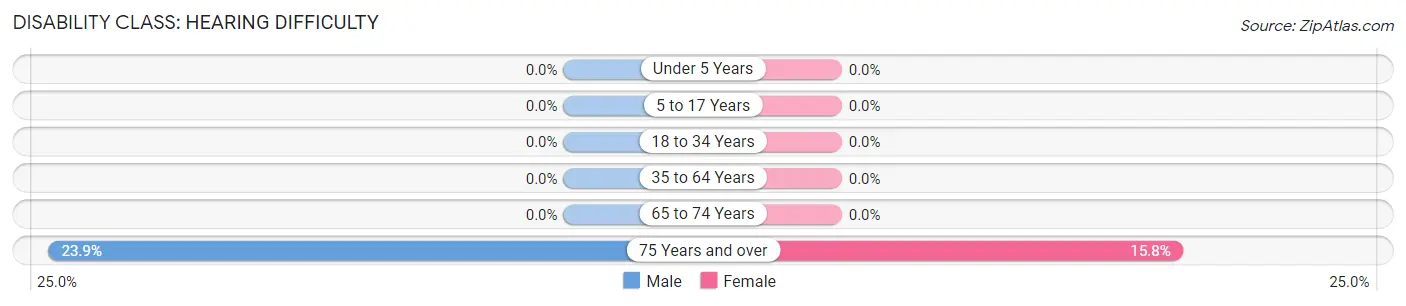
| Age Bracket | Male | Female |
| Under 5 Years | 0 (0.0%) | 0 (0.0%) |
| 5 to 17 Years | 0 (0.0%) | 0 (0.0%) |
| 18 to 34 Years | 0 (0.0%) | 0 (0.0%) |
| 35 to 64 Years | 0 (0.0%) | 0 (0.0%) |
| 65 to 74 Years | 0 (0.0%) | 0 (0.0%) |
| 75 Years and over | 43 (23.9%) | 46 (15.8%) |
Disability Class: Vision Difficulty
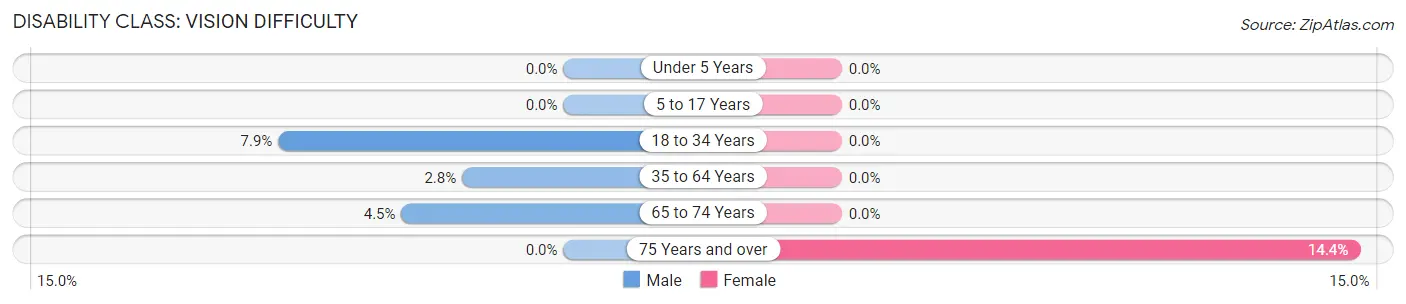
| Age Bracket | Male | Female |
| Under 5 Years | 0 (0.0%) | 0 (0.0%) |
| 5 to 17 Years | 0 (0.0%) | 0 (0.0%) |
| 18 to 34 Years | 25 (7.9%) | 0 (0.0%) |
| 35 to 64 Years | 19 (2.8%) | 0 (0.0%) |
| 65 to 74 Years | 11 (4.5%) | 0 (0.0%) |
| 75 Years and over | 0 (0.0%) | 42 (14.4%) |
Disability Class: Cognitive Difficulty
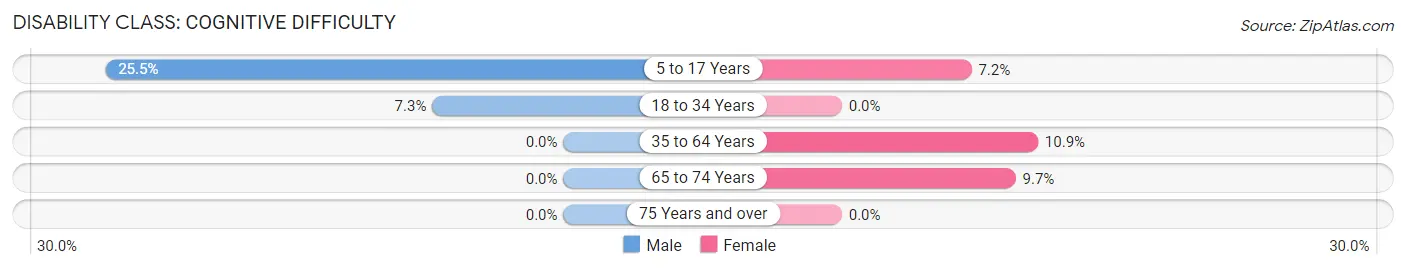
| Age Bracket | Male | Female |
| 5 to 17 Years | 63 (25.5%) | 14 (7.2%) |
| 18 to 34 Years | 23 (7.3%) | 0 (0.0%) |
| 35 to 64 Years | 0 (0.0%) | 87 (10.9%) |
| 65 to 74 Years | 0 (0.0%) | 27 (9.7%) |
| 75 Years and over | 0 (0.0%) | 0 (0.0%) |
Disability Class: Ambulatory Difficulty
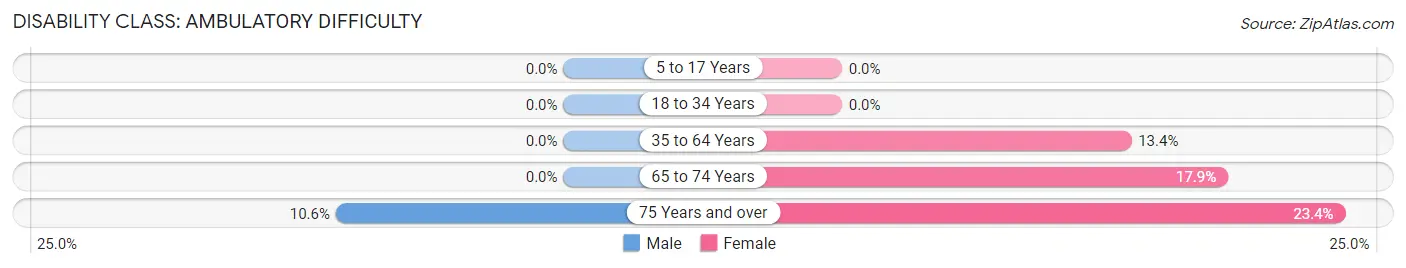
| Age Bracket | Male | Female |
| 5 to 17 Years | 0 (0.0%) | 0 (0.0%) |
| 18 to 34 Years | 0 (0.0%) | 0 (0.0%) |
| 35 to 64 Years | 0 (0.0%) | 107 (13.4%) |
| 65 to 74 Years | 0 (0.0%) | 50 (17.9%) |
| 75 Years and over | 19 (10.6%) | 68 (23.4%) |
Disability Class: Self-Care Difficulty
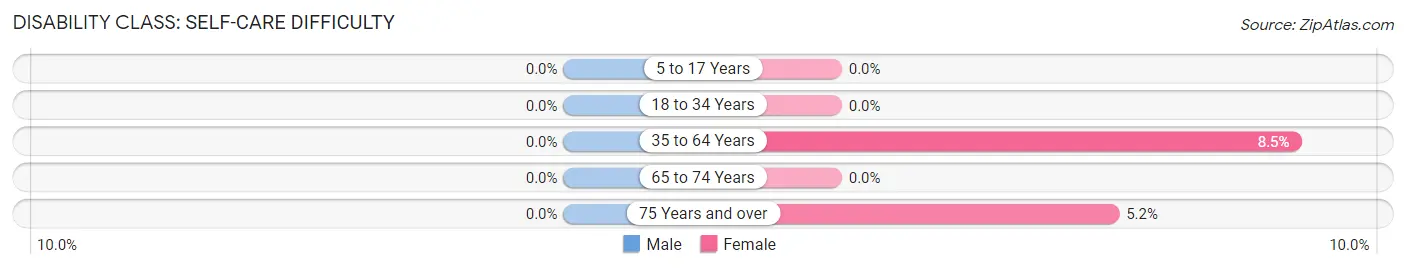
| Age Bracket | Male | Female |
| 5 to 17 Years | 0 (0.0%) | 0 (0.0%) |
| 18 to 34 Years | 0 (0.0%) | 0 (0.0%) |
| 35 to 64 Years | 0 (0.0%) | 68 (8.5%) |
| 65 to 74 Years | 0 (0.0%) | 0 (0.0%) |
| 75 Years and over | 0 (0.0%) | 15 (5.1%) |
Technology Access in Cloverdale
Computing Device Access in Cloverdale
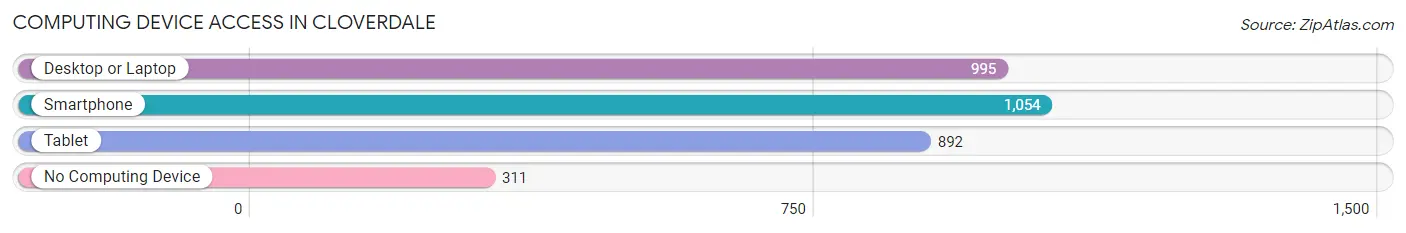
| Device Type | # Households | % Households |
| Desktop or Laptop | 995 | 68.2% |
| Smartphone | 1,054 | 72.3% |
| Tablet | 892 | 61.2% |
| No Computing Device | 311 | 21.3% |
| Total | 1,458 | 100.0% |
Internet Access in Cloverdale
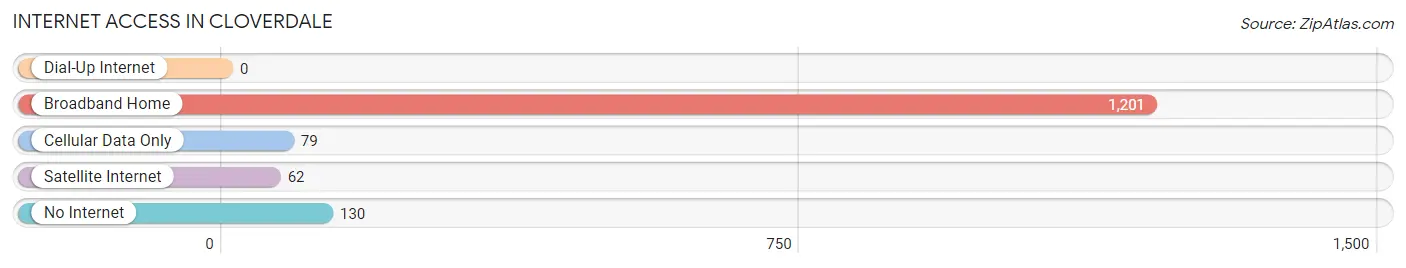
| Internet Type | # Households | % Households |
| Dial-Up Internet | 0 | 0.0% |
| Broadband Home | 1,201 | 82.4% |
| Cellular Data Only | 79 | 5.4% |
| Satellite Internet | 62 | 4.3% |
| No Internet | 130 | 8.9% |
| Total | 1,458 | 100.0% |
Cloverdale Summary
Cloverdale is a small town located in the Blue Ridge Mountains of Virginia. It is situated in the western part of the state, about an hour and a half from Roanoke. The town has a population of just over 1,000 people and is part of the Roanoke Metropolitan Statistical Area.
History
Cloverdale was first settled in the late 1700s by a group of German immigrants. The town was originally known as “New Germany” and was part of Botetourt County. In 1831, the town was renamed Cloverdale after the abundance of clover that grew in the area. The town was officially incorporated in 1872.
In the late 1800s, Cloverdale was a thriving agricultural community. The town was known for its production of apples, peaches, and other fruits. The town also had a thriving lumber industry, with several sawmills located in the area.
In the early 1900s, the town began to decline as the lumber industry moved away and the agricultural industry began to decline. The town was hit hard by the Great Depression and many of the businesses in the area closed.
In the 1950s, the town began to experience a resurgence as the nearby city of Roanoke began to grow. The town was able to attract new businesses and industries, and the population began to grow again.
Geography
Cloverdale is located in the western part of Virginia, in the Blue Ridge Mountains. The town is situated in the Roanoke Valley, about an hour and a half from Roanoke. The town is surrounded by the Blue Ridge Mountains to the east and the Allegheny Mountains to the west.
The town is located at the intersection of two major highways, US Route 11 and US Route 220. The town is also located near the Appalachian Trail, which runs through the area.
The town is located in a temperate climate, with mild winters and hot summers. The average temperature in the summer is around 80 degrees Fahrenheit, and the average temperature in the winter is around 40 degrees Fahrenheit.
Economy
Cloverdale’s economy is largely based on tourism and agriculture. The town is home to several wineries, and the nearby Blue Ridge Mountains attract many visitors each year. The town is also home to several apple orchards, and the nearby Roanoke Valley is home to several large companies, including Volvo Trucks and Advance Auto Parts.
The town also has a thriving retail sector, with several small businesses located in the downtown area. The town is also home to several restaurants, bars, and other entertainment venues.
Demographics
As of the 2010 census, the population of Cloverdale was 1,072. The town is predominantly white, with 92.3% of the population identifying as white. The town also has a small African American population, with 4.2% of the population identifying as African American. The town also has a small Hispanic population, with 1.7% of the population identifying as Hispanic or Latino.
The median household income in Cloverdale is $41,250, and the median home value is $133,400. The town has a poverty rate of 16.3%, and the unemployment rate is 4.2%.
Conclusion
Cloverdale is a small town located in the Blue Ridge Mountains of Virginia. The town has a population of just over 1,000 people and is part of the Roanoke Metropolitan Statistical Area. The town’s economy is largely based on tourism and agriculture, and the town is home to several wineries and apple orchards. The town also has a thriving retail sector, with several small businesses located in the downtown area. The town is predominantly white, with 92.3% of the population identifying as white. The median household income in Cloverdale is $41,250, and the median home value is $133,400.
Common Questions
What is Per Capita Income in Cloverdale?
Per Capita income in Cloverdale is $36,940.
What is the Median Family Income in Cloverdale?
Median Family Income in Cloverdale is $86,310.
What is the Median Household income in Cloverdale?
Median Household Income in Cloverdale is $64,929.
What is Income or Wage Gap in Cloverdale?
Income or Wage Gap in Cloverdale is 26.4%.
Women in Cloverdale earn 73.6 cents for every dollar earned by a man.
What is Inequality or Gini Index in Cloverdale?
Inequality or Gini Index in Cloverdale is 0.40.
What is the Total Population of Cloverdale?
Total Population of Cloverdale is 3,501.
What is the Total Male Population of Cloverdale?
Total Male Population of Cloverdale is 1,680.
What is the Total Female Population of Cloverdale?
Total Female Population of Cloverdale is 1,821.
What is the Ratio of Males per 100 Females in Cloverdale?
There are 92.26 Males per 100 Females in Cloverdale.
What is the Ratio of Females per 100 Males in Cloverdale?
There are 108.39 Females per 100 Males in Cloverdale.
What is the Median Population Age in Cloverdale?
Median Population Age in Cloverdale is 50.9 Years.
What is the Average Family Size in Cloverdale
Average Family Size in Cloverdale is 3.2 People.
What is the Average Household Size in Cloverdale
Average Household Size in Cloverdale is 2.4 People.
How Large is the Labor Force in Cloverdale?
There are 1,858 People in the Labor Forcein in Cloverdale.
What is the Percentage of People in the Labor Force in Cloverdale?
60.2% of People are in the Labor Force in Cloverdale.
What is the Unemployment Rate in Cloverdale?
Unemployment Rate in Cloverdale is 5.1%.