Clifton Forge, VA Map & Demographics
Clifton Forge Map
Clifton Forge Overview
$21,654
PER CAPITA INCOME
$53,750
AVG FAMILY INCOME
$32,007
AVG HOUSEHOLD INCOME
43.0%
WAGE / INCOME GAP [ % ]
57.0¢/ $1
WAGE / INCOME GAP [ $ ]
$12,471
FAMILY INCOME DEFICIT
0.48
INEQUALITY / GINI INDEX
3,541
TOTAL POPULATION
1,789
MALE POPULATION
1,752
FEMALE POPULATION
102.11
MALES / 100 FEMALES
97.93
FEMALES / 100 MALES
42.8
MEDIAN AGE
3.1
AVG FAMILY SIZE
2.4
AVG HOUSEHOLD SIZE
1,109
LABOR FORCE [ PEOPLE ]
40.0%
PERCENT IN LABOR FORCE
8.5%
UNEMPLOYMENT RATE
Clifton Forge Zip Codes
Clifton Forge Area Codes
Income in Clifton Forge
Income Overview in Clifton Forge
Per Capita Income in Clifton Forge is $21,654, while median incomes of families and households are $53,750 and $32,007 respectively.
| Characteristic | Number | Measure |
| Per Capita Income | 3,541 | $21,654 |
| Median Family Income | 826 | $53,750 |
| Mean Family Income | 826 | $64,312 |
| Median Household Income | 1,427 | $32,007 |
| Mean Household Income | 1,427 | $50,347 |
| Income Deficit | 826 | $12,471 |
| Wage / Income Gap (%) | 3,541 | 43.01% |
| Wage / Income Gap ($) | 3,541 | 56.99¢ per $1 |
| Gini / Inequality Index | 3,541 | 0.48 |
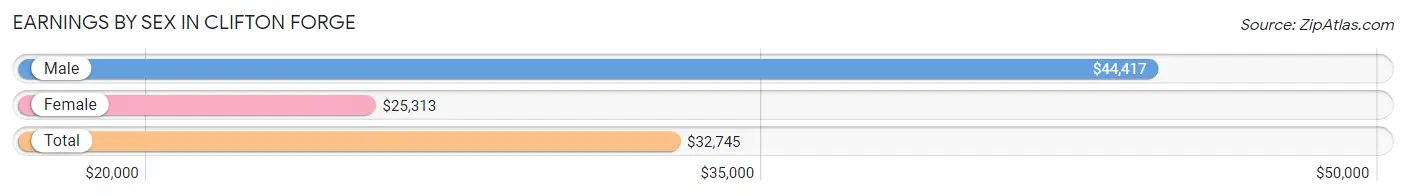
Earnings by Sex in Clifton Forge
Average Earnings in Clifton Forge are $32,745, $44,417 for men and $25,313 for women, a difference of 43.0%.
| Sex | Number | Average Earnings |
| Male | 653 (53.7%) | $44,417 |
| Female | 562 (46.3%) | $25,313 |
| Total | 1,215 (100.0%) | $32,745 |
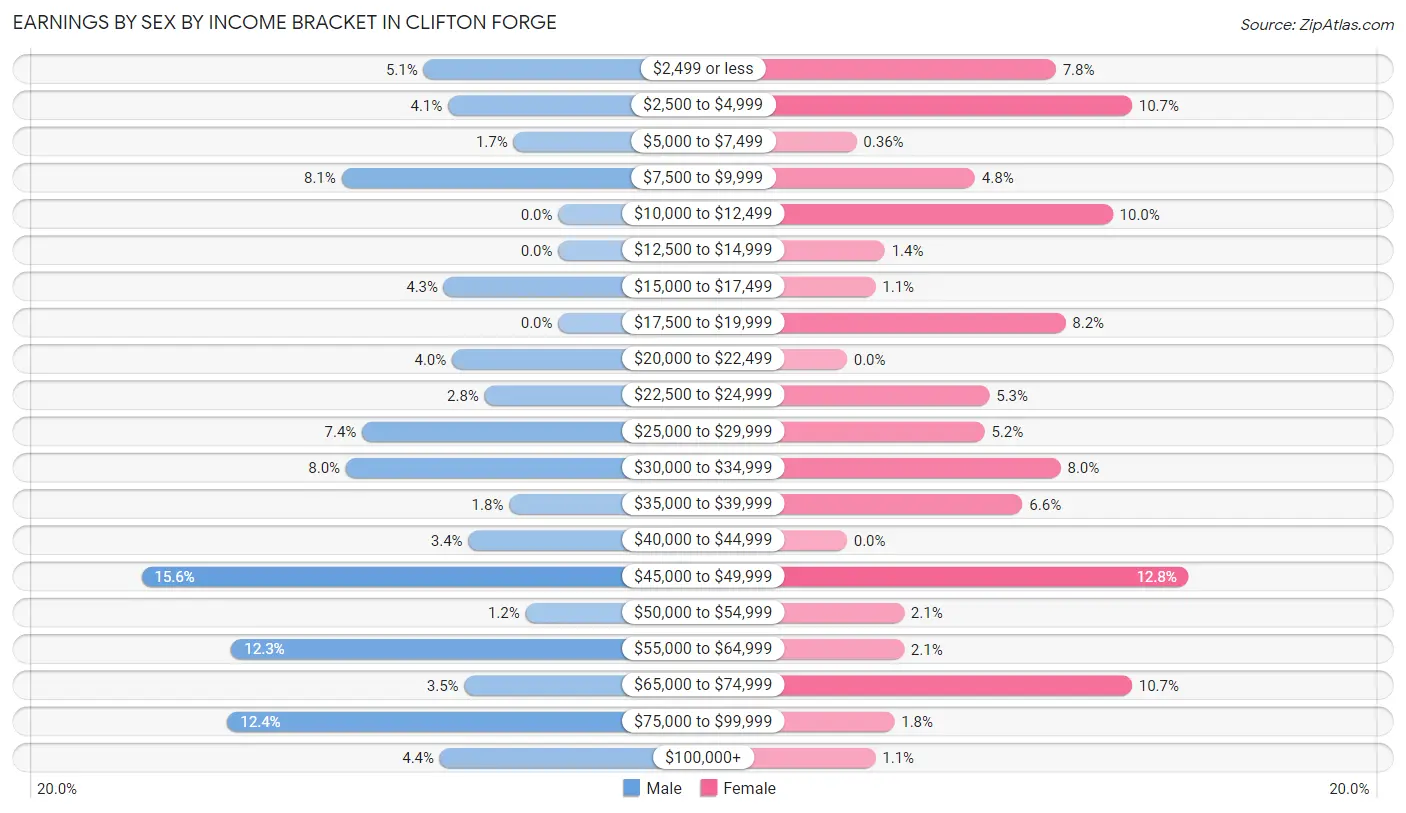
Earnings by Sex by Income Bracket in Clifton Forge
The most common earnings brackets in Clifton Forge are $45,000 to $49,999 for men (102 | 15.6%) and $45,000 to $49,999 for women (72 | 12.8%).
| Income | Male | Female |
| $2,499 or less | 33 (5.1%) | 44 (7.8%) |
| $2,500 to $4,999 | 27 (4.1%) | 60 (10.7%) |
| $5,000 to $7,499 | 11 (1.7%) | 2 (0.4%) |
| $7,500 to $9,999 | 53 (8.1%) | 27 (4.8%) |
| $10,000 to $12,499 | 0 (0.0%) | 56 (10.0%) |
| $12,500 to $14,999 | 0 (0.0%) | 8 (1.4%) |
| $15,000 to $17,499 | 28 (4.3%) | 6 (1.1%) |
| $17,500 to $19,999 | 0 (0.0%) | 46 (8.2%) |
| $20,000 to $22,499 | 26 (4.0%) | 0 (0.0%) |
| $22,500 to $24,999 | 18 (2.8%) | 30 (5.3%) |
| $25,000 to $29,999 | 48 (7.3%) | 29 (5.2%) |
| $30,000 to $34,999 | 52 (8.0%) | 45 (8.0%) |
| $35,000 to $39,999 | 12 (1.8%) | 37 (6.6%) |
| $40,000 to $44,999 | 22 (3.4%) | 0 (0.0%) |
| $45,000 to $49,999 | 102 (15.6%) | 72 (12.8%) |
| $50,000 to $54,999 | 8 (1.2%) | 12 (2.1%) |
| $55,000 to $64,999 | 80 (12.2%) | 12 (2.1%) |
| $65,000 to $74,999 | 23 (3.5%) | 60 (10.7%) |
| $75,000 to $99,999 | 81 (12.4%) | 10 (1.8%) |
| $100,000+ | 29 (4.4%) | 6 (1.1%) |
| Total | 653 (100.0%) | 562 (100.0%) |
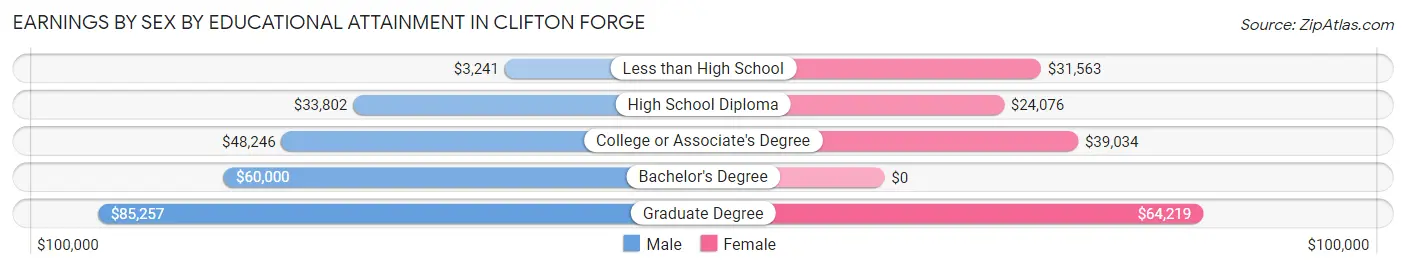
Earnings by Sex by Educational Attainment in Clifton Forge
Average earnings in Clifton Forge are $45,776 for men and $31,413 for women, a difference of 31.4%. Men with an educational attainment of graduate degree enjoy the highest average annual earnings of $85,257, while those with less than high school education earn the least with $3,241. Women with an educational attainment of graduate degree earn the most with the average annual earnings of $64,219, while those with high school diploma education have the smallest earnings of $24,076.
| Educational Attainment | Male Income | Female Income |
| Less than High School | $3,241 | $31,563 |
| High School Diploma | $33,802 | $24,076 |
| College or Associate's Degree | $48,246 | $39,034 |
| Bachelor's Degree | $60,000 | $0 |
| Graduate Degree | $85,257 | $64,219 |
| Total | $45,776 | $31,413 |
Family Income in Clifton Forge
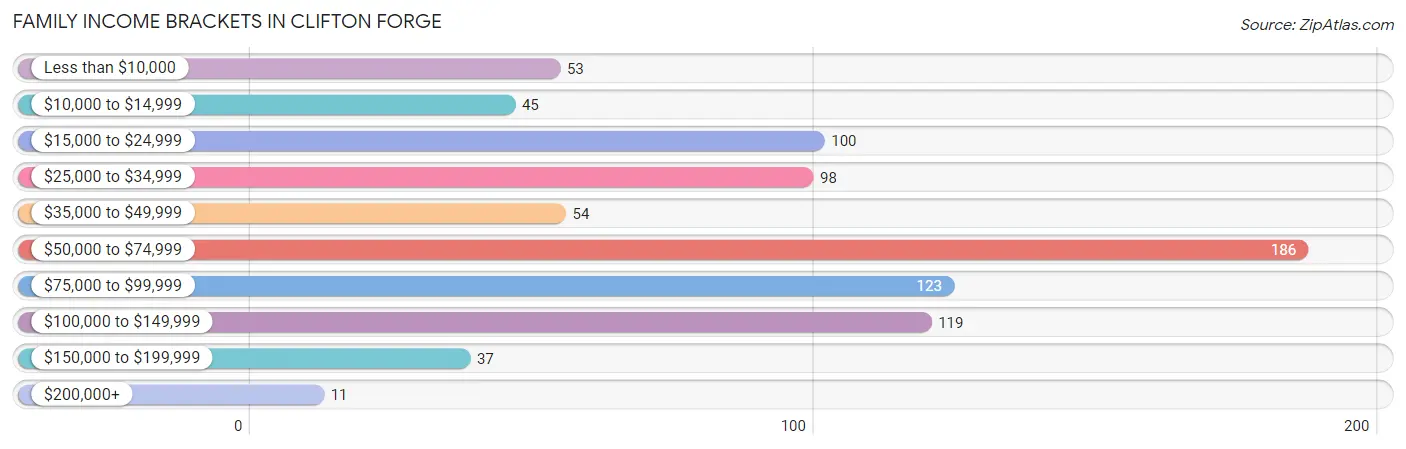
Family Income Brackets in Clifton Forge
According to the Clifton Forge family income data, there are 186 families falling into the $50,000 to $74,999 income range, which is the most common income bracket and makes up 22.5% of all families. Conversely, the $200,000+ income bracket is the least frequent group with only 11 families (1.3%) belonging to this category.
| Income Bracket | # Families | % Families |
| Less than $10,000 | 53 | 6.4% |
| $10,000 to $14,999 | 45 | 5.4% |
| $15,000 to $24,999 | 100 | 12.1% |
| $25,000 to $34,999 | 98 | 11.9% |
| $35,000 to $49,999 | 54 | 6.5% |
| $50,000 to $74,999 | 186 | 22.5% |
| $75,000 to $99,999 | 123 | 14.9% |
| $100,000 to $149,999 | 119 | 14.4% |
| $150,000 to $199,999 | 37 | 4.5% |
| $200,000+ | 11 | 1.3% |
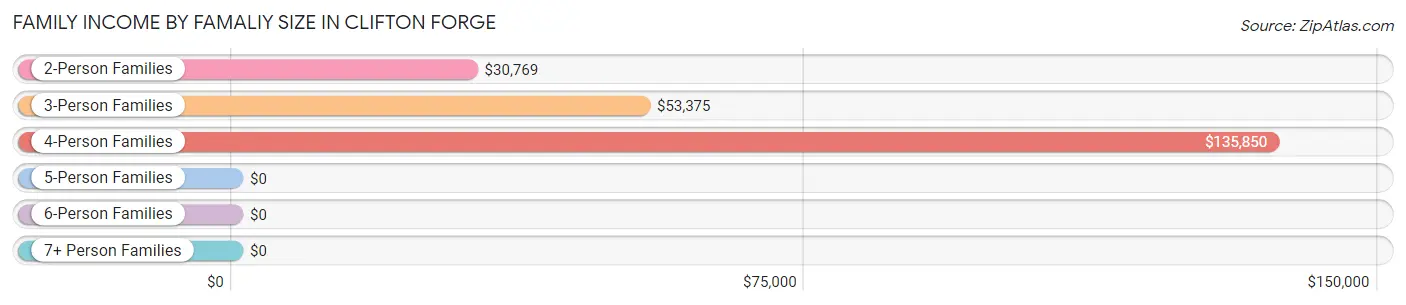
Family Income by Famaliy Size in Clifton Forge
4-person families (51 | 6.2%) account for the highest median family income in Clifton Forge with $135,850 per family, while 4-person families (51 | 6.2%) have the highest median income of $33,962 per family member.
| Income Bracket | # Families | Median Income |
| 2-Person Families | 498 (60.3%) | $30,769 |
| 3-Person Families | 220 (26.6%) | $53,375 |
| 4-Person Families | 51 (6.2%) | $135,850 |
| 5-Person Families | 47 (5.7%) | $0 |
| 6-Person Families | 0 (0.0%) | $0 |
| 7+ Person Families | 10 (1.2%) | $0 |
| Total | 826 (100.0%) | $53,750 |
Family Income by Number of Earners in Clifton Forge
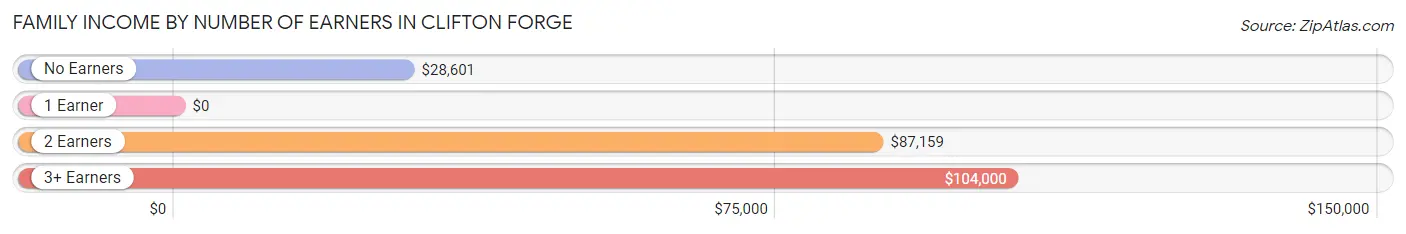
| Number of Earners | # Families | Median Income |
| No Earners | 283 (34.3%) | $28,601 |
| 1 Earner | 212 (25.7%) | $0 |
| 2 Earners | 305 (36.9%) | $87,159 |
| 3+ Earners | 26 (3.2%) | $104,000 |
| Total | 826 (100.0%) | $53,750 |
Household Income in Clifton Forge
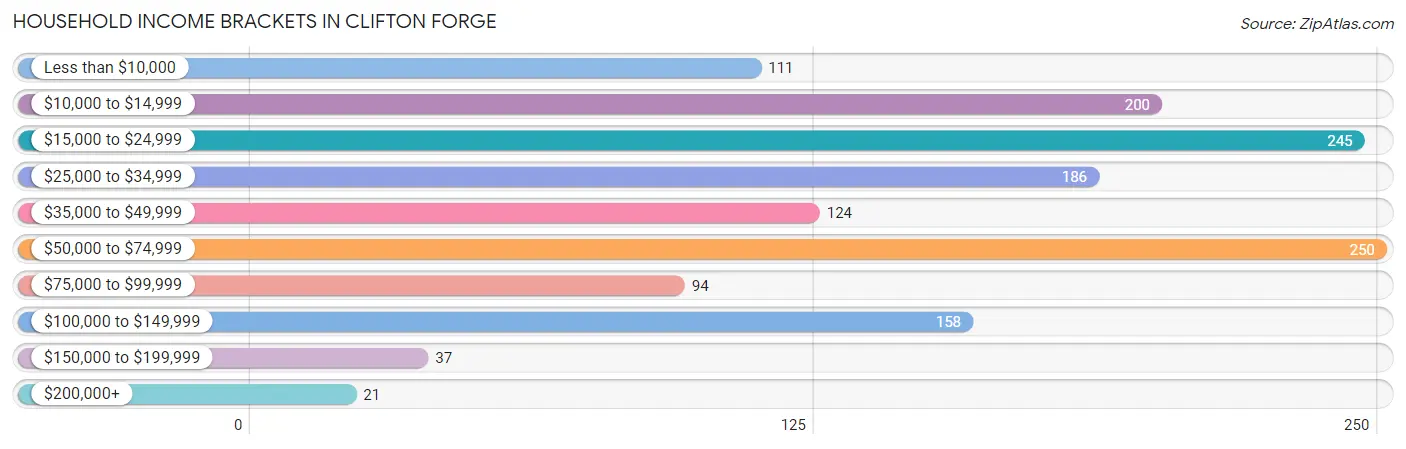
Household Income Brackets in Clifton Forge
With 250 households falling in the category, the $50,000 to $74,999 income range is the most frequent in Clifton Forge, accounting for 17.5% of all households. In contrast, only 21 households (1.5%) fall into the $200,000+ income bracket, making it the least populous group.
| Income Bracket | # Households | % Households |
| Less than $10,000 | 111 | 7.8% |
| $10,000 to $14,999 | 200 | 14.0% |
| $15,000 to $24,999 | 245 | 17.2% |
| $25,000 to $34,999 | 186 | 13.0% |
| $35,000 to $49,999 | 124 | 8.7% |
| $50,000 to $74,999 | 250 | 17.5% |
| $75,000 to $99,999 | 94 | 6.6% |
| $100,000 to $149,999 | 158 | 11.1% |
| $150,000 to $199,999 | 37 | 2.6% |
| $200,000+ | 21 | 1.5% |
Household Income by Householder Age in Clifton Forge
The median household income in Clifton Forge is $32,007, with the highest median household income of $53,611 found in the 45 to 64 years age bracket for the primary householder. A total of 604 households (42.3%) fall into this category. Meanwhile, the 15 to 24 years age bracket for the primary householder has the lowest median household income of $0, with 51 households (3.6%) in this group.
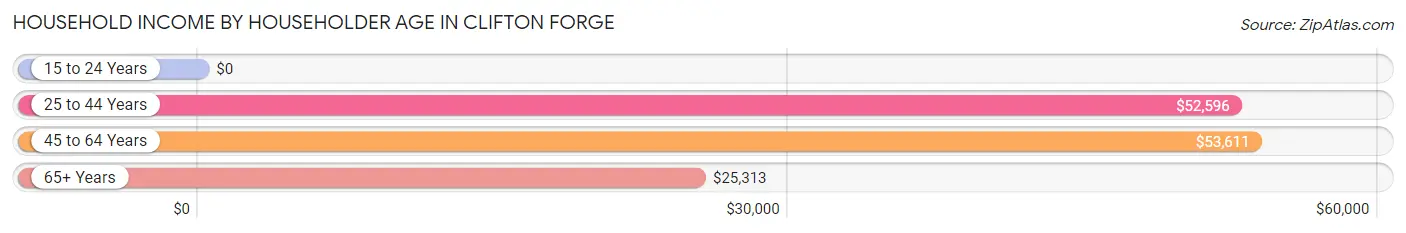
| Income Bracket | # Households | Median Income |
| 15 to 24 Years | 51 (3.6%) | $0 |
| 25 to 44 Years | 241 (16.9%) | $52,596 |
| 45 to 64 Years | 604 (42.3%) | $53,611 |
| 65+ Years | 531 (37.2%) | $25,313 |
| Total | 1,427 (100.0%) | $32,007 |
Poverty in Clifton Forge
Income Below Poverty by Sex and Age in Clifton Forge
With 12.5% poverty level for males and 23.8% for females among the residents of Clifton Forge, 15 year old males and 65 to 74 year old females are the most vulnerable to poverty, with 16 males (100.0%) and 129 females (48.9%) in their respective age groups living below the poverty level.
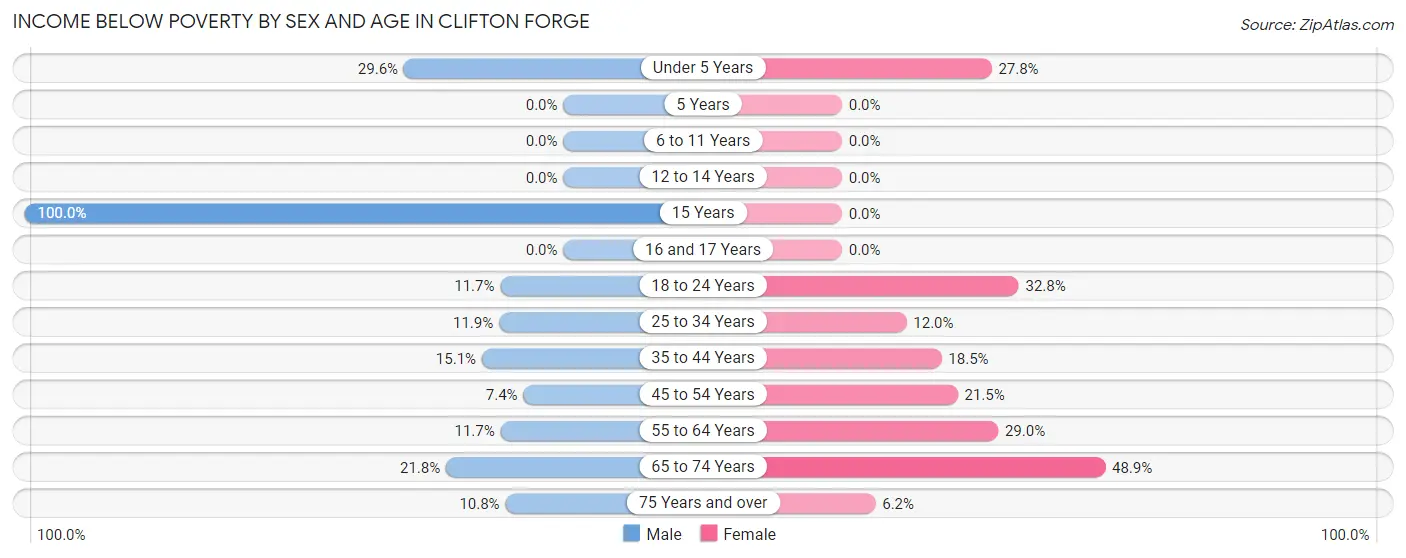
| Age Bracket | Male | Female |
| Under 5 Years | 50 (29.6%) | 25 (27.8%) |
| 5 Years | 0 (0.0%) | 0 (0.0%) |
| 6 to 11 Years | 0 (0.0%) | 0 (0.0%) |
| 12 to 14 Years | 0 (0.0%) | 0 (0.0%) |
| 15 Years | 16 (100.0%) | 0 (0.0%) |
| 16 and 17 Years | 0 (0.0%) | 0 (0.0%) |
| 18 to 24 Years | 11 (11.7%) | 42 (32.8%) |
| 25 to 34 Years | 34 (11.9%) | 26 (12.0%) |
| 35 to 44 Years | 26 (15.1%) | 22 (18.5%) |
| 45 to 54 Years | 10 (7.4%) | 32 (21.5%) |
| 55 to 64 Years | 26 (11.7%) | 100 (29.0%) |
| 65 to 74 Years | 32 (21.8%) | 129 (48.9%) |
| 75 Years and over | 10 (10.7%) | 12 (6.2%) |
| Total | 215 (12.5%) | 388 (23.8%) |
Income Above Poverty by Sex and Age in Clifton Forge
According to the poverty statistics in Clifton Forge, males aged 5 years and females aged 5 years are the age groups that are most secure financially, with 100.0% of males and 100.0% of females in these age groups living above the poverty line.
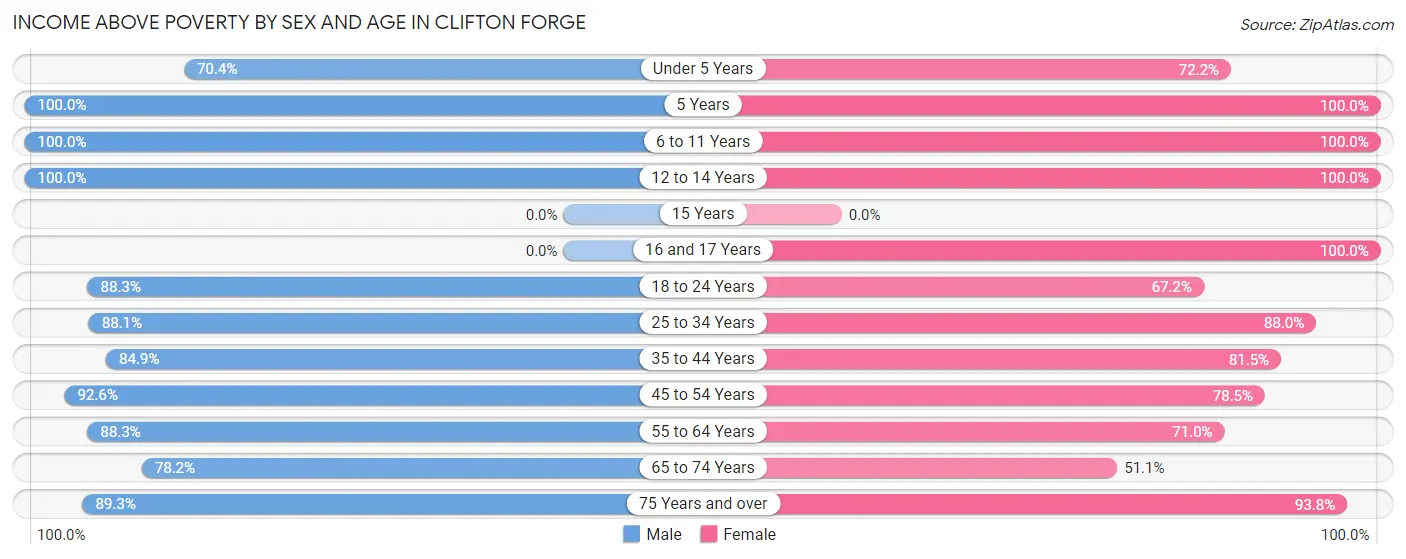
| Age Bracket | Male | Female |
| Under 5 Years | 119 (70.4%) | 65 (72.2%) |
| 5 Years | 48 (100.0%) | 42 (100.0%) |
| 6 to 11 Years | 329 (100.0%) | 15 (100.0%) |
| 12 to 14 Years | 12 (100.0%) | 39 (100.0%) |
| 15 Years | 0 (0.0%) | 0 (0.0%) |
| 16 and 17 Years | 0 (0.0%) | 32 (100.0%) |
| 18 to 24 Years | 83 (88.3%) | 86 (67.2%) |
| 25 to 34 Years | 251 (88.1%) | 191 (88.0%) |
| 35 to 44 Years | 146 (84.9%) | 97 (81.5%) |
| 45 to 54 Years | 125 (92.6%) | 117 (78.5%) |
| 55 to 64 Years | 197 (88.3%) | 245 (71.0%) |
| 65 to 74 Years | 115 (78.2%) | 135 (51.1%) |
| 75 Years and over | 83 (89.2%) | 181 (93.8%) |
| Total | 1,508 (87.5%) | 1,245 (76.2%) |
Income Below Poverty Among Married-Couple Families in Clifton Forge
The poverty statistics for married-couple families in Clifton Forge show that 12.7% or 67 of the total 528 families live below the poverty line. Families with 1 or 2 children have the highest poverty rate of 15.8%, comprising of 22 families. On the other hand, families with 3 or 4 children have the lowest poverty rate of 0.0%, which includes 0 families.
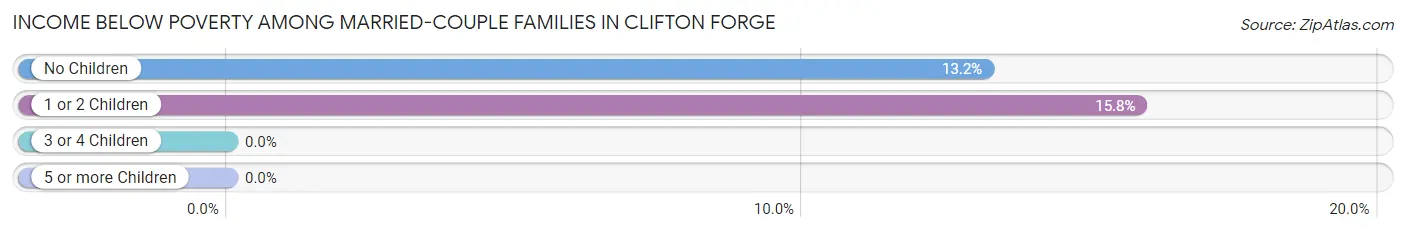
| Children | Above Poverty | Below Poverty |
| No Children | 297 (86.8%) | 45 (13.2%) |
| 1 or 2 Children | 117 (84.2%) | 22 (15.8%) |
| 3 or 4 Children | 47 (100.0%) | 0 (0.0%) |
| 5 or more Children | 0 (0.0%) | 0 (0.0%) |
| Total | 461 (87.3%) | 67 (12.7%) |
Income Below Poverty Among Single-Parent Households in Clifton Forge
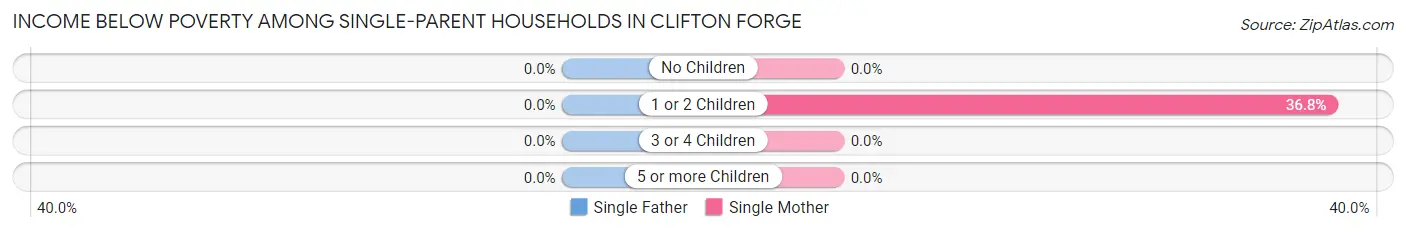
| Children | Single Father | Single Mother |
| No Children | 0 (0.0%) | 0 (0.0%) |
| 1 or 2 Children | 0 (0.0%) | 49 (36.8%) |
| 3 or 4 Children | 0 (0.0%) | 0 (0.0%) |
| 5 or more Children | 0 (0.0%) | 0 (0.0%) |
| Total | 0 (0.0%) | 49 (22.9%) |
Income Below Poverty Among Married-Couple vs Single-Parent Households in Clifton Forge
The poverty data for Clifton Forge shows that 67 of the married-couple family households (12.7%) and 49 of the single-parent households (16.4%) are living below the poverty level. Within the married-couple family households, those with 1 or 2 children have the highest poverty rate, with 22 households (15.8%) falling below the poverty line. Among the single-parent households, those with 1 or 2 children have the highest poverty rate, with 49 household (26.1%) living below poverty.
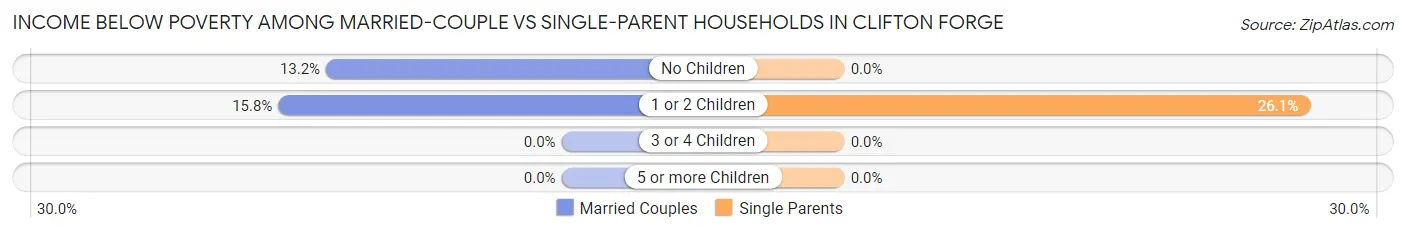
| Children | Married-Couple Families | Single-Parent Households |
| No Children | 45 (13.2%) | 0 (0.0%) |
| 1 or 2 Children | 22 (15.8%) | 49 (26.1%) |
| 3 or 4 Children | 0 (0.0%) | 0 (0.0%) |
| 5 or more Children | 0 (0.0%) | 0 (0.0%) |
| Total | 67 (12.7%) | 49 (16.4%) |
Race in Clifton Forge
The most populous races in Clifton Forge are White / Caucasian (2,880 | 81.3%), Black / African American (494 | 14.0%), and Two or more Races (86 | 2.4%).
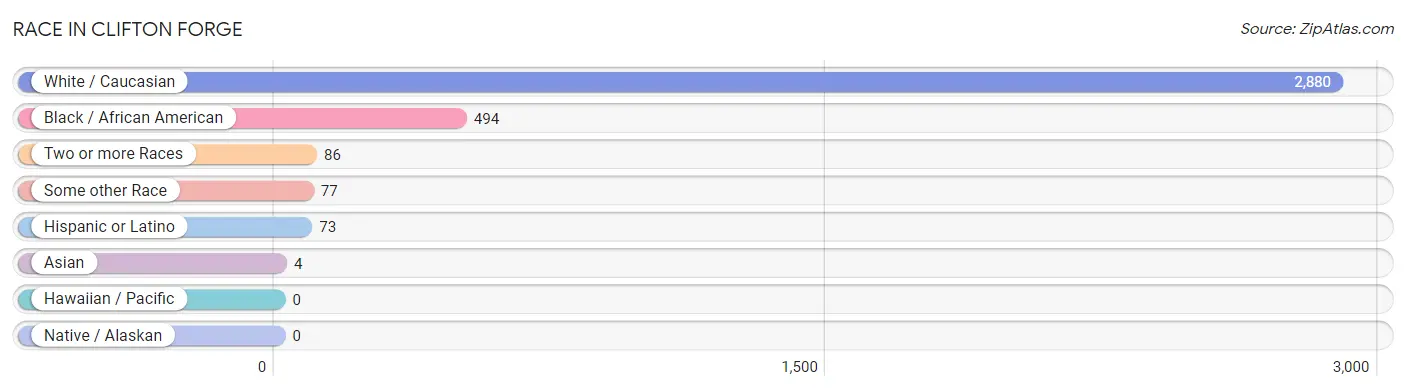
| Race | # Population | % Population |
| Asian | 4 | 0.1% |
| Black / African American | 494 | 14.0% |
| Hawaiian / Pacific | 0 | 0.0% |
| Hispanic or Latino | 73 | 2.1% |
| Native / Alaskan | 0 | 0.0% |
| White / Caucasian | 2,880 | 81.3% |
| Two or more Races | 86 | 2.4% |
| Some other Race | 77 | 2.2% |
| Total | 3,541 | 100.0% |
Ancestry in Clifton Forge
The most populous ancestries reported in Clifton Forge are German (409 | 11.6%), Irish (408 | 11.5%), American (373 | 10.5%), English (246 | 7.0%), and Scotch-Irish (83 | 2.3%), together accounting for 42.9% of all Clifton Forge residents.
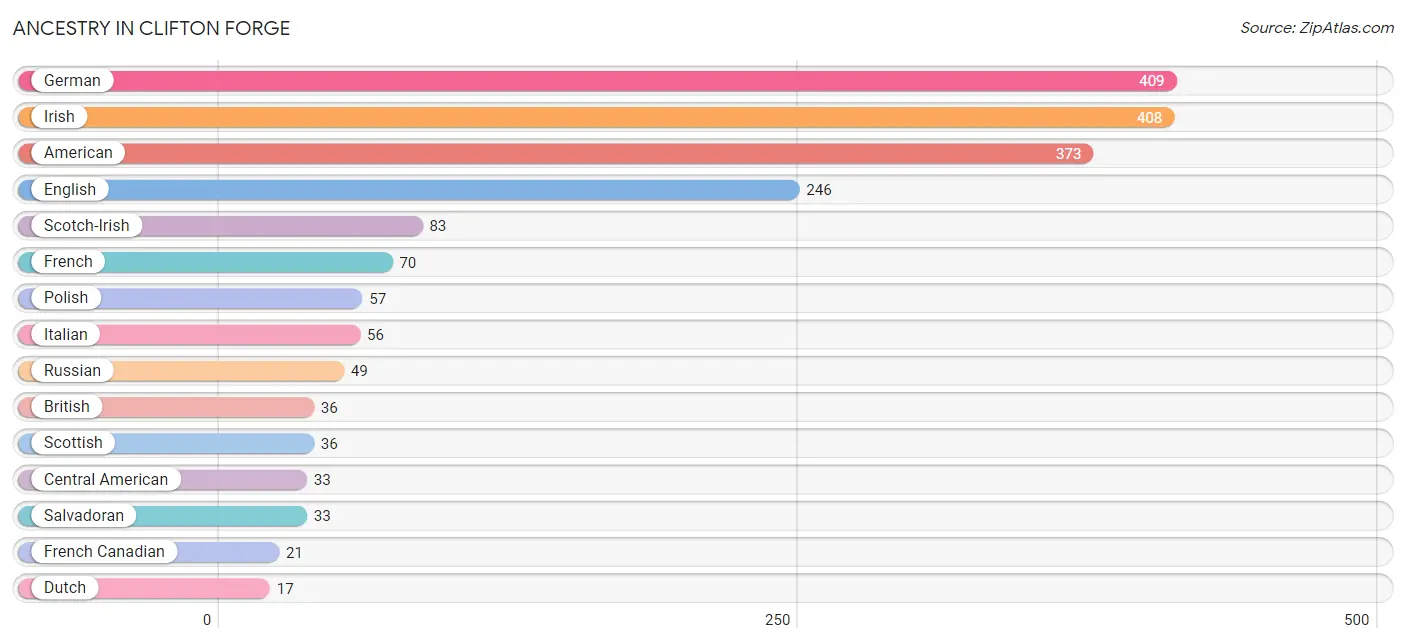
| Ancestry | # Population | % Population |
| American | 373 | 10.5% |
| British | 36 | 1.0% |
| Central American | 33 | 0.9% |
| Dutch | 17 | 0.5% |
| English | 246 | 7.0% |
| European | 8 | 0.2% |
| French | 70 | 2.0% |
| French Canadian | 21 | 0.6% |
| German | 409 | 11.6% |
| Irish | 408 | 11.5% |
| Italian | 56 | 1.6% |
| Mexican | 8 | 0.2% |
| Polish | 57 | 1.6% |
| Puerto Rican | 13 | 0.4% |
| Russian | 49 | 1.4% |
| Salvadoran | 33 | 0.9% |
| Scotch-Irish | 83 | 2.3% |
| Scottish | 36 | 1.0% |
| Spaniard | 9 | 0.3% |
| Spanish American | 10 | 0.3% |
| Swedish | 14 | 0.4% |
| Swiss | 10 | 0.3% |
| Thai | 4 | 0.1% |
| Ukrainian | 6 | 0.2% |
| Welsh | 12 | 0.3% | View All 25 Rows |
Immigrants in Clifton Forge
The most numerous immigrant groups reported in Clifton Forge came from Central America (34 | 1.0%), Latin America (34 | 1.0%), El Salvador (26 | 0.7%), Europe (22 | 0.6%), and Eastern Europe (13 | 0.4%), together accounting for 3.6% of all Clifton Forge residents.
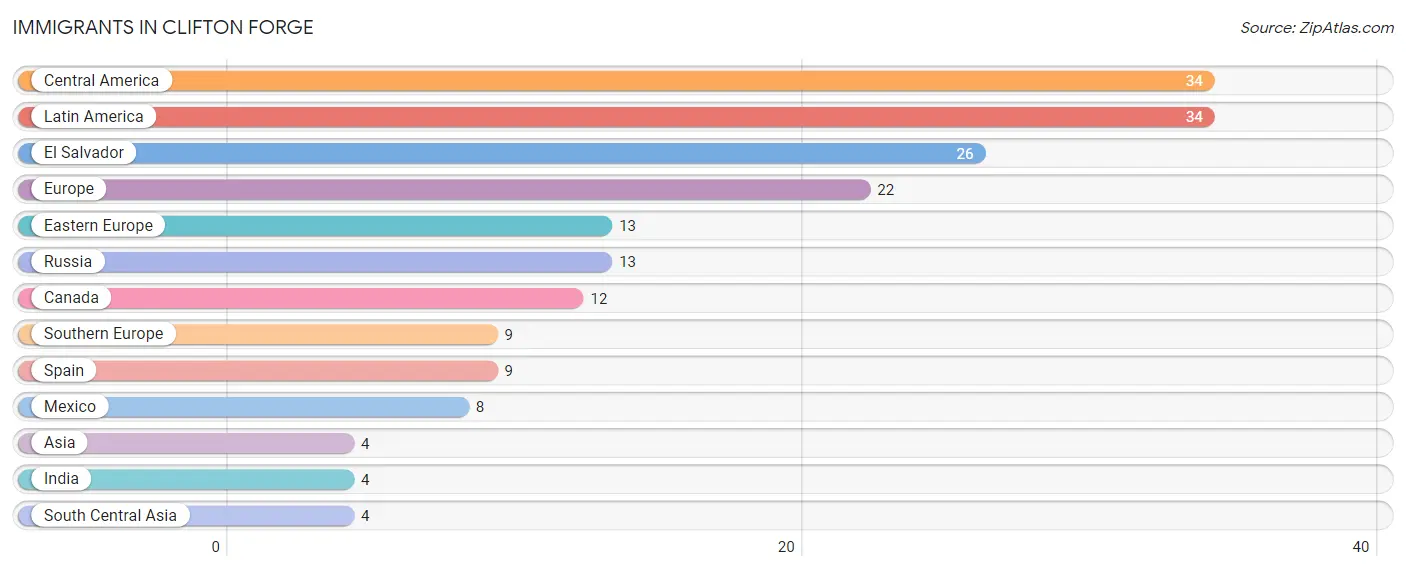
| Immigration Origin | # Population | % Population |
| Asia | 4 | 0.1% |
| Canada | 12 | 0.3% |
| Central America | 34 | 1.0% |
| Eastern Europe | 13 | 0.4% |
| El Salvador | 26 | 0.7% |
| Europe | 22 | 0.6% |
| India | 4 | 0.1% |
| Latin America | 34 | 1.0% |
| Mexico | 8 | 0.2% |
| Russia | 13 | 0.4% |
| South Central Asia | 4 | 0.1% |
| Southern Europe | 9 | 0.3% |
| Spain | 9 | 0.3% | View All 13 Rows |
Sex and Age in Clifton Forge
Sex and Age in Clifton Forge
The most populous age groups in Clifton Forge are 10 to 14 Years (287 | 16.0%) for men and 60 to 64 Years (198 | 11.3%) for women.
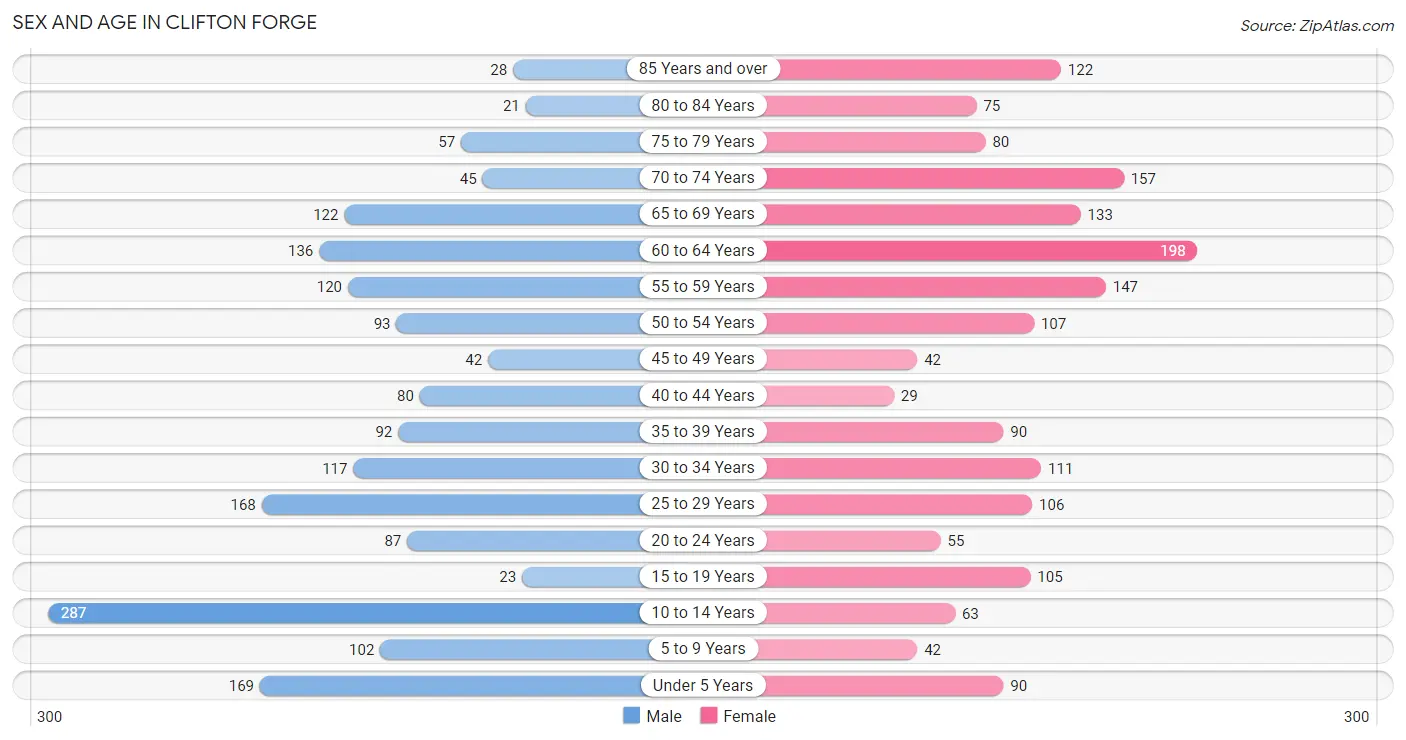
| Age Bracket | Male | Female |
| Under 5 Years | 169 (9.5%) | 90 (5.1%) |
| 5 to 9 Years | 102 (5.7%) | 42 (2.4%) |
| 10 to 14 Years | 287 (16.0%) | 63 (3.6%) |
| 15 to 19 Years | 23 (1.3%) | 105 (6.0%) |
| 20 to 24 Years | 87 (4.9%) | 55 (3.1%) |
| 25 to 29 Years | 168 (9.4%) | 106 (6.0%) |
| 30 to 34 Years | 117 (6.5%) | 111 (6.3%) |
| 35 to 39 Years | 92 (5.1%) | 90 (5.1%) |
| 40 to 44 Years | 80 (4.5%) | 29 (1.7%) |
| 45 to 49 Years | 42 (2.4%) | 42 (2.4%) |
| 50 to 54 Years | 93 (5.2%) | 107 (6.1%) |
| 55 to 59 Years | 120 (6.7%) | 147 (8.4%) |
| 60 to 64 Years | 136 (7.6%) | 198 (11.3%) |
| 65 to 69 Years | 122 (6.8%) | 133 (7.6%) |
| 70 to 74 Years | 45 (2.5%) | 157 (9.0%) |
| 75 to 79 Years | 57 (3.2%) | 80 (4.6%) |
| 80 to 84 Years | 21 (1.2%) | 75 (4.3%) |
| 85 Years and over | 28 (1.6%) | 122 (7.0%) |
| Total | 1,789 (100.0%) | 1,752 (100.0%) |
Families and Households in Clifton Forge
Median Family Size in Clifton Forge
The median family size in Clifton Forge is 3.09 persons per family, with single male/father families (84 | 10.2%) accounting for the largest median family size of 4.8 persons per family. On the other hand, married-couple families (528 | 63.9%) represent the smallest median family size with 2.87 persons per family.
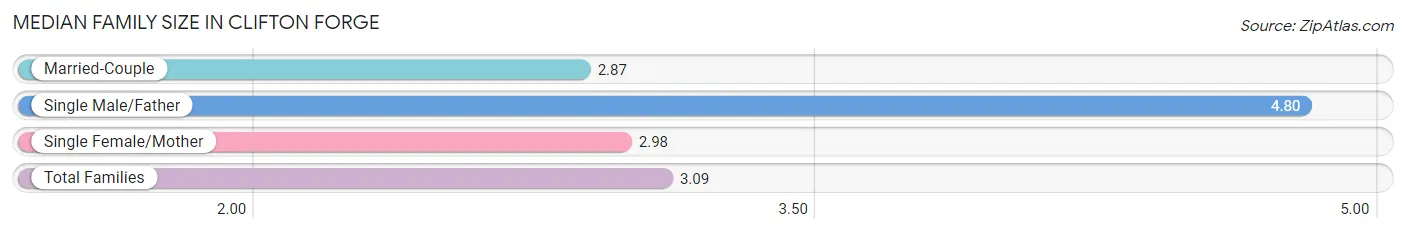
| Family Type | # Families | Family Size |
| Married-Couple | 528 (63.9%) | 2.87 |
| Single Male/Father | 84 (10.2%) | 4.80 |
| Single Female/Mother | 214 (25.9%) | 2.98 |
| Total Families | 826 (100.0%) | 3.09 |
Median Household Size in Clifton Forge
The median household size in Clifton Forge is 2.35 persons per household, with single male/father households (84 | 5.9%) accounting for the largest median household size of 5.24 persons per household. non-family households (601 | 42.1%) represent the smallest median household size with 1.08 persons per household.
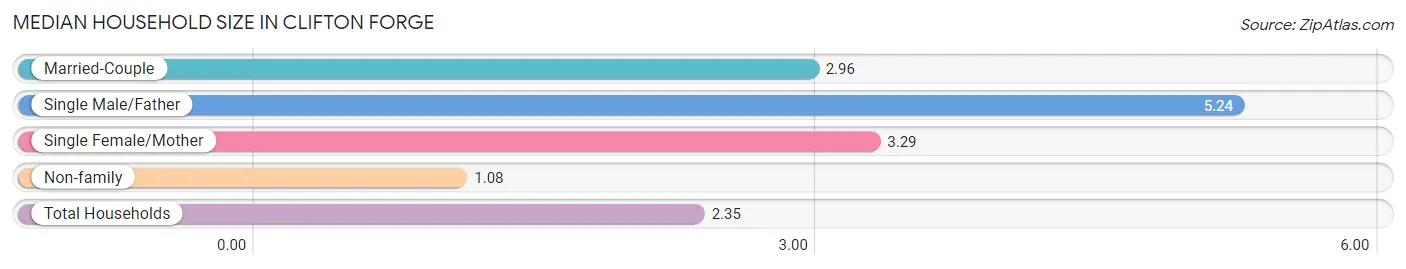
| Household Type | # Households | Household Size |
| Married-Couple | 528 (37.0%) | 2.96 |
| Single Male/Father | 84 (5.9%) | 5.24 |
| Single Female/Mother | 214 (15.0%) | 3.29 |
| Non-family | 601 (42.1%) | 1.08 |
| Total Households | 1,427 (100.0%) | 2.35 |
Household Size by Marriage Status in Clifton Forge
Out of a total of 1,427 households in Clifton Forge, 826 (57.9%) are family households, while 601 (42.1%) are nonfamily households. The most numerous type of family households are 2-person households, comprising 473, and the most common type of nonfamily households are 1-person households, comprising 560.
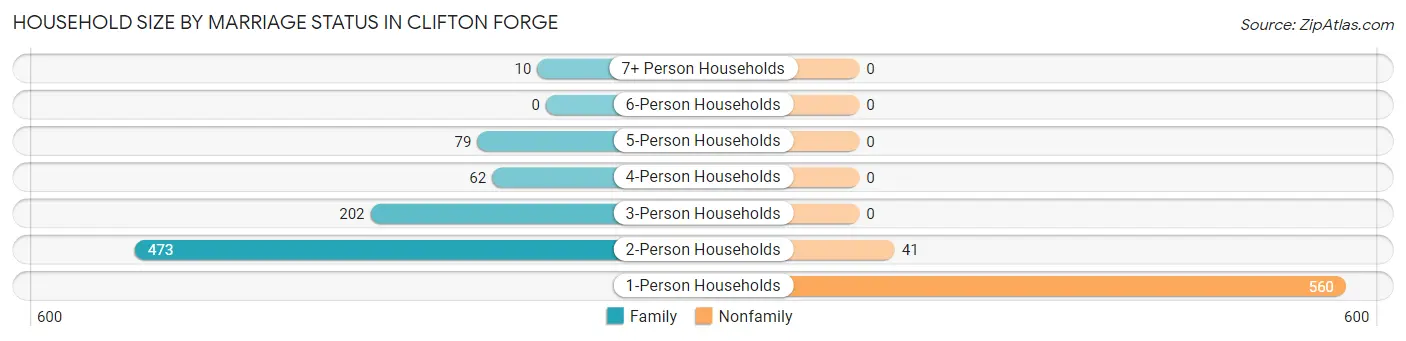
| Household Size | Family Households | Nonfamily Households |
| 1-Person Households | - | 560 (39.2%) |
| 2-Person Households | 473 (33.2%) | 41 (2.9%) |
| 3-Person Households | 202 (14.2%) | 0 (0.0%) |
| 4-Person Households | 62 (4.3%) | 0 (0.0%) |
| 5-Person Households | 79 (5.5%) | 0 (0.0%) |
| 6-Person Households | 0 (0.0%) | 0 (0.0%) |
| 7+ Person Households | 10 (0.7%) | 0 (0.0%) |
| Total | 826 (57.9%) | 601 (42.1%) |
Female Fertility in Clifton Forge
Fertility by Age in Clifton Forge
Average fertility rate in Clifton Forge is 13.0 births per 1,000 women. Women in the age bracket of 20 to 34 years have the highest fertility rate with 26.0 births per 1,000 women. Women in the age bracket of 20 to 34 years acount for 100.0% of all women with births.
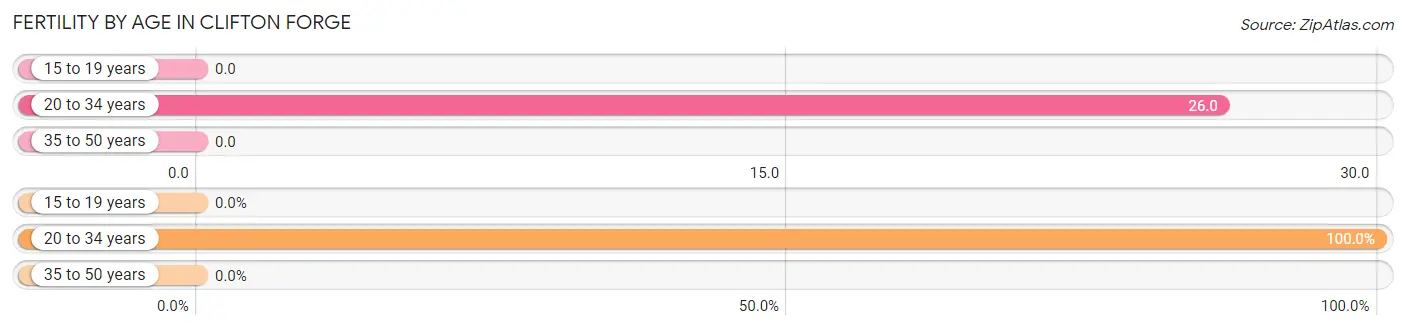
| Age Bracket | Women with Births | Births / 1,000 Women |
| 15 to 19 years | 0 (0.0%) | 0.0 |
| 20 to 34 years | 7 (100.0%) | 26.0 |
| 35 to 50 years | 0 (0.0%) | 0.0 |
| Total | 7 (100.0%) | 13.0 |
Fertility by Age by Marriage Status in Clifton Forge
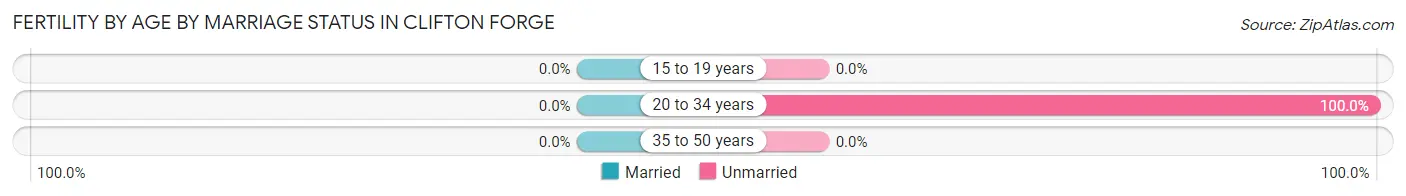
| Age Bracket | Married | Unmarried |
| 15 to 19 years | 0 (0.0%) | 0 (0.0%) |
| 20 to 34 years | 0 (0.0%) | 7 (100.0%) |
| 35 to 50 years | 0 (0.0%) | 0 (0.0%) |
| Total | 0 (0.0%) | 7 (100.0%) |
Fertility by Education in Clifton Forge
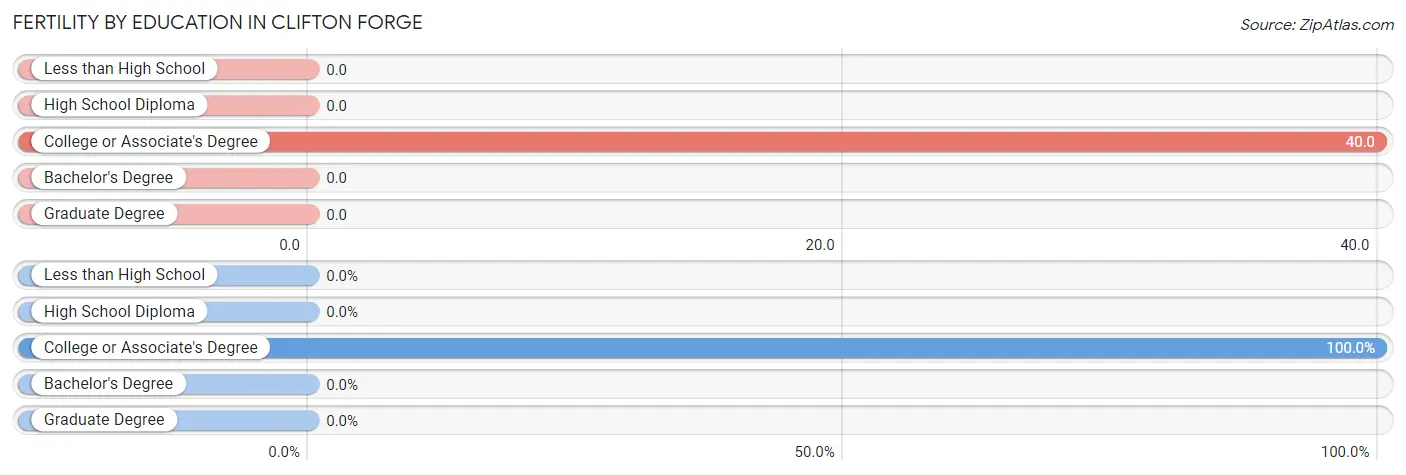
| Educational Attainment | Women with Births | Births / 1,000 Women |
| Less than High School | 0 (0.0%) | 0.0 |
| High School Diploma | 0 (0.0%) | 0.0 |
| College or Associate's Degree | 7 (100.0%) | 40.0 |
| Bachelor's Degree | 0 (0.0%) | 0.0 |
| Graduate Degree | 0 (0.0%) | 0.0 |
| Total | 7 (100.0%) | 13.0 |
Fertility by Education by Marriage Status in Clifton Forge
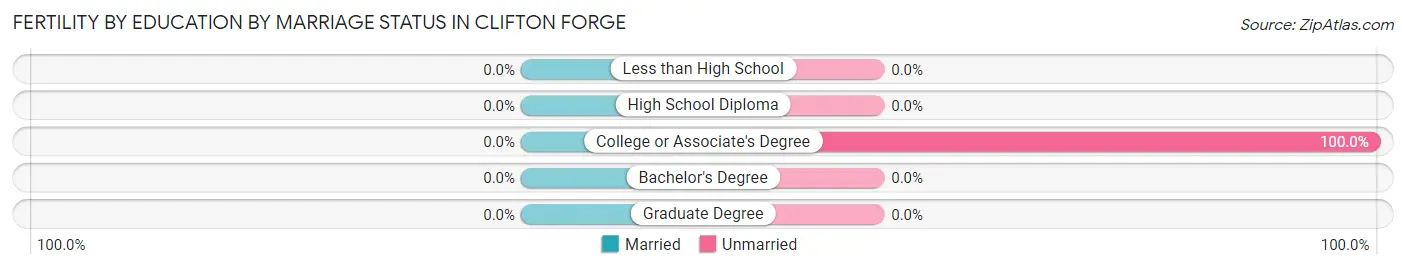
| Educational Attainment | Married | Unmarried |
| Less than High School | 0 (0.0%) | 0 (0.0%) |
| High School Diploma | 0 (0.0%) | 0 (0.0%) |
| College or Associate's Degree | 0 (0.0%) | 7 (100.0%) |
| Bachelor's Degree | 0 (0.0%) | 0 (0.0%) |
| Graduate Degree | 0 (0.0%) | 0 (0.0%) |
| Total | 0 (0.0%) | 7 (100.0%) |
Employment Characteristics in Clifton Forge
Employment by Class of Employer in Clifton Forge
Among the 989 employed individuals in Clifton Forge, private company employees (538 | 54.4%), not-for-profit organizations (155 | 15.7%), and local government employees (99 | 10.0%) make up the most common classes of employment.
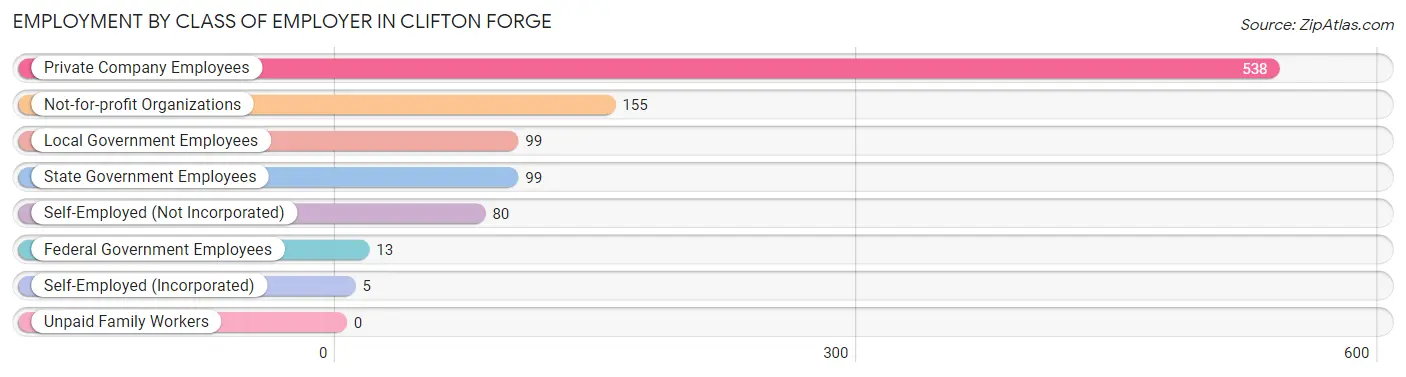
| Employer Class | # Employees | % Employees |
| Private Company Employees | 538 | 54.4% |
| Self-Employed (Incorporated) | 5 | 0.5% |
| Self-Employed (Not Incorporated) | 80 | 8.1% |
| Not-for-profit Organizations | 155 | 15.7% |
| Local Government Employees | 99 | 10.0% |
| State Government Employees | 99 | 10.0% |
| Federal Government Employees | 13 | 1.3% |
| Unpaid Family Workers | 0 | 0.0% |
| Total | 989 | 100.0% |
Employment Status by Age in Clifton Forge
According to the labor force statistics for Clifton Forge, out of the total population over 16 years of age (2,772), 40.0% or 1,109 individuals are in the labor force, with 8.5% or 94 of them unemployed. The age group with the highest labor force participation rate is 35 to 44 years, with 77.3% or 225 individuals in the labor force. Within the labor force, the 30 to 34 years age range has the highest percentage of unemployed individuals, with 25.0% or 24 of them being unemployed.
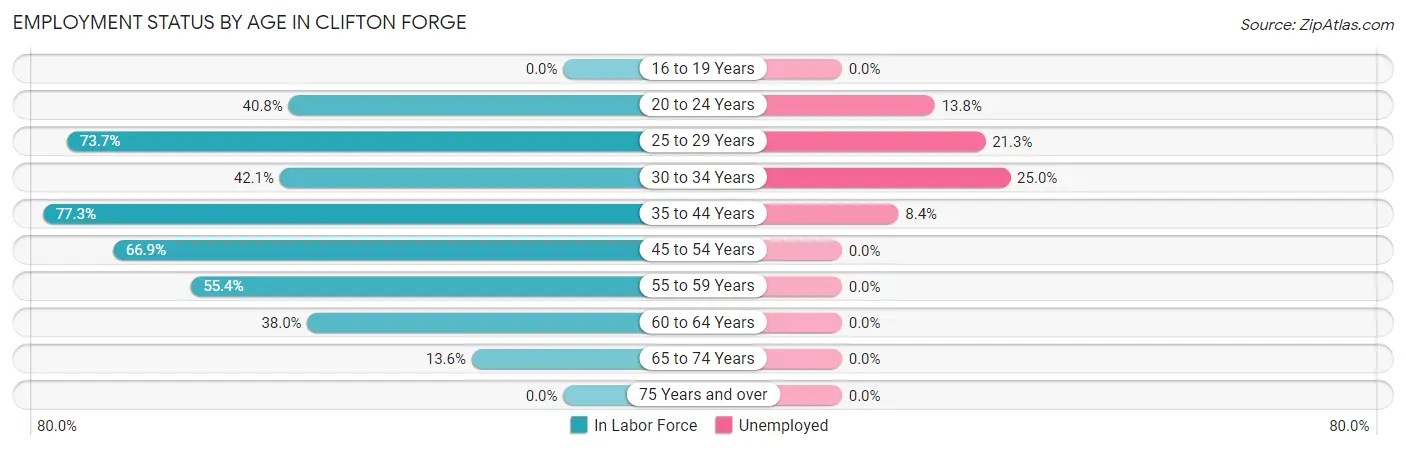
| Age Bracket | In Labor Force | Unemployed |
| 16 to 19 Years | 0 (0.0%) | 0 (0.0%) |
| 20 to 24 Years | 58 (40.8%) | 8 (13.8%) |
| 25 to 29 Years | 202 (73.7%) | 43 (21.3%) |
| 30 to 34 Years | 96 (42.1%) | 24 (25.0%) |
| 35 to 44 Years | 225 (77.3%) | 19 (8.4%) |
| 45 to 54 Years | 190 (66.9%) | 0 (0.0%) |
| 55 to 59 Years | 148 (55.4%) | 0 (0.0%) |
| 60 to 64 Years | 127 (38.0%) | 0 (0.0%) |
| 65 to 74 Years | 62 (13.6%) | 0 (0.0%) |
| 75 Years and over | 0 (0.0%) | 0 (0.0%) |
| Total | 1,109 (40.0%) | 94 (8.5%) |
Employment Status by Educational Attainment in Clifton Forge
According to labor force statistics for Clifton Forge, 58.9% of individuals (988) out of the total population between 25 and 64 years of age (1,678) are in the labor force, with 8.7% or 86 of them being unemployed. The group with the highest labor force participation rate are those with the educational attainment of college / associate degree, with 78.4% or 404 individuals in the labor force. Within the labor force, individuals with less than high school education have the highest percentage of unemployment, with 50.0% or 51 of them being unemployed.
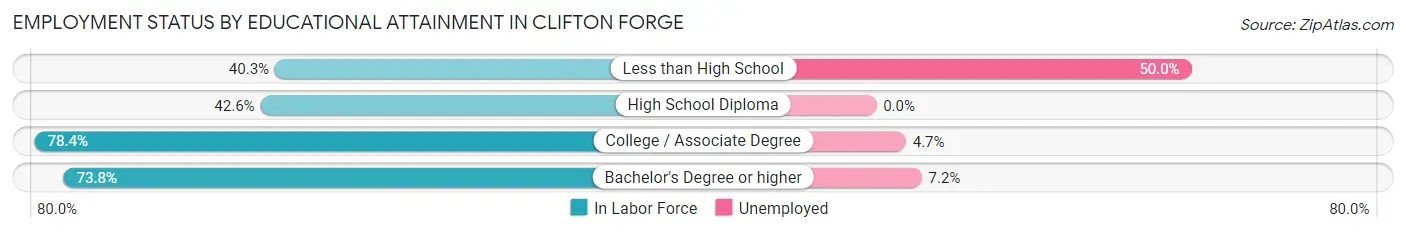
| Educational Attainment | In Labor Force | Unemployed |
| Less than High School | 102 (40.3%) | 126 (50.0%) |
| High School Diploma | 259 (42.6%) | 0 (0.0%) |
| College / Associate Degree | 404 (78.4%) | 24 (4.7%) |
| Bachelor's Degree or higher | 223 (73.8%) | 22 (7.2%) |
| Total | 988 (58.9%) | 146 (8.7%) |
Employment Occupations by Sex in Clifton Forge
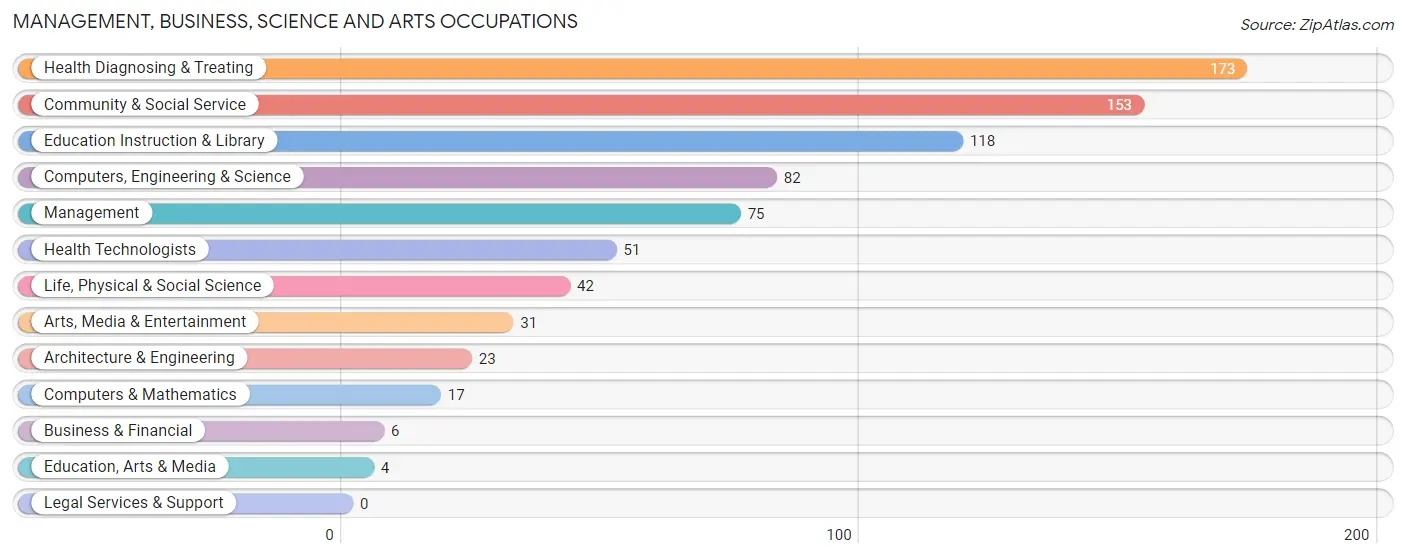
Management, Business, Science and Arts Occupations
The most common Management, Business, Science and Arts occupations in Clifton Forge are Health Diagnosing & Treating (173 | 17.1%), Community & Social Service (153 | 15.1%), Education Instruction & Library (118 | 11.6%), Computers, Engineering & Science (82 | 8.1%), and Management (75 | 7.4%).
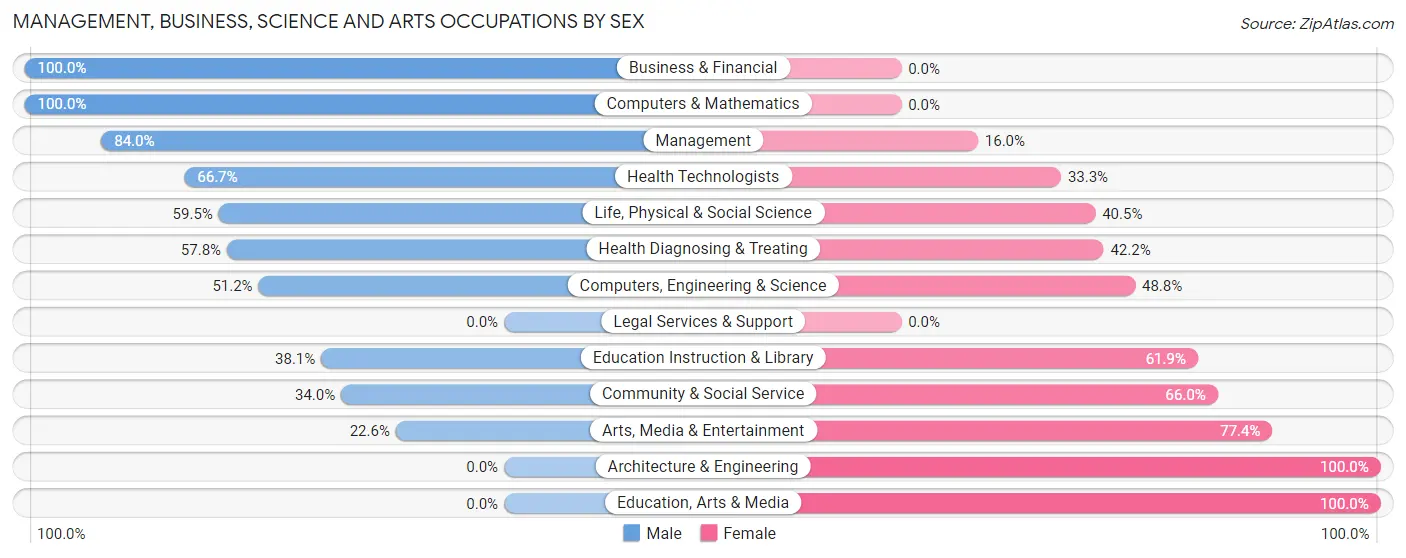
Management, Business, Science and Arts Occupations by Sex
Within the Management, Business, Science and Arts occupations in Clifton Forge, the most male-oriented occupations are Business & Financial (100.0%), Computers & Mathematics (100.0%), and Management (84.0%), while the most female-oriented occupations are Architecture & Engineering (100.0%), Education, Arts & Media (100.0%), and Arts, Media & Entertainment (77.4%).
| Occupation | Male | Female |
| Management | 63 (84.0%) | 12 (16.0%) |
| Business & Financial | 6 (100.0%) | 0 (0.0%) |
| Computers, Engineering & Science | 42 (51.2%) | 40 (48.8%) |
| Computers & Mathematics | 17 (100.0%) | 0 (0.0%) |
| Architecture & Engineering | 0 (0.0%) | 23 (100.0%) |
| Life, Physical & Social Science | 25 (59.5%) | 17 (40.5%) |
| Community & Social Service | 52 (34.0%) | 101 (66.0%) |
| Education, Arts & Media | 0 (0.0%) | 4 (100.0%) |
| Legal Services & Support | 0 (0.0%) | 0 (0.0%) |
| Education Instruction & Library | 45 (38.1%) | 73 (61.9%) |
| Arts, Media & Entertainment | 7 (22.6%) | 24 (77.4%) |
| Health Diagnosing & Treating | 100 (57.8%) | 73 (42.2%) |
| Health Technologists | 34 (66.7%) | 17 (33.3%) |
| Total (Category) | 263 (53.8%) | 226 (46.2%) |
| Total (Overall) | 594 (58.6%) | 420 (41.4%) |
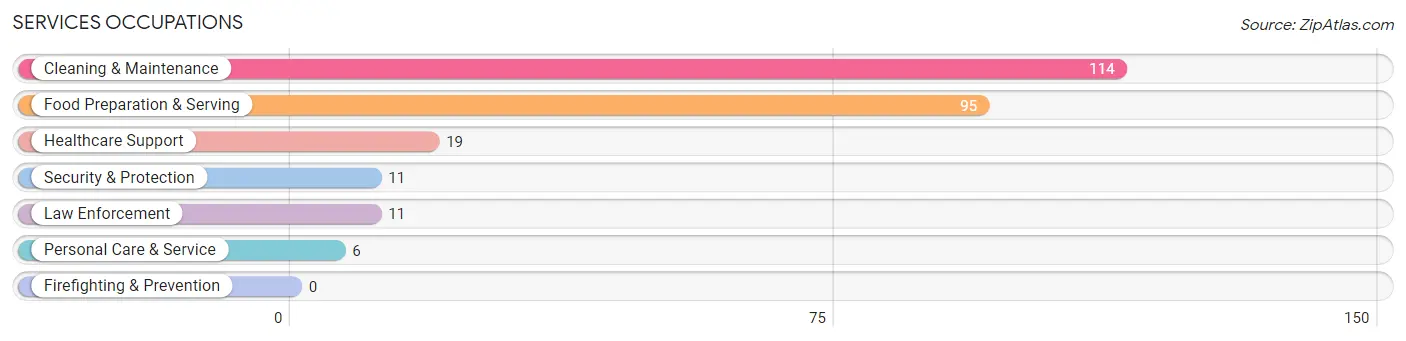
Services Occupations
The most common Services occupations in Clifton Forge are Cleaning & Maintenance (114 | 11.2%), Food Preparation & Serving (95 | 9.4%), Healthcare Support (19 | 1.9%), Security & Protection (11 | 1.1%), and Law Enforcement (11 | 1.1%).
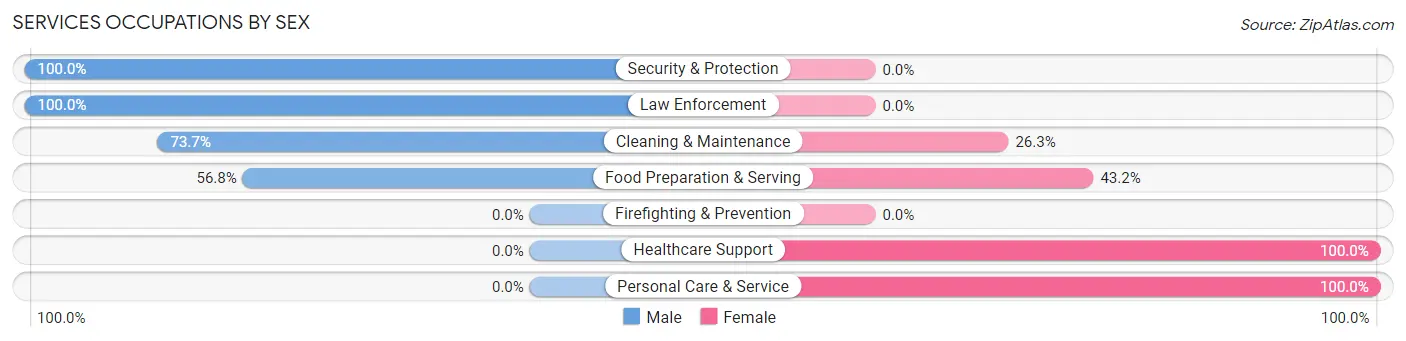
Services Occupations by Sex
Within the Services occupations in Clifton Forge, the most male-oriented occupations are Security & Protection (100.0%), Law Enforcement (100.0%), and Cleaning & Maintenance (73.7%), while the most female-oriented occupations are Healthcare Support (100.0%), Personal Care & Service (100.0%), and Food Preparation & Serving (43.2%).
| Occupation | Male | Female |
| Healthcare Support | 0 (0.0%) | 19 (100.0%) |
| Security & Protection | 11 (100.0%) | 0 (0.0%) |
| Firefighting & Prevention | 0 (0.0%) | 0 (0.0%) |
| Law Enforcement | 11 (100.0%) | 0 (0.0%) |
| Food Preparation & Serving | 54 (56.8%) | 41 (43.2%) |
| Cleaning & Maintenance | 84 (73.7%) | 30 (26.3%) |
| Personal Care & Service | 0 (0.0%) | 6 (100.0%) |
| Total (Category) | 149 (60.8%) | 96 (39.2%) |
| Total (Overall) | 594 (58.6%) | 420 (41.4%) |
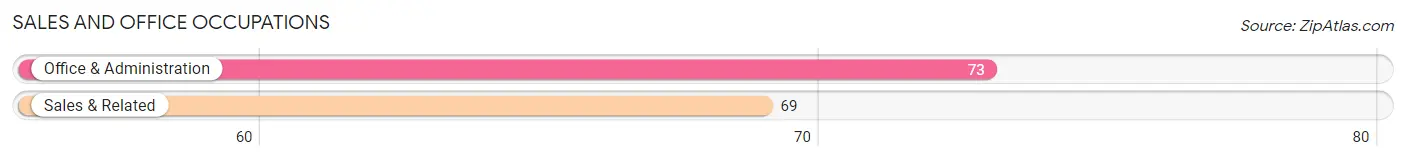
Sales and Office Occupations
The most common Sales and Office occupations in Clifton Forge are Office & Administration (73 | 7.2%), and Sales & Related (69 | 6.8%).
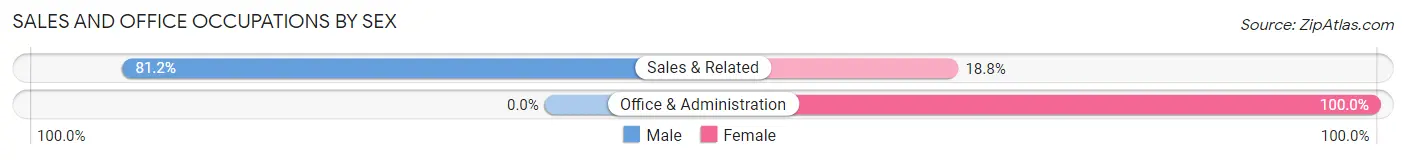
Sales and Office Occupations by Sex
| Occupation | Male | Female |
| Sales & Related | 56 (81.2%) | 13 (18.8%) |
| Office & Administration | 0 (0.0%) | 73 (100.0%) |
| Total (Category) | 56 (39.4%) | 86 (60.6%) |
| Total (Overall) | 594 (58.6%) | 420 (41.4%) |
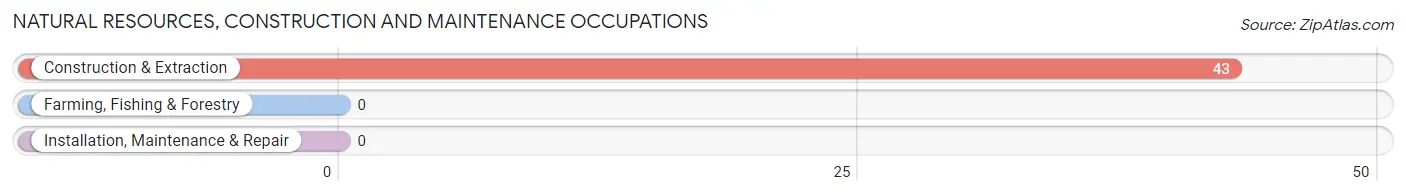
Natural Resources, Construction and Maintenance Occupations
The most common Natural Resources, Construction and Maintenance occupations in Clifton Forge are , and Construction & Extraction (43 | 4.2%).
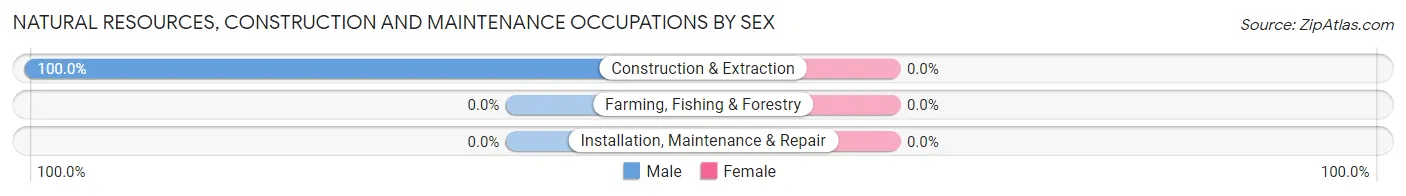
Natural Resources, Construction and Maintenance Occupations by Sex
| Occupation | Male | Female |
| Farming, Fishing & Forestry | 0 (0.0%) | 0 (0.0%) |
| Construction & Extraction | 43 (100.0%) | 0 (0.0%) |
| Installation, Maintenance & Repair | 0 (0.0%) | 0 (0.0%) |
| Total (Category) | 43 (100.0%) | 0 (0.0%) |
| Total (Overall) | 594 (58.6%) | 420 (41.4%) |
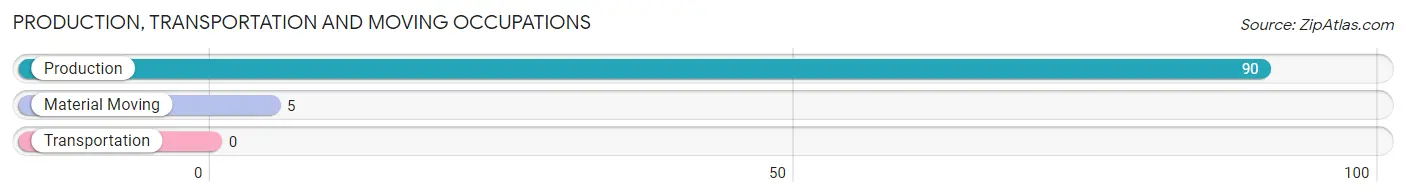
Production, Transportation and Moving Occupations
The most common Production, Transportation and Moving occupations in Clifton Forge are Production (90 | 8.9%), and Material Moving (5 | 0.5%).
Production, Transportation and Moving Occupations by Sex
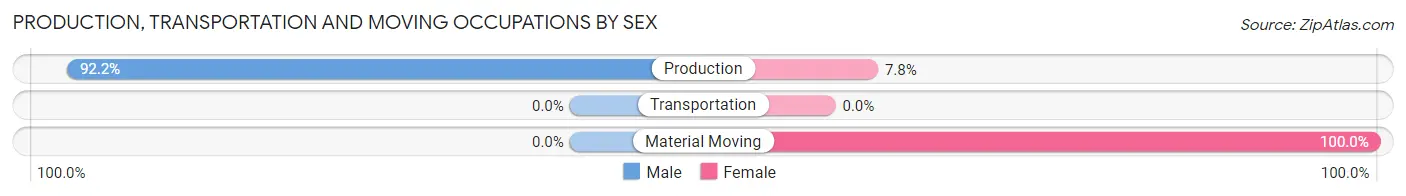
| Occupation | Male | Female |
| Production | 83 (92.2%) | 7 (7.8%) |
| Transportation | 0 (0.0%) | 0 (0.0%) |
| Material Moving | 0 (0.0%) | 5 (100.0%) |
| Total (Category) | 83 (87.4%) | 12 (12.6%) |
| Total (Overall) | 594 (58.6%) | 420 (41.4%) |
Employment Industries by Sex in Clifton Forge
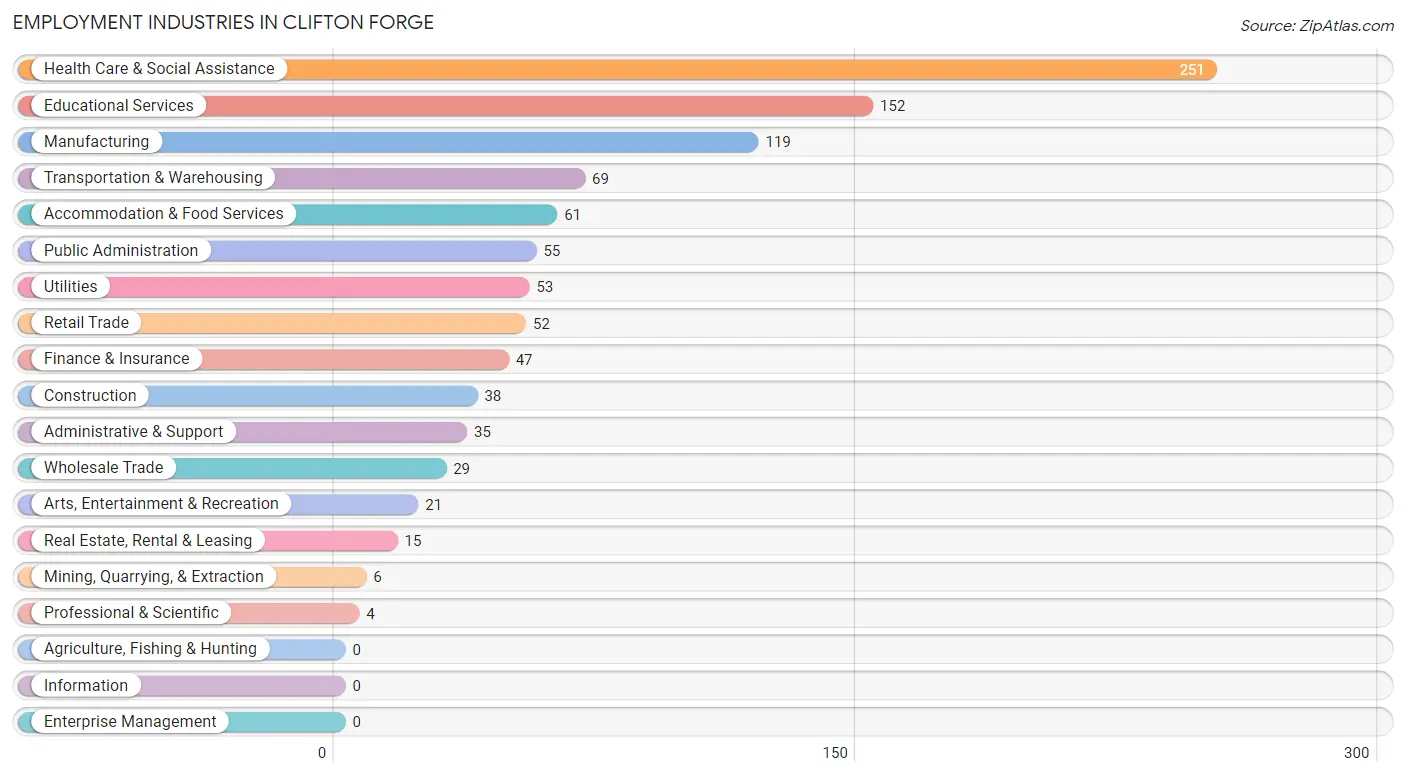
Employment Industries in Clifton Forge
The major employment industries in Clifton Forge include Health Care & Social Assistance (251 | 24.7%), Educational Services (152 | 15.0%), Manufacturing (119 | 11.7%), Transportation & Warehousing (69 | 6.8%), and Accommodation & Food Services (61 | 6.0%).
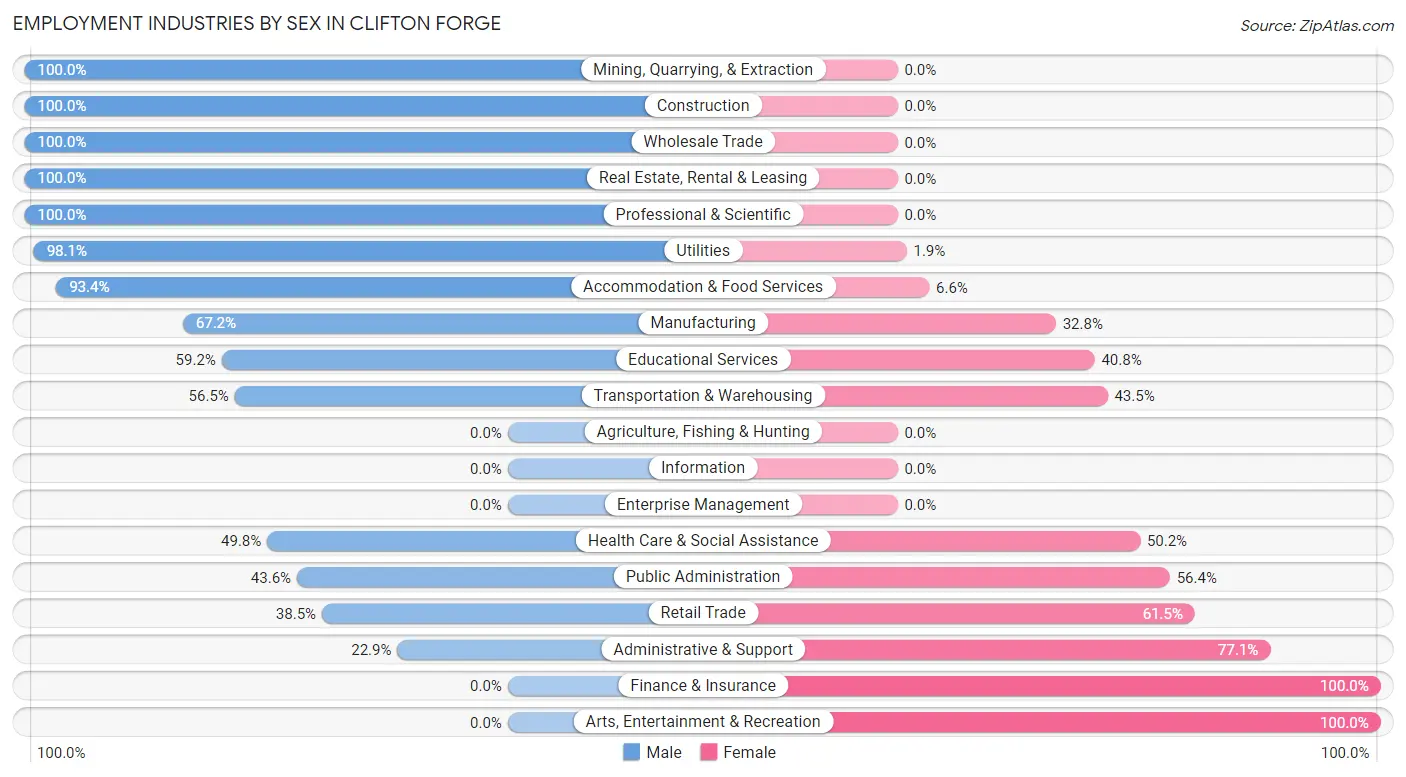
Employment Industries by Sex in Clifton Forge
The Clifton Forge industries that see more men than women are Mining, Quarrying, & Extraction (100.0%), Construction (100.0%), and Wholesale Trade (100.0%), whereas the industries that tend to have a higher number of women are Finance & Insurance (100.0%), Arts, Entertainment & Recreation (100.0%), and Administrative & Support (77.1%).
| Industry | Male | Female |
| Agriculture, Fishing & Hunting | 0 (0.0%) | 0 (0.0%) |
| Mining, Quarrying, & Extraction | 6 (100.0%) | 0 (0.0%) |
| Construction | 38 (100.0%) | 0 (0.0%) |
| Manufacturing | 80 (67.2%) | 39 (32.8%) |
| Wholesale Trade | 29 (100.0%) | 0 (0.0%) |
| Retail Trade | 20 (38.5%) | 32 (61.5%) |
| Transportation & Warehousing | 39 (56.5%) | 30 (43.5%) |
| Utilities | 52 (98.1%) | 1 (1.9%) |
| Information | 0 (0.0%) | 0 (0.0%) |
| Finance & Insurance | 0 (0.0%) | 47 (100.0%) |
| Real Estate, Rental & Leasing | 15 (100.0%) | 0 (0.0%) |
| Professional & Scientific | 4 (100.0%) | 0 (0.0%) |
| Enterprise Management | 0 (0.0%) | 0 (0.0%) |
| Administrative & Support | 8 (22.9%) | 27 (77.1%) |
| Educational Services | 90 (59.2%) | 62 (40.8%) |
| Health Care & Social Assistance | 125 (49.8%) | 126 (50.2%) |
| Arts, Entertainment & Recreation | 0 (0.0%) | 21 (100.0%) |
| Accommodation & Food Services | 57 (93.4%) | 4 (6.6%) |
| Public Administration | 24 (43.6%) | 31 (56.4%) |
| Total | 594 (58.6%) | 420 (41.4%) |
Education in Clifton Forge
School Enrollment in Clifton Forge
The most common levels of schooling among the 677 students in Clifton Forge are middle school (306 | 45.2%), elementary school (104 | 15.4%), and high school (87 | 12.9%).
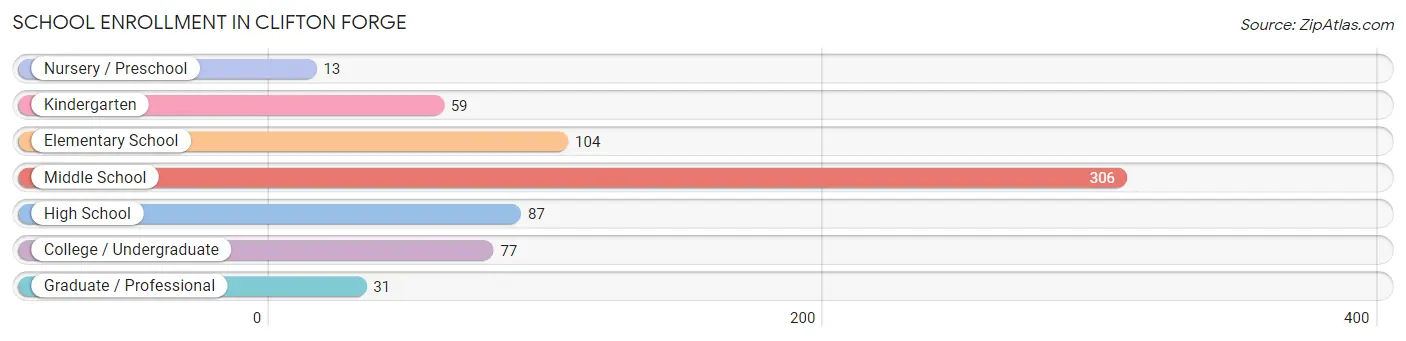
| School Level | # Students | % Students |
| Nursery / Preschool | 13 | 1.9% |
| Kindergarten | 59 | 8.7% |
| Elementary School | 104 | 15.4% |
| Middle School | 306 | 45.2% |
| High School | 87 | 12.9% |
| College / Undergraduate | 77 | 11.4% |
| Graduate / Professional | 31 | 4.6% |
| Total | 677 | 100.0% |
School Enrollment by Age by Funding Source in Clifton Forge
Out of a total of 677 students who are enrolled in schools in Clifton Forge, 36 (5.3%) attend a private institution, while the remaining 641 (94.7%) are enrolled in public schools. The age group of 25 to 34 year olds has the highest likelihood of being enrolled in private schools, with 16 (37.2% in the age bracket) enrolled. Conversely, the age group of 10 to 14 year olds has the lowest likelihood of being enrolled in a private school, with 350 (100.0% in the age bracket) attending a public institution.
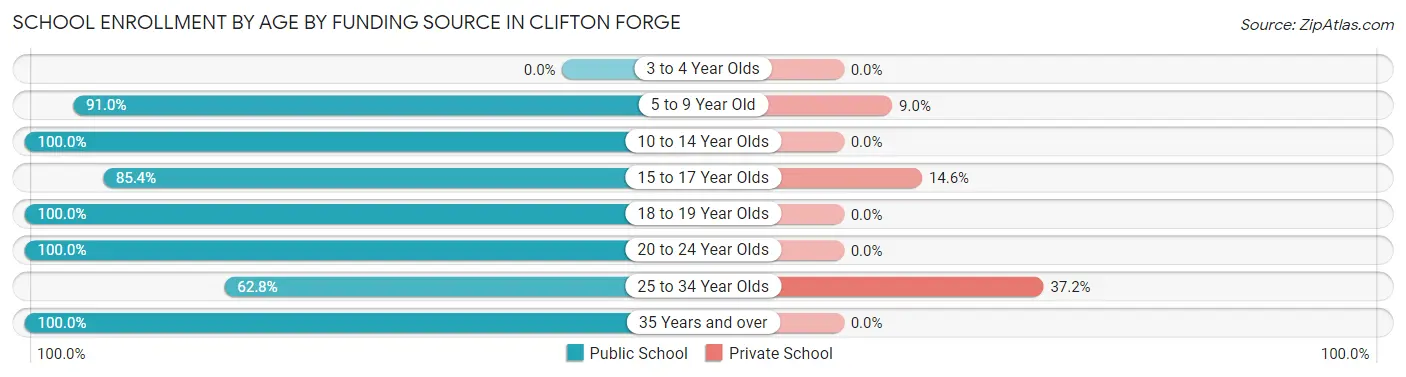
| Age Bracket | Public School | Private School |
| 3 to 4 Year Olds | 0 (0.0%) | 0 (0.0%) |
| 5 to 9 Year Old | 131 (91.0%) | 13 (9.0%) |
| 10 to 14 Year Olds | 350 (100.0%) | 0 (0.0%) |
| 15 to 17 Year Olds | 41 (85.4%) | 7 (14.6%) |
| 18 to 19 Year Olds | 20 (100.0%) | 0 (0.0%) |
| 20 to 24 Year Olds | 57 (100.0%) | 0 (0.0%) |
| 25 to 34 Year Olds | 27 (62.8%) | 16 (37.2%) |
| 35 Years and over | 15 (100.0%) | 0 (0.0%) |
| Total | 641 (94.7%) | 36 (5.3%) |
Educational Attainment by Field of Study in Clifton Forge
Education (79 | 15.0%), bio, nature & agricultural (75 | 14.2%), social sciences (64 | 12.1%), psychology (61 | 11.6%), and visual & performing arts (53 | 10.0%) are the most common fields of study among 528 individuals in Clifton Forge who have obtained a bachelor's degree or higher.
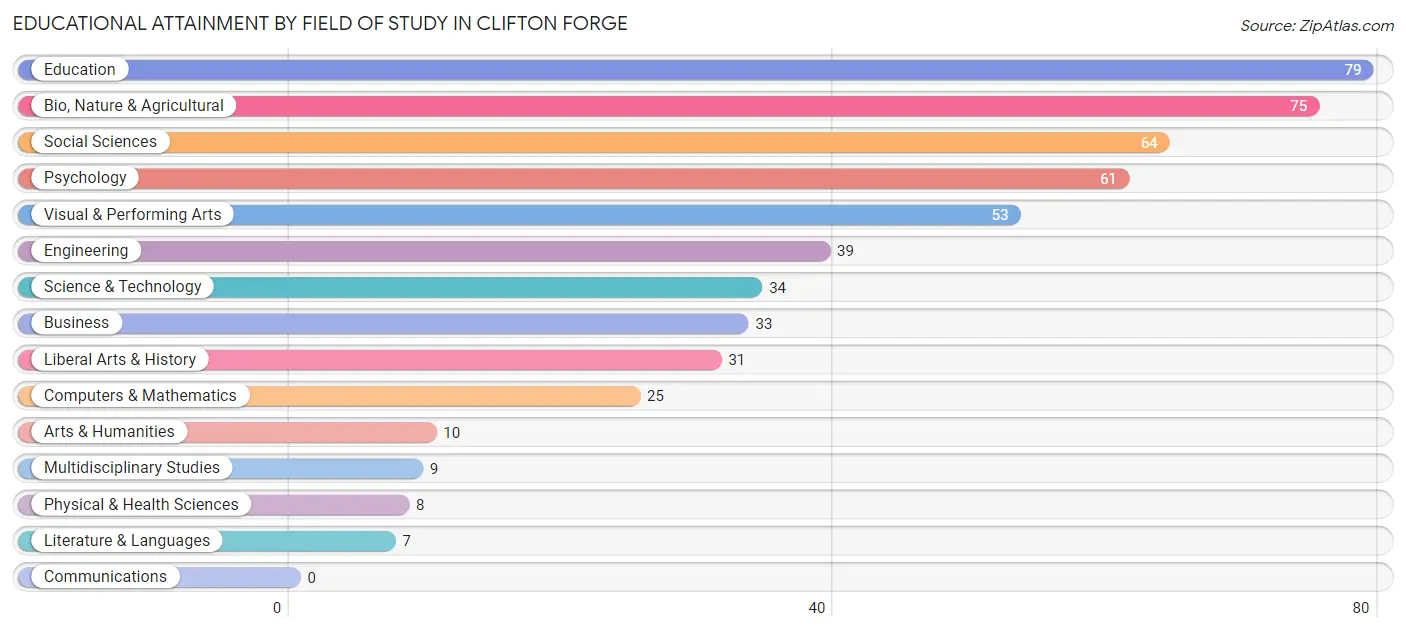
| Field of Study | # Graduates | % Graduates |
| Computers & Mathematics | 25 | 4.7% |
| Bio, Nature & Agricultural | 75 | 14.2% |
| Physical & Health Sciences | 8 | 1.5% |
| Psychology | 61 | 11.6% |
| Social Sciences | 64 | 12.1% |
| Engineering | 39 | 7.4% |
| Multidisciplinary Studies | 9 | 1.7% |
| Science & Technology | 34 | 6.4% |
| Business | 33 | 6.2% |
| Education | 79 | 15.0% |
| Literature & Languages | 7 | 1.3% |
| Liberal Arts & History | 31 | 5.9% |
| Visual & Performing Arts | 53 | 10.0% |
| Communications | 0 | 0.0% |
| Arts & Humanities | 10 | 1.9% |
| Total | 528 | 100.0% |
Transportation & Commute in Clifton Forge
Vehicle Availability by Sex in Clifton Forge
The most prevalent vehicle ownership categories in Clifton Forge are males with 2 vehicles (206, accounting for 36.2%) and females with 2 vehicles (68, making up 49.3%).
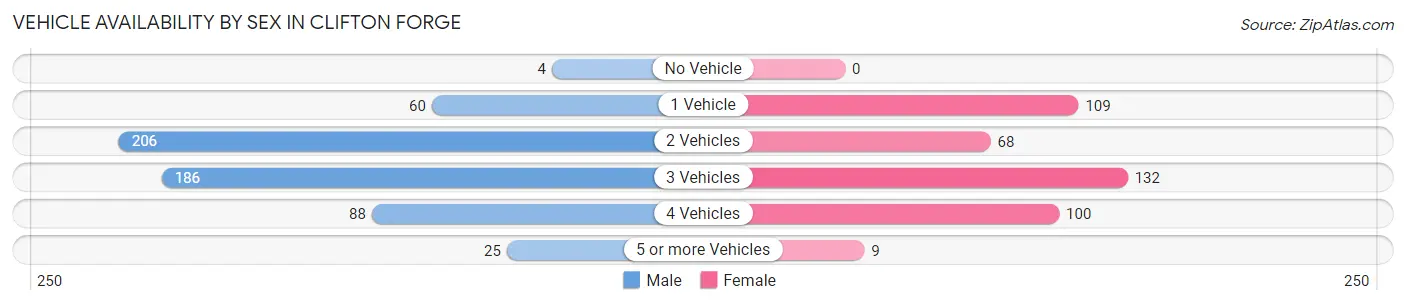
| Vehicles Available | Male | Female |
| No Vehicle | 4 (0.7%) | 0 (0.0%) |
| 1 Vehicle | 60 (10.5%) | 109 (26.1%) |
| 2 Vehicles | 206 (36.2%) | 68 (16.3%) |
| 3 Vehicles | 186 (32.7%) | 132 (31.6%) |
| 4 Vehicles | 88 (15.5%) | 100 (23.9%) |
| 5 or more Vehicles | 25 (4.4%) | 9 (2.1%) |
| Total | 569 (100.0%) | 418 (100.0%) |
Commute Time in Clifton Forge
The most frequently occuring commute durations in Clifton Forge are 15 to 19 minutes (220 commuters, 23.1%), 20 to 24 minutes (157 commuters, 16.5%), and 10 to 14 minutes (131 commuters, 13.8%).
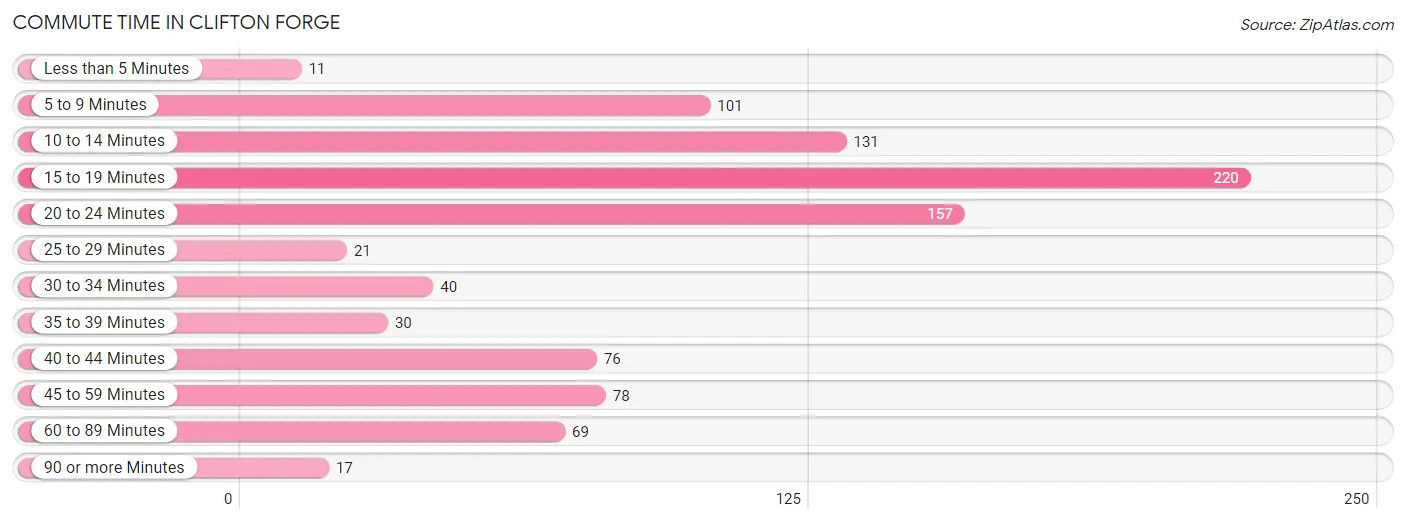
| Commute Time | # Commuters | % Commuters |
| Less than 5 Minutes | 11 | 1.2% |
| 5 to 9 Minutes | 101 | 10.6% |
| 10 to 14 Minutes | 131 | 13.8% |
| 15 to 19 Minutes | 220 | 23.1% |
| 20 to 24 Minutes | 157 | 16.5% |
| 25 to 29 Minutes | 21 | 2.2% |
| 30 to 34 Minutes | 40 | 4.2% |
| 35 to 39 Minutes | 30 | 3.2% |
| 40 to 44 Minutes | 76 | 8.0% |
| 45 to 59 Minutes | 78 | 8.2% |
| 60 to 89 Minutes | 69 | 7.3% |
| 90 or more Minutes | 17 | 1.8% |
Commute Time by Sex in Clifton Forge
The most common commute times in Clifton Forge are 15 to 19 minutes (146 commuters, 26.9%) for males and 15 to 19 minutes (74 commuters, 18.1%) for females.
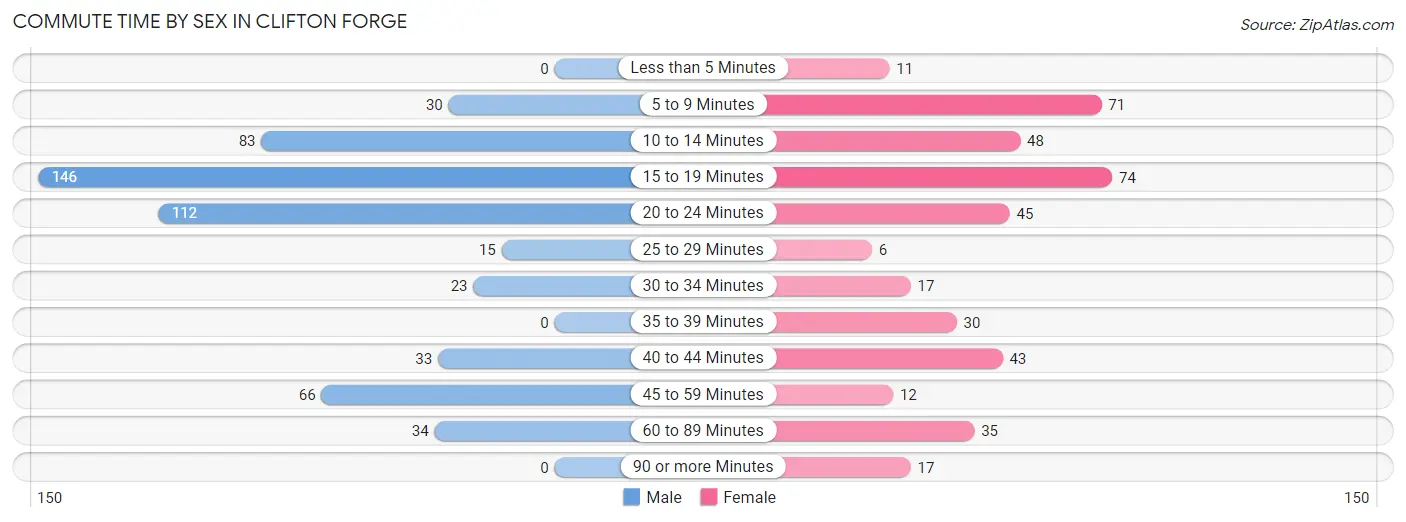
| Commute Time | Male | Female |
| Less than 5 Minutes | 0 (0.0%) | 11 (2.7%) |
| 5 to 9 Minutes | 30 (5.5%) | 71 (17.4%) |
| 10 to 14 Minutes | 83 (15.3%) | 48 (11.7%) |
| 15 to 19 Minutes | 146 (26.9%) | 74 (18.1%) |
| 20 to 24 Minutes | 112 (20.7%) | 45 (11.0%) |
| 25 to 29 Minutes | 15 (2.8%) | 6 (1.5%) |
| 30 to 34 Minutes | 23 (4.2%) | 17 (4.2%) |
| 35 to 39 Minutes | 0 (0.0%) | 30 (7.3%) |
| 40 to 44 Minutes | 33 (6.1%) | 43 (10.5%) |
| 45 to 59 Minutes | 66 (12.2%) | 12 (2.9%) |
| 60 to 89 Minutes | 34 (6.3%) | 35 (8.6%) |
| 90 or more Minutes | 0 (0.0%) | 17 (4.2%) |
Time of Departure to Work by Sex in Clifton Forge
The most frequent times of departure to work in Clifton Forge are 7:00 AM to 7:29 AM (183, 33.8%) for males and 6:00 AM to 6:29 AM (63, 15.4%) for females.
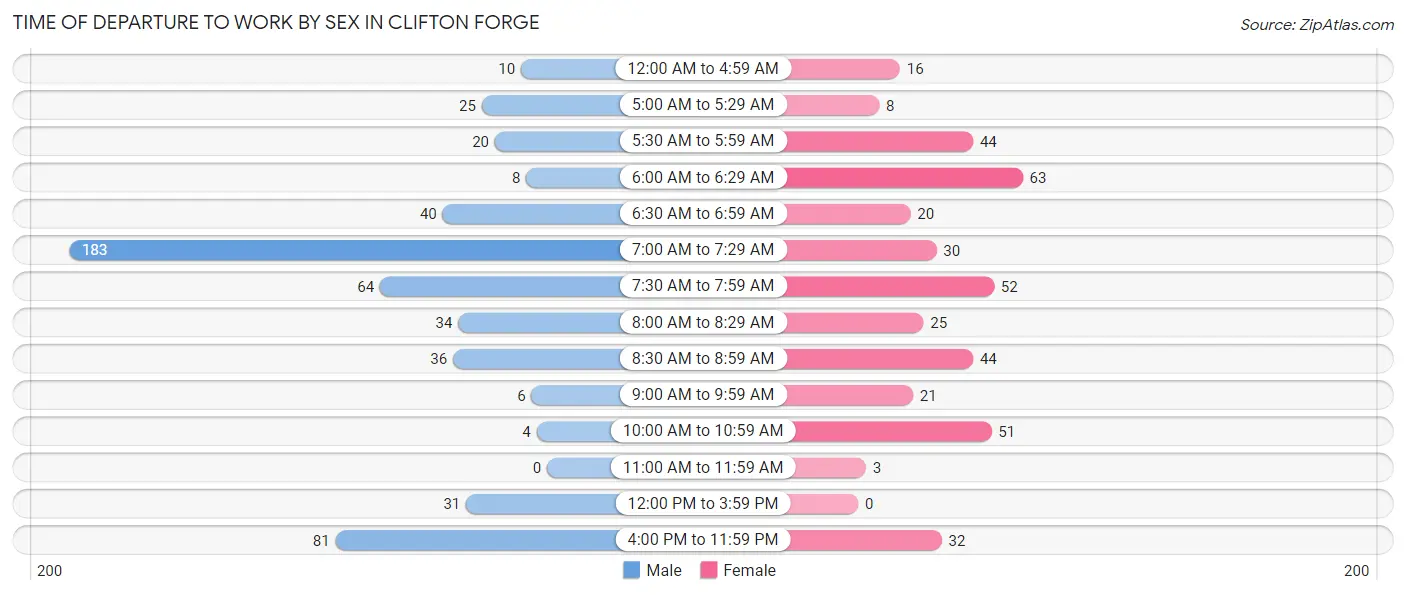
| Time of Departure | Male | Female |
| 12:00 AM to 4:59 AM | 10 (1.8%) | 16 (3.9%) |
| 5:00 AM to 5:29 AM | 25 (4.6%) | 8 (2.0%) |
| 5:30 AM to 5:59 AM | 20 (3.7%) | 44 (10.8%) |
| 6:00 AM to 6:29 AM | 8 (1.5%) | 63 (15.4%) |
| 6:30 AM to 6:59 AM | 40 (7.4%) | 20 (4.9%) |
| 7:00 AM to 7:29 AM | 183 (33.8%) | 30 (7.3%) |
| 7:30 AM to 7:59 AM | 64 (11.8%) | 52 (12.7%) |
| 8:00 AM to 8:29 AM | 34 (6.3%) | 25 (6.1%) |
| 8:30 AM to 8:59 AM | 36 (6.6%) | 44 (10.8%) |
| 9:00 AM to 9:59 AM | 6 (1.1%) | 21 (5.1%) |
| 10:00 AM to 10:59 AM | 4 (0.7%) | 51 (12.5%) |
| 11:00 AM to 11:59 AM | 0 (0.0%) | 3 (0.7%) |
| 12:00 PM to 3:59 PM | 31 (5.7%) | 0 (0.0%) |
| 4:00 PM to 11:59 PM | 81 (14.9%) | 32 (7.8%) |
| Total | 542 (100.0%) | 409 (100.0%) |
Housing Occupancy in Clifton Forge
Occupancy by Ownership in Clifton Forge
Of the total 1,427 dwellings in Clifton Forge, owner-occupied units account for 938 (65.7%), while renter-occupied units make up 489 (34.3%).
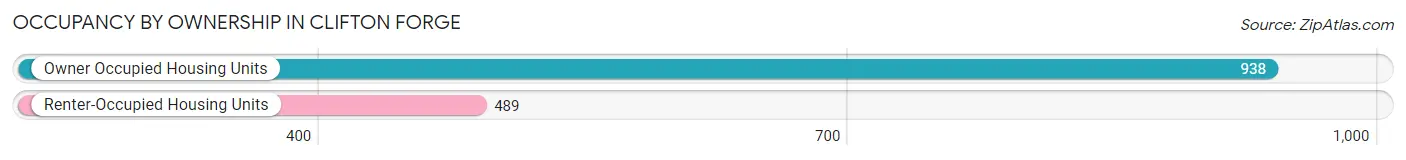
| Occupancy | # Housing Units | % Housing Units |
| Owner Occupied Housing Units | 938 | 65.7% |
| Renter-Occupied Housing Units | 489 | 34.3% |
| Total Occupied Housing Units | 1,427 | 100.0% |
Occupancy by Household Size in Clifton Forge
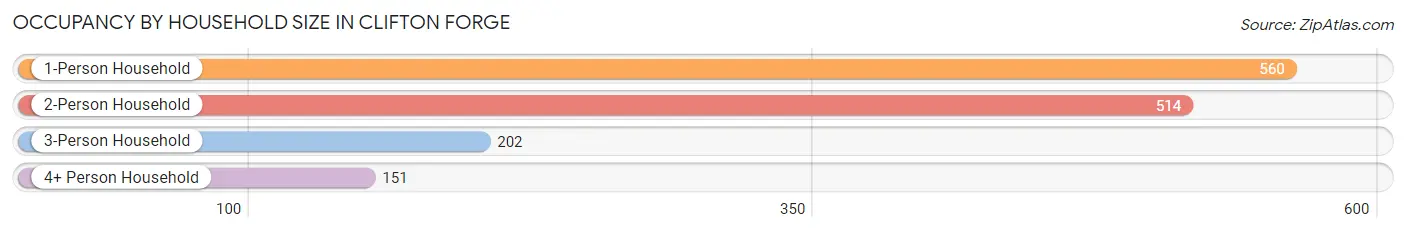
| Household Size | # Housing Units | % Housing Units |
| 1-Person Household | 560 | 39.2% |
| 2-Person Household | 514 | 36.0% |
| 3-Person Household | 202 | 14.2% |
| 4+ Person Household | 151 | 10.6% |
| Total Housing Units | 1,427 | 100.0% |
Occupancy by Ownership by Household Size in Clifton Forge
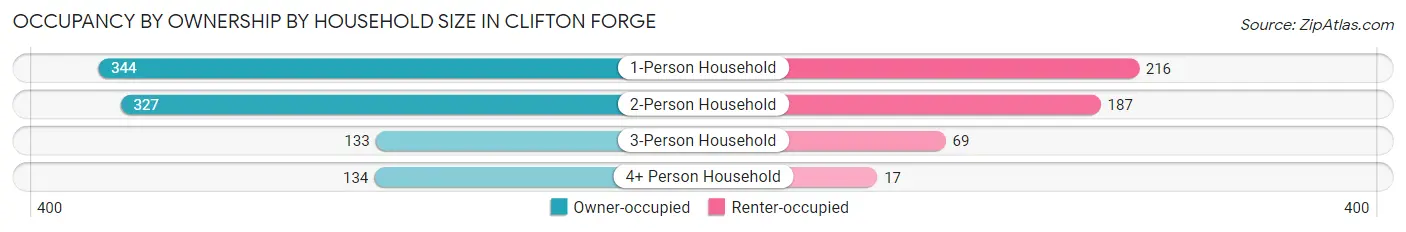
| Household Size | Owner-occupied | Renter-occupied |
| 1-Person Household | 344 (61.4%) | 216 (38.6%) |
| 2-Person Household | 327 (63.6%) | 187 (36.4%) |
| 3-Person Household | 133 (65.8%) | 69 (34.2%) |
| 4+ Person Household | 134 (88.7%) | 17 (11.3%) |
| Total Housing Units | 938 (65.7%) | 489 (34.3%) |
Occupancy by Educational Attainment in Clifton Forge
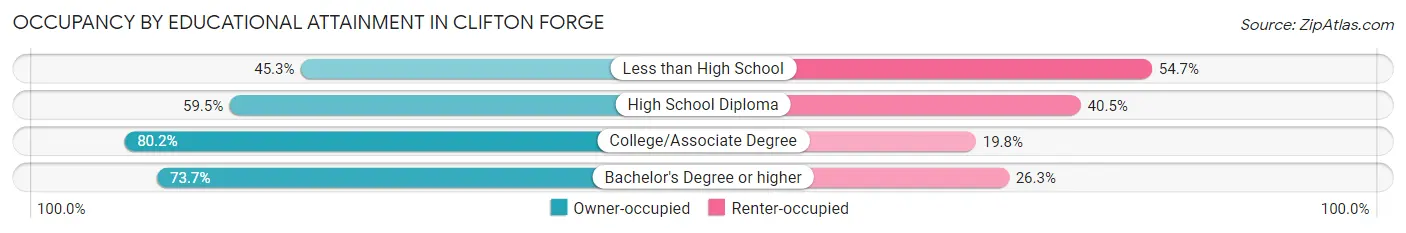
| Household Size | Owner-occupied | Renter-occupied |
| Less than High School | 73 (45.3%) | 88 (54.7%) |
| High School Diploma | 377 (59.5%) | 257 (40.5%) |
| College/Associate Degree | 272 (80.2%) | 67 (19.8%) |
| Bachelor's Degree or higher | 216 (73.7%) | 77 (26.3%) |
Occupancy by Age of Householder in Clifton Forge
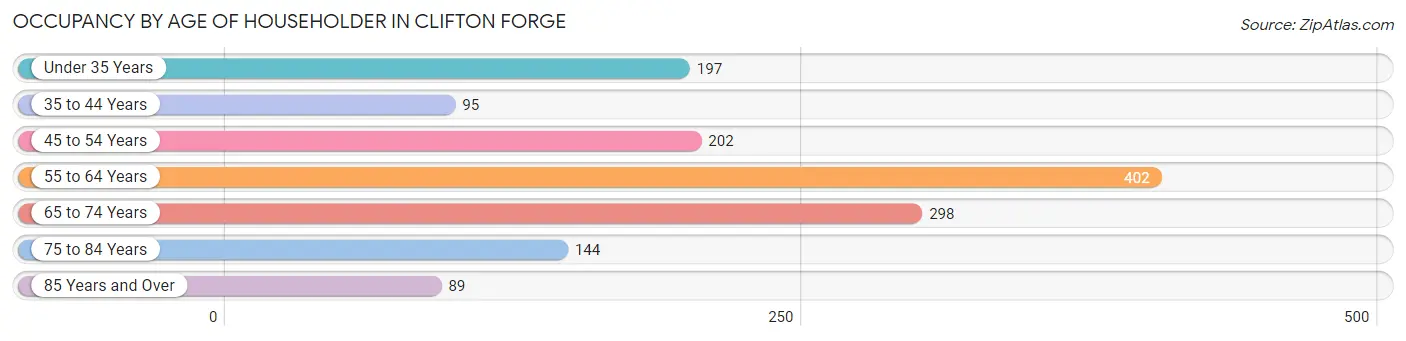
| Age Bracket | # Households | % Households |
| Under 35 Years | 197 | 13.8% |
| 35 to 44 Years | 95 | 6.7% |
| 45 to 54 Years | 202 | 14.2% |
| 55 to 64 Years | 402 | 28.2% |
| 65 to 74 Years | 298 | 20.9% |
| 75 to 84 Years | 144 | 10.1% |
| 85 Years and Over | 89 | 6.2% |
| Total | 1,427 | 100.0% |
Housing Finances in Clifton Forge
Median Income by Occupancy in Clifton Forge
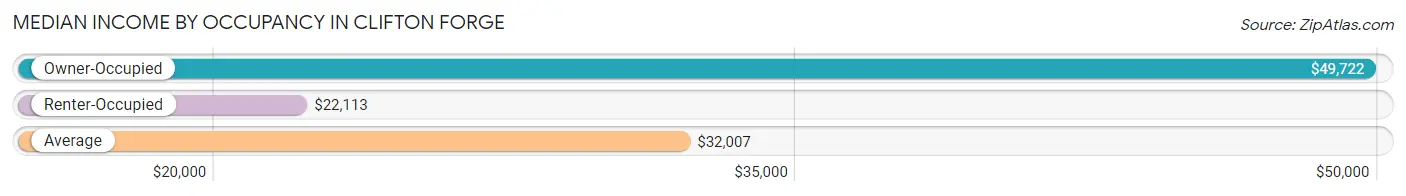
| Occupancy Type | # Households | Median Income |
| Owner-Occupied | 938 (65.7%) | $49,722 |
| Renter-Occupied | 489 (34.3%) | $22,113 |
| Average | 1,427 (100.0%) | $32,007 |
Occupancy by Householder Income Bracket in Clifton Forge
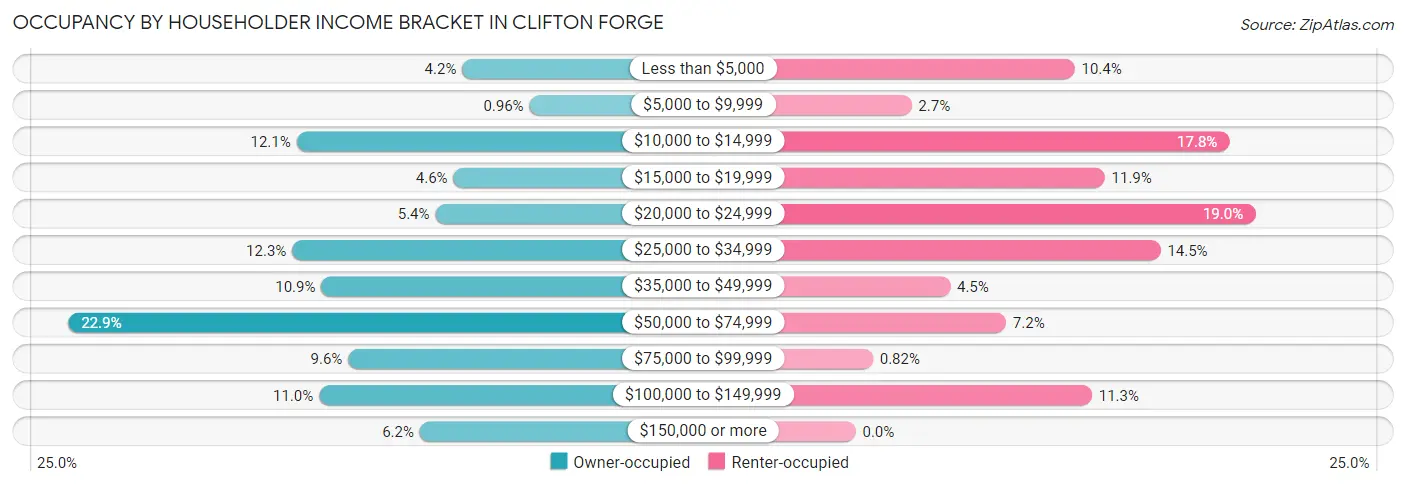
| Income Bracket | Owner-occupied | Renter-occupied |
| Less than $5,000 | 39 (4.2%) | 51 (10.4%) |
| $5,000 to $9,999 | 9 (1.0%) | 13 (2.7%) |
| $10,000 to $14,999 | 113 (12.0%) | 87 (17.8%) |
| $15,000 to $19,999 | 43 (4.6%) | 58 (11.9%) |
| $20,000 to $24,999 | 51 (5.4%) | 93 (19.0%) |
| $25,000 to $34,999 | 115 (12.3%) | 71 (14.5%) |
| $35,000 to $49,999 | 102 (10.9%) | 22 (4.5%) |
| $50,000 to $74,999 | 215 (22.9%) | 35 (7.2%) |
| $75,000 to $99,999 | 90 (9.6%) | 4 (0.8%) |
| $100,000 to $149,999 | 103 (11.0%) | 55 (11.3%) |
| $150,000 or more | 58 (6.2%) | 0 (0.0%) |
| Total | 938 (100.0%) | 489 (100.0%) |
Monthly Housing Cost Tiers in Clifton Forge
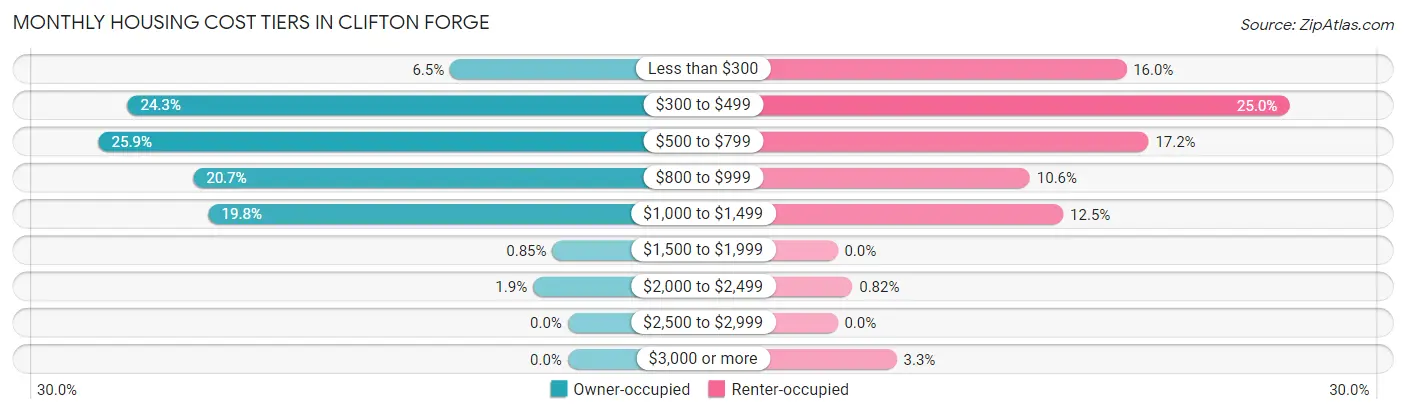
| Monthly Cost | Owner-occupied | Renter-occupied |
| Less than $300 | 61 (6.5%) | 78 (16.0%) |
| $300 to $499 | 228 (24.3%) | 122 (24.9%) |
| $500 to $799 | 243 (25.9%) | 84 (17.2%) |
| $800 to $999 | 194 (20.7%) | 52 (10.6%) |
| $1,000 to $1,499 | 186 (19.8%) | 61 (12.5%) |
| $1,500 to $1,999 | 8 (0.9%) | 0 (0.0%) |
| $2,000 to $2,499 | 18 (1.9%) | 4 (0.8%) |
| $2,500 to $2,999 | 0 (0.0%) | 0 (0.0%) |
| $3,000 or more | 0 (0.0%) | 16 (3.3%) |
| Total | 938 (100.0%) | 489 (100.0%) |
Physical Housing Characteristics in Clifton Forge
Housing Structures in Clifton Forge
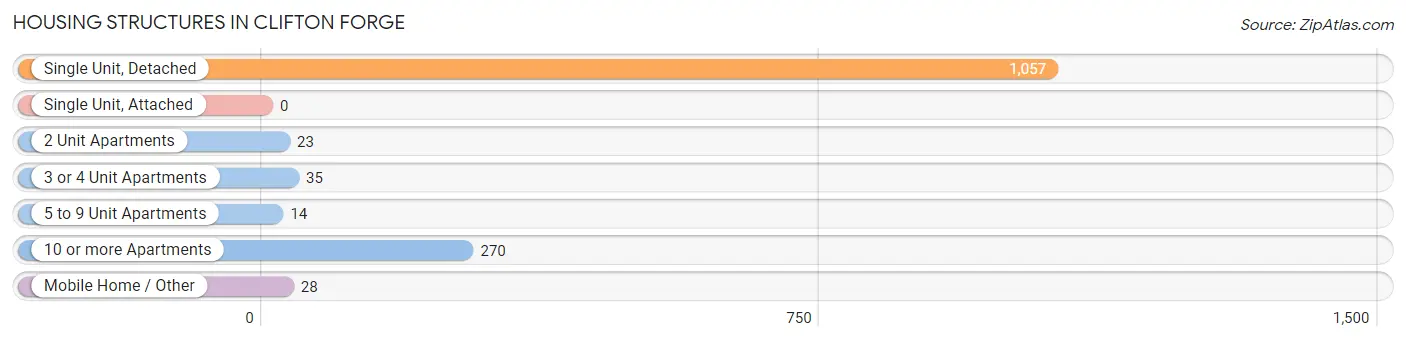
| Structure Type | # Housing Units | % Housing Units |
| Single Unit, Detached | 1,057 | 74.1% |
| Single Unit, Attached | 0 | 0.0% |
| 2 Unit Apartments | 23 | 1.6% |
| 3 or 4 Unit Apartments | 35 | 2.5% |
| 5 to 9 Unit Apartments | 14 | 1.0% |
| 10 or more Apartments | 270 | 18.9% |
| Mobile Home / Other | 28 | 2.0% |
| Total | 1,427 | 100.0% |
Housing Structures by Occupancy in Clifton Forge
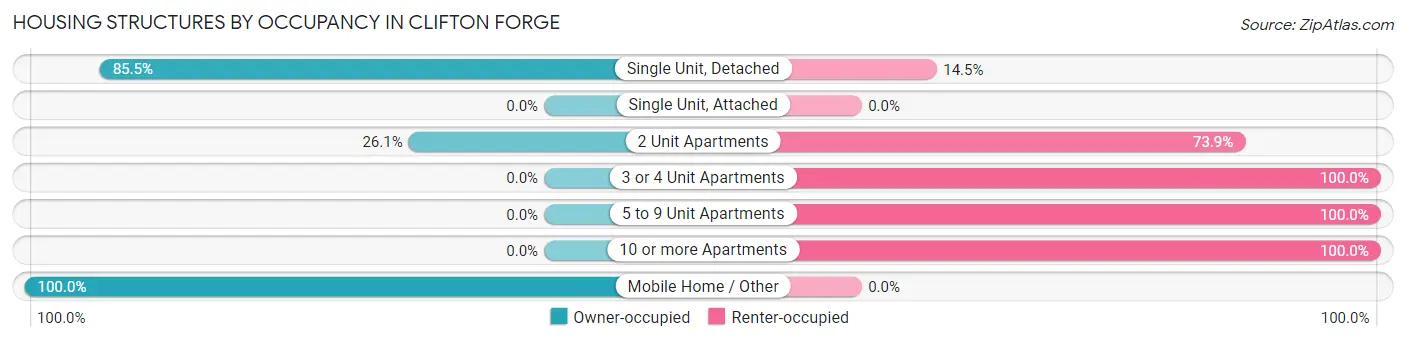
| Structure Type | Owner-occupied | Renter-occupied |
| Single Unit, Detached | 904 (85.5%) | 153 (14.5%) |
| Single Unit, Attached | 0 (0.0%) | 0 (0.0%) |
| 2 Unit Apartments | 6 (26.1%) | 17 (73.9%) |
| 3 or 4 Unit Apartments | 0 (0.0%) | 35 (100.0%) |
| 5 to 9 Unit Apartments | 0 (0.0%) | 14 (100.0%) |
| 10 or more Apartments | 0 (0.0%) | 270 (100.0%) |
| Mobile Home / Other | 28 (100.0%) | 0 (0.0%) |
| Total | 938 (65.7%) | 489 (34.3%) |
Housing Structures by Number of Rooms in Clifton Forge
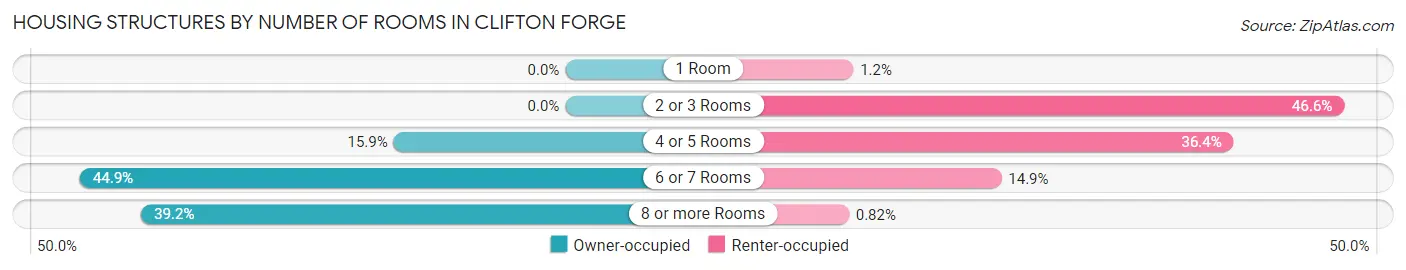
| Number of Rooms | Owner-occupied | Renter-occupied |
| 1 Room | 0 (0.0%) | 6 (1.2%) |
| 2 or 3 Rooms | 0 (0.0%) | 228 (46.6%) |
| 4 or 5 Rooms | 149 (15.9%) | 178 (36.4%) |
| 6 or 7 Rooms | 421 (44.9%) | 73 (14.9%) |
| 8 or more Rooms | 368 (39.2%) | 4 (0.8%) |
| Total | 938 (100.0%) | 489 (100.0%) |
Housing Structure by Heating Type in Clifton Forge
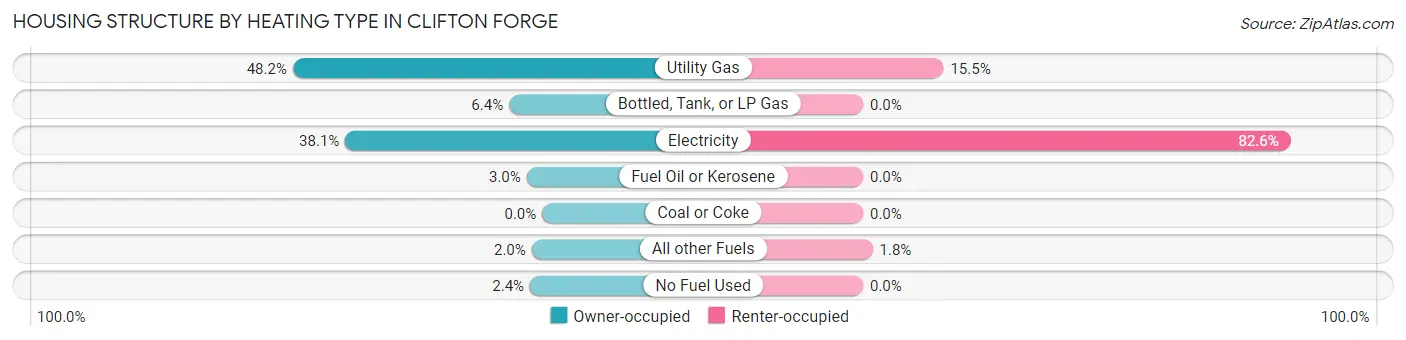
| Heating Type | Owner-occupied | Renter-occupied |
| Utility Gas | 452 (48.2%) | 76 (15.5%) |
| Bottled, Tank, or LP Gas | 60 (6.4%) | 0 (0.0%) |
| Electricity | 357 (38.1%) | 404 (82.6%) |
| Fuel Oil or Kerosene | 28 (3.0%) | 0 (0.0%) |
| Coal or Coke | 0 (0.0%) | 0 (0.0%) |
| All other Fuels | 19 (2.0%) | 9 (1.8%) |
| No Fuel Used | 22 (2.4%) | 0 (0.0%) |
| Total | 938 (100.0%) | 489 (100.0%) |
Household Vehicle Usage in Clifton Forge
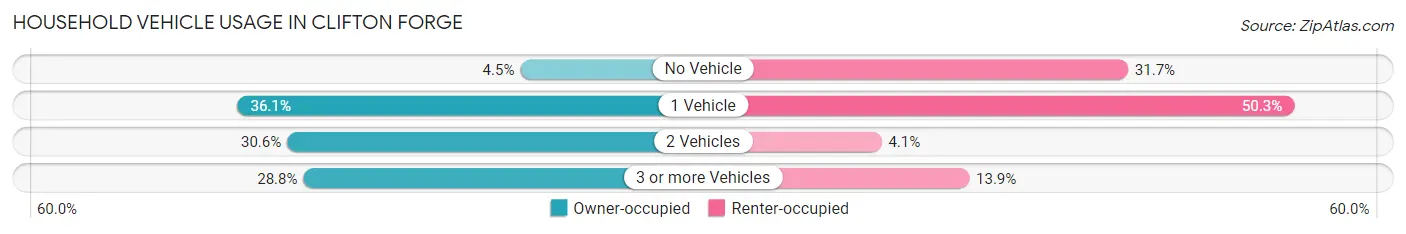
| Vehicles per Household | Owner-occupied | Renter-occupied |
| No Vehicle | 42 (4.5%) | 155 (31.7%) |
| 1 Vehicle | 339 (36.1%) | 246 (50.3%) |
| 2 Vehicles | 287 (30.6%) | 20 (4.1%) |
| 3 or more Vehicles | 270 (28.8%) | 68 (13.9%) |
| Total | 938 (100.0%) | 489 (100.0%) |
Real Estate & Mortgages in Clifton Forge
Real Estate and Mortgage Overview in Clifton Forge
| Characteristic | Without Mortgage | With Mortgage |
| Housing Units | 482 | 456 |
| Median Property Value | $92,000 | $117,700 |
| Median Household Income | $28,333 | $20 |
| Monthly Housing Costs | $453 | $0 |
| Real Estate Taxes | $729 | $13 |
Property Value by Mortgage Status in Clifton Forge
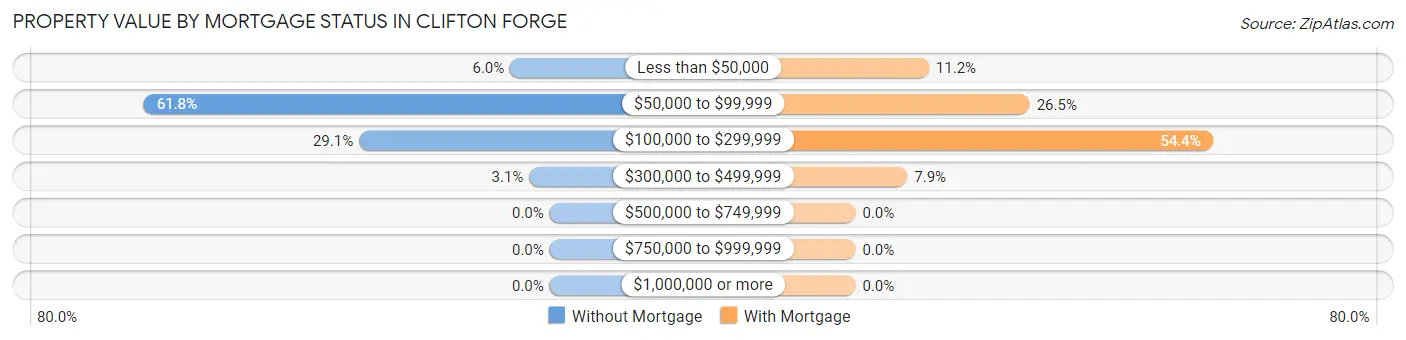
| Property Value | Without Mortgage | With Mortgage |
| Less than $50,000 | 29 (6.0%) | 51 (11.2%) |
| $50,000 to $99,999 | 298 (61.8%) | 121 (26.5%) |
| $100,000 to $299,999 | 140 (29.0%) | 248 (54.4%) |
| $300,000 to $499,999 | 15 (3.1%) | 36 (7.9%) |
| $500,000 to $749,999 | 0 (0.0%) | 0 (0.0%) |
| $750,000 to $999,999 | 0 (0.0%) | 0 (0.0%) |
| $1,000,000 or more | 0 (0.0%) | 0 (0.0%) |
| Total | 482 (100.0%) | 456 (100.0%) |
Household Income by Mortgage Status in Clifton Forge
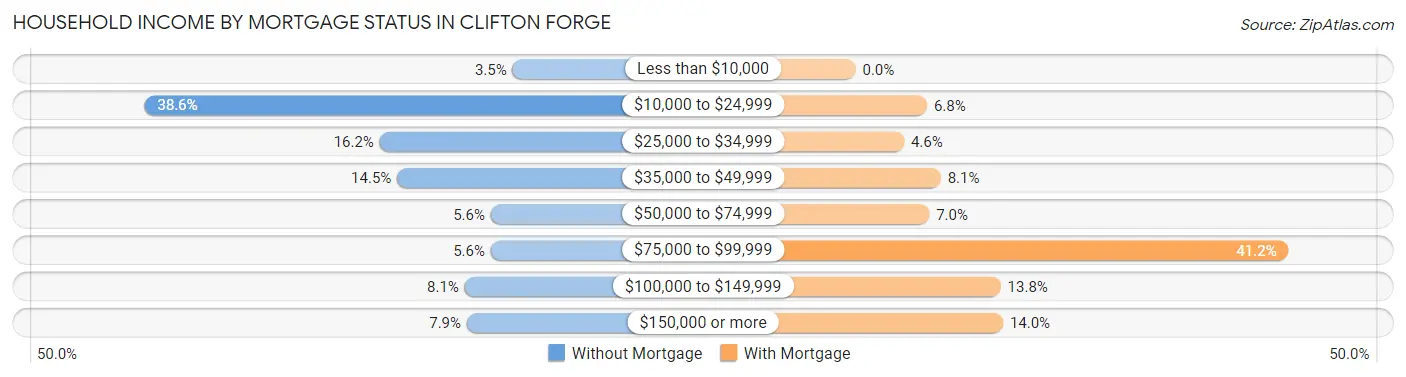
| Household Income | Without Mortgage | With Mortgage |
| Less than $10,000 | 17 (3.5%) | 0 (0.0%) |
| $10,000 to $24,999 | 186 (38.6%) | 31 (6.8%) |
| $25,000 to $34,999 | 78 (16.2%) | 21 (4.6%) |
| $35,000 to $49,999 | 70 (14.5%) | 37 (8.1%) |
| $50,000 to $74,999 | 27 (5.6%) | 32 (7.0%) |
| $75,000 to $99,999 | 27 (5.6%) | 188 (41.2%) |
| $100,000 to $149,999 | 39 (8.1%) | 63 (13.8%) |
| $150,000 or more | 38 (7.9%) | 64 (14.0%) |
| Total | 482 (100.0%) | 456 (100.0%) |
Property Value to Household Income Ratio in Clifton Forge
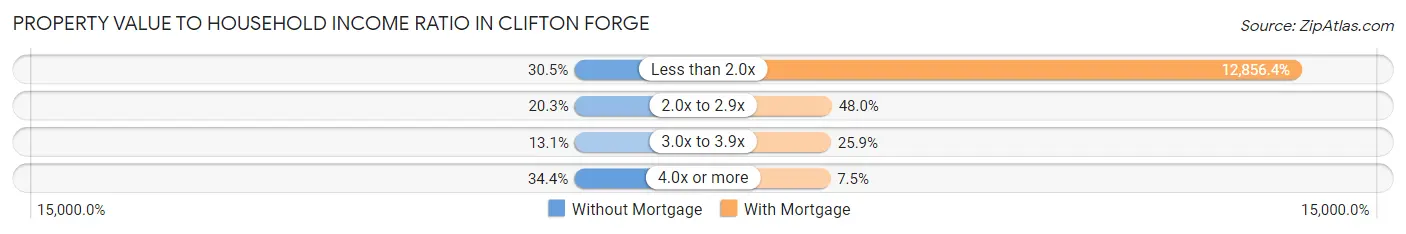
| Value-to-Income Ratio | Without Mortgage | With Mortgage |
| Less than 2.0x | 147 (30.5%) | 58,625 (12,856.4%) |
| 2.0x to 2.9x | 98 (20.3%) | 219 (48.0%) |
| 3.0x to 3.9x | 63 (13.1%) | 118 (25.9%) |
| 4.0x or more | 166 (34.4%) | 34 (7.5%) |
| Total | 482 (100.0%) | 456 (100.0%) |
Real Estate Taxes by Mortgage Status in Clifton Forge
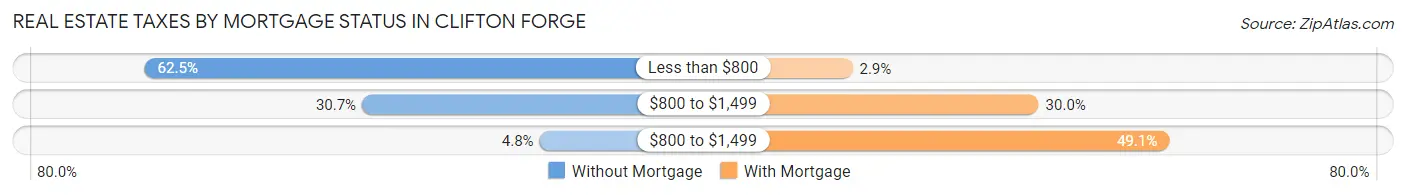
| Property Taxes | Without Mortgage | With Mortgage |
| Less than $800 | 301 (62.5%) | 13 (2.9%) |
| $800 to $1,499 | 148 (30.7%) | 137 (30.0%) |
| $800 to $1,499 | 23 (4.8%) | 224 (49.1%) |
| Total | 482 (100.0%) | 456 (100.0%) |
Health & Disability in Clifton Forge
Health Insurance Coverage by Age in Clifton Forge
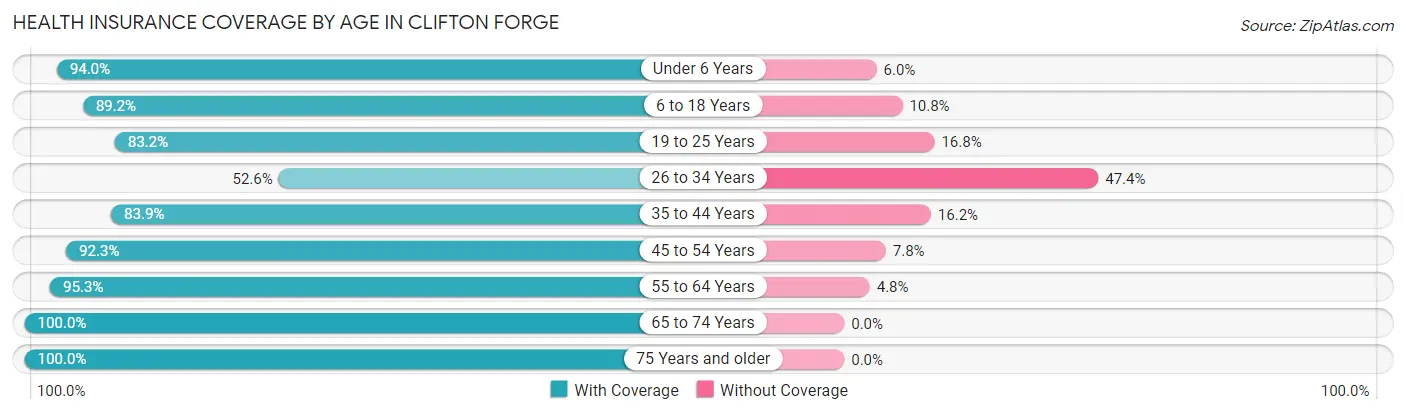
| Age Bracket | With Coverage | Without Coverage |
| Under 6 Years | 328 (94.0%) | 21 (6.0%) |
| 6 to 18 Years | 403 (89.2%) | 49 (10.8%) |
| 19 to 25 Years | 272 (83.2%) | 55 (16.8%) |
| 26 to 34 Years | 209 (52.6%) | 188 (47.4%) |
| 35 to 44 Years | 244 (83.9%) | 47 (16.2%) |
| 45 to 54 Years | 262 (92.2%) | 22 (7.7%) |
| 55 to 64 Years | 541 (95.3%) | 27 (4.8%) |
| 65 to 74 Years | 411 (100.0%) | 0 (0.0%) |
| 75 Years and older | 286 (100.0%) | 0 (0.0%) |
| Total | 2,956 (87.8%) | 409 (12.1%) |
Health Insurance Coverage by Citizenship Status in Clifton Forge
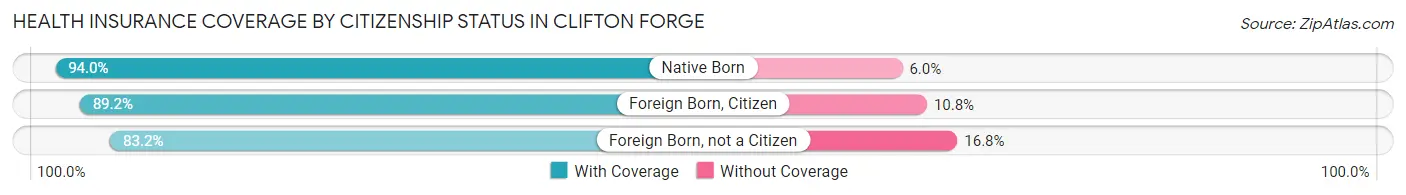
| Citizenship Status | With Coverage | Without Coverage |
| Native Born | 328 (94.0%) | 21 (6.0%) |
| Foreign Born, Citizen | 403 (89.2%) | 49 (10.8%) |
| Foreign Born, not a Citizen | 272 (83.2%) | 55 (16.8%) |
Health Insurance Coverage by Household Income in Clifton Forge
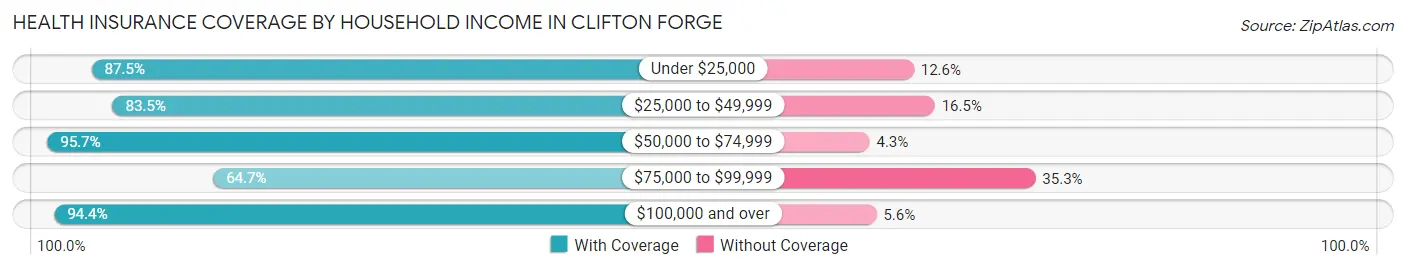
| Household Income | With Coverage | Without Coverage |
| Under $25,000 | 850 (87.5%) | 122 (12.6%) |
| $25,000 to $49,999 | 598 (83.5%) | 118 (16.5%) |
| $50,000 to $74,999 | 585 (95.7%) | 26 (4.3%) |
| $75,000 to $99,999 | 183 (64.7%) | 100 (35.3%) |
| $100,000 and over | 731 (94.4%) | 43 (5.6%) |
Public vs Private Health Insurance Coverage by Age in Clifton Forge
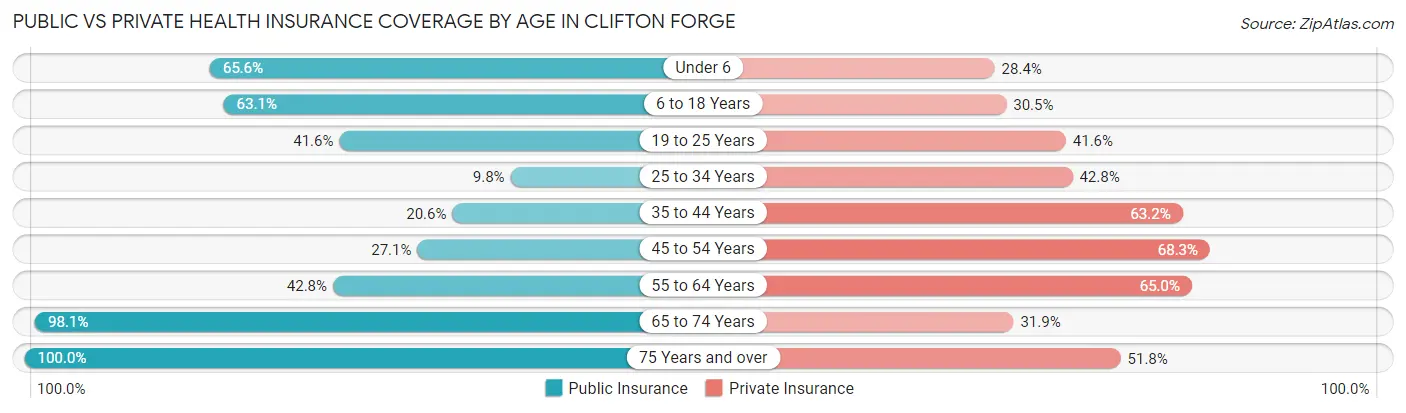
| Age Bracket | Public Insurance | Private Insurance |
| Under 6 | 229 (65.6%) | 99 (28.4%) |
| 6 to 18 Years | 285 (63.0%) | 138 (30.5%) |
| 19 to 25 Years | 136 (41.6%) | 136 (41.6%) |
| 25 to 34 Years | 39 (9.8%) | 170 (42.8%) |
| 35 to 44 Years | 60 (20.6%) | 184 (63.2%) |
| 45 to 54 Years | 77 (27.1%) | 194 (68.3%) |
| 55 to 64 Years | 243 (42.8%) | 369 (65.0%) |
| 65 to 74 Years | 403 (98.1%) | 131 (31.9%) |
| 75 Years and over | 286 (100.0%) | 148 (51.7%) |
| Total | 1,758 (52.2%) | 1,569 (46.6%) |
Disability Status by Sex by Age in Clifton Forge
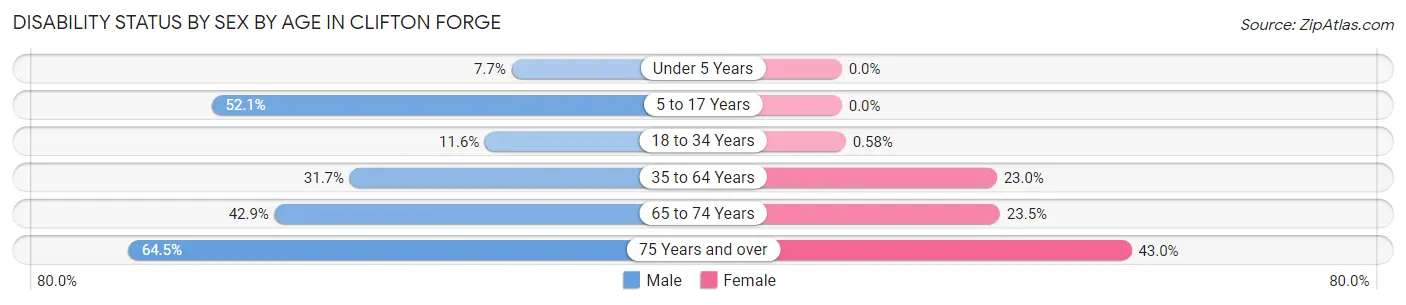
| Age Bracket | Male | Female |
| Under 5 Years | 13 (7.7%) | 0 (0.0%) |
| 5 to 17 Years | 211 (52.1%) | 0 (0.0%) |
| 18 to 34 Years | 44 (11.6%) | 2 (0.6%) |
| 35 to 64 Years | 168 (31.7%) | 141 (23.0%) |
| 65 to 74 Years | 63 (42.9%) | 62 (23.5%) |
| 75 Years and over | 60 (64.5%) | 83 (43.0%) |
Disability Class by Sex by Age in Clifton Forge
Disability Class: Hearing Difficulty
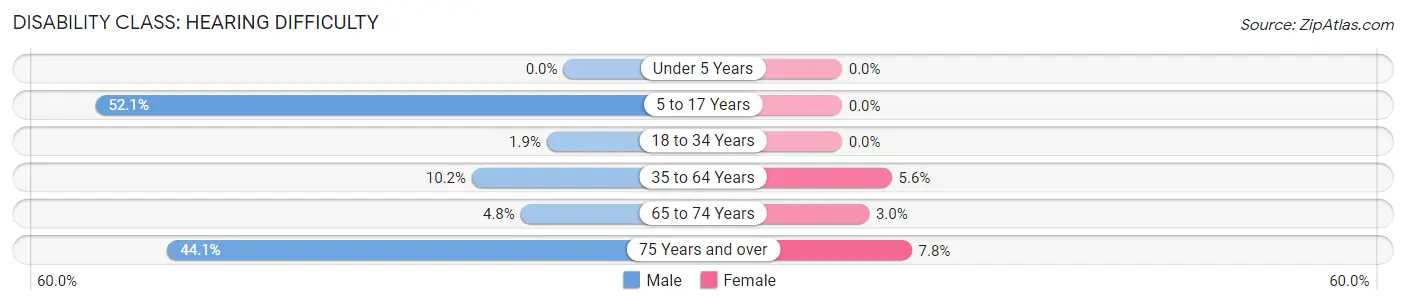
| Age Bracket | Male | Female |
| Under 5 Years | 0 (0.0%) | 0 (0.0%) |
| 5 to 17 Years | 211 (52.1%) | 0 (0.0%) |
| 18 to 34 Years | 7 (1.8%) | 0 (0.0%) |
| 35 to 64 Years | 54 (10.2%) | 34 (5.6%) |
| 65 to 74 Years | 7 (4.8%) | 8 (3.0%) |
| 75 Years and over | 41 (44.1%) | 15 (7.8%) |
Disability Class: Vision Difficulty
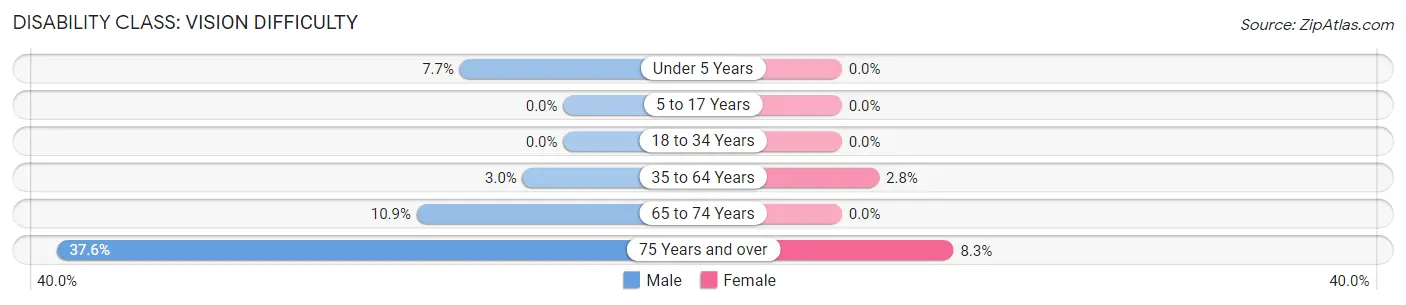
| Age Bracket | Male | Female |
| Under 5 Years | 13 (7.7%) | 0 (0.0%) |
| 5 to 17 Years | 0 (0.0%) | 0 (0.0%) |
| 18 to 34 Years | 0 (0.0%) | 0 (0.0%) |
| 35 to 64 Years | 16 (3.0%) | 17 (2.8%) |
| 65 to 74 Years | 16 (10.9%) | 0 (0.0%) |
| 75 Years and over | 35 (37.6%) | 16 (8.3%) |
Disability Class: Cognitive Difficulty
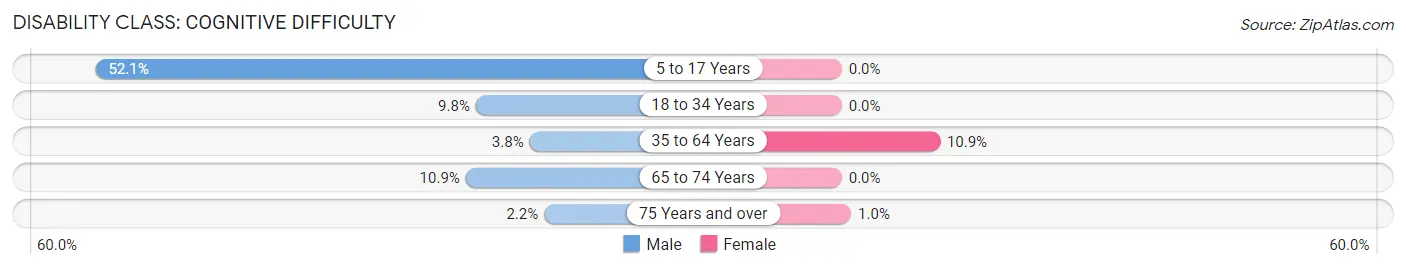
| Age Bracket | Male | Female |
| 5 to 17 Years | 211 (52.1%) | 0 (0.0%) |
| 18 to 34 Years | 37 (9.8%) | 0 (0.0%) |
| 35 to 64 Years | 20 (3.8%) | 67 (10.9%) |
| 65 to 74 Years | 16 (10.9%) | 0 (0.0%) |
| 75 Years and over | 2 (2.1%) | 2 (1.0%) |
Disability Class: Ambulatory Difficulty
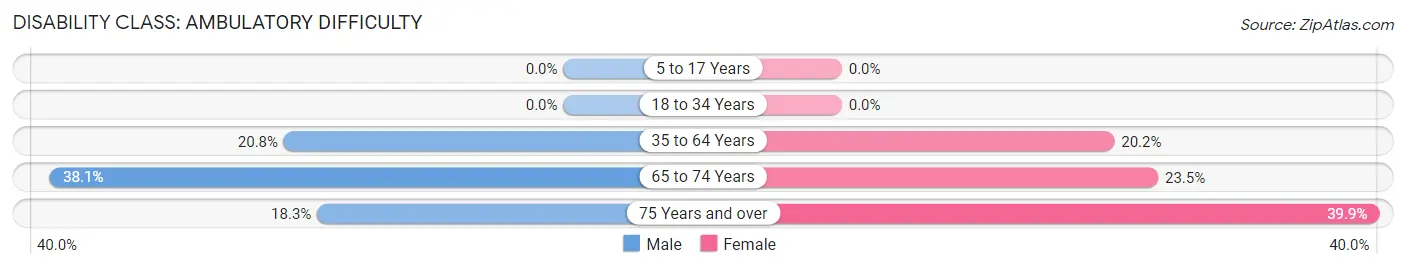
| Age Bracket | Male | Female |
| 5 to 17 Years | 0 (0.0%) | 0 (0.0%) |
| 18 to 34 Years | 0 (0.0%) | 0 (0.0%) |
| 35 to 64 Years | 110 (20.7%) | 124 (20.2%) |
| 65 to 74 Years | 56 (38.1%) | 62 (23.5%) |
| 75 Years and over | 17 (18.3%) | 77 (39.9%) |
Disability Class: Self-Care Difficulty
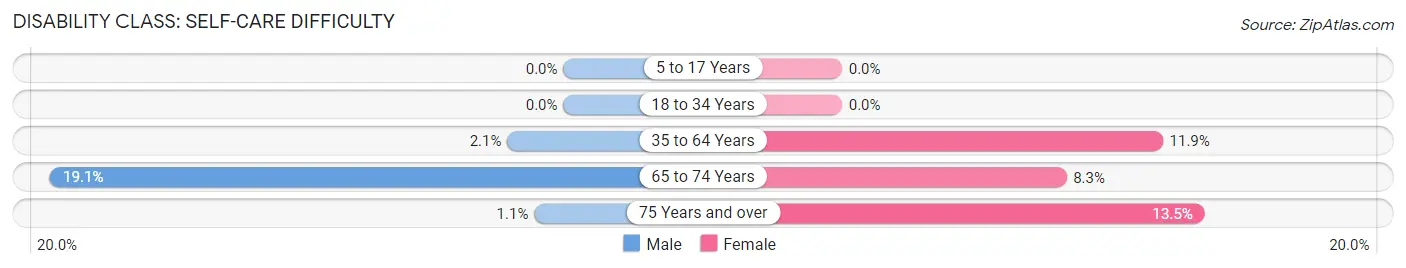
| Age Bracket | Male | Female |
| 5 to 17 Years | 0 (0.0%) | 0 (0.0%) |
| 18 to 34 Years | 0 (0.0%) | 0 (0.0%) |
| 35 to 64 Years | 11 (2.1%) | 73 (11.9%) |
| 65 to 74 Years | 28 (19.1%) | 22 (8.3%) |
| 75 Years and over | 1 (1.1%) | 26 (13.5%) |
Technology Access in Clifton Forge
Computing Device Access in Clifton Forge
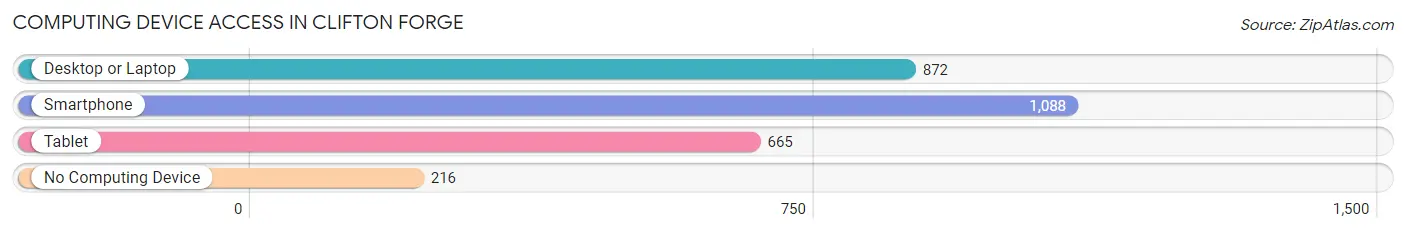
| Device Type | # Households | % Households |
| Desktop or Laptop | 872 | 61.1% |
| Smartphone | 1,088 | 76.2% |
| Tablet | 665 | 46.6% |
| No Computing Device | 216 | 15.1% |
| Total | 1,427 | 100.0% |
Internet Access in Clifton Forge
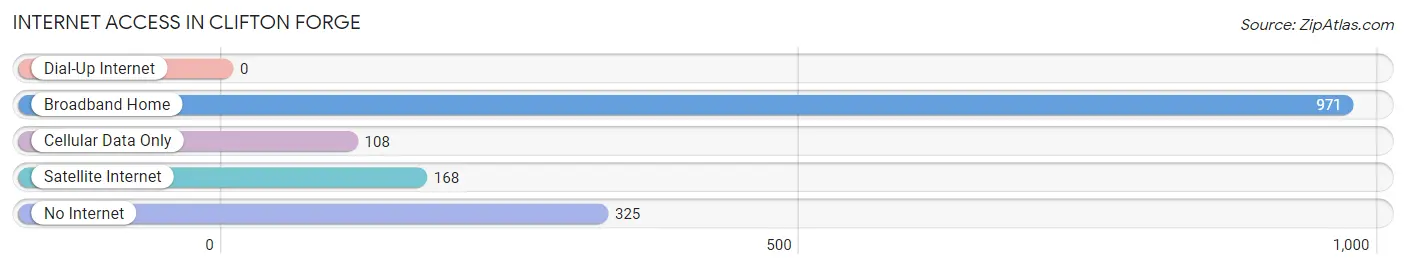
| Internet Type | # Households | % Households |
| Dial-Up Internet | 0 | 0.0% |
| Broadband Home | 971 | 68.0% |
| Cellular Data Only | 108 | 7.6% |
| Satellite Internet | 168 | 11.8% |
| No Internet | 325 | 22.8% |
| Total | 1,427 | 100.0% |
Clifton Forge Summary
Clifton Forge is a town located in Alleghany County, Virginia, United States. It is part of the Roanoke Metropolitan Statistical Area. The population was 3,884 at the 2010 census.
History
Clifton Forge was founded in 1832 as a railroad town. It was named after the nearby Clifton Forge Iron Works, which was established in 1793. The iron works was the first in the area and was instrumental in the development of the town. The town was incorporated in 1874 and was the county seat of Alleghany County until the county seat was moved to Covington in 1915.
The town was a major railroad hub in the late 19th and early 20th centuries. It was the site of the Clifton Forge and Potomac Railroad, which connected the town to the Chesapeake and Ohio Railway. The railroad was instrumental in the development of the town and the surrounding area.
Geography
Clifton Forge is located in the Allegheny Mountains of western Virginia. It is situated at the confluence of the Jackson and Cowpasture Rivers. The town is located at the intersection of U.S. Route 60 and State Route 612.
The town has a total area of 2.2 square miles, all of which is land. The town is located in a hilly area and is surrounded by forests.
Economy
Clifton Forge is a small town with a limited economy. The town is home to several small businesses, including restaurants, retail stores, and professional services. The town is also home to a number of manufacturing companies, including a paper mill and a furniture factory.
The town is also home to a number of tourist attractions, including the Clifton Forge Railroad Museum and the Jackson River Scenic Trail. The town is also home to the Alleghany Highlands Arts and Crafts Center, which features a variety of local artisans.
Demographics
As of the 2010 census, there were 3,884 people, 1,717 households, and 1,039 families residing in the town. The population density was 1,743.3 people per square mile. The racial makeup of the town was 92.2% White, 4.7% African American, 0.3% Native American, 0.4% Asian, 0.1% Pacific Islander, 0.7% from other races, and 1.5% from two or more races. Hispanic or Latino of any race were 1.7% of the population.
The median income for a household in the town was $30,938, and the median income for a family was $41,250. Males had a median income of $30,938 versus $21,250 for females. The per capita income for the town was $17,845. About 11.2% of families and 14.2% of the population were below the poverty line, including 19.2% of those under age 18 and 11.2% of those age 65 or over.
Common Questions
What is Per Capita Income in Clifton Forge?
Per Capita income in Clifton Forge is $21,654.
What is the Median Family Income in Clifton Forge?
Median Family Income in Clifton Forge is $53,750.
What is the Median Household income in Clifton Forge?
Median Household Income in Clifton Forge is $32,007.
What is Income or Wage Gap in Clifton Forge?
Income or Wage Gap in Clifton Forge is 43.0%.
Women in Clifton Forge earn 57.0 cents for every dollar earned by a man.
What is Family Income Deficit in Clifton Forge?
Family Income Deficit in Clifton Forge is $12,471.
Families that are below poverty line in Clifton Forge earn $12,471 less on average than the poverty threshold level.
What is Inequality or Gini Index in Clifton Forge?
Inequality or Gini Index in Clifton Forge is 0.48.
What is the Total Population of Clifton Forge?
Total Population of Clifton Forge is 3,541.
What is the Total Male Population of Clifton Forge?
Total Male Population of Clifton Forge is 1,789.
What is the Total Female Population of Clifton Forge?
Total Female Population of Clifton Forge is 1,752.
What is the Ratio of Males per 100 Females in Clifton Forge?
There are 102.11 Males per 100 Females in Clifton Forge.
What is the Ratio of Females per 100 Males in Clifton Forge?
There are 97.93 Females per 100 Males in Clifton Forge.
What is the Median Population Age in Clifton Forge?
Median Population Age in Clifton Forge is 42.8 Years.
What is the Average Family Size in Clifton Forge
Average Family Size in Clifton Forge is 3.1 People.
What is the Average Household Size in Clifton Forge
Average Household Size in Clifton Forge is 2.4 People.
How Large is the Labor Force in Clifton Forge?
There are 1,109 People in the Labor Forcein in Clifton Forge.
What is the Percentage of People in the Labor Force in Clifton Forge?
40.0% of People are in the Labor Force in Clifton Forge.
What is the Unemployment Rate in Clifton Forge?
Unemployment Rate in Clifton Forge is 8.5%.