Charlotte Court House, VA Map & Demographics
Charlotte Court House Map
Charlotte Court House Overview
$26,143
PER CAPITA INCOME
$101,250
AVG FAMILY INCOME
$62,083
AVG HOUSEHOLD INCOME
8.4%
WAGE / INCOME GAP [ % ]
91.6¢/ $1
WAGE / INCOME GAP [ $ ]
0.41
INEQUALITY / GINI INDEX
696
TOTAL POPULATION
406
MALE POPULATION
290
FEMALE POPULATION
140.00
MALES / 100 FEMALES
71.43
FEMALES / 100 MALES
39.5
MEDIAN AGE
3.7
AVG FAMILY SIZE
2.8
AVG HOUSEHOLD SIZE
330
LABOR FORCE [ PEOPLE ]
55.7%
PERCENT IN LABOR FORCE
1.8%
UNEMPLOYMENT RATE
Charlotte Court House Zip Codes
Charlotte Court House Area Codes
Income in Charlotte Court House
Income Overview in Charlotte Court House
Per Capita Income in Charlotte Court House is $26,143, while median incomes of families and households are $101,250 and $62,083 respectively.
| Characteristic | Number | Measure |
| Per Capita Income | 696 | $26,143 |
| Median Family Income | 138 | $101,250 |
| Mean Family Income | 138 | $100,686 |
| Median Household Income | 226 | $62,083 |
| Mean Household Income | 226 | $77,312 |
| Income Deficit | 138 | $0 |
| Wage / Income Gap (%) | 696 | 8.44% |
| Wage / Income Gap ($) | 696 | 91.56¢ per $1 |
| Gini / Inequality Index | 696 | 0.41 |
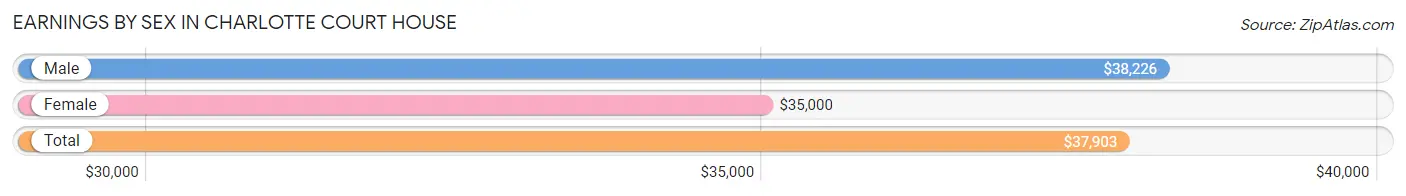
Earnings by Sex in Charlotte Court House
Average Earnings in Charlotte Court House are $37,903, $38,226 for men and $35,000 for women, a difference of 8.4%.
| Sex | Number | Average Earnings |
| Male | 190 (53.7%) | $38,226 |
| Female | 164 (46.3%) | $35,000 |
| Total | 354 (100.0%) | $37,903 |
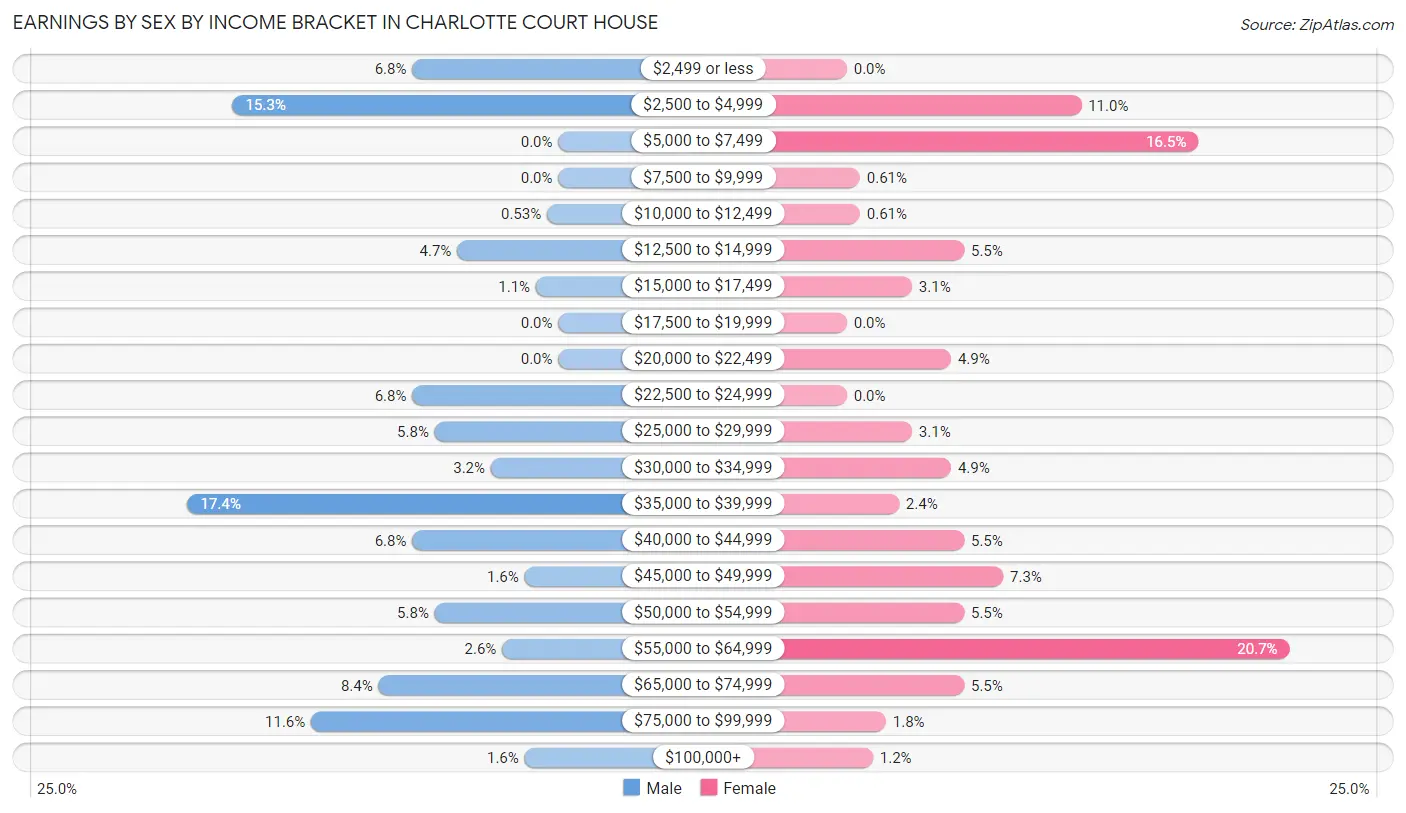
Earnings by Sex by Income Bracket in Charlotte Court House
The most common earnings brackets in Charlotte Court House are $35,000 to $39,999 for men (33 | 17.4%) and $55,000 to $64,999 for women (34 | 20.7%).
| Income | Male | Female |
| $2,499 or less | 13 (6.8%) | 0 (0.0%) |
| $2,500 to $4,999 | 29 (15.3%) | 18 (11.0%) |
| $5,000 to $7,499 | 0 (0.0%) | 27 (16.5%) |
| $7,500 to $9,999 | 0 (0.0%) | 1 (0.6%) |
| $10,000 to $12,499 | 1 (0.5%) | 1 (0.6%) |
| $12,500 to $14,999 | 9 (4.7%) | 9 (5.5%) |
| $15,000 to $17,499 | 2 (1.1%) | 5 (3.0%) |
| $17,500 to $19,999 | 0 (0.0%) | 0 (0.0%) |
| $20,000 to $22,499 | 0 (0.0%) | 8 (4.9%) |
| $22,500 to $24,999 | 13 (6.8%) | 0 (0.0%) |
| $25,000 to $29,999 | 11 (5.8%) | 5 (3.0%) |
| $30,000 to $34,999 | 6 (3.2%) | 8 (4.9%) |
| $35,000 to $39,999 | 33 (17.4%) | 4 (2.4%) |
| $40,000 to $44,999 | 13 (6.8%) | 9 (5.5%) |
| $45,000 to $49,999 | 3 (1.6%) | 12 (7.3%) |
| $50,000 to $54,999 | 11 (5.8%) | 9 (5.5%) |
| $55,000 to $64,999 | 5 (2.6%) | 34 (20.7%) |
| $65,000 to $74,999 | 16 (8.4%) | 9 (5.5%) |
| $75,000 to $99,999 | 22 (11.6%) | 3 (1.8%) |
| $100,000+ | 3 (1.6%) | 2 (1.2%) |
| Total | 190 (100.0%) | 164 (100.0%) |
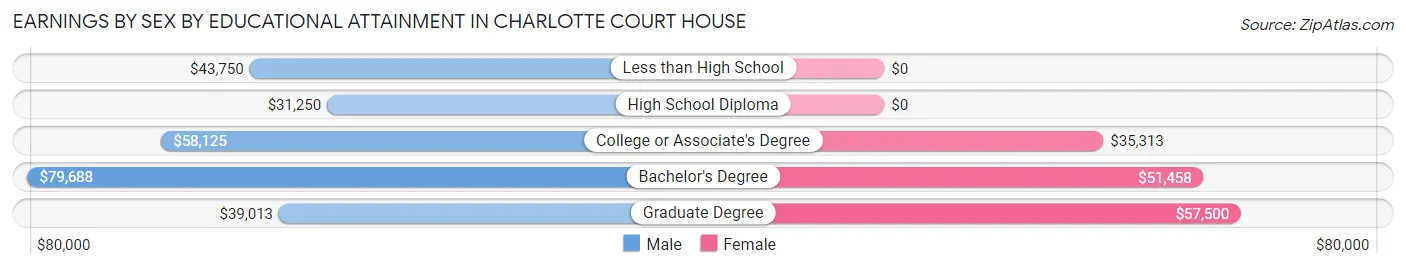
Earnings by Sex by Educational Attainment in Charlotte Court House
Average earnings in Charlotte Court House are $39,798 for men and $45,139 for women, a difference of 11.8%. Men with an educational attainment of bachelor's degree enjoy the highest average annual earnings of $79,688, while those with high school diploma education earn the least with $31,250. Women with an educational attainment of graduate degree earn the most with the average annual earnings of $57,500, while those with college or associate's degree education have the smallest earnings of $35,313.
| Educational Attainment | Male Income | Female Income |
| Less than High School | $43,750 | $0 |
| High School Diploma | $31,250 | $0 |
| College or Associate's Degree | $58,125 | $35,313 |
| Bachelor's Degree | $79,688 | $51,458 |
| Graduate Degree | $39,013 | $57,500 |
| Total | $39,798 | $45,139 |
Family Income in Charlotte Court House
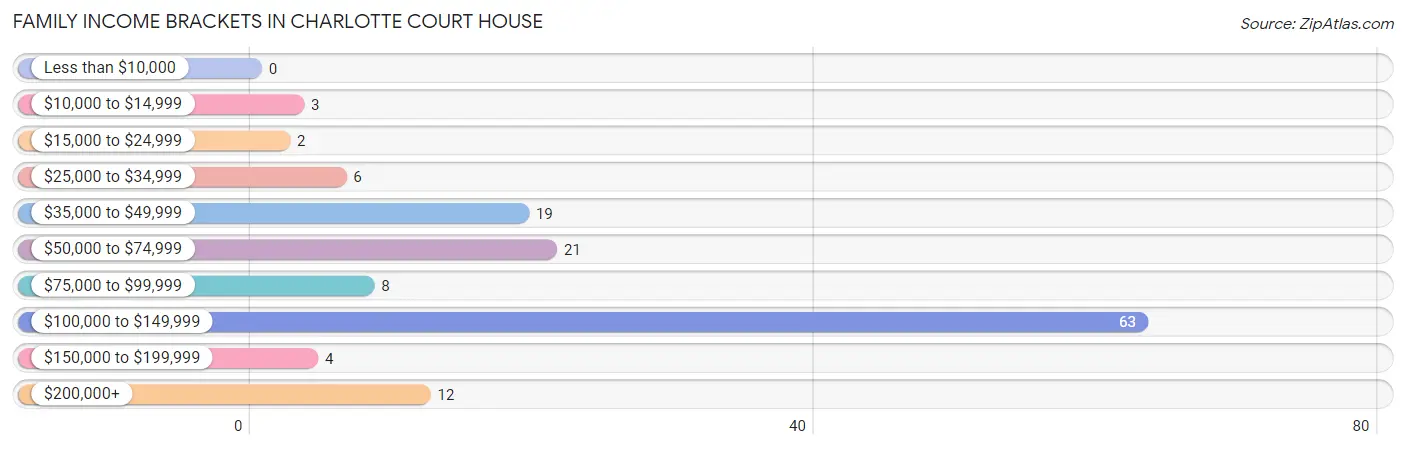
Family Income Brackets in Charlotte Court House
According to the Charlotte Court House family income data, there are 63 families falling into the $100,000 to $149,999 income range, which is the most common income bracket and makes up 45.7% of all families.
| Income Bracket | # Families | % Families |
| Less than $10,000 | 0 | 0.0% |
| $10,000 to $14,999 | 3 | 2.2% |
| $15,000 to $24,999 | 2 | 1.4% |
| $25,000 to $34,999 | 6 | 4.3% |
| $35,000 to $49,999 | 19 | 13.8% |
| $50,000 to $74,999 | 21 | 15.2% |
| $75,000 to $99,999 | 8 | 5.8% |
| $100,000 to $149,999 | 63 | 45.7% |
| $150,000 to $199,999 | 4 | 2.9% |
| $200,000+ | 12 | 8.7% |
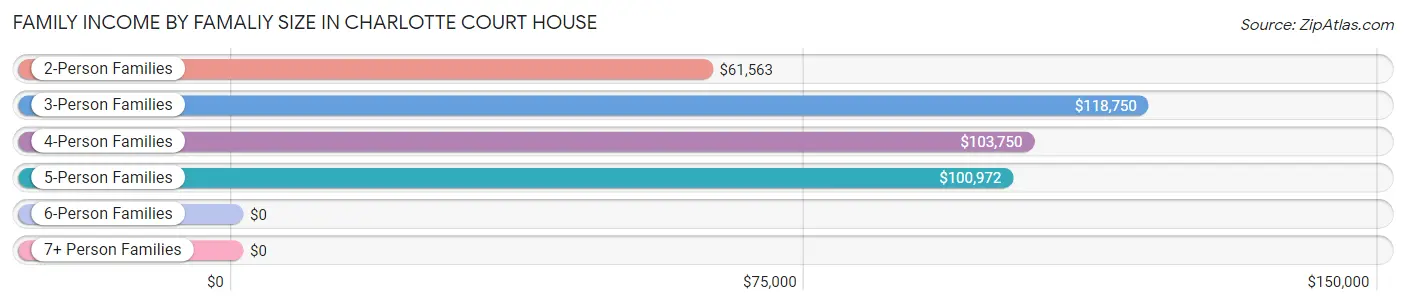
Family Income by Famaliy Size in Charlotte Court House
3-person families (15 | 10.9%) account for the highest median family income in Charlotte Court House with $118,750 per family, while 3-person families (15 | 10.9%) have the highest median income of $39,583 per family member.
| Income Bracket | # Families | Median Income |
| 2-Person Families | 71 (51.4%) | $61,563 |
| 3-Person Families | 15 (10.9%) | $118,750 |
| 4-Person Families | 26 (18.8%) | $103,750 |
| 5-Person Families | 22 (15.9%) | $100,972 |
| 6-Person Families | 4 (2.9%) | $0 |
| 7+ Person Families | 0 (0.0%) | $0 |
| Total | 138 (100.0%) | $101,250 |
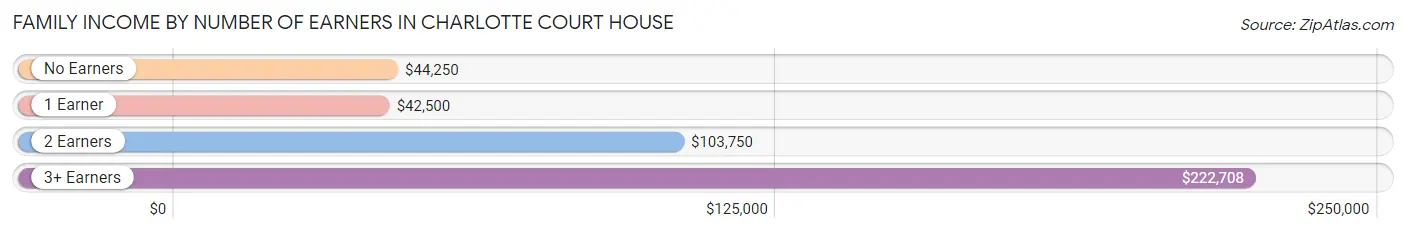
Family Income by Number of Earners in Charlotte Court House
The median family income in Charlotte Court House is $101,250, with families comprising 3+ earners (11) having the highest median family income of $222,708, while families with 1 earner (20) have the lowest median family income of $42,500, accounting for 8.0% and 14.5% of families, respectively.
| Number of Earners | # Families | Median Income |
| No Earners | 25 (18.1%) | $44,250 |
| 1 Earner | 20 (14.5%) | $42,500 |
| 2 Earners | 82 (59.4%) | $103,750 |
| 3+ Earners | 11 (8.0%) | $222,708 |
| Total | 138 (100.0%) | $101,250 |
Household Income in Charlotte Court House
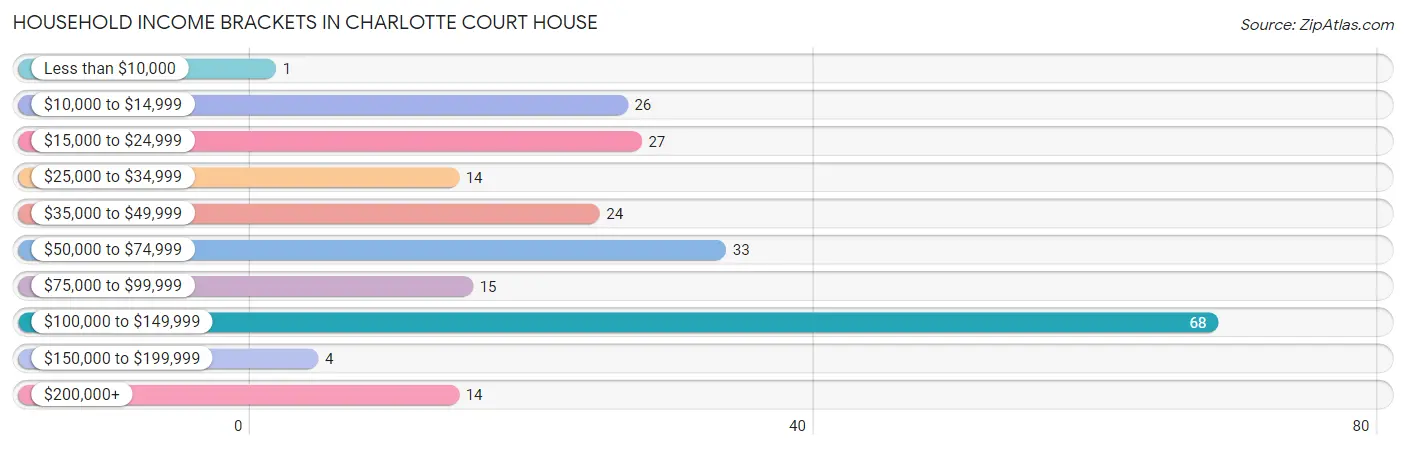
Household Income Brackets in Charlotte Court House
With 68 households falling in the category, the $100,000 to $149,999 income range is the most frequent in Charlotte Court House, accounting for 30.1% of all households. In contrast, only 1 households (0.4%) fall into the less than $10,000 income bracket, making it the least populous group.
| Income Bracket | # Households | % Households |
| Less than $10,000 | 1 | 0.4% |
| $10,000 to $14,999 | 26 | 11.5% |
| $15,000 to $24,999 | 27 | 11.9% |
| $25,000 to $34,999 | 14 | 6.2% |
| $35,000 to $49,999 | 24 | 10.6% |
| $50,000 to $74,999 | 33 | 14.6% |
| $75,000 to $99,999 | 15 | 6.6% |
| $100,000 to $149,999 | 68 | 30.1% |
| $150,000 to $199,999 | 4 | 1.8% |
| $200,000+ | 14 | 6.2% |
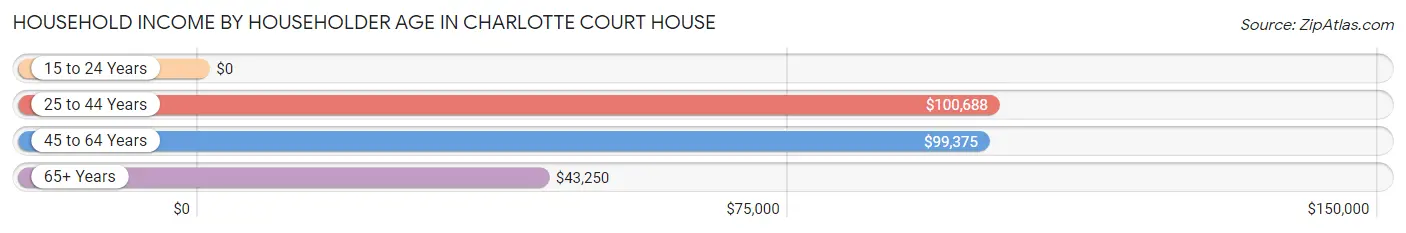
Household Income by Householder Age in Charlotte Court House
The median household income in Charlotte Court House is $62,083, with the highest median household income of $100,688 found in the 25 to 44 years age bracket for the primary householder. A total of 71 households (31.4%) fall into this category.
| Income Bracket | # Households | Median Income |
| 15 to 24 Years | 0 (0.0%) | $0 |
| 25 to 44 Years | 71 (31.4%) | $100,688 |
| 45 to 64 Years | 66 (29.2%) | $99,375 |
| 65+ Years | 89 (39.4%) | $43,250 |
| Total | 226 (100.0%) | $62,083 |
Poverty in Charlotte Court House
Income Below Poverty by Sex and Age in Charlotte Court House
With 11.3% poverty level for males and 6.6% for females among the residents of Charlotte Court House, 65 to 74 year old males and 16 and 17 year old females are the most vulnerable to poverty, with 13 males (32.5%) and 3 females (37.5%) in their respective age groups living below the poverty level.
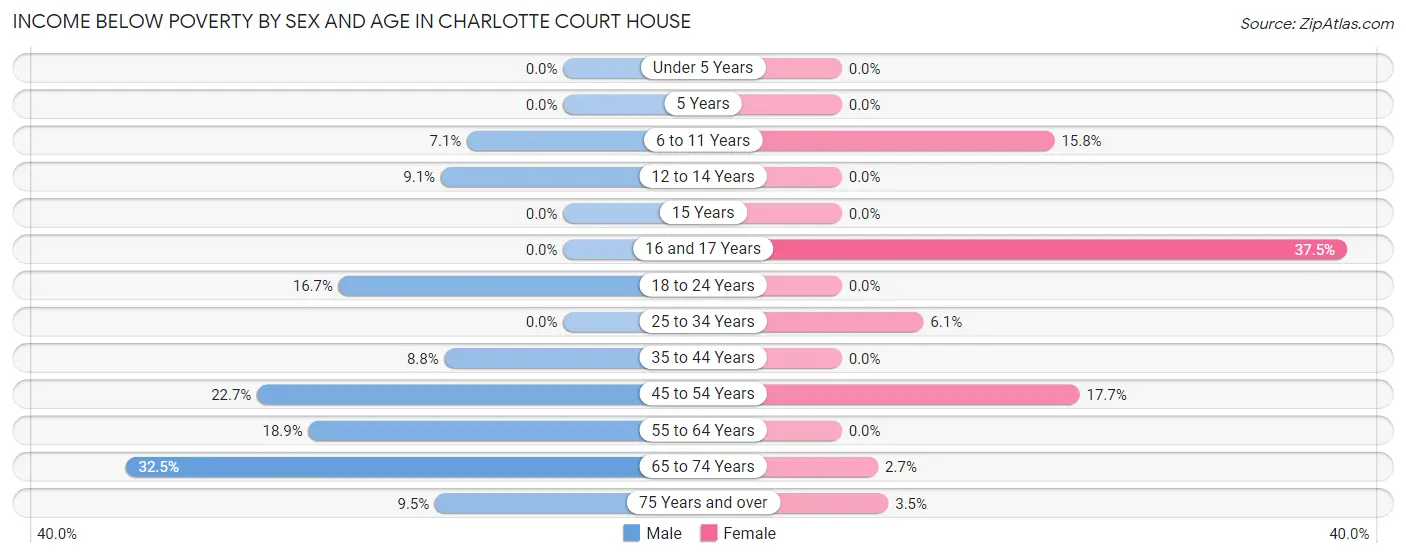
| Age Bracket | Male | Female |
| Under 5 Years | 0 (0.0%) | 0 (0.0%) |
| 5 Years | 0 (0.0%) | 0 (0.0%) |
| 6 to 11 Years | 2 (7.1%) | 3 (15.8%) |
| 12 to 14 Years | 2 (9.1%) | 0 (0.0%) |
| 15 Years | 0 (0.0%) | 0 (0.0%) |
| 16 and 17 Years | 0 (0.0%) | 3 (37.5%) |
| 18 to 24 Years | 5 (16.7%) | 0 (0.0%) |
| 25 to 34 Years | 0 (0.0%) | 2 (6.1%) |
| 35 to 44 Years | 3 (8.8%) | 0 (0.0%) |
| 45 to 54 Years | 5 (22.7%) | 9 (17.6%) |
| 55 to 64 Years | 7 (18.9%) | 0 (0.0%) |
| 65 to 74 Years | 13 (32.5%) | 1 (2.7%) |
| 75 Years and over | 2 (9.5%) | 1 (3.5%) |
| Total | 39 (11.3%) | 19 (6.6%) |
Income Above Poverty by Sex and Age in Charlotte Court House
According to the poverty statistics in Charlotte Court House, males aged under 5 years and females aged under 5 years are the age groups that are most secure financially, with 100.0% of males and 100.0% of females in these age groups living above the poverty line.
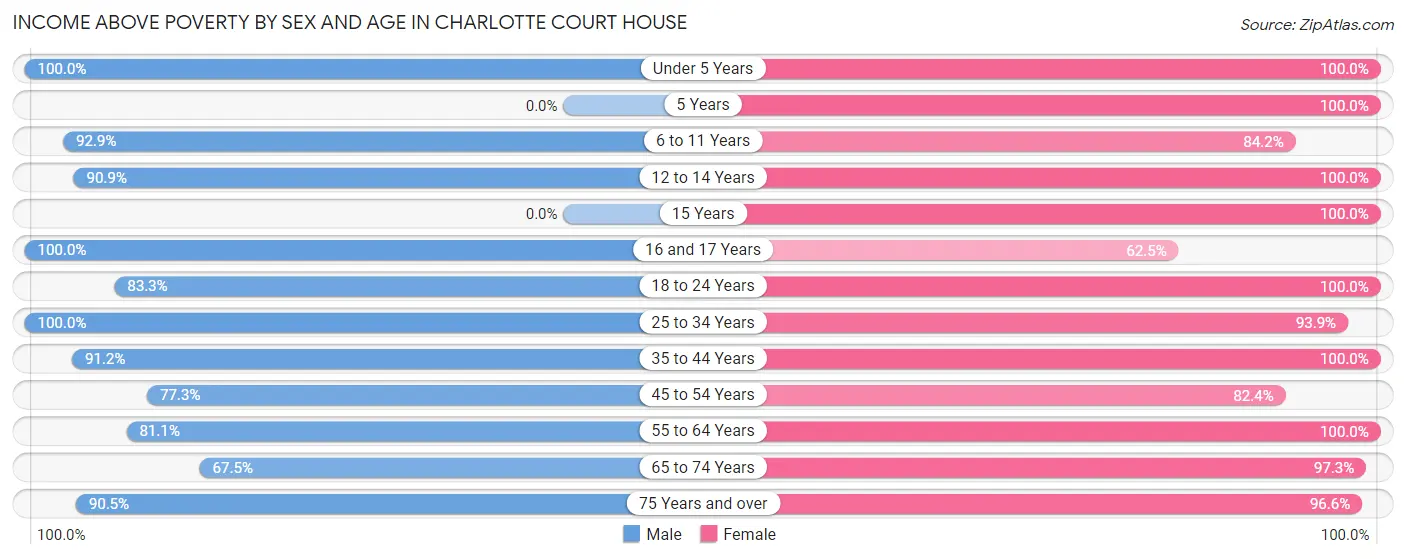
| Age Bracket | Male | Female |
| Under 5 Years | 15 (100.0%) | 1 (100.0%) |
| 5 Years | 0 (0.0%) | 4 (100.0%) |
| 6 to 11 Years | 26 (92.9%) | 16 (84.2%) |
| 12 to 14 Years | 20 (90.9%) | 9 (100.0%) |
| 15 Years | 0 (0.0%) | 6 (100.0%) |
| 16 and 17 Years | 57 (100.0%) | 5 (62.5%) |
| 18 to 24 Years | 25 (83.3%) | 27 (100.0%) |
| 25 to 34 Years | 38 (100.0%) | 31 (93.9%) |
| 35 to 44 Years | 31 (91.2%) | 43 (100.0%) |
| 45 to 54 Years | 17 (77.3%) | 42 (82.4%) |
| 55 to 64 Years | 30 (81.1%) | 23 (100.0%) |
| 65 to 74 Years | 27 (67.5%) | 36 (97.3%) |
| 75 Years and over | 19 (90.5%) | 28 (96.6%) |
| Total | 305 (88.7%) | 271 (93.4%) |
Income Below Poverty Among Married-Couple Families in Charlotte Court House
The poverty statistics for married-couple families in Charlotte Court House show that 1.8% or 2 of the total 114 families live below the poverty line. Families with no children have the highest poverty rate of 3.5%, comprising of 2 families. On the other hand, families with 1 or 2 children have the lowest poverty rate of 0.0%, which includes 0 families.
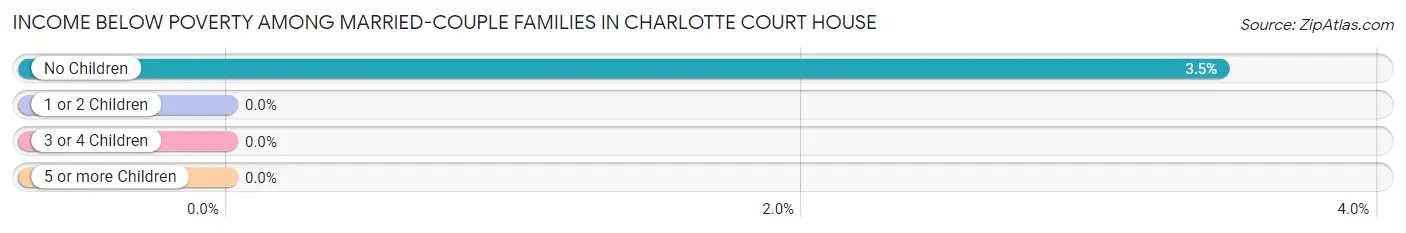
| Children | Above Poverty | Below Poverty |
| No Children | 56 (96.6%) | 2 (3.5%) |
| 1 or 2 Children | 31 (100.0%) | 0 (0.0%) |
| 3 or 4 Children | 25 (100.0%) | 0 (0.0%) |
| 5 or more Children | 0 (0.0%) | 0 (0.0%) |
| Total | 112 (98.3%) | 2 (1.8%) |
Income Below Poverty Among Single-Parent Households in Charlotte Court House
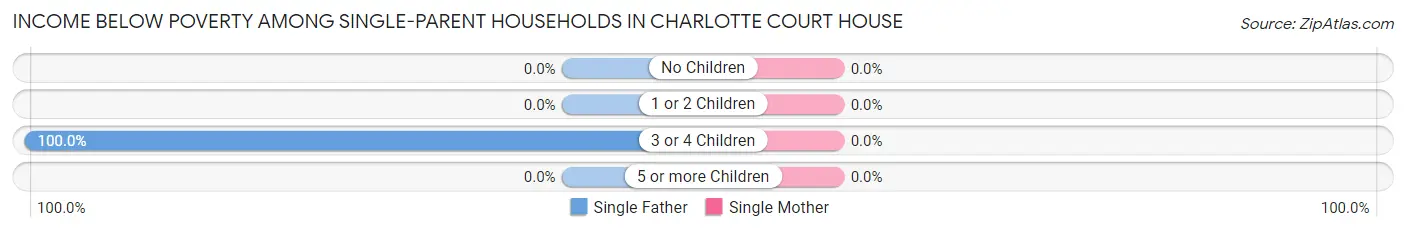
| Children | Single Father | Single Mother |
| No Children | 0 (0.0%) | 0 (0.0%) |
| 1 or 2 Children | 0 (0.0%) | 0 (0.0%) |
| 3 or 4 Children | 3 (100.0%) | 0 (0.0%) |
| 5 or more Children | 0 (0.0%) | 0 (0.0%) |
| Total | 3 (37.5%) | 0 (0.0%) |
Income Below Poverty Among Married-Couple vs Single-Parent Households in Charlotte Court House
The poverty data for Charlotte Court House shows that 2 of the married-couple family households (1.8%) and 3 of the single-parent households (12.5%) are living below the poverty level. Within the married-couple family households, those with no children have the highest poverty rate, with 2 households (3.5%) falling below the poverty line. Among the single-parent households, those with 3 or 4 children have the highest poverty rate, with 3 household (75.0%) living below poverty.
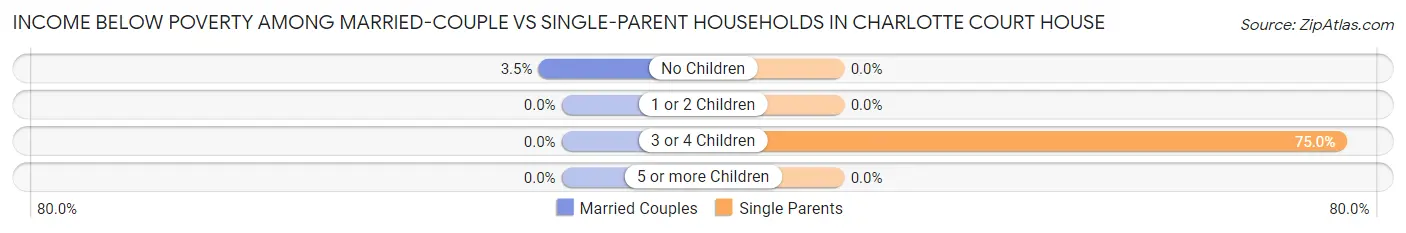
| Children | Married-Couple Families | Single-Parent Households |
| No Children | 2 (3.5%) | 0 (0.0%) |
| 1 or 2 Children | 0 (0.0%) | 0 (0.0%) |
| 3 or 4 Children | 0 (0.0%) | 3 (75.0%) |
| 5 or more Children | 0 (0.0%) | 0 (0.0%) |
| Total | 2 (1.8%) | 3 (12.5%) |
Race in Charlotte Court House
The most populous races in Charlotte Court House are White / Caucasian (341 | 49.0%), Black / African American (313 | 45.0%), and Two or more Races (25 | 3.6%).
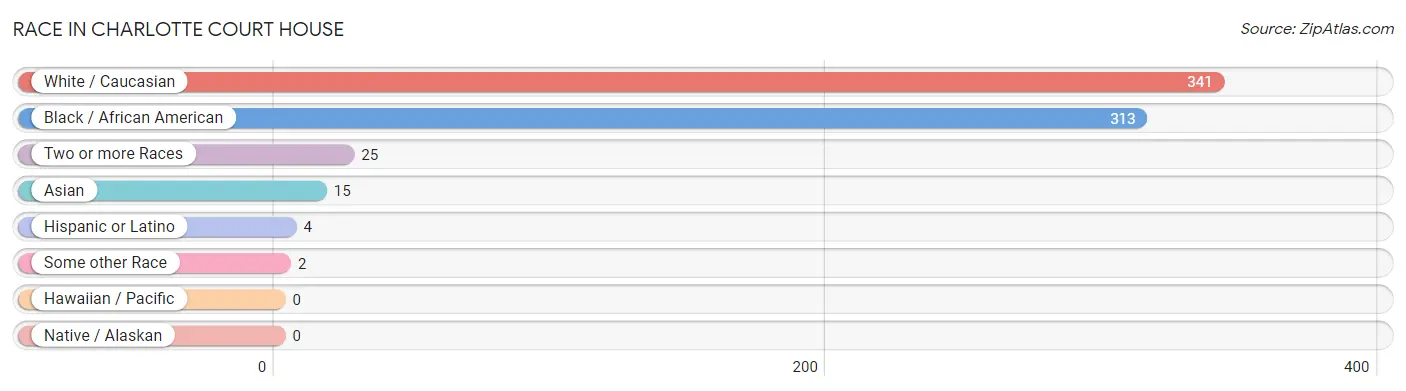
| Race | # Population | % Population |
| Asian | 15 | 2.2% |
| Black / African American | 313 | 45.0% |
| Hawaiian / Pacific | 0 | 0.0% |
| Hispanic or Latino | 4 | 0.6% |
| Native / Alaskan | 0 | 0.0% |
| White / Caucasian | 341 | 49.0% |
| Two or more Races | 25 | 3.6% |
| Some other Race | 2 | 0.3% |
| Total | 696 | 100.0% |
Ancestry in Charlotte Court House
The most populous ancestries reported in Charlotte Court House are American (86 | 12.4%), German (60 | 8.6%), English (54 | 7.8%), French (47 | 6.8%), and Irish (21 | 3.0%), together accounting for 38.5% of all Charlotte Court House residents.
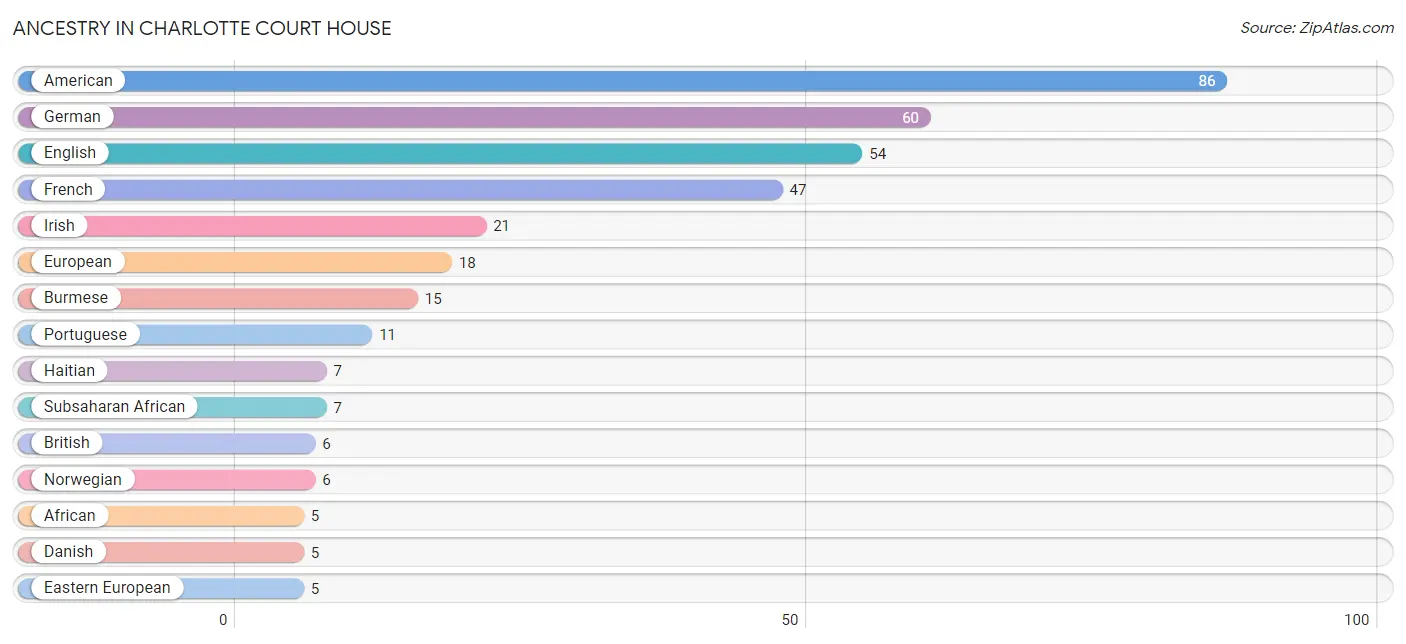
| Ancestry | # Population | % Population |
| African | 5 | 0.7% |
| American | 86 | 12.4% |
| British | 6 | 0.9% |
| Burmese | 15 | 2.2% |
| Cape Verdean | 2 | 0.3% |
| Danish | 5 | 0.7% |
| Eastern European | 5 | 0.7% |
| English | 54 | 7.8% |
| European | 18 | 2.6% |
| French | 47 | 6.8% |
| French Canadian | 4 | 0.6% |
| German | 60 | 8.6% |
| Haitian | 7 | 1.0% |
| Irish | 21 | 3.0% |
| Italian | 3 | 0.4% |
| Mexican | 4 | 0.6% |
| Norwegian | 6 | 0.9% |
| Pakistani | 4 | 0.6% |
| Portuguese | 11 | 1.6% |
| Scottish | 5 | 0.7% |
| Sri Lankan | 4 | 0.6% |
| Subsaharan African | 7 | 1.0% |
| Swedish | 3 | 0.4% | View All 23 Rows |
Immigrants in Charlotte Court House
The most numerous immigrant groups reported in Charlotte Court House came from Asia (15 | 2.2%), South Eastern Asia (8 | 1.1%), Caribbean (7 | 1.0%), Eastern Asia (7 | 1.0%), and Haiti (7 | 1.0%), together accounting for 6.3% of all Charlotte Court House residents.
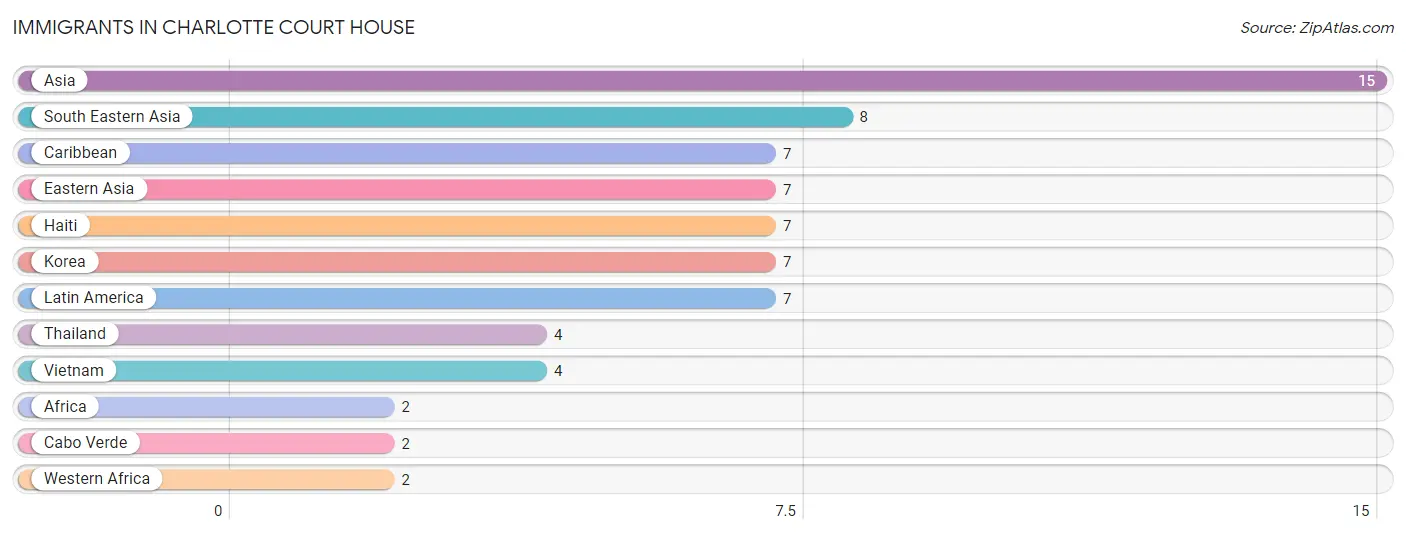
| Immigration Origin | # Population | % Population |
| Africa | 2 | 0.3% |
| Asia | 15 | 2.2% |
| Cabo Verde | 2 | 0.3% |
| Caribbean | 7 | 1.0% |
| Eastern Asia | 7 | 1.0% |
| Haiti | 7 | 1.0% |
| Korea | 7 | 1.0% |
| Latin America | 7 | 1.0% |
| South Eastern Asia | 8 | 1.1% |
| Thailand | 4 | 0.6% |
| Vietnam | 4 | 0.6% |
| Western Africa | 2 | 0.3% | View All 12 Rows |
Sex and Age in Charlotte Court House
Sex and Age in Charlotte Court House
The most populous age groups in Charlotte Court House are 15 to 19 Years (82 | 20.2%) for men and 15 to 19 Years (41 | 14.1%) for women.
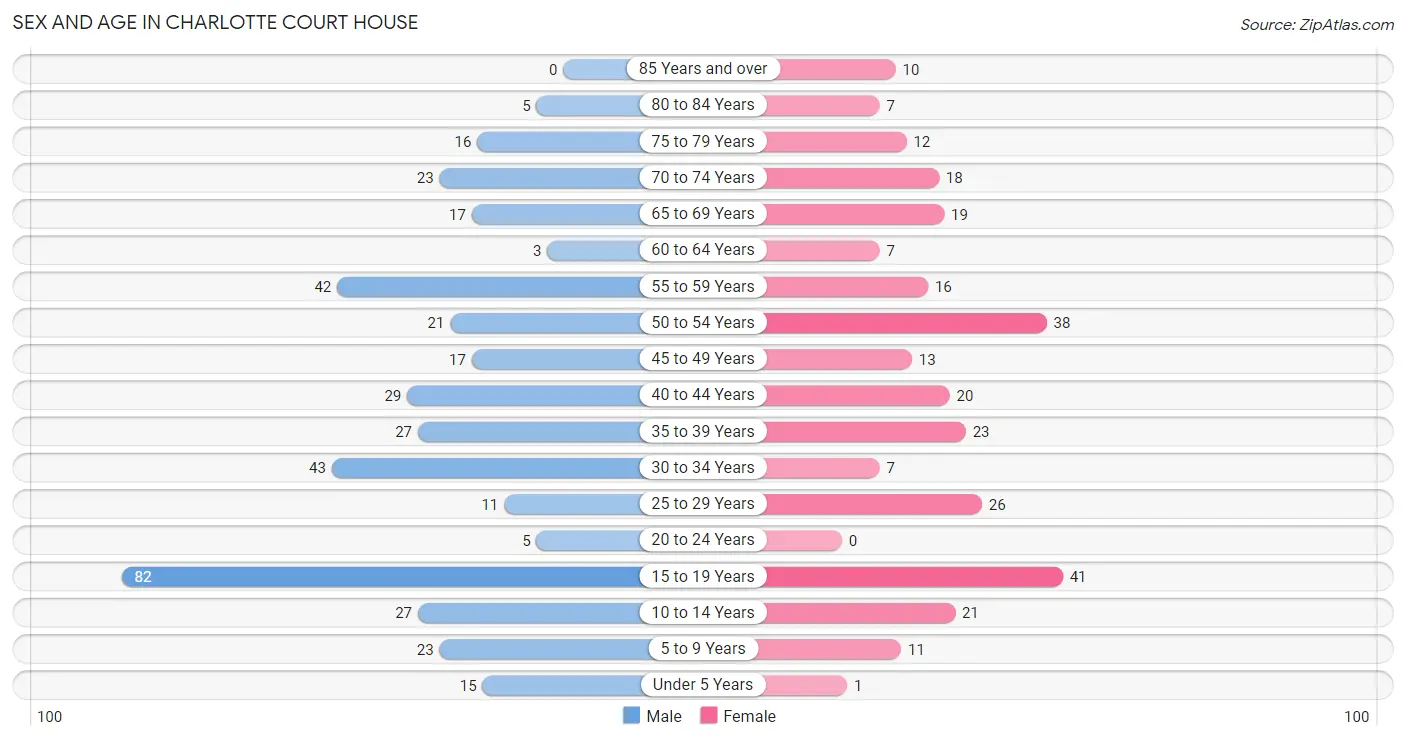
| Age Bracket | Male | Female |
| Under 5 Years | 15 (3.7%) | 1 (0.3%) |
| 5 to 9 Years | 23 (5.7%) | 11 (3.8%) |
| 10 to 14 Years | 27 (6.7%) | 21 (7.2%) |
| 15 to 19 Years | 82 (20.2%) | 41 (14.1%) |
| 20 to 24 Years | 5 (1.2%) | 0 (0.0%) |
| 25 to 29 Years | 11 (2.7%) | 26 (9.0%) |
| 30 to 34 Years | 43 (10.6%) | 7 (2.4%) |
| 35 to 39 Years | 27 (6.7%) | 23 (7.9%) |
| 40 to 44 Years | 29 (7.1%) | 20 (6.9%) |
| 45 to 49 Years | 17 (4.2%) | 13 (4.5%) |
| 50 to 54 Years | 21 (5.2%) | 38 (13.1%) |
| 55 to 59 Years | 42 (10.3%) | 16 (5.5%) |
| 60 to 64 Years | 3 (0.7%) | 7 (2.4%) |
| 65 to 69 Years | 17 (4.2%) | 19 (6.6%) |
| 70 to 74 Years | 23 (5.7%) | 18 (6.2%) |
| 75 to 79 Years | 16 (3.9%) | 12 (4.1%) |
| 80 to 84 Years | 5 (1.2%) | 7 (2.4%) |
| 85 Years and over | 0 (0.0%) | 10 (3.5%) |
| Total | 406 (100.0%) | 290 (100.0%) |
Families and Households in Charlotte Court House
Median Family Size in Charlotte Court House
The median family size in Charlotte Court House is 3.72 persons per family, with single male/father families (8 | 5.8%) accounting for the largest median family size of 8 persons per family. On the other hand, married-couple families (114 | 82.6%) represent the smallest median family size with 3.25 persons per family.
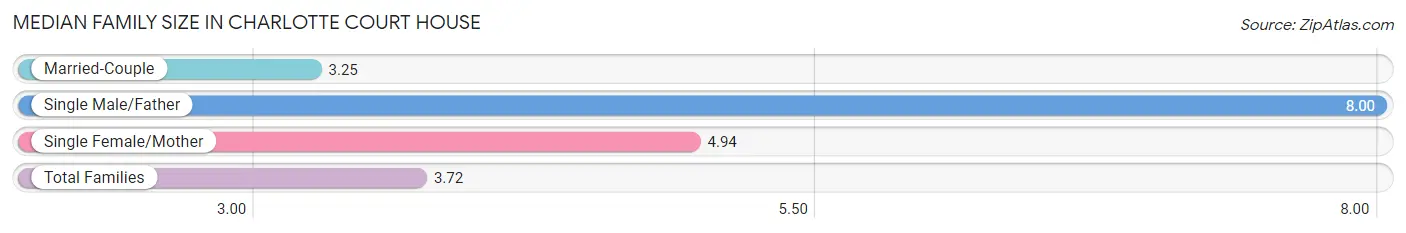
| Family Type | # Families | Family Size |
| Married-Couple | 114 (82.6%) | 3.25 |
| Single Male/Father | 8 (5.8%) | 8.00 |
| Single Female/Mother | 16 (11.6%) | 4.94 |
| Total Families | 138 (100.0%) | 3.72 |
Median Household Size in Charlotte Court House
The median household size in Charlotte Court House is 2.81 persons per household, with single male/father households (8 | 3.5%) accounting for the largest median household size of 8.5 persons per household. non-family households (88 | 38.9%) represent the smallest median household size with 1.32 persons per household.
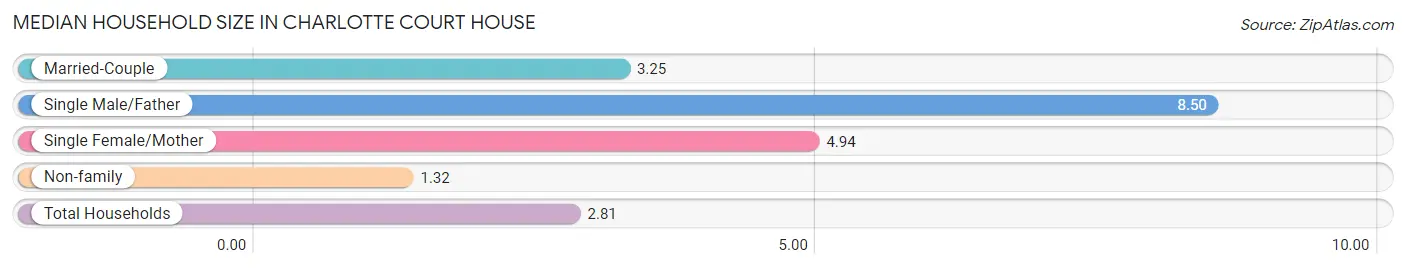
| Household Type | # Households | Household Size |
| Married-Couple | 114 (50.4%) | 3.25 |
| Single Male/Father | 8 (3.5%) | 8.50 |
| Single Female/Mother | 16 (7.1%) | 4.94 |
| Non-family | 88 (38.9%) | 1.32 |
| Total Households | 226 (100.0%) | 2.81 |
Household Size by Marriage Status in Charlotte Court House
Out of a total of 226 households in Charlotte Court House, 138 (61.1%) are family households, while 88 (38.9%) are nonfamily households. The most numerous type of family households are 2-person households, comprising 68, and the most common type of nonfamily households are 1-person households, comprising 69.
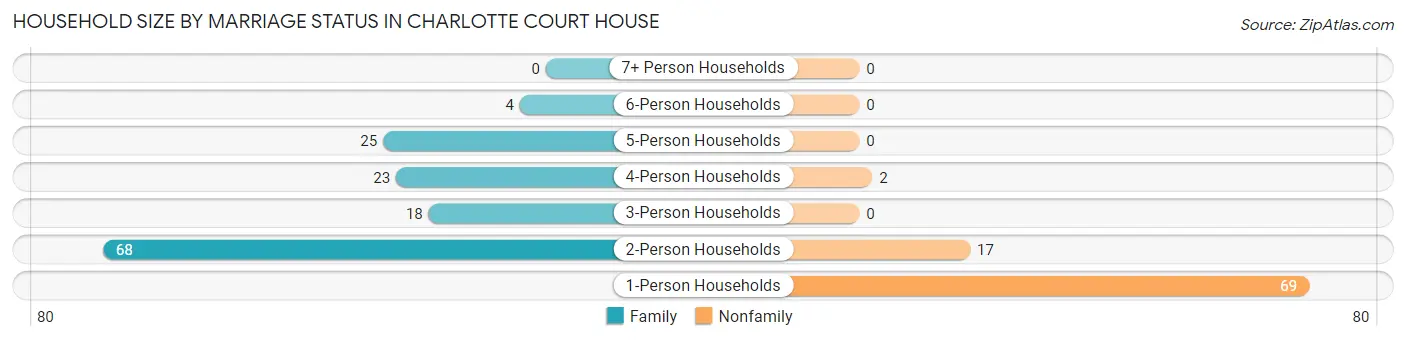
| Household Size | Family Households | Nonfamily Households |
| 1-Person Households | - | 69 (30.5%) |
| 2-Person Households | 68 (30.1%) | 17 (7.5%) |
| 3-Person Households | 18 (8.0%) | 0 (0.0%) |
| 4-Person Households | 23 (10.2%) | 2 (0.9%) |
| 5-Person Households | 25 (11.1%) | 0 (0.0%) |
| 6-Person Households | 4 (1.8%) | 0 (0.0%) |
| 7+ Person Households | 0 (0.0%) | 0 (0.0%) |
| Total | 138 (61.1%) | 88 (38.9%) |
Female Fertility in Charlotte Court House
Fertility by Age in Charlotte Court House
Average fertility rate in Charlotte Court House is 21.0 births per 1,000 women. Women in the age bracket of 20 to 34 years have the highest fertility rate with 91.0 births per 1,000 women. Women in the age bracket of 20 to 34 years acount for 100.0% of all women with births.
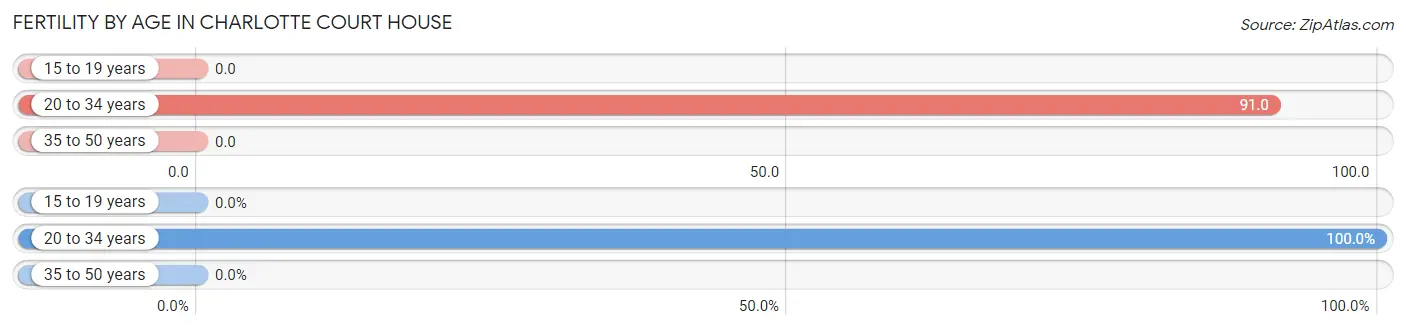
| Age Bracket | Women with Births | Births / 1,000 Women |
| 15 to 19 years | 0 (0.0%) | 0.0 |
| 20 to 34 years | 3 (100.0%) | 91.0 |
| 35 to 50 years | 0 (0.0%) | 0.0 |
| Total | 3 (100.0%) | 21.0 |
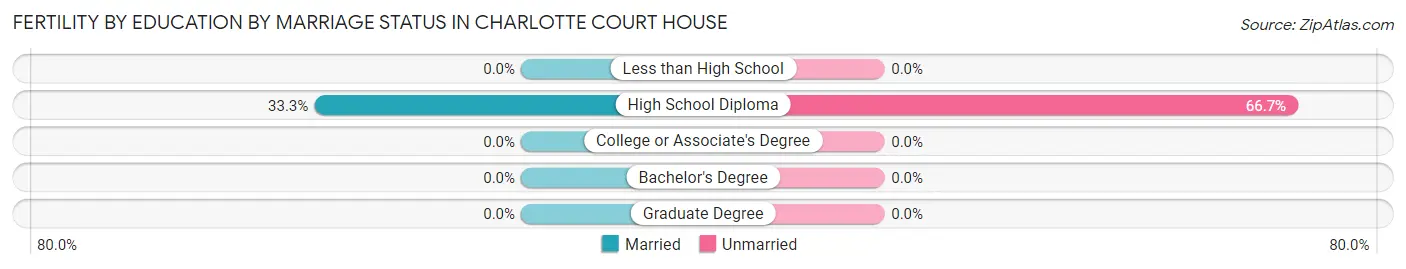
Fertility by Age by Marriage Status in Charlotte Court House
33.3% of women with births (3) in Charlotte Court House are married. The highest percentage of unmarried women with births falls into 20 to 34 years age bracket with 66.7% of them unmarried at the time of birth, while the lowest percentage of unmarried women with births belong to 20 to 34 years age bracket with 66.7% of them unmarried.
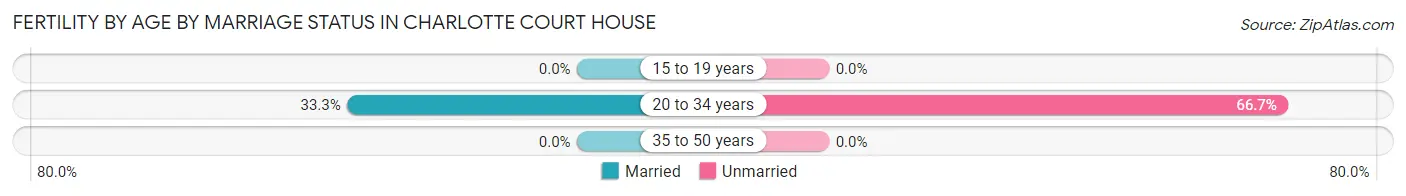
| Age Bracket | Married | Unmarried |
| 15 to 19 years | 0 (0.0%) | 0 (0.0%) |
| 20 to 34 years | 1 (33.3%) | 2 (66.7%) |
| 35 to 50 years | 0 (0.0%) | 0 (0.0%) |
| Total | 1 (33.3%) | 2 (66.7%) |
Fertility by Education in Charlotte Court House
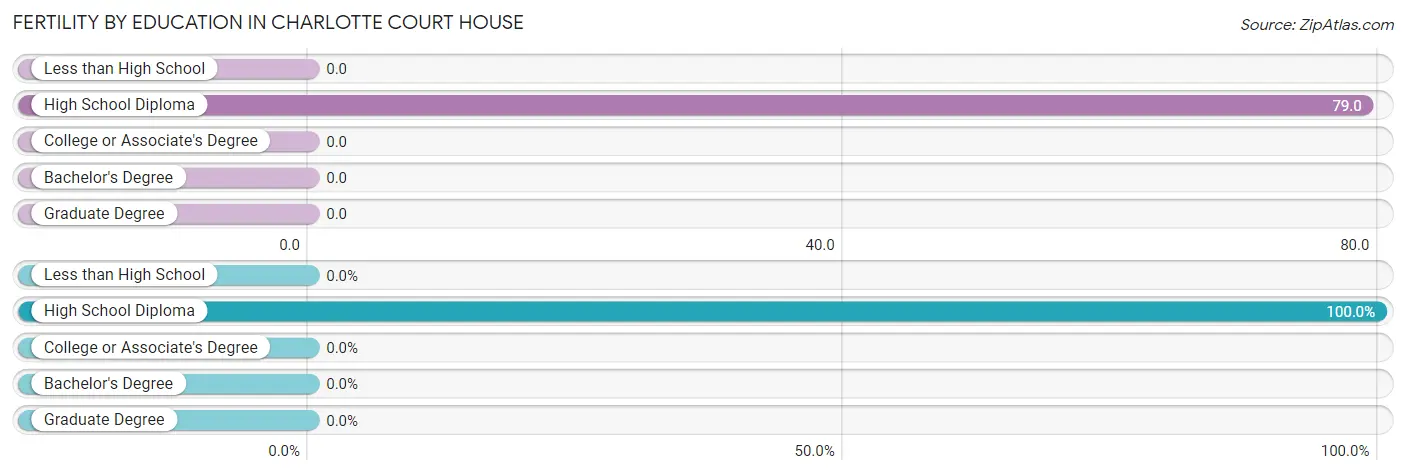
| Educational Attainment | Women with Births | Births / 1,000 Women |
| Less than High School | 0 (0.0%) | 0.0 |
| High School Diploma | 3 (100.0%) | 79.0 |
| College or Associate's Degree | 0 (0.0%) | 0.0 |
| Bachelor's Degree | 0 (0.0%) | 0.0 |
| Graduate Degree | 0 (0.0%) | 0.0 |
| Total | 3 (100.0%) | 21.0 |
Fertility by Education by Marriage Status in Charlotte Court House
66.7% of women with births in Charlotte Court House are unmarried. Women with the educational attainment of high school diploma are most likely to be married with 33.3% of them married at childbirth, while women with the educational attainment of high school diploma are least likely to be married with 66.7% of them unmarried at childbirth.
| Educational Attainment | Married | Unmarried |
| Less than High School | 0 (0.0%) | 0 (0.0%) |
| High School Diploma | 1 (33.3%) | 2 (66.7%) |
| College or Associate's Degree | 0 (0.0%) | 0 (0.0%) |
| Bachelor's Degree | 0 (0.0%) | 0 (0.0%) |
| Graduate Degree | 0 (0.0%) | 0 (0.0%) |
| Total | 1 (33.3%) | 2 (66.7%) |
Employment Characteristics in Charlotte Court House
Employment by Class of Employer in Charlotte Court House
Among the 317 employed individuals in Charlotte Court House, private company employees (172 | 54.3%), local government employees (55 | 17.3%), and state government employees (37 | 11.7%) make up the most common classes of employment.
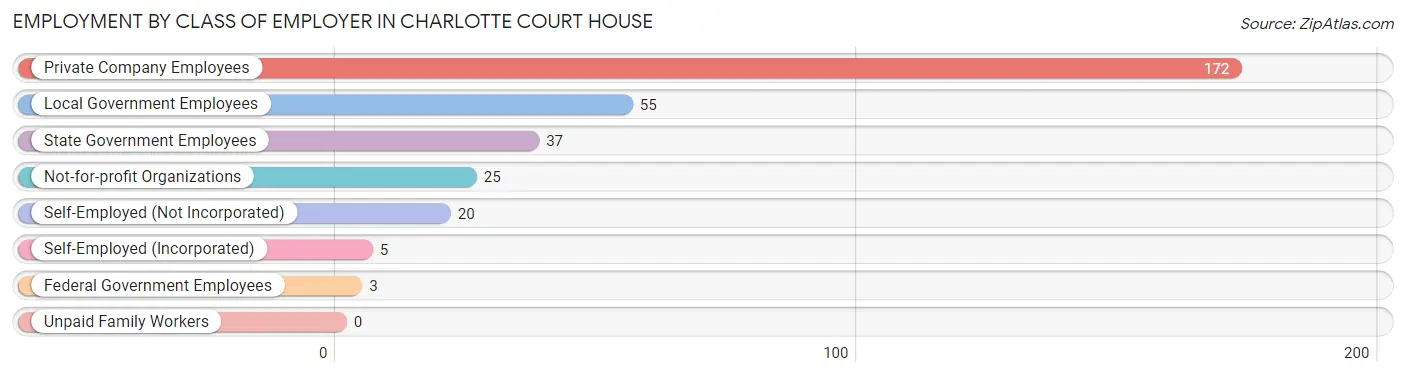
| Employer Class | # Employees | % Employees |
| Private Company Employees | 172 | 54.3% |
| Self-Employed (Incorporated) | 5 | 1.6% |
| Self-Employed (Not Incorporated) | 20 | 6.3% |
| Not-for-profit Organizations | 25 | 7.9% |
| Local Government Employees | 55 | 17.3% |
| State Government Employees | 37 | 11.7% |
| Federal Government Employees | 3 | 0.9% |
| Unpaid Family Workers | 0 | 0.0% |
| Total | 317 | 100.0% |
Employment Status by Age in Charlotte Court House
According to the labor force statistics for Charlotte Court House, out of the total population over 16 years of age (592), 55.7% or 330 individuals are in the labor force, with 1.8% or 6 of them unemployed. The age group with the highest labor force participation rate is 20 to 24 years, with 100.0% or 5 individuals in the labor force. Within the labor force, the 20 to 24 years age range has the highest percentage of unemployed individuals, with 100.0% or 5 of them being unemployed.
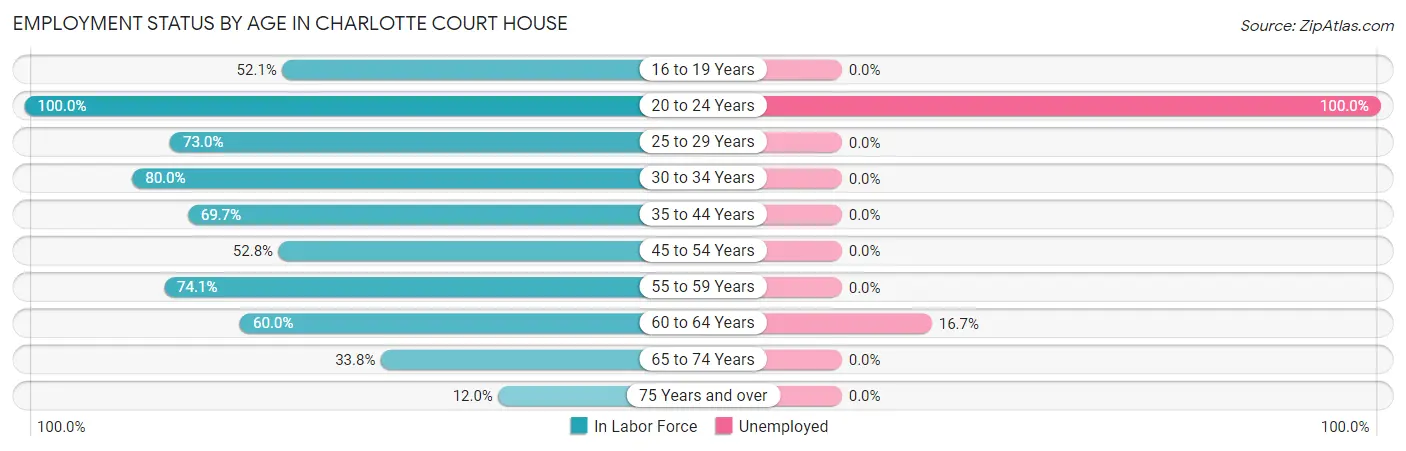
| Age Bracket | In Labor Force | Unemployed |
| 16 to 19 Years | 61 (52.1%) | 0 (0.0%) |
| 20 to 24 Years | 5 (100.0%) | 5 (100.0%) |
| 25 to 29 Years | 27 (73.0%) | 0 (0.0%) |
| 30 to 34 Years | 40 (80.0%) | 0 (0.0%) |
| 35 to 44 Years | 69 (69.7%) | 0 (0.0%) |
| 45 to 54 Years | 47 (52.8%) | 0 (0.0%) |
| 55 to 59 Years | 43 (74.1%) | 0 (0.0%) |
| 60 to 64 Years | 6 (60.0%) | 1 (16.7%) |
| 65 to 74 Years | 26 (33.8%) | 0 (0.0%) |
| 75 Years and over | 6 (12.0%) | 0 (0.0%) |
| Total | 330 (55.7%) | 6 (1.8%) |
Employment Status by Educational Attainment in Charlotte Court House
According to labor force statistics for Charlotte Court House, 67.6% of individuals (232) out of the total population between 25 and 64 years of age (343) are in the labor force, with 0.4% or 1 of them being unemployed. The group with the highest labor force participation rate are those with the educational attainment of bachelor's degree or higher, with 97.1% or 100 individuals in the labor force. Within the labor force, individuals with college / associate degree education have the highest percentage of unemployment, with 1.5% or 1 of them being unemployed.
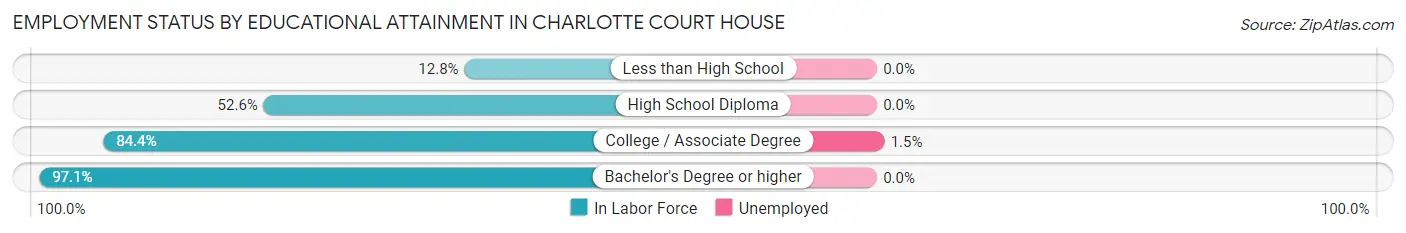
| Educational Attainment | In Labor Force | Unemployed |
| Less than High School | 6 (12.8%) | 0 (0.0%) |
| High School Diploma | 61 (52.6%) | 0 (0.0%) |
| College / Associate Degree | 65 (84.4%) | 1 (1.5%) |
| Bachelor's Degree or higher | 100 (97.1%) | 0 (0.0%) |
| Total | 232 (67.6%) | 1 (0.4%) |
Employment Occupations by Sex in Charlotte Court House
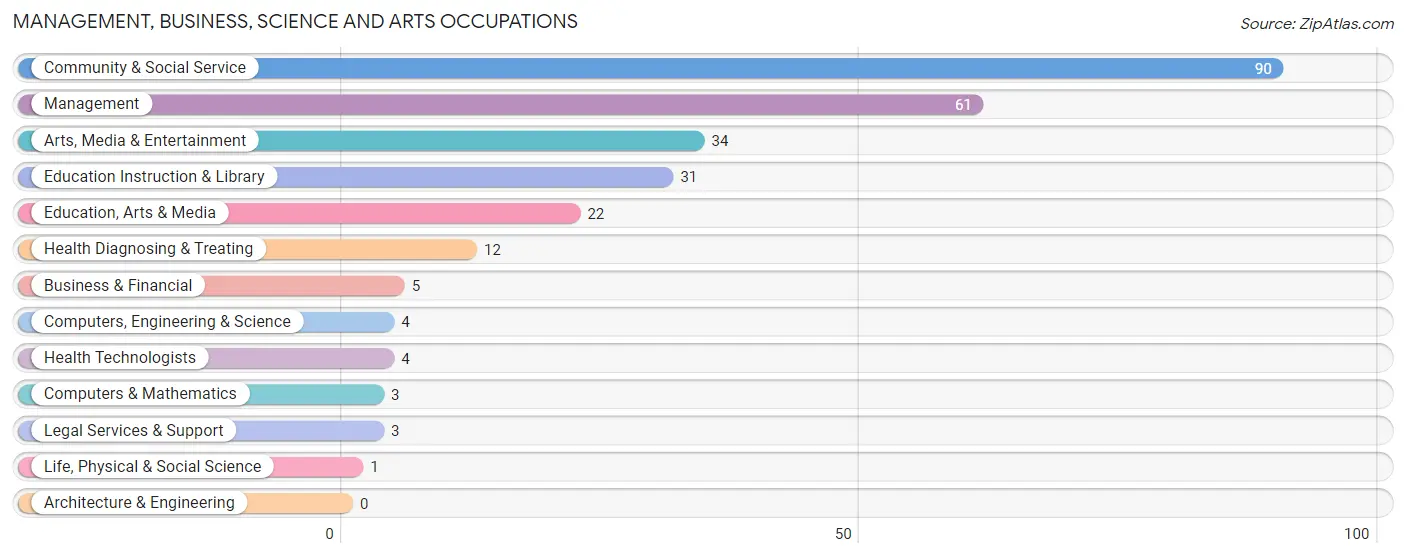
Management, Business, Science and Arts Occupations
The most common Management, Business, Science and Arts occupations in Charlotte Court House are Community & Social Service (90 | 27.8%), Management (61 | 18.8%), Arts, Media & Entertainment (34 | 10.5%), Education Instruction & Library (31 | 9.6%), and Education, Arts & Media (22 | 6.8%).
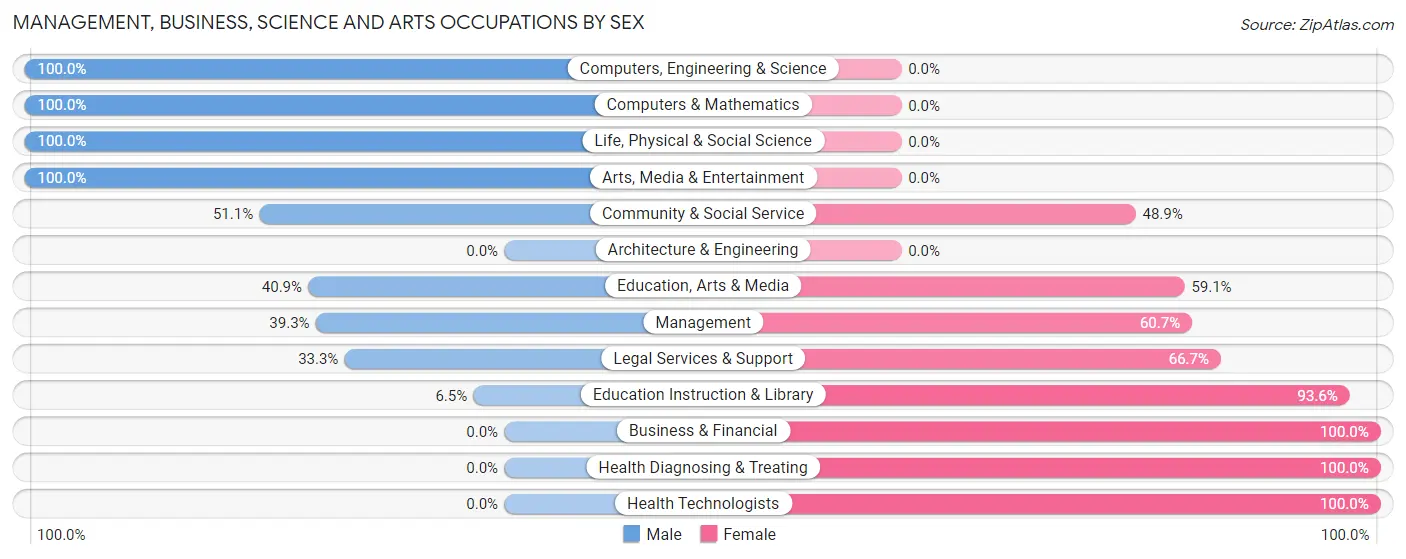
Management, Business, Science and Arts Occupations by Sex
Within the Management, Business, Science and Arts occupations in Charlotte Court House, the most male-oriented occupations are Computers, Engineering & Science (100.0%), Computers & Mathematics (100.0%), and Life, Physical & Social Science (100.0%), while the most female-oriented occupations are Business & Financial (100.0%), Health Diagnosing & Treating (100.0%), and Health Technologists (100.0%).
| Occupation | Male | Female |
| Management | 24 (39.3%) | 37 (60.7%) |
| Business & Financial | 0 (0.0%) | 5 (100.0%) |
| Computers, Engineering & Science | 4 (100.0%) | 0 (0.0%) |
| Computers & Mathematics | 3 (100.0%) | 0 (0.0%) |
| Architecture & Engineering | 0 (0.0%) | 0 (0.0%) |
| Life, Physical & Social Science | 1 (100.0%) | 0 (0.0%) |
| Community & Social Service | 46 (51.1%) | 44 (48.9%) |
| Education, Arts & Media | 9 (40.9%) | 13 (59.1%) |
| Legal Services & Support | 1 (33.3%) | 2 (66.7%) |
| Education Instruction & Library | 2 (6.5%) | 29 (93.5%) |
| Arts, Media & Entertainment | 34 (100.0%) | 0 (0.0%) |
| Health Diagnosing & Treating | 0 (0.0%) | 12 (100.0%) |
| Health Technologists | 0 (0.0%) | 4 (100.0%) |
| Total (Category) | 74 (43.0%) | 98 (57.0%) |
| Total (Overall) | 160 (49.4%) | 164 (50.6%) |
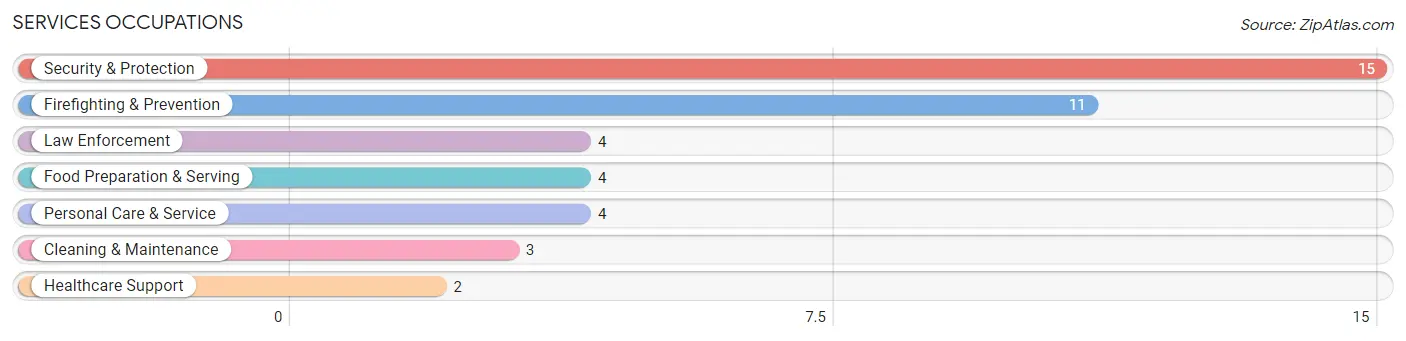
Services Occupations
The most common Services occupations in Charlotte Court House are Security & Protection (15 | 4.6%), Firefighting & Prevention (11 | 3.4%), Law Enforcement (4 | 1.2%), Food Preparation & Serving (4 | 1.2%), and Personal Care & Service (4 | 1.2%).
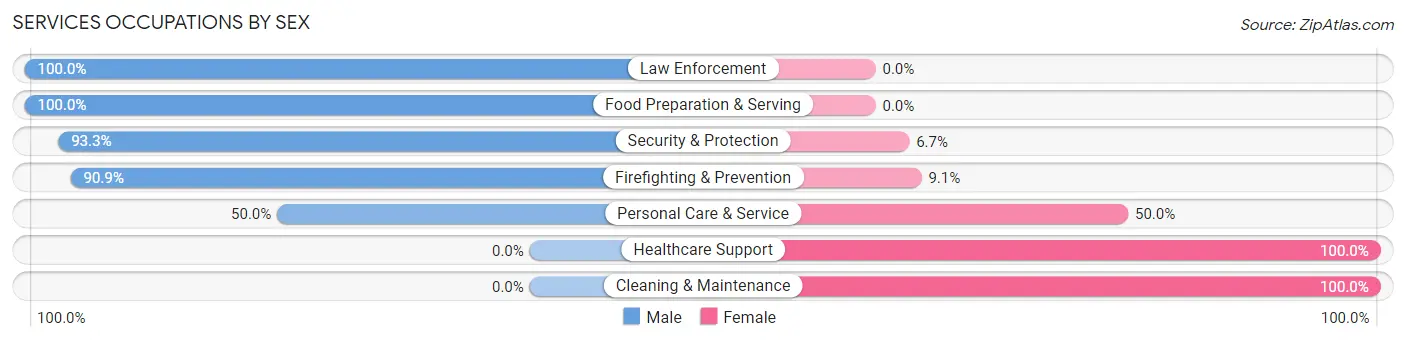
Services Occupations by Sex
Within the Services occupations in Charlotte Court House, the most male-oriented occupations are Law Enforcement (100.0%), Food Preparation & Serving (100.0%), and Security & Protection (93.3%), while the most female-oriented occupations are Healthcare Support (100.0%), Cleaning & Maintenance (100.0%), and Personal Care & Service (50.0%).
| Occupation | Male | Female |
| Healthcare Support | 0 (0.0%) | 2 (100.0%) |
| Security & Protection | 14 (93.3%) | 1 (6.7%) |
| Firefighting & Prevention | 10 (90.9%) | 1 (9.1%) |
| Law Enforcement | 4 (100.0%) | 0 (0.0%) |
| Food Preparation & Serving | 4 (100.0%) | 0 (0.0%) |
| Cleaning & Maintenance | 0 (0.0%) | 3 (100.0%) |
| Personal Care & Service | 2 (50.0%) | 2 (50.0%) |
| Total (Category) | 20 (71.4%) | 8 (28.6%) |
| Total (Overall) | 160 (49.4%) | 164 (50.6%) |
Sales and Office Occupations
The most common Sales and Office occupations in Charlotte Court House are Sales & Related (52 | 16.1%), and Office & Administration (29 | 8.9%).
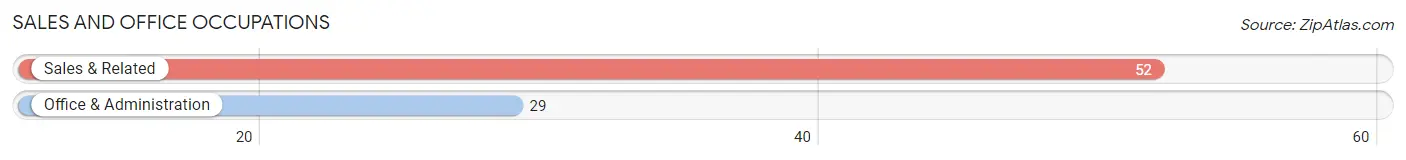
Sales and Office Occupations by Sex

| Occupation | Male | Female |
| Sales & Related | 22 (42.3%) | 30 (57.7%) |
| Office & Administration | 2 (6.9%) | 27 (93.1%) |
| Total (Category) | 24 (29.6%) | 57 (70.4%) |
| Total (Overall) | 160 (49.4%) | 164 (50.6%) |
Natural Resources, Construction and Maintenance Occupations
The most common Natural Resources, Construction and Maintenance occupations in Charlotte Court House are Farming, Fishing & Forestry (10 | 3.1%), Installation, Maintenance & Repair (3 | 0.9%), and Construction & Extraction (2 | 0.6%).
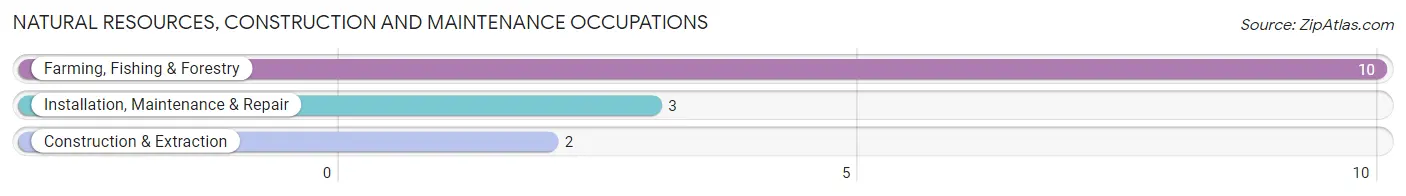
Natural Resources, Construction and Maintenance Occupations by Sex

| Occupation | Male | Female |
| Farming, Fishing & Forestry | 10 (100.0%) | 0 (0.0%) |
| Construction & Extraction | 2 (100.0%) | 0 (0.0%) |
| Installation, Maintenance & Repair | 3 (100.0%) | 0 (0.0%) |
| Total (Category) | 15 (100.0%) | 0 (0.0%) |
| Total (Overall) | 160 (49.4%) | 164 (50.6%) |
Production, Transportation and Moving Occupations
The most common Production, Transportation and Moving occupations in Charlotte Court House are Transportation (12 | 3.7%), Production (9 | 2.8%), and Material Moving (7 | 2.2%).
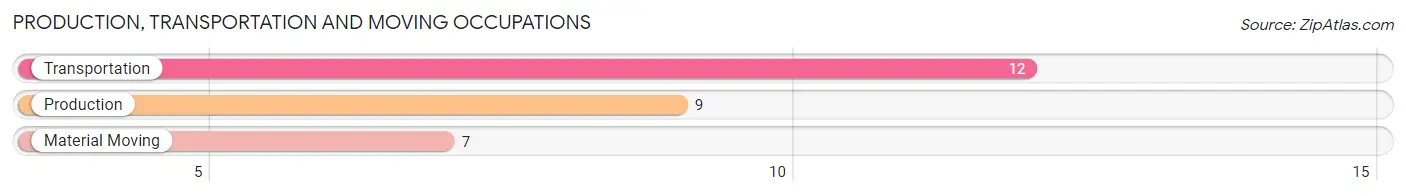
Production, Transportation and Moving Occupations by Sex
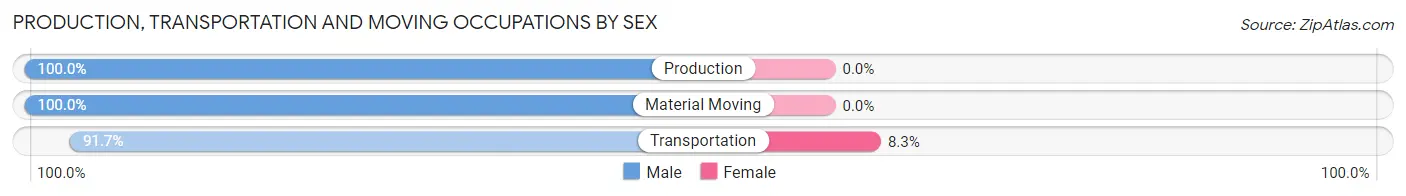
| Occupation | Male | Female |
| Production | 9 (100.0%) | 0 (0.0%) |
| Transportation | 11 (91.7%) | 1 (8.3%) |
| Material Moving | 7 (100.0%) | 0 (0.0%) |
| Total (Category) | 27 (96.4%) | 1 (3.6%) |
| Total (Overall) | 160 (49.4%) | 164 (50.6%) |
Employment Industries by Sex in Charlotte Court House
Employment Industries in Charlotte Court House
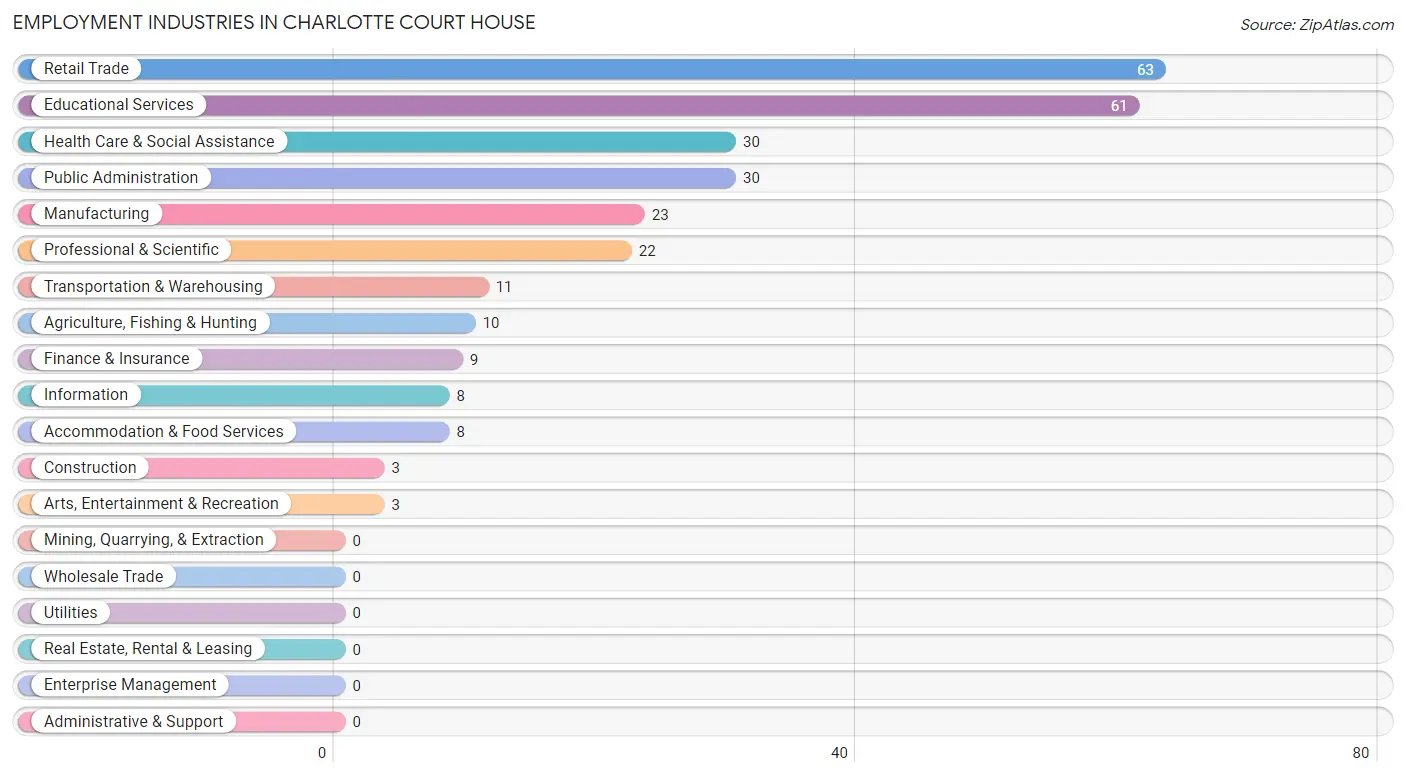
The major employment industries in Charlotte Court House include Retail Trade (63 | 19.4%), Educational Services (61 | 18.8%), Health Care & Social Assistance (30 | 9.3%), Public Administration (30 | 9.3%), and Manufacturing (23 | 7.1%).
Employment Industries by Sex in Charlotte Court House
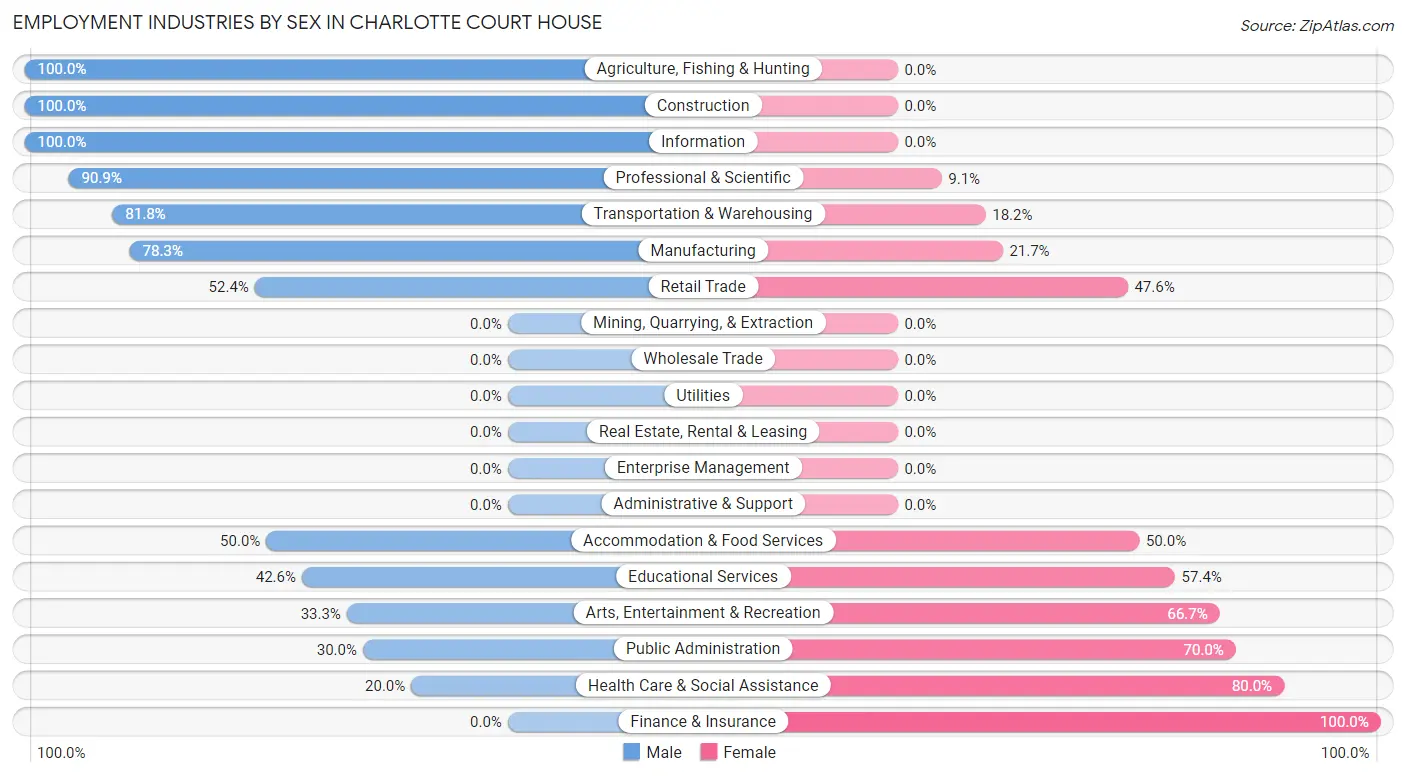
The Charlotte Court House industries that see more men than women are Agriculture, Fishing & Hunting (100.0%), Construction (100.0%), and Information (100.0%), whereas the industries that tend to have a higher number of women are Finance & Insurance (100.0%), Health Care & Social Assistance (80.0%), and Public Administration (70.0%).
| Industry | Male | Female |
| Agriculture, Fishing & Hunting | 10 (100.0%) | 0 (0.0%) |
| Mining, Quarrying, & Extraction | 0 (0.0%) | 0 (0.0%) |
| Construction | 3 (100.0%) | 0 (0.0%) |
| Manufacturing | 18 (78.3%) | 5 (21.7%) |
| Wholesale Trade | 0 (0.0%) | 0 (0.0%) |
| Retail Trade | 33 (52.4%) | 30 (47.6%) |
| Transportation & Warehousing | 9 (81.8%) | 2 (18.2%) |
| Utilities | 0 (0.0%) | 0 (0.0%) |
| Information | 8 (100.0%) | 0 (0.0%) |
| Finance & Insurance | 0 (0.0%) | 9 (100.0%) |
| Real Estate, Rental & Leasing | 0 (0.0%) | 0 (0.0%) |
| Professional & Scientific | 20 (90.9%) | 2 (9.1%) |
| Enterprise Management | 0 (0.0%) | 0 (0.0%) |
| Administrative & Support | 0 (0.0%) | 0 (0.0%) |
| Educational Services | 26 (42.6%) | 35 (57.4%) |
| Health Care & Social Assistance | 6 (20.0%) | 24 (80.0%) |
| Arts, Entertainment & Recreation | 1 (33.3%) | 2 (66.7%) |
| Accommodation & Food Services | 4 (50.0%) | 4 (50.0%) |
| Public Administration | 9 (30.0%) | 21 (70.0%) |
| Total | 160 (49.4%) | 164 (50.6%) |
Education in Charlotte Court House
School Enrollment in Charlotte Court House
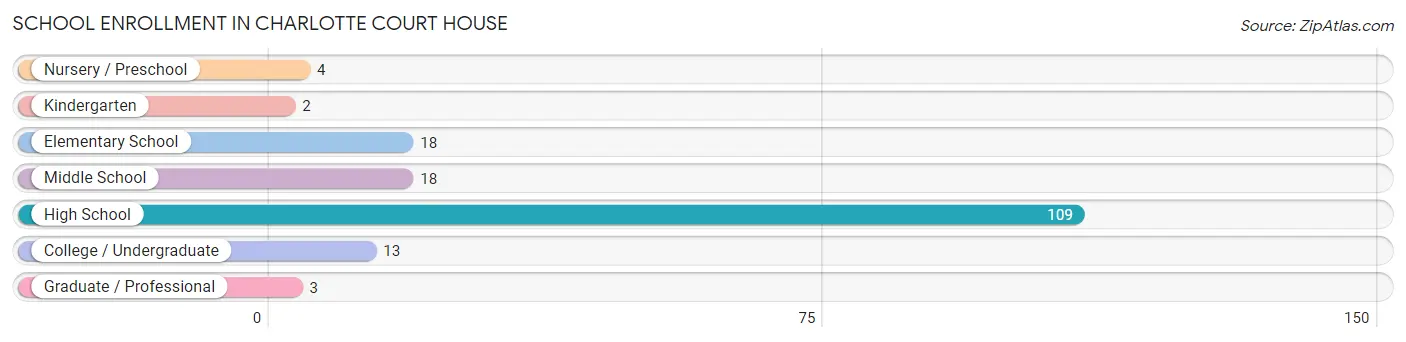
The most common levels of schooling among the 167 students in Charlotte Court House are high school (109 | 65.3%), elementary school (18 | 10.8%), and middle school (18 | 10.8%).
| School Level | # Students | % Students |
| Nursery / Preschool | 4 | 2.4% |
| Kindergarten | 2 | 1.2% |
| Elementary School | 18 | 10.8% |
| Middle School | 18 | 10.8% |
| High School | 109 | 65.3% |
| College / Undergraduate | 13 | 7.8% |
| Graduate / Professional | 3 | 1.8% |
| Total | 167 | 100.0% |
School Enrollment by Age by Funding Source in Charlotte Court House
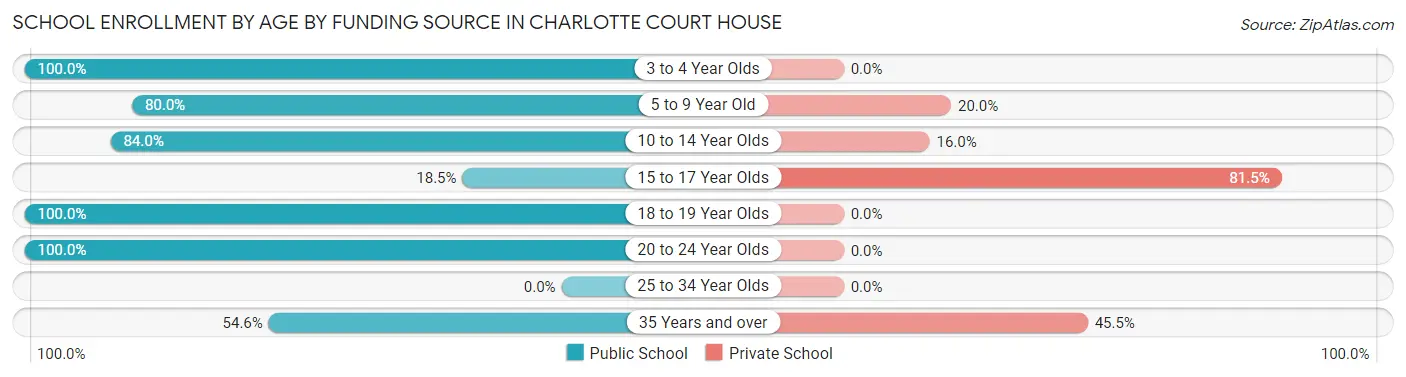
Out of a total of 167 students who are enrolled in schools in Charlotte Court House, 65 (38.9%) attend a private institution, while the remaining 102 (61.1%) are enrolled in public schools. The age group of 15 to 17 year olds has the highest likelihood of being enrolled in private schools, with 53 (81.5% in the age bracket) enrolled. Conversely, the age group of 3 to 4 year olds has the lowest likelihood of being enrolled in a private school, with 2 (100.0% in the age bracket) attending a public institution.
| Age Bracket | Public School | Private School |
| 3 to 4 Year Olds | 2 (100.0%) | 0 (0.0%) |
| 5 to 9 Year Old | 12 (80.0%) | 3 (20.0%) |
| 10 to 14 Year Olds | 21 (84.0%) | 4 (16.0%) |
| 15 to 17 Year Olds | 12 (18.5%) | 53 (81.5%) |
| 18 to 19 Year Olds | 44 (100.0%) | 0 (0.0%) |
| 20 to 24 Year Olds | 5 (100.0%) | 0 (0.0%) |
| 25 to 34 Year Olds | 0 (0.0%) | 0 (0.0%) |
| 35 Years and over | 6 (54.5%) | 5 (45.5%) |
| Total | 102 (61.1%) | 65 (38.9%) |
Educational Attainment by Field of Study in Charlotte Court House
Business (33 | 20.7%), education (32 | 20.1%), arts & humanities (30 | 18.9%), social sciences (14 | 8.8%), and literature & languages (11 | 6.9%) are the most common fields of study among 159 individuals in Charlotte Court House who have obtained a bachelor's degree or higher.
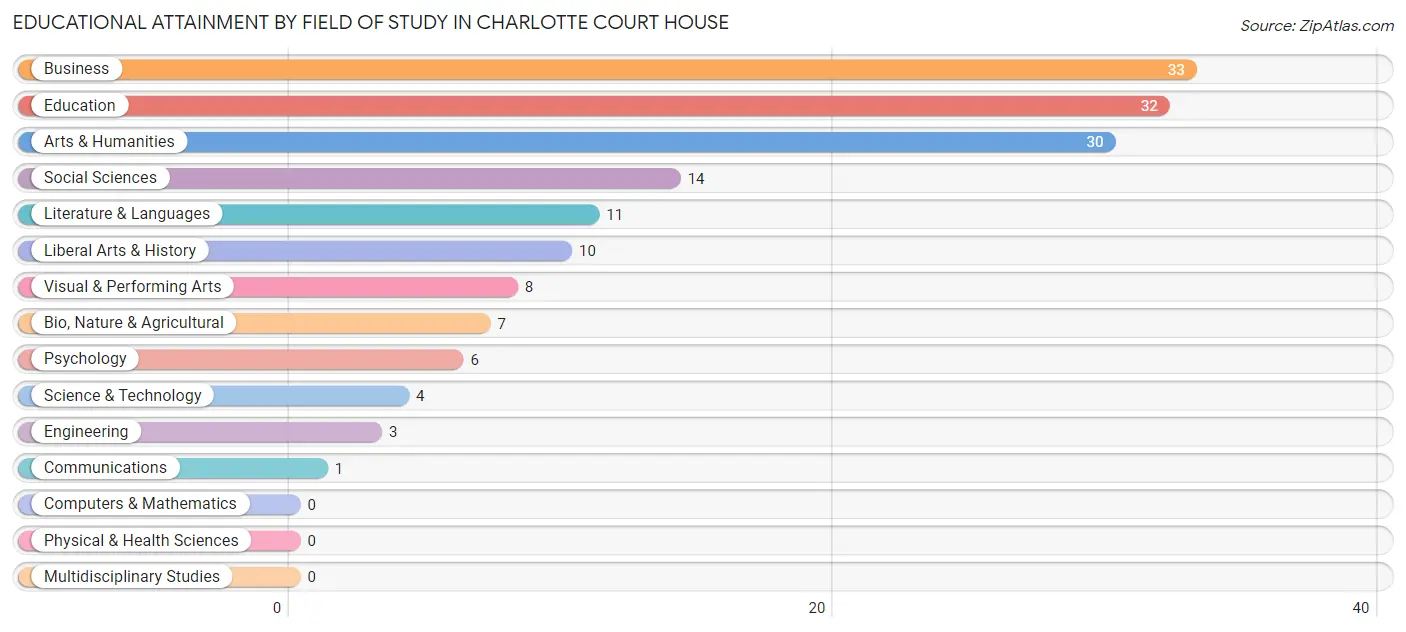
| Field of Study | # Graduates | % Graduates |
| Computers & Mathematics | 0 | 0.0% |
| Bio, Nature & Agricultural | 7 | 4.4% |
| Physical & Health Sciences | 0 | 0.0% |
| Psychology | 6 | 3.8% |
| Social Sciences | 14 | 8.8% |
| Engineering | 3 | 1.9% |
| Multidisciplinary Studies | 0 | 0.0% |
| Science & Technology | 4 | 2.5% |
| Business | 33 | 20.7% |
| Education | 32 | 20.1% |
| Literature & Languages | 11 | 6.9% |
| Liberal Arts & History | 10 | 6.3% |
| Visual & Performing Arts | 8 | 5.0% |
| Communications | 1 | 0.6% |
| Arts & Humanities | 30 | 18.9% |
| Total | 159 | 100.0% |
Transportation & Commute in Charlotte Court House
Vehicle Availability by Sex in Charlotte Court House
The most prevalent vehicle ownership categories in Charlotte Court House are males with 2 vehicles (50, accounting for 32.5%) and females with 2 vehicles (46, making up 30.7%).
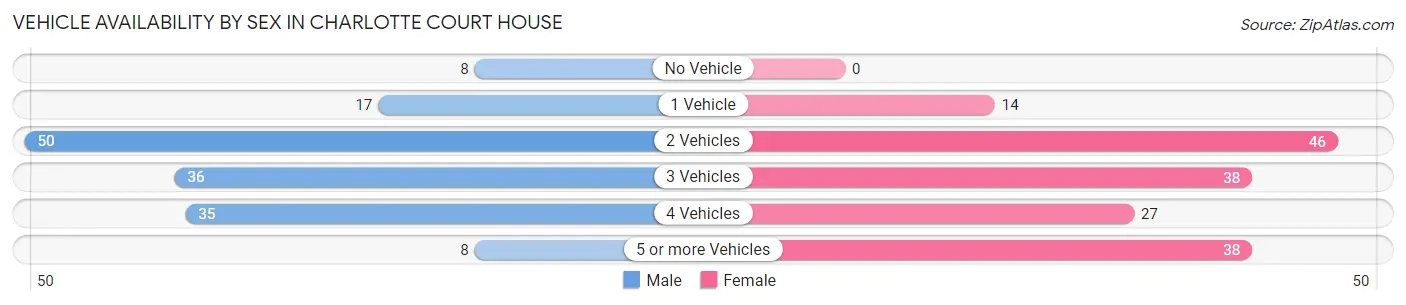
| Vehicles Available | Male | Female |
| No Vehicle | 8 (5.2%) | 0 (0.0%) |
| 1 Vehicle | 17 (11.0%) | 14 (8.6%) |
| 2 Vehicles | 50 (32.5%) | 46 (28.2%) |
| 3 Vehicles | 36 (23.4%) | 38 (23.3%) |
| 4 Vehicles | 35 (22.7%) | 27 (16.6%) |
| 5 or more Vehicles | 8 (5.2%) | 38 (23.3%) |
| Total | 154 (100.0%) | 163 (100.0%) |
Commute Time in Charlotte Court House
The most frequently occuring commute durations in Charlotte Court House are 30 to 34 minutes (68 commuters, 23.7%), less than 5 minutes (41 commuters, 14.3%), and 5 to 9 minutes (28 commuters, 9.8%).
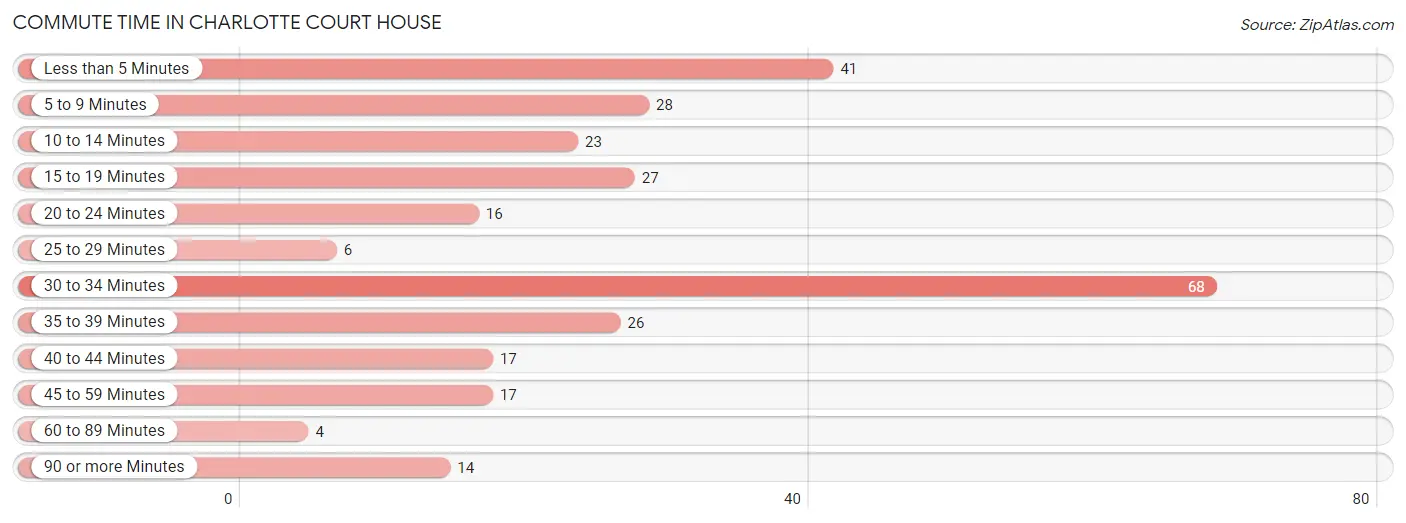
| Commute Time | # Commuters | % Commuters |
| Less than 5 Minutes | 41 | 14.3% |
| 5 to 9 Minutes | 28 | 9.8% |
| 10 to 14 Minutes | 23 | 8.0% |
| 15 to 19 Minutes | 27 | 9.4% |
| 20 to 24 Minutes | 16 | 5.6% |
| 25 to 29 Minutes | 6 | 2.1% |
| 30 to 34 Minutes | 68 | 23.7% |
| 35 to 39 Minutes | 26 | 9.1% |
| 40 to 44 Minutes | 17 | 5.9% |
| 45 to 59 Minutes | 17 | 5.9% |
| 60 to 89 Minutes | 4 | 1.4% |
| 90 or more Minutes | 14 | 4.9% |
Commute Time by Sex in Charlotte Court House
The most common commute times in Charlotte Court House are 30 to 34 minutes (38 commuters, 29.5%) for males and 30 to 34 minutes (30 commuters, 19.0%) for females.
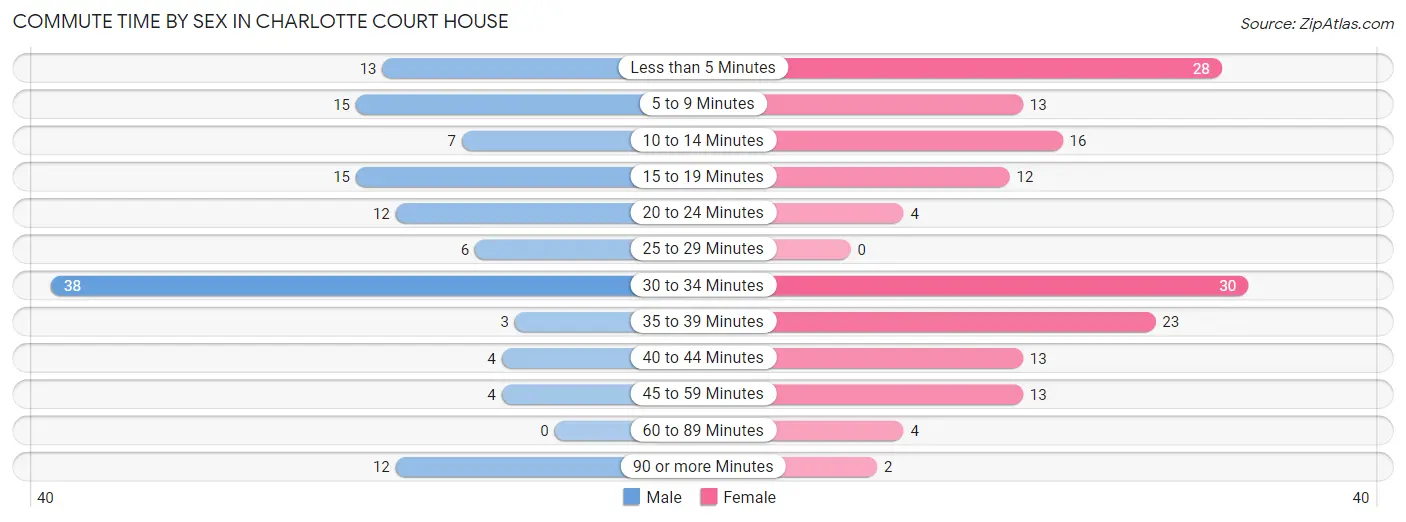
| Commute Time | Male | Female |
| Less than 5 Minutes | 13 (10.1%) | 28 (17.7%) |
| 5 to 9 Minutes | 15 (11.6%) | 13 (8.2%) |
| 10 to 14 Minutes | 7 (5.4%) | 16 (10.1%) |
| 15 to 19 Minutes | 15 (11.6%) | 12 (7.6%) |
| 20 to 24 Minutes | 12 (9.3%) | 4 (2.5%) |
| 25 to 29 Minutes | 6 (4.6%) | 0 (0.0%) |
| 30 to 34 Minutes | 38 (29.5%) | 30 (19.0%) |
| 35 to 39 Minutes | 3 (2.3%) | 23 (14.6%) |
| 40 to 44 Minutes | 4 (3.1%) | 13 (8.2%) |
| 45 to 59 Minutes | 4 (3.1%) | 13 (8.2%) |
| 60 to 89 Minutes | 0 (0.0%) | 4 (2.5%) |
| 90 or more Minutes | 12 (9.3%) | 2 (1.3%) |
Time of Departure to Work by Sex in Charlotte Court House
The most frequent times of departure to work in Charlotte Court House are 6:30 AM to 6:59 AM (28, 21.7%) for males and 6:30 AM to 6:59 AM (53, 33.5%) for females.
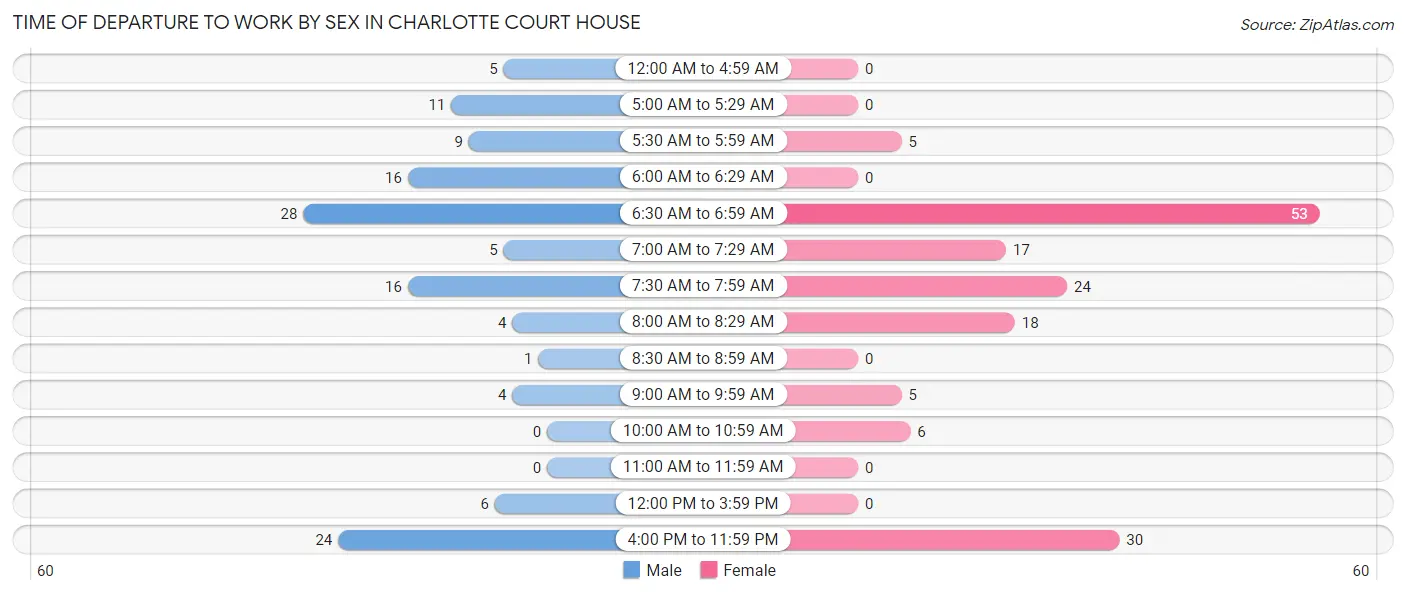
| Time of Departure | Male | Female |
| 12:00 AM to 4:59 AM | 5 (3.9%) | 0 (0.0%) |
| 5:00 AM to 5:29 AM | 11 (8.5%) | 0 (0.0%) |
| 5:30 AM to 5:59 AM | 9 (7.0%) | 5 (3.2%) |
| 6:00 AM to 6:29 AM | 16 (12.4%) | 0 (0.0%) |
| 6:30 AM to 6:59 AM | 28 (21.7%) | 53 (33.5%) |
| 7:00 AM to 7:29 AM | 5 (3.9%) | 17 (10.8%) |
| 7:30 AM to 7:59 AM | 16 (12.4%) | 24 (15.2%) |
| 8:00 AM to 8:29 AM | 4 (3.1%) | 18 (11.4%) |
| 8:30 AM to 8:59 AM | 1 (0.8%) | 0 (0.0%) |
| 9:00 AM to 9:59 AM | 4 (3.1%) | 5 (3.2%) |
| 10:00 AM to 10:59 AM | 0 (0.0%) | 6 (3.8%) |
| 11:00 AM to 11:59 AM | 0 (0.0%) | 0 (0.0%) |
| 12:00 PM to 3:59 PM | 6 (4.6%) | 0 (0.0%) |
| 4:00 PM to 11:59 PM | 24 (18.6%) | 30 (19.0%) |
| Total | 129 (100.0%) | 158 (100.0%) |
Housing Occupancy in Charlotte Court House
Occupancy by Ownership in Charlotte Court House
Of the total 226 dwellings in Charlotte Court House, owner-occupied units account for 153 (67.7%), while renter-occupied units make up 73 (32.3%).
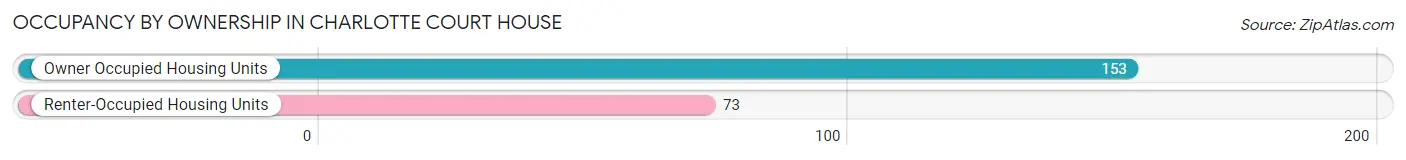
| Occupancy | # Housing Units | % Housing Units |
| Owner Occupied Housing Units | 153 | 67.7% |
| Renter-Occupied Housing Units | 73 | 32.3% |
| Total Occupied Housing Units | 226 | 100.0% |
Occupancy by Household Size in Charlotte Court House
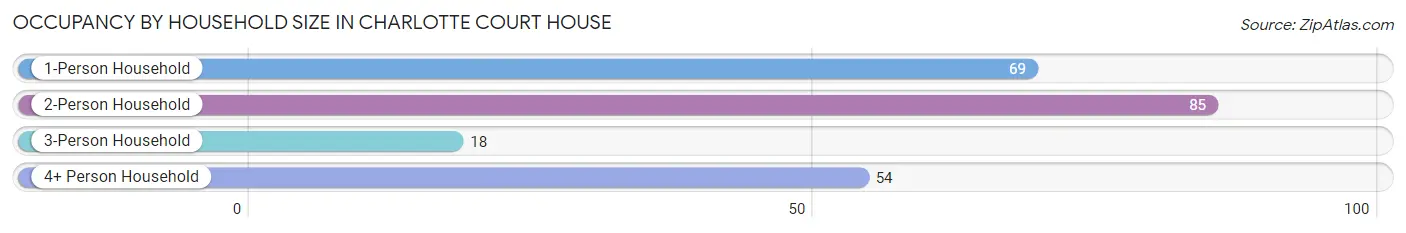
| Household Size | # Housing Units | % Housing Units |
| 1-Person Household | 69 | 30.5% |
| 2-Person Household | 85 | 37.6% |
| 3-Person Household | 18 | 8.0% |
| 4+ Person Household | 54 | 23.9% |
| Total Housing Units | 226 | 100.0% |
Occupancy by Ownership by Household Size in Charlotte Court House
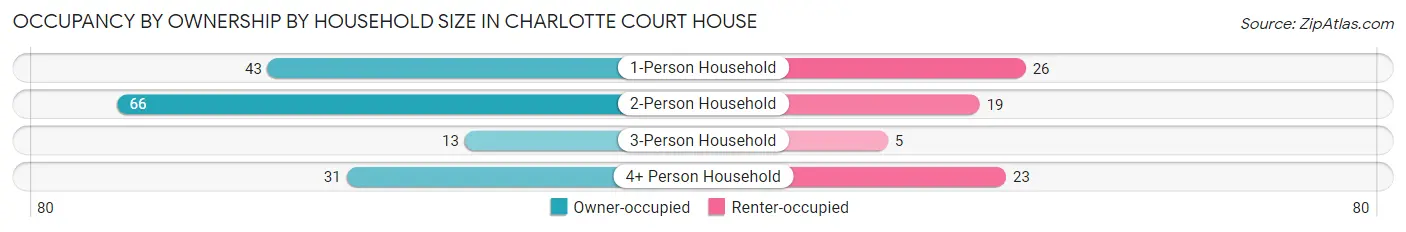
| Household Size | Owner-occupied | Renter-occupied |
| 1-Person Household | 43 (62.3%) | 26 (37.7%) |
| 2-Person Household | 66 (77.6%) | 19 (22.4%) |
| 3-Person Household | 13 (72.2%) | 5 (27.8%) |
| 4+ Person Household | 31 (57.4%) | 23 (42.6%) |
| Total Housing Units | 153 (67.7%) | 73 (32.3%) |
Occupancy by Educational Attainment in Charlotte Court House
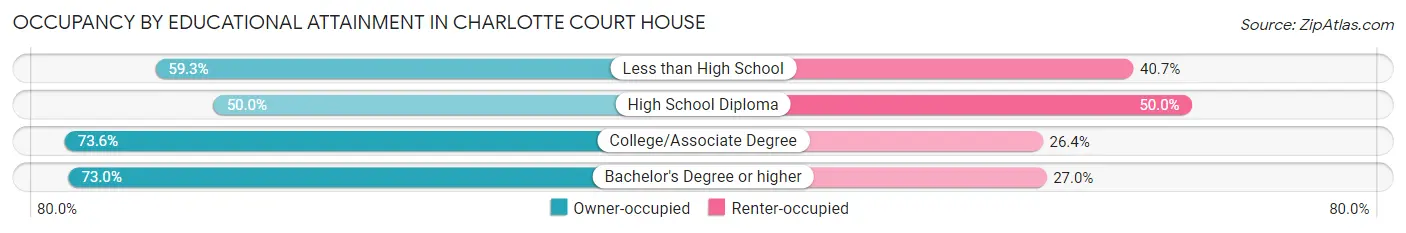
| Household Size | Owner-occupied | Renter-occupied |
| Less than High School | 16 (59.3%) | 11 (40.7%) |
| High School Diploma | 19 (50.0%) | 19 (50.0%) |
| College/Associate Degree | 53 (73.6%) | 19 (26.4%) |
| Bachelor's Degree or higher | 65 (73.0%) | 24 (27.0%) |
Occupancy by Age of Householder in Charlotte Court House
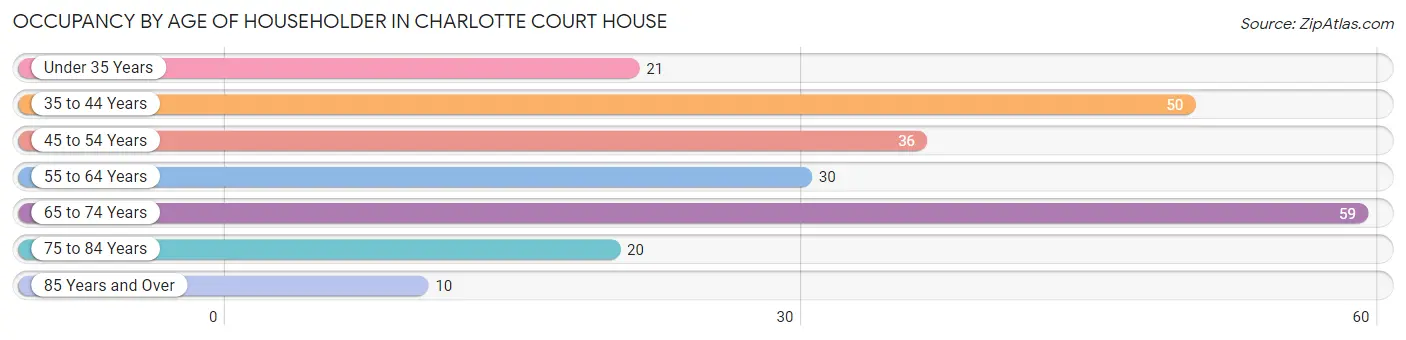
| Age Bracket | # Households | % Households |
| Under 35 Years | 21 | 9.3% |
| 35 to 44 Years | 50 | 22.1% |
| 45 to 54 Years | 36 | 15.9% |
| 55 to 64 Years | 30 | 13.3% |
| 65 to 74 Years | 59 | 26.1% |
| 75 to 84 Years | 20 | 8.8% |
| 85 Years and Over | 10 | 4.4% |
| Total | 226 | 100.0% |
Housing Finances in Charlotte Court House
Median Income by Occupancy in Charlotte Court House
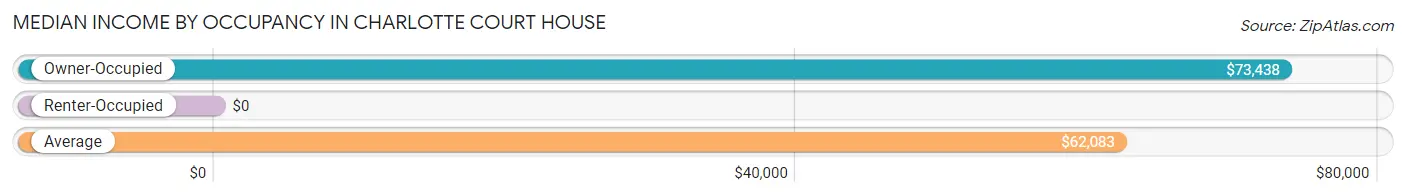
| Occupancy Type | # Households | Median Income |
| Owner-Occupied | 153 (67.7%) | $73,438 |
| Renter-Occupied | 73 (32.3%) | $0 |
| Average | 226 (100.0%) | $62,083 |
Occupancy by Householder Income Bracket in Charlotte Court House
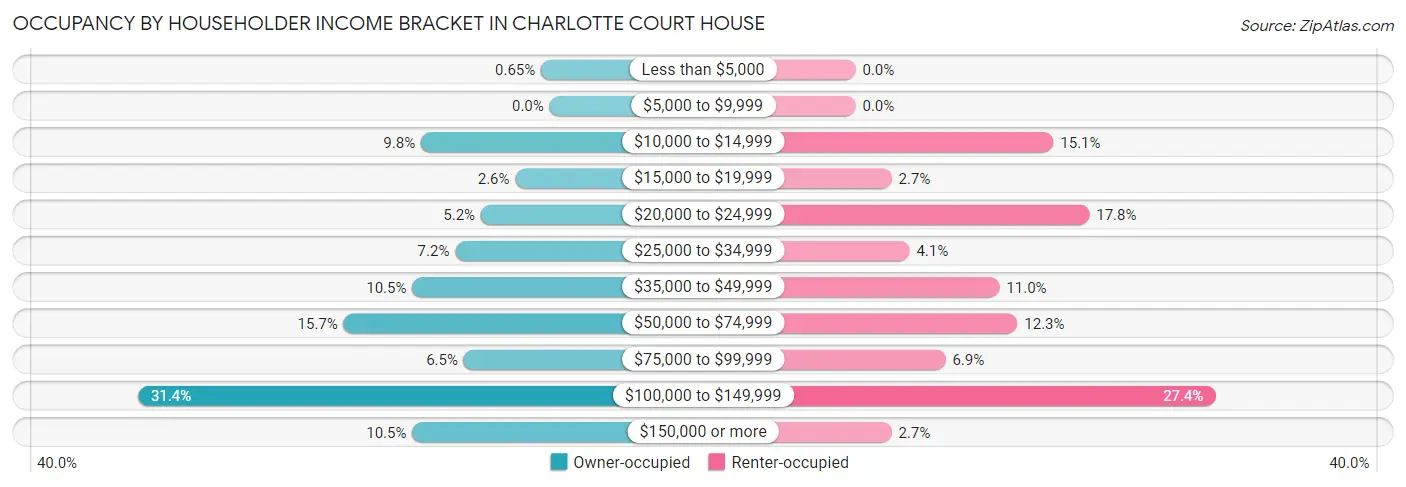
| Income Bracket | Owner-occupied | Renter-occupied |
| Less than $5,000 | 1 (0.6%) | 0 (0.0%) |
| $5,000 to $9,999 | 0 (0.0%) | 0 (0.0%) |
| $10,000 to $14,999 | 15 (9.8%) | 11 (15.1%) |
| $15,000 to $19,999 | 4 (2.6%) | 2 (2.7%) |
| $20,000 to $24,999 | 8 (5.2%) | 13 (17.8%) |
| $25,000 to $34,999 | 11 (7.2%) | 3 (4.1%) |
| $35,000 to $49,999 | 16 (10.5%) | 8 (11.0%) |
| $50,000 to $74,999 | 24 (15.7%) | 9 (12.3%) |
| $75,000 to $99,999 | 10 (6.5%) | 5 (6.9%) |
| $100,000 to $149,999 | 48 (31.4%) | 20 (27.4%) |
| $150,000 or more | 16 (10.5%) | 2 (2.7%) |
| Total | 153 (100.0%) | 73 (100.0%) |
Monthly Housing Cost Tiers in Charlotte Court House
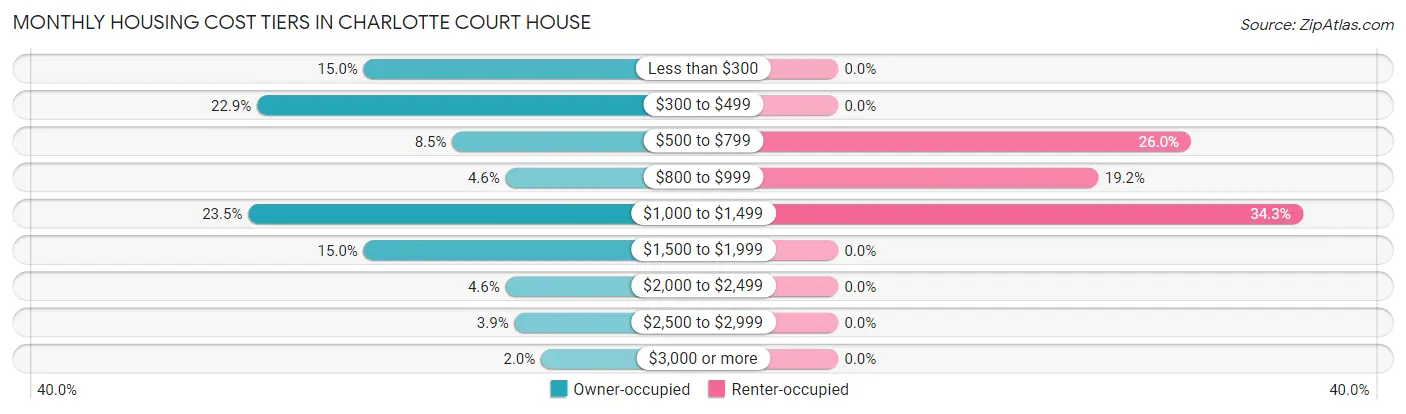
| Monthly Cost | Owner-occupied | Renter-occupied |
| Less than $300 | 23 (15.0%) | 0 (0.0%) |
| $300 to $499 | 35 (22.9%) | 0 (0.0%) |
| $500 to $799 | 13 (8.5%) | 19 (26.0%) |
| $800 to $999 | 7 (4.6%) | 14 (19.2%) |
| $1,000 to $1,499 | 36 (23.5%) | 25 (34.3%) |
| $1,500 to $1,999 | 23 (15.0%) | 0 (0.0%) |
| $2,000 to $2,499 | 7 (4.6%) | 0 (0.0%) |
| $2,500 to $2,999 | 6 (3.9%) | 0 (0.0%) |
| $3,000 or more | 3 (2.0%) | 0 (0.0%) |
| Total | 153 (100.0%) | 73 (100.0%) |
Physical Housing Characteristics in Charlotte Court House
Housing Structures in Charlotte Court House
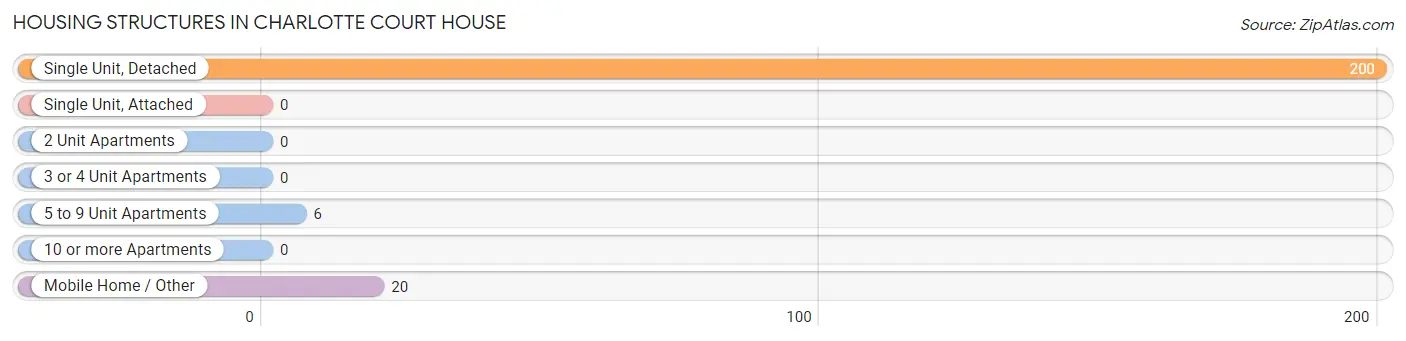
| Structure Type | # Housing Units | % Housing Units |
| Single Unit, Detached | 200 | 88.5% |
| Single Unit, Attached | 0 | 0.0% |
| 2 Unit Apartments | 0 | 0.0% |
| 3 or 4 Unit Apartments | 0 | 0.0% |
| 5 to 9 Unit Apartments | 6 | 2.6% |
| 10 or more Apartments | 0 | 0.0% |
| Mobile Home / Other | 20 | 8.8% |
| Total | 226 | 100.0% |
Housing Structures by Occupancy in Charlotte Court House
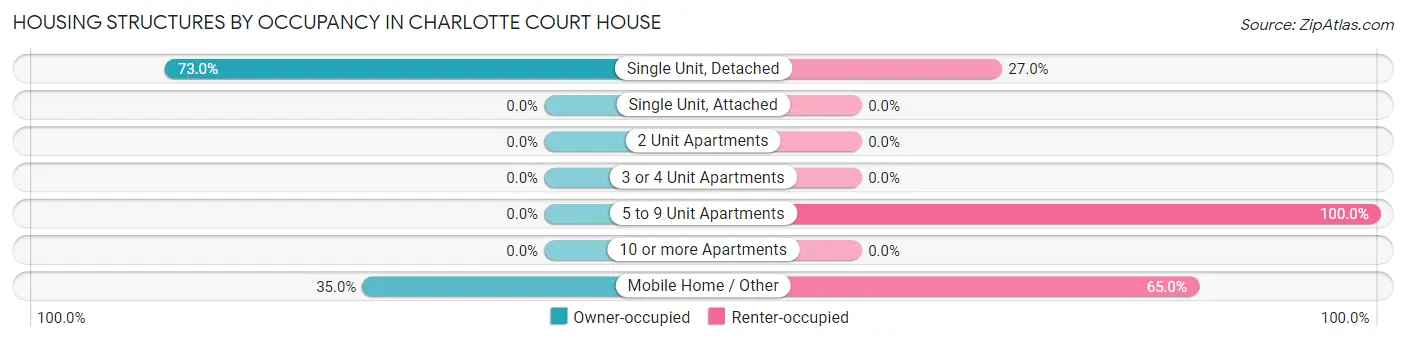
| Structure Type | Owner-occupied | Renter-occupied |
| Single Unit, Detached | 146 (73.0%) | 54 (27.0%) |
| Single Unit, Attached | 0 (0.0%) | 0 (0.0%) |
| 2 Unit Apartments | 0 (0.0%) | 0 (0.0%) |
| 3 or 4 Unit Apartments | 0 (0.0%) | 0 (0.0%) |
| 5 to 9 Unit Apartments | 0 (0.0%) | 6 (100.0%) |
| 10 or more Apartments | 0 (0.0%) | 0 (0.0%) |
| Mobile Home / Other | 7 (35.0%) | 13 (65.0%) |
| Total | 153 (67.7%) | 73 (32.3%) |
Housing Structures by Number of Rooms in Charlotte Court House
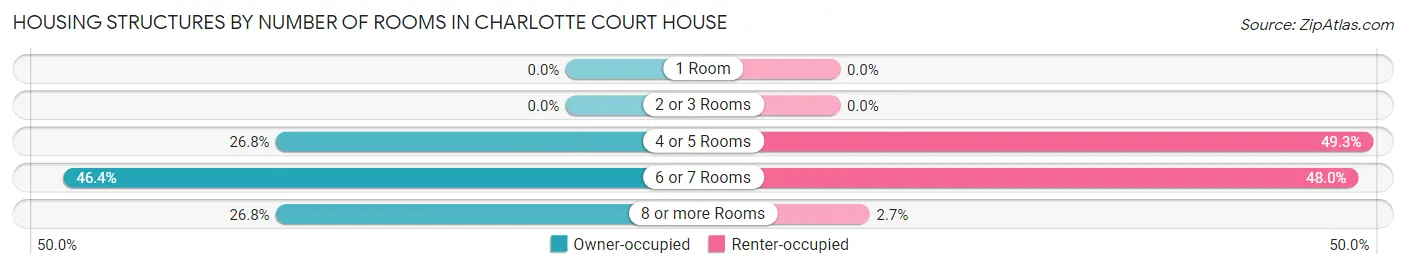
| Number of Rooms | Owner-occupied | Renter-occupied |
| 1 Room | 0 (0.0%) | 0 (0.0%) |
| 2 or 3 Rooms | 0 (0.0%) | 0 (0.0%) |
| 4 or 5 Rooms | 41 (26.8%) | 36 (49.3%) |
| 6 or 7 Rooms | 71 (46.4%) | 35 (47.9%) |
| 8 or more Rooms | 41 (26.8%) | 2 (2.7%) |
| Total | 153 (100.0%) | 73 (100.0%) |
Housing Structure by Heating Type in Charlotte Court House
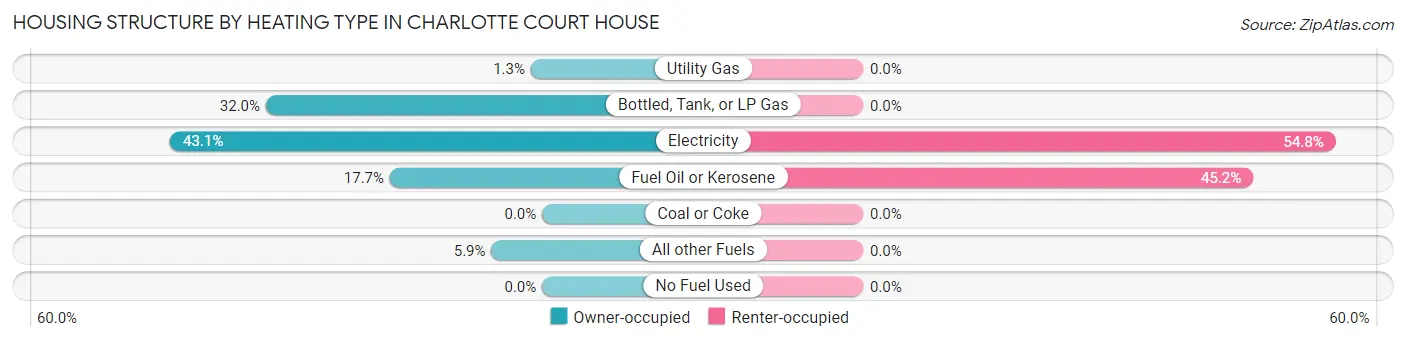
| Heating Type | Owner-occupied | Renter-occupied |
| Utility Gas | 2 (1.3%) | 0 (0.0%) |
| Bottled, Tank, or LP Gas | 49 (32.0%) | 0 (0.0%) |
| Electricity | 66 (43.1%) | 40 (54.8%) |
| Fuel Oil or Kerosene | 27 (17.6%) | 33 (45.2%) |
| Coal or Coke | 0 (0.0%) | 0 (0.0%) |
| All other Fuels | 9 (5.9%) | 0 (0.0%) |
| No Fuel Used | 0 (0.0%) | 0 (0.0%) |
| Total | 153 (100.0%) | 73 (100.0%) |
Household Vehicle Usage in Charlotte Court House
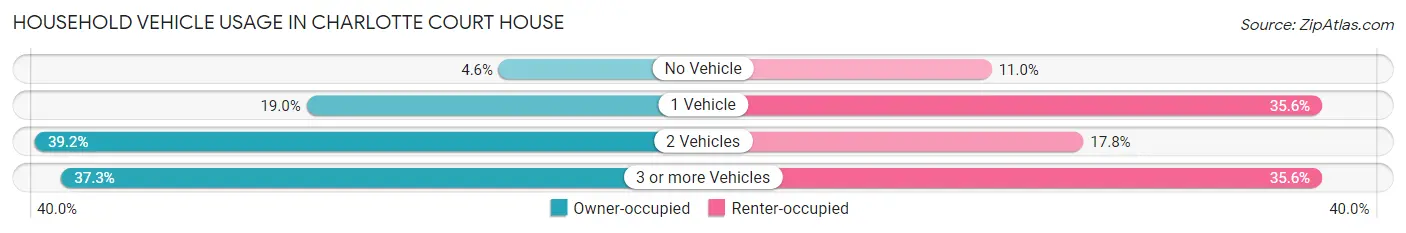
| Vehicles per Household | Owner-occupied | Renter-occupied |
| No Vehicle | 7 (4.6%) | 8 (11.0%) |
| 1 Vehicle | 29 (19.0%) | 26 (35.6%) |
| 2 Vehicles | 60 (39.2%) | 13 (17.8%) |
| 3 or more Vehicles | 57 (37.2%) | 26 (35.6%) |
| Total | 153 (100.0%) | 73 (100.0%) |
Real Estate & Mortgages in Charlotte Court House
Real Estate and Mortgage Overview in Charlotte Court House
| Characteristic | Without Mortgage | With Mortgage |
| Housing Units | 87 | 66 |
| Median Property Value | $147,100 | $175,000 |
| Median Household Income | $47,917 | $13 |
| Monthly Housing Costs | $440 | $3 |
| Real Estate Taxes | $707 | $0 |
Property Value by Mortgage Status in Charlotte Court House
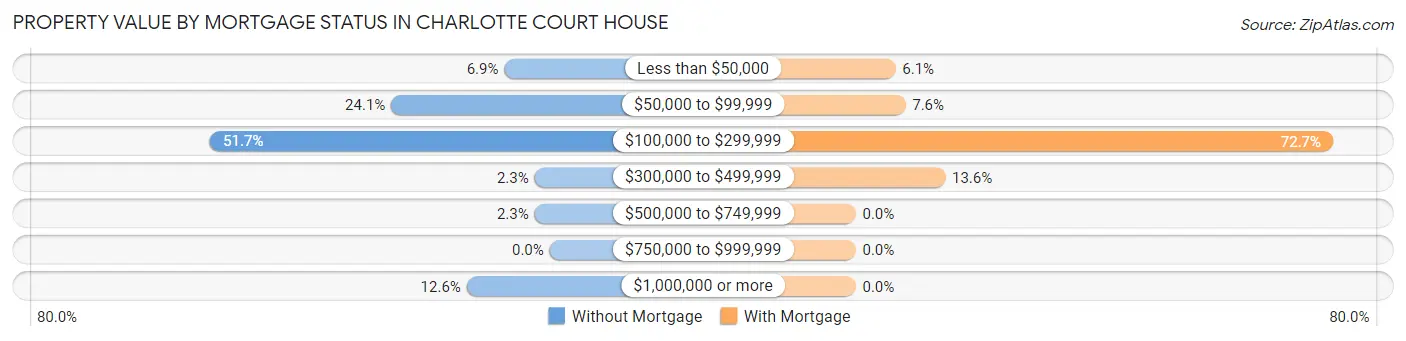
| Property Value | Without Mortgage | With Mortgage |
| Less than $50,000 | 6 (6.9%) | 4 (6.1%) |
| $50,000 to $99,999 | 21 (24.1%) | 5 (7.6%) |
| $100,000 to $299,999 | 45 (51.7%) | 48 (72.7%) |
| $300,000 to $499,999 | 2 (2.3%) | 9 (13.6%) |
| $500,000 to $749,999 | 2 (2.3%) | 0 (0.0%) |
| $750,000 to $999,999 | 0 (0.0%) | 0 (0.0%) |
| $1,000,000 or more | 11 (12.6%) | 0 (0.0%) |
| Total | 87 (100.0%) | 66 (100.0%) |
Household Income by Mortgage Status in Charlotte Court House
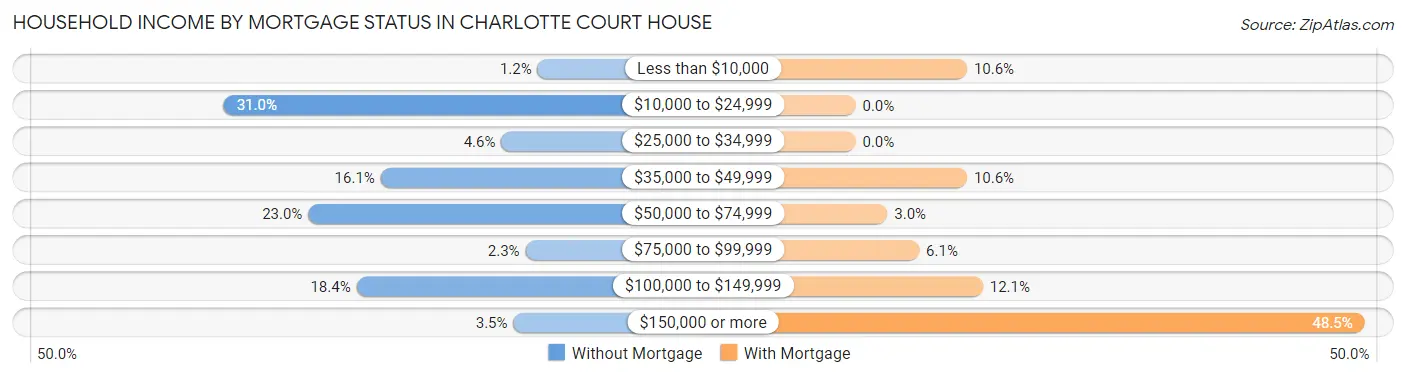
| Household Income | Without Mortgage | With Mortgage |
| Less than $10,000 | 1 (1.1%) | 7 (10.6%) |
| $10,000 to $24,999 | 27 (31.0%) | 0 (0.0%) |
| $25,000 to $34,999 | 4 (4.6%) | 0 (0.0%) |
| $35,000 to $49,999 | 14 (16.1%) | 7 (10.6%) |
| $50,000 to $74,999 | 20 (23.0%) | 2 (3.0%) |
| $75,000 to $99,999 | 2 (2.3%) | 4 (6.1%) |
| $100,000 to $149,999 | 16 (18.4%) | 8 (12.1%) |
| $150,000 or more | 3 (3.5%) | 32 (48.5%) |
| Total | 87 (100.0%) | 66 (100.0%) |
Property Value to Household Income Ratio in Charlotte Court House
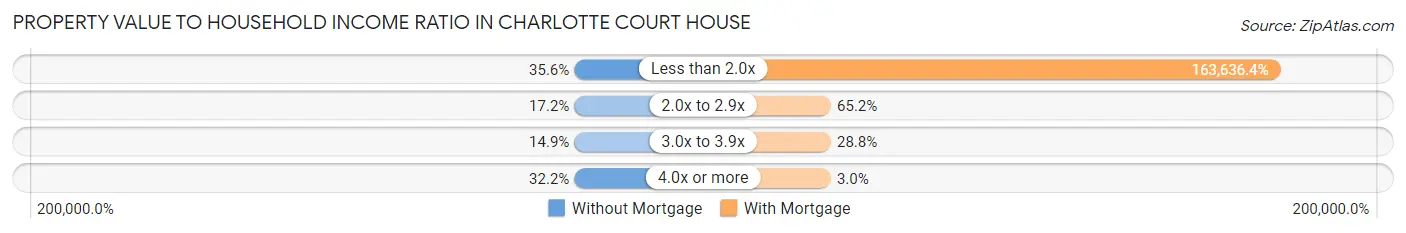
| Value-to-Income Ratio | Without Mortgage | With Mortgage |
| Less than 2.0x | 31 (35.6%) | 108,000 (163,636.4%) |
| 2.0x to 2.9x | 15 (17.2%) | 43 (65.1%) |
| 3.0x to 3.9x | 13 (14.9%) | 19 (28.8%) |
| 4.0x or more | 28 (32.2%) | 2 (3.0%) |
| Total | 87 (100.0%) | 66 (100.0%) |
Real Estate Taxes by Mortgage Status in Charlotte Court House
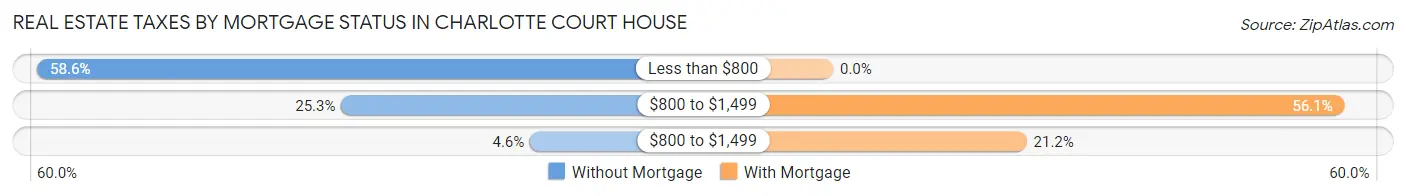
| Property Taxes | Without Mortgage | With Mortgage |
| Less than $800 | 51 (58.6%) | 0 (0.0%) |
| $800 to $1,499 | 22 (25.3%) | 37 (56.1%) |
| $800 to $1,499 | 4 (4.6%) | 14 (21.2%) |
| Total | 87 (100.0%) | 66 (100.0%) |
Health & Disability in Charlotte Court House
Health Insurance Coverage by Age in Charlotte Court House
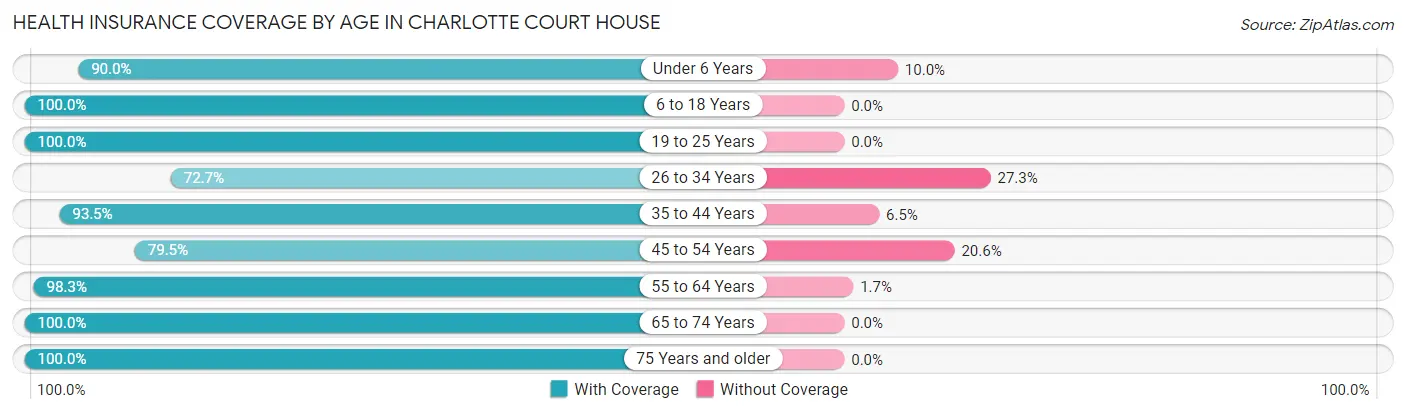
| Age Bracket | With Coverage | Without Coverage |
| Under 6 Years | 18 (90.0%) | 2 (10.0%) |
| 6 to 18 Years | 176 (100.0%) | 0 (0.0%) |
| 19 to 25 Years | 35 (100.0%) | 0 (0.0%) |
| 26 to 34 Years | 48 (72.7%) | 18 (27.3%) |
| 35 to 44 Years | 72 (93.5%) | 5 (6.5%) |
| 45 to 54 Years | 58 (79.4%) | 15 (20.5%) |
| 55 to 64 Years | 59 (98.3%) | 1 (1.7%) |
| 65 to 74 Years | 77 (100.0%) | 0 (0.0%) |
| 75 Years and older | 50 (100.0%) | 0 (0.0%) |
| Total | 593 (93.5%) | 41 (6.5%) |
Health Insurance Coverage by Citizenship Status in Charlotte Court House
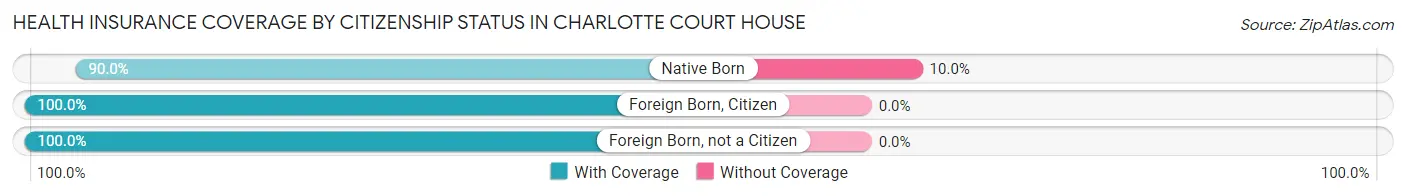
| Citizenship Status | With Coverage | Without Coverage |
| Native Born | 18 (90.0%) | 2 (10.0%) |
| Foreign Born, Citizen | 176 (100.0%) | 0 (0.0%) |
| Foreign Born, not a Citizen | 35 (100.0%) | 0 (0.0%) |
Health Insurance Coverage by Household Income in Charlotte Court House
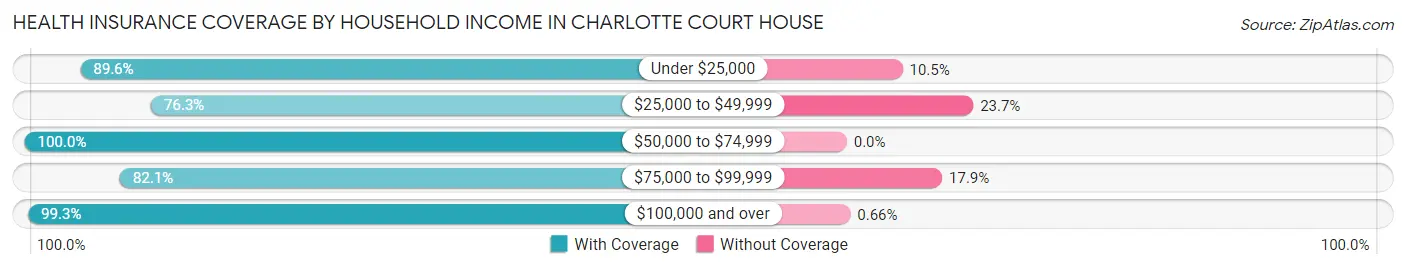
| Household Income | With Coverage | Without Coverage |
| Under $25,000 | 60 (89.5%) | 7 (10.4%) |
| $25,000 to $49,999 | 87 (76.3%) | 27 (23.7%) |
| $50,000 to $74,999 | 122 (100.0%) | 0 (0.0%) |
| $75,000 to $99,999 | 23 (82.1%) | 5 (17.9%) |
| $100,000 and over | 301 (99.3%) | 2 (0.7%) |
Public vs Private Health Insurance Coverage by Age in Charlotte Court House
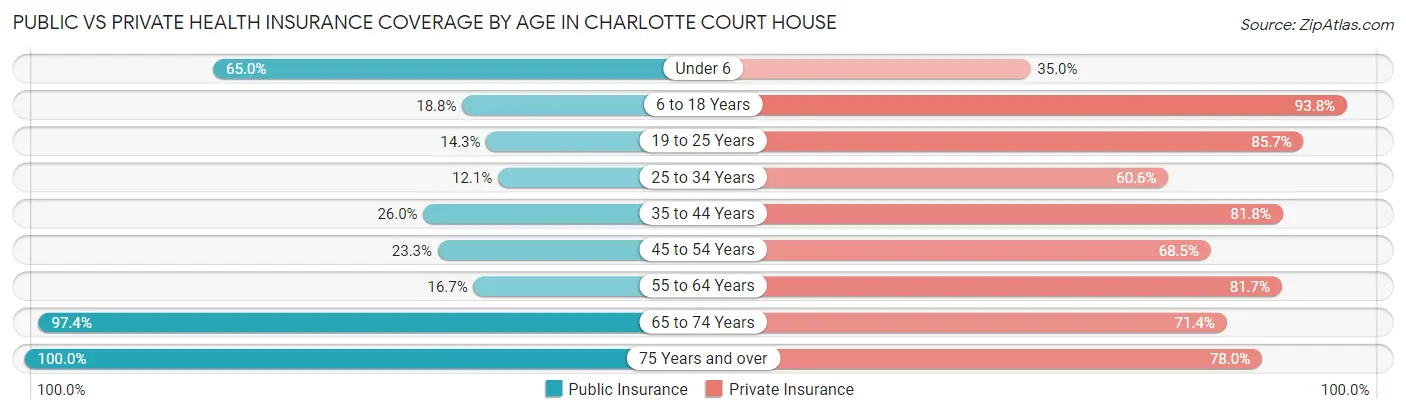
| Age Bracket | Public Insurance | Private Insurance |
| Under 6 | 13 (65.0%) | 7 (35.0%) |
| 6 to 18 Years | 33 (18.8%) | 165 (93.8%) |
| 19 to 25 Years | 5 (14.3%) | 30 (85.7%) |
| 25 to 34 Years | 8 (12.1%) | 40 (60.6%) |
| 35 to 44 Years | 20 (26.0%) | 63 (81.8%) |
| 45 to 54 Years | 17 (23.3%) | 50 (68.5%) |
| 55 to 64 Years | 10 (16.7%) | 49 (81.7%) |
| 65 to 74 Years | 75 (97.4%) | 55 (71.4%) |
| 75 Years and over | 50 (100.0%) | 39 (78.0%) |
| Total | 231 (36.4%) | 498 (78.5%) |
Disability Status by Sex by Age in Charlotte Court House
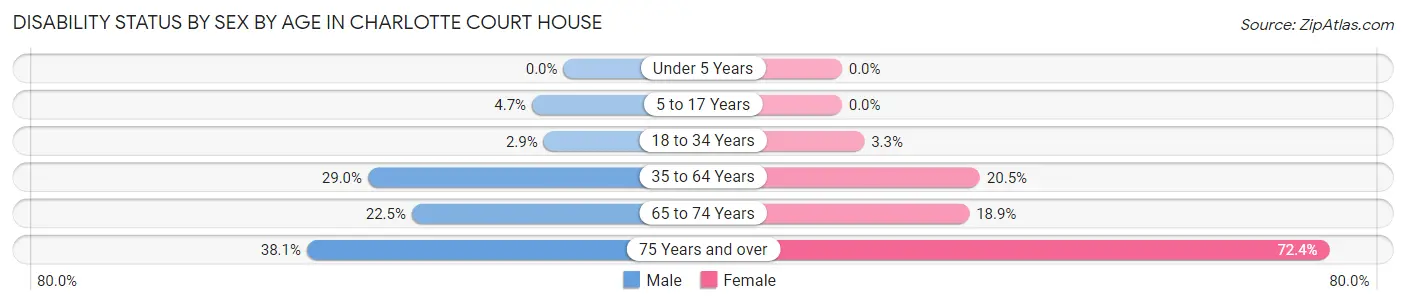
| Age Bracket | Male | Female |
| Under 5 Years | 0 (0.0%) | 0 (0.0%) |
| 5 to 17 Years | 5 (4.7%) | 0 (0.0%) |
| 18 to 34 Years | 2 (2.9%) | 2 (3.3%) |
| 35 to 64 Years | 27 (29.0%) | 24 (20.5%) |
| 65 to 74 Years | 9 (22.5%) | 7 (18.9%) |
| 75 Years and over | 8 (38.1%) | 21 (72.4%) |
Disability Class by Sex by Age in Charlotte Court House
Disability Class: Hearing Difficulty
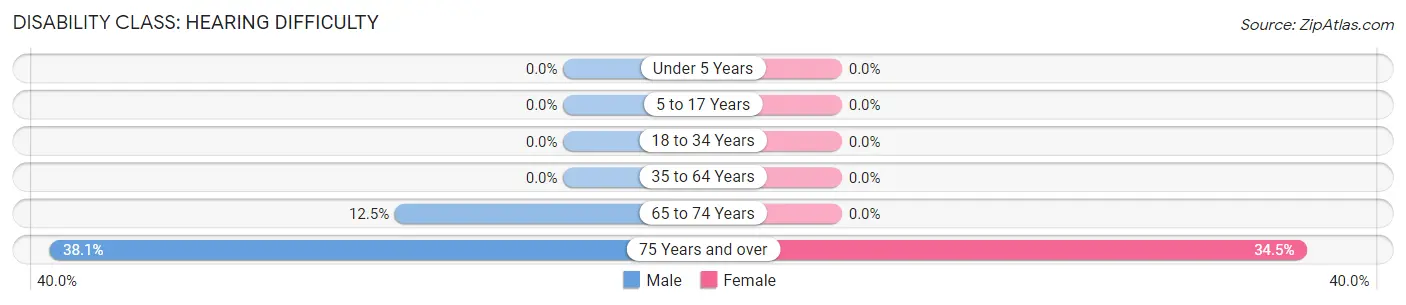
| Age Bracket | Male | Female |
| Under 5 Years | 0 (0.0%) | 0 (0.0%) |
| 5 to 17 Years | 0 (0.0%) | 0 (0.0%) |
| 18 to 34 Years | 0 (0.0%) | 0 (0.0%) |
| 35 to 64 Years | 0 (0.0%) | 0 (0.0%) |
| 65 to 74 Years | 5 (12.5%) | 0 (0.0%) |
| 75 Years and over | 8 (38.1%) | 10 (34.5%) |
Disability Class: Vision Difficulty
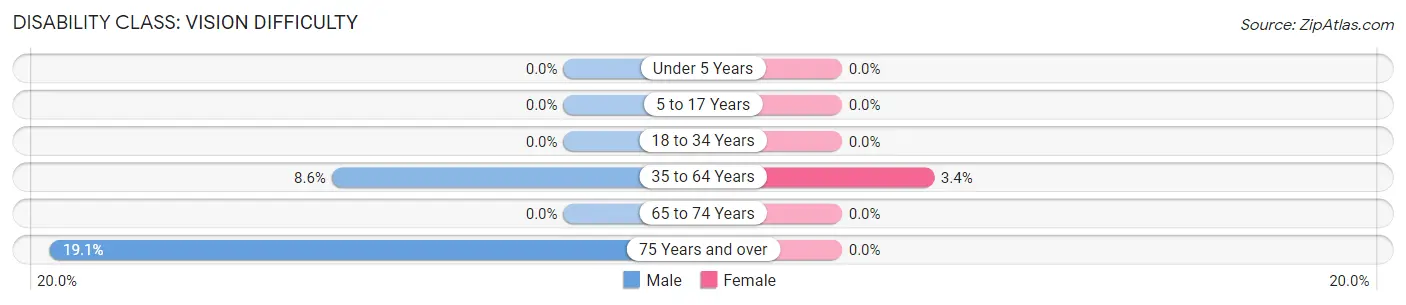
| Age Bracket | Male | Female |
| Under 5 Years | 0 (0.0%) | 0 (0.0%) |
| 5 to 17 Years | 0 (0.0%) | 0 (0.0%) |
| 18 to 34 Years | 0 (0.0%) | 0 (0.0%) |
| 35 to 64 Years | 8 (8.6%) | 4 (3.4%) |
| 65 to 74 Years | 0 (0.0%) | 0 (0.0%) |
| 75 Years and over | 4 (19.1%) | 0 (0.0%) |
Disability Class: Cognitive Difficulty
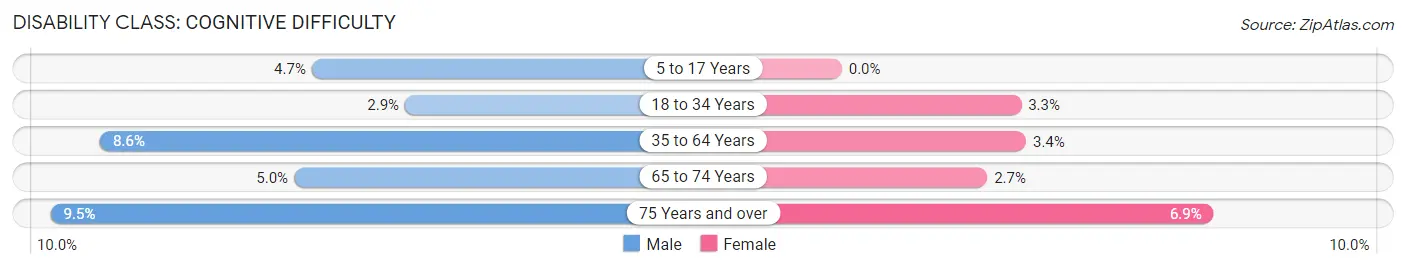
| Age Bracket | Male | Female |
| 5 to 17 Years | 5 (4.7%) | 0 (0.0%) |
| 18 to 34 Years | 2 (2.9%) | 2 (3.3%) |
| 35 to 64 Years | 8 (8.6%) | 4 (3.4%) |
| 65 to 74 Years | 2 (5.0%) | 1 (2.7%) |
| 75 Years and over | 2 (9.5%) | 2 (6.9%) |
Disability Class: Ambulatory Difficulty
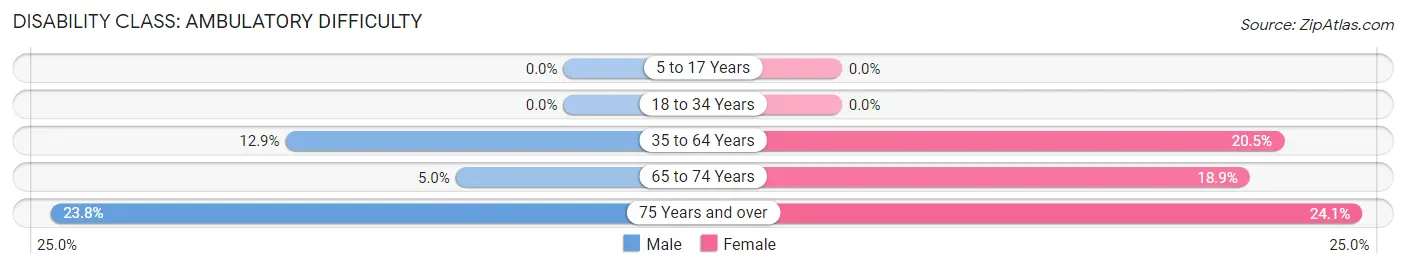
| Age Bracket | Male | Female |
| 5 to 17 Years | 0 (0.0%) | 0 (0.0%) |
| 18 to 34 Years | 0 (0.0%) | 0 (0.0%) |
| 35 to 64 Years | 12 (12.9%) | 24 (20.5%) |
| 65 to 74 Years | 2 (5.0%) | 7 (18.9%) |
| 75 Years and over | 5 (23.8%) | 7 (24.1%) |
Disability Class: Self-Care Difficulty
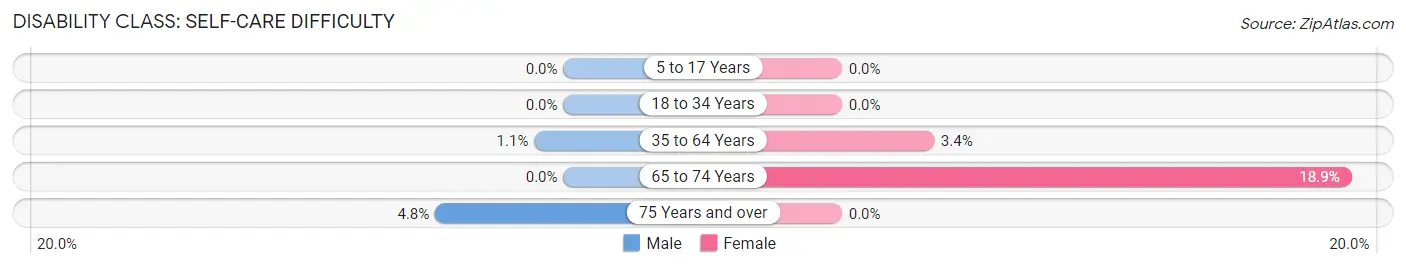
| Age Bracket | Male | Female |
| 5 to 17 Years | 0 (0.0%) | 0 (0.0%) |
| 18 to 34 Years | 0 (0.0%) | 0 (0.0%) |
| 35 to 64 Years | 1 (1.1%) | 4 (3.4%) |
| 65 to 74 Years | 0 (0.0%) | 7 (18.9%) |
| 75 Years and over | 1 (4.8%) | 0 (0.0%) |
Technology Access in Charlotte Court House
Computing Device Access in Charlotte Court House
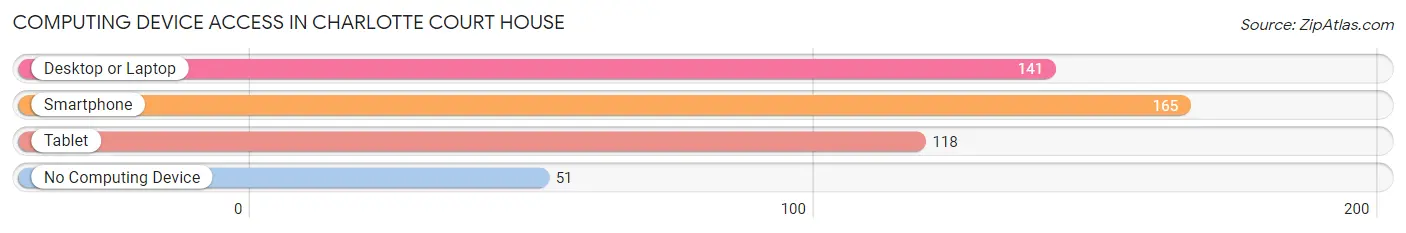
| Device Type | # Households | % Households |
| Desktop or Laptop | 141 | 62.4% |
| Smartphone | 165 | 73.0% |
| Tablet | 118 | 52.2% |
| No Computing Device | 51 | 22.6% |
| Total | 226 | 100.0% |
Internet Access in Charlotte Court House
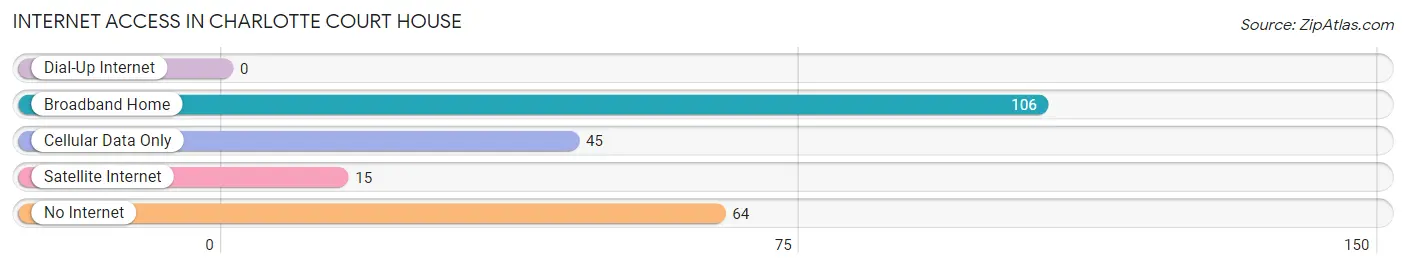
| Internet Type | # Households | % Households |
| Dial-Up Internet | 0 | 0.0% |
| Broadband Home | 106 | 46.9% |
| Cellular Data Only | 45 | 19.9% |
| Satellite Internet | 15 | 6.6% |
| No Internet | 64 | 28.3% |
| Total | 226 | 100.0% |
Charlotte Court House Summary
Charlotte Court House is a small unincorporated community located in Charlotte County, Virginia. It is the county seat of Charlotte County and is located in the south-central part of the state, about 50 miles south of Richmond. The population of Charlotte Court House was estimated to be 1,092 in 2019.
History
Charlotte Court House was established in 1765 as the county seat of Charlotte County. The town was named after Queen Charlotte of Mecklenburg-Strelitz, the wife of King George III of England. The town was laid out in 1766 and the courthouse was built in 1767. The courthouse was destroyed by fire in 1807 and rebuilt in 1808.
Charlotte Court House was an important center of commerce and government in the 19th century. It was the site of several Civil War battles, including the Battle of Charlotte Court House in 1864. The town was also the site of the Charlotte County Courthouse, which served as the county seat until the county seat was moved to Keysville in 1871.
Geography
Charlotte Court House is located in south-central Virginia, about 50 miles south of Richmond. It is situated in the Piedmont region of the state, at an elevation of about 500 feet. The town is located on the banks of the Appomattox River, which flows through the county. The town is surrounded by rolling hills and farmland.
The climate in Charlotte Court House is humid subtropical, with hot, humid summers and mild winters. The average annual temperature is around 60°F, with an average high of around 80°F in the summer and an average low of around 40°F in the winter.
Economy
Charlotte Court House is a small, rural community with a limited economy. The town is home to several small businesses, including a grocery store, a hardware store, and a few restaurants. The town is also home to a few manufacturing companies, including a furniture manufacturer and a plastics manufacturer.
The town is also home to a few agricultural operations, including a dairy farm and a few vegetable farms. The town is also home to a few wineries and vineyards.
Demographics
As of the 2019 census, the population of Charlotte Court House was estimated to be 1,092. The racial makeup of the town was 94.2% White, 3.2% African American, 0.7% Native American, 0.3% Asian, and 1.6% from other races. The median household income was $41,250, and the median age was 44.
Conclusion
Charlotte Court House is a small, rural community located in south-central Virginia. It is the county seat of Charlotte County and is home to a few small businesses, manufacturing companies, and agricultural operations. The population of Charlotte Court House was estimated to be 1,092 in 2019, with a median household income of $41,250 and a median age of 44.
Common Questions
What is Per Capita Income in Charlotte Court House?
Per Capita income in Charlotte Court House is $26,143.
What is the Median Family Income in Charlotte Court House?
Median Family Income in Charlotte Court House is $101,250.
What is the Median Household income in Charlotte Court House?
Median Household Income in Charlotte Court House is $62,083.
What is Income or Wage Gap in Charlotte Court House?
Income or Wage Gap in Charlotte Court House is 8.4%.
Women in Charlotte Court House earn 91.6 cents for every dollar earned by a man.
What is Inequality or Gini Index in Charlotte Court House?
Inequality or Gini Index in Charlotte Court House is 0.41.
What is the Total Population of Charlotte Court House?
Total Population of Charlotte Court House is 696.
What is the Total Male Population of Charlotte Court House?
Total Male Population of Charlotte Court House is 406.
What is the Total Female Population of Charlotte Court House?
Total Female Population of Charlotte Court House is 290.
What is the Ratio of Males per 100 Females in Charlotte Court House?
There are 140.00 Males per 100 Females in Charlotte Court House.
What is the Ratio of Females per 100 Males in Charlotte Court House?
There are 71.43 Females per 100 Males in Charlotte Court House.
What is the Median Population Age in Charlotte Court House?
Median Population Age in Charlotte Court House is 39.5 Years.
What is the Average Family Size in Charlotte Court House
Average Family Size in Charlotte Court House is 3.7 People.
What is the Average Household Size in Charlotte Court House
Average Household Size in Charlotte Court House is 2.8 People.
How Large is the Labor Force in Charlotte Court House?
There are 330 People in the Labor Forcein in Charlotte Court House.
What is the Percentage of People in the Labor Force in Charlotte Court House?
55.7% of People are in the Labor Force in Charlotte Court House.
What is the Unemployment Rate in Charlotte Court House?
Unemployment Rate in Charlotte Court House is 1.8%.