Cape Charles, VA Map & Demographics
Cape Charles Map
Cape Charles Overview
$61,031
PER CAPITA INCOME
$139,688
AVG FAMILY INCOME
$50,972
AVG HOUSEHOLD INCOME
61.7%
WAGE / INCOME GAP [ % ]
38.3¢/ $1
WAGE / INCOME GAP [ $ ]
0.57
INEQUALITY / GINI INDEX
1,183
TOTAL POPULATION
570
MALE POPULATION
613
FEMALE POPULATION
92.99
MALES / 100 FEMALES
107.54
FEMALES / 100 MALES
58.4
MEDIAN AGE
2.8
AVG FAMILY SIZE
1.8
AVG HOUSEHOLD SIZE
528
LABOR FORCE [ PEOPLE ]
50.9%
PERCENT IN LABOR FORCE
7.5%
UNEMPLOYMENT RATE
Cape Charles Zip Codes
Cape Charles Area Codes
Income in Cape Charles
Income Overview in Cape Charles
Per Capita Income in Cape Charles is $61,031, while median incomes of families and households are $139,688 and $50,972 respectively.
| Characteristic | Number | Measure |
| Per Capita Income | 1,183 | $61,031 |
| Median Family Income | 272 | $139,688 |
| Mean Family Income | 272 | $180,720 |
| Median Household Income | 653 | $50,972 |
| Mean Household Income | 653 | $105,266 |
| Income Deficit | 272 | $0 |
| Wage / Income Gap (%) | 1,183 | 61.71% |
| Wage / Income Gap ($) | 1,183 | 38.29¢ per $1 |
| Gini / Inequality Index | 1,183 | 0.57 |
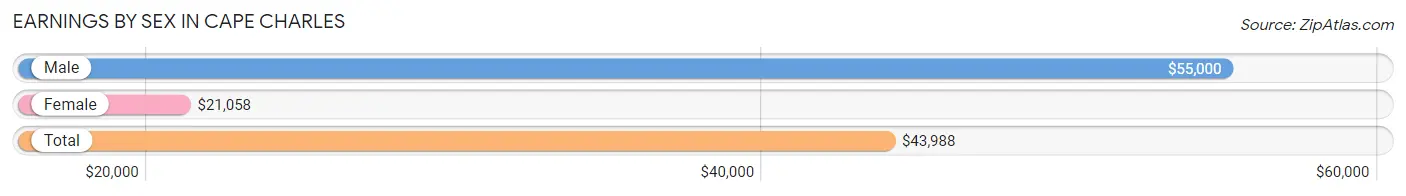
Earnings by Sex in Cape Charles
Average Earnings in Cape Charles are $43,988, $55,000 for men and $21,058 for women, a difference of 61.7%.
| Sex | Number | Average Earnings |
| Male | 282 (50.6%) | $55,000 |
| Female | 275 (49.4%) | $21,058 |
| Total | 557 (100.0%) | $43,988 |
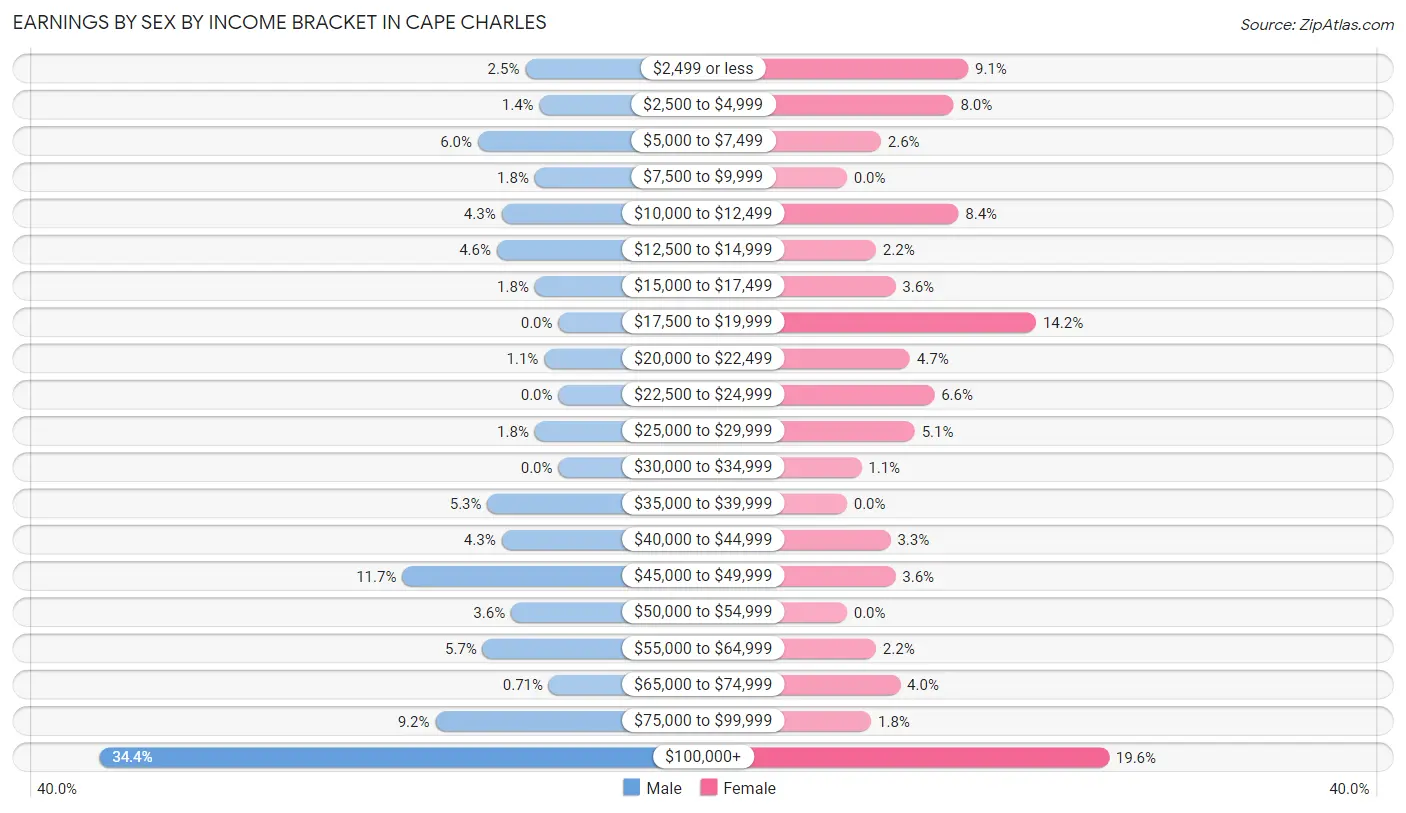
Earnings by Sex by Income Bracket in Cape Charles
The most common earnings brackets in Cape Charles are $100,000+ for men (97 | 34.4%) and $100,000+ for women (54 | 19.6%).
| Income | Male | Female |
| $2,499 or less | 7 (2.5%) | 25 (9.1%) |
| $2,500 to $4,999 | 4 (1.4%) | 22 (8.0%) |
| $5,000 to $7,499 | 17 (6.0%) | 7 (2.5%) |
| $7,500 to $9,999 | 5 (1.8%) | 0 (0.0%) |
| $10,000 to $12,499 | 12 (4.3%) | 23 (8.4%) |
| $12,500 to $14,999 | 13 (4.6%) | 6 (2.2%) |
| $15,000 to $17,499 | 5 (1.8%) | 10 (3.6%) |
| $17,500 to $19,999 | 0 (0.0%) | 39 (14.2%) |
| $20,000 to $22,499 | 3 (1.1%) | 13 (4.7%) |
| $22,500 to $24,999 | 0 (0.0%) | 18 (6.6%) |
| $25,000 to $29,999 | 5 (1.8%) | 14 (5.1%) |
| $30,000 to $34,999 | 0 (0.0%) | 3 (1.1%) |
| $35,000 to $39,999 | 15 (5.3%) | 0 (0.0%) |
| $40,000 to $44,999 | 12 (4.3%) | 9 (3.3%) |
| $45,000 to $49,999 | 33 (11.7%) | 10 (3.6%) |
| $50,000 to $54,999 | 10 (3.5%) | 0 (0.0%) |
| $55,000 to $64,999 | 16 (5.7%) | 6 (2.2%) |
| $65,000 to $74,999 | 2 (0.7%) | 11 (4.0%) |
| $75,000 to $99,999 | 26 (9.2%) | 5 (1.8%) |
| $100,000+ | 97 (34.4%) | 54 (19.6%) |
| Total | 282 (100.0%) | 275 (100.0%) |
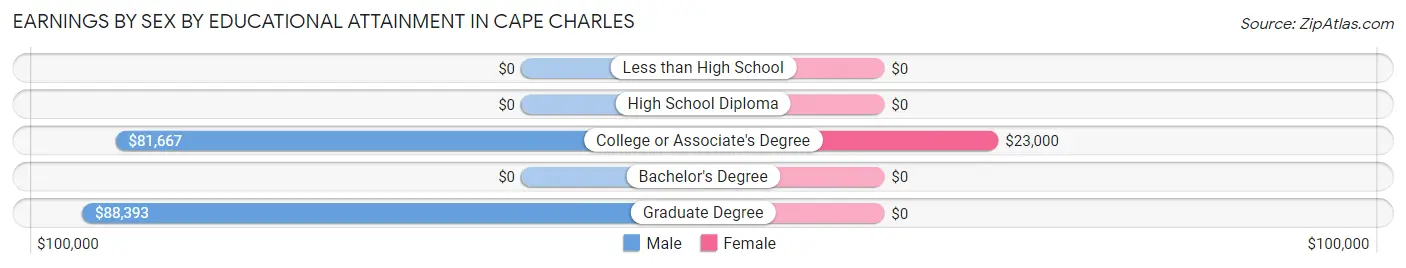
Earnings by Sex by Educational Attainment in Cape Charles
Average earnings in Cape Charles are $85,000 for men and $23,264 for women, a difference of 72.6%. Men with an educational attainment of graduate degree enjoy the highest average annual earnings of $88,393, while those with college or associate's degree education earn the least with $81,667. Women with an educational attainment of college or associate's degree earn the most with the average annual earnings of $23,000, while those with college or associate's degree education have the smallest earnings of $23,000.
| Educational Attainment | Male Income | Female Income |
| Less than High School | - | - |
| High School Diploma | - | - |
| College or Associate's Degree | $81,667 | $23,000 |
| Bachelor's Degree | - | - |
| Graduate Degree | $88,393 | $0 |
| Total | $85,000 | $23,264 |
Family Income in Cape Charles
Family Income Brackets in Cape Charles
According to the Cape Charles family income data, there are 94 families falling into the $200,000+ income range, which is the most common income bracket and makes up 34.6% of all families. Conversely, the less than $10,000 income bracket is the least frequent group with only 3 families (1.1%) belonging to this category.
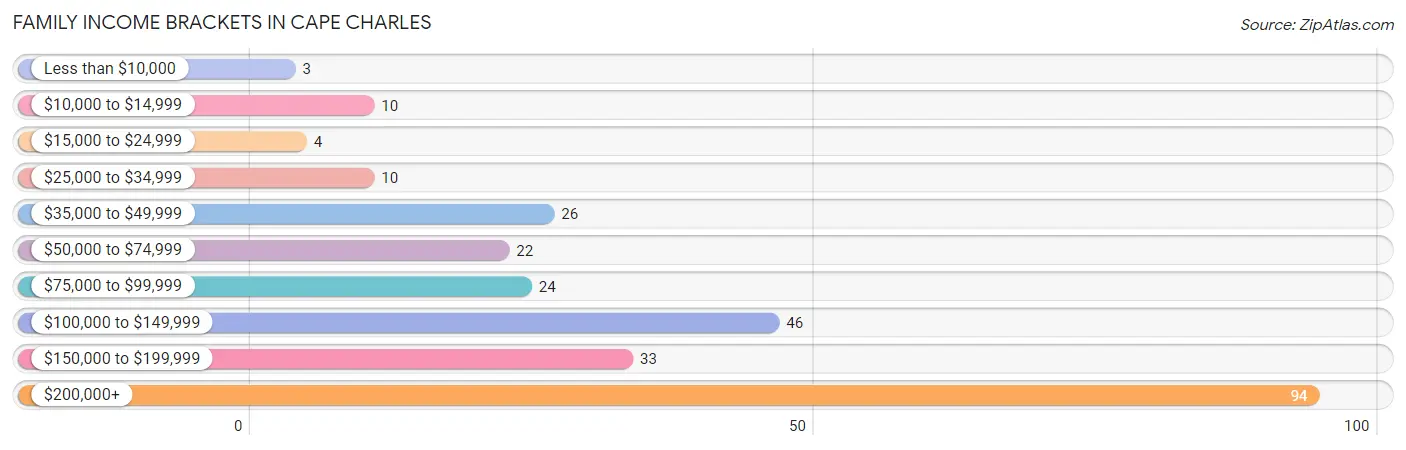
| Income Bracket | # Families | % Families |
| Less than $10,000 | 3 | 1.1% |
| $10,000 to $14,999 | 10 | 3.7% |
| $15,000 to $24,999 | 4 | 1.5% |
| $25,000 to $34,999 | 10 | 3.7% |
| $35,000 to $49,999 | 26 | 9.6% |
| $50,000 to $74,999 | 22 | 8.1% |
| $75,000 to $99,999 | 24 | 8.8% |
| $100,000 to $149,999 | 46 | 16.9% |
| $150,000 to $199,999 | 33 | 12.1% |
| $200,000+ | 94 | 34.6% |
Family Income by Famaliy Size in Cape Charles
4-person families (35 | 12.9%) account for the highest median family income in Cape Charles with $250,001 per family, while 2-person families (184 | 67.6%) have the highest median income of $70,625 per family member.
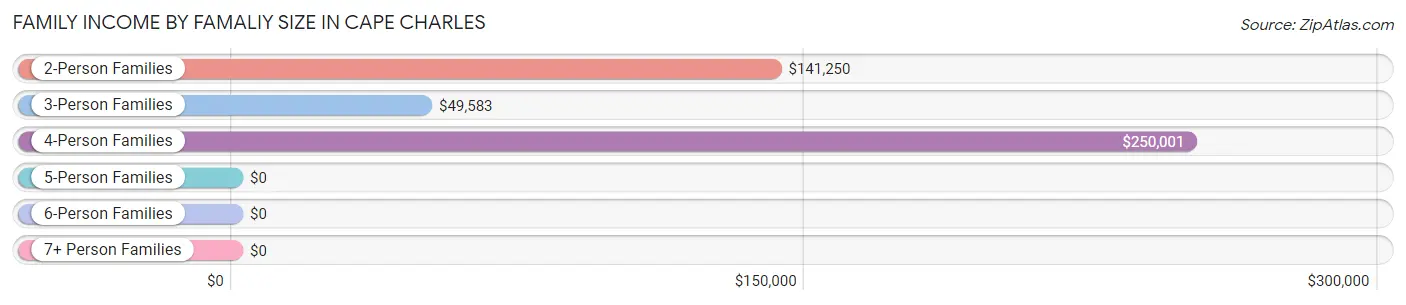
| Income Bracket | # Families | Median Income |
| 2-Person Families | 184 (67.6%) | $141,250 |
| 3-Person Families | 53 (19.5%) | $49,583 |
| 4-Person Families | 35 (12.9%) | $250,001 |
| 5-Person Families | 0 (0.0%) | $0 |
| 6-Person Families | 0 (0.0%) | $0 |
| 7+ Person Families | 0 (0.0%) | $0 |
| Total | 272 (100.0%) | $139,688 |
Family Income by Number of Earners in Cape Charles
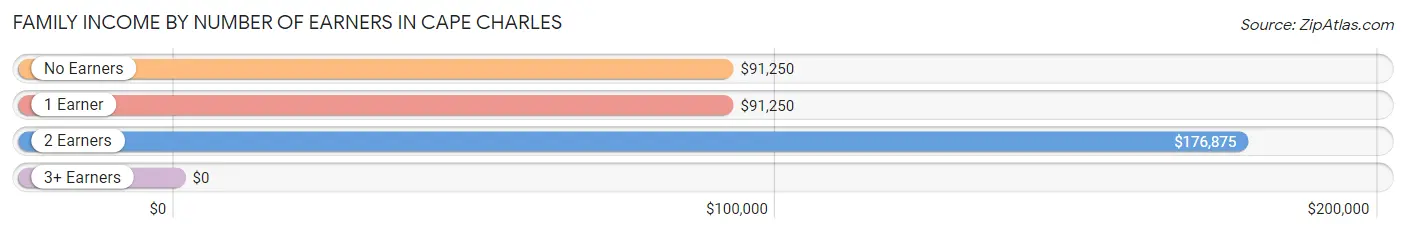
| Number of Earners | # Families | Median Income |
| No Earners | 55 (20.2%) | $91,250 |
| 1 Earner | 90 (33.1%) | $91,250 |
| 2 Earners | 127 (46.7%) | $176,875 |
| 3+ Earners | 0 (0.0%) | $0 |
| Total | 272 (100.0%) | $139,688 |
Household Income in Cape Charles
Household Income Brackets in Cape Charles
With 104 households falling in the category, the $200,000+ income range is the most frequent in Cape Charles, accounting for 15.9% of all households. In contrast, only 41 households (6.3%) fall into the $25,000 to $34,999 income bracket, making it the least populous group.
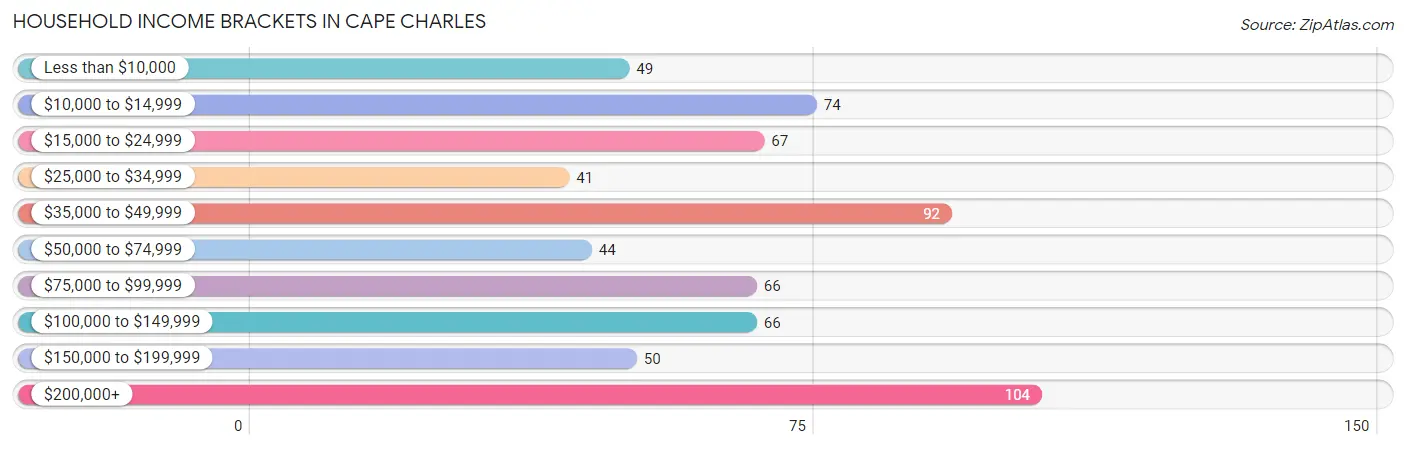
| Income Bracket | # Households | % Households |
| Less than $10,000 | 49 | 7.5% |
| $10,000 to $14,999 | 74 | 11.3% |
| $15,000 to $24,999 | 67 | 10.3% |
| $25,000 to $34,999 | 41 | 6.3% |
| $35,000 to $49,999 | 92 | 14.1% |
| $50,000 to $74,999 | 44 | 6.7% |
| $75,000 to $99,999 | 66 | 10.1% |
| $100,000 to $149,999 | 66 | 10.1% |
| $150,000 to $199,999 | 50 | 7.7% |
| $200,000+ | 104 | 15.9% |
Household Income by Householder Age in Cape Charles
The median household income in Cape Charles is $50,972, with the highest median household income of $96,750 found in the 45 to 64 years age bracket for the primary householder. A total of 206 households (31.6%) fall into this category. Meanwhile, the 15 to 24 years age bracket for the primary householder has the lowest median household income of $0, with 39 households (6.0%) in this group.
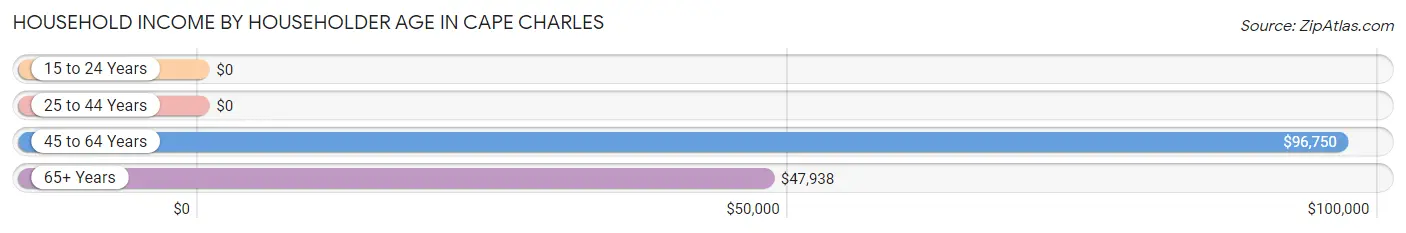
| Income Bracket | # Households | Median Income |
| 15 to 24 Years | 39 (6.0%) | $0 |
| 25 to 44 Years | 100 (15.3%) | $0 |
| 45 to 64 Years | 206 (31.6%) | $96,750 |
| 65+ Years | 308 (47.2%) | $47,938 |
| Total | 653 (100.0%) | $50,972 |
Poverty in Cape Charles
Income Below Poverty by Sex and Age in Cape Charles
With 11.1% poverty level for males and 18.6% for females among the residents of Cape Charles, 25 to 34 year old males and 6 to 11 year old females are the most vulnerable to poverty, with 15 males (48.4%) and 18 females (58.1%) in their respective age groups living below the poverty level.
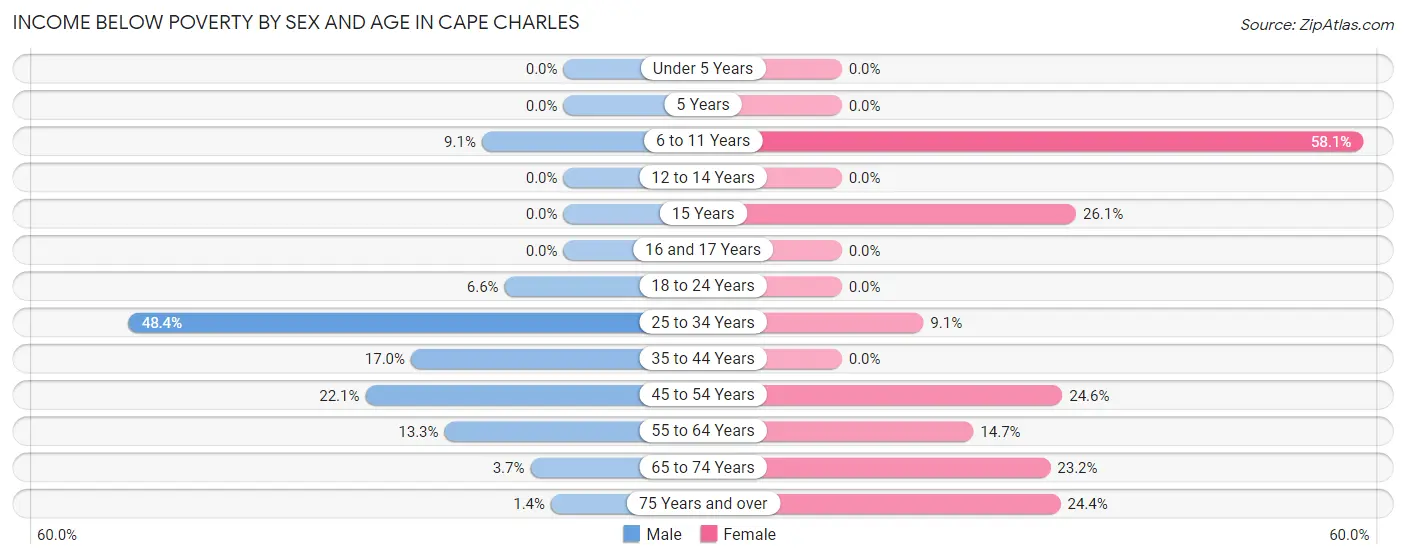
| Age Bracket | Male | Female |
| Under 5 Years | 0 (0.0%) | 0 (0.0%) |
| 5 Years | 0 (0.0%) | 0 (0.0%) |
| 6 to 11 Years | 3 (9.1%) | 18 (58.1%) |
| 12 to 14 Years | 0 (0.0%) | 0 (0.0%) |
| 15 Years | 0 (0.0%) | 6 (26.1%) |
| 16 and 17 Years | 0 (0.0%) | 0 (0.0%) |
| 18 to 24 Years | 4 (6.6%) | 0 (0.0%) |
| 25 to 34 Years | 15 (48.4%) | 4 (9.1%) |
| 35 to 44 Years | 9 (17.0%) | 0 (0.0%) |
| 45 to 54 Years | 15 (22.1%) | 14 (24.6%) |
| 55 to 64 Years | 11 (13.3%) | 17 (14.7%) |
| 65 to 74 Years | 5 (3.7%) | 36 (23.2%) |
| 75 Years and over | 1 (1.4%) | 19 (24.4%) |
| Total | 63 (11.1%) | 114 (18.6%) |
Income Above Poverty by Sex and Age in Cape Charles
According to the poverty statistics in Cape Charles, males aged under 5 years and females aged under 5 years are the age groups that are most secure financially, with 100.0% of males and 100.0% of females in these age groups living above the poverty line.
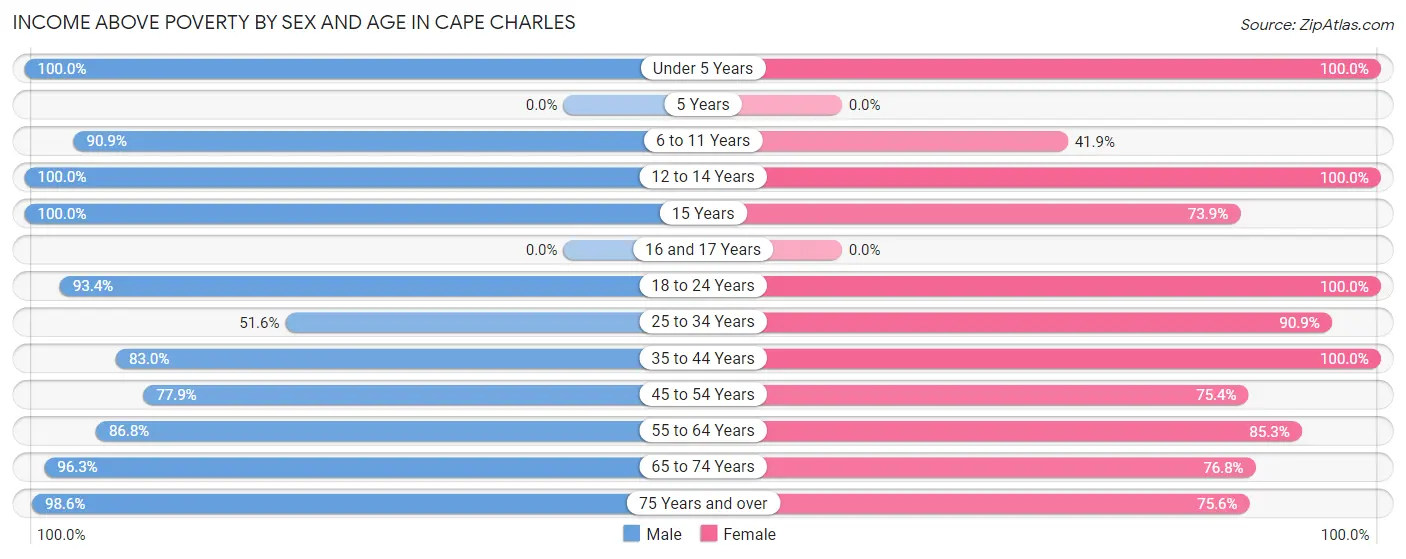
| Age Bracket | Male | Female |
| Under 5 Years | 18 (100.0%) | 4 (100.0%) |
| 5 Years | 0 (0.0%) | 0 (0.0%) |
| 6 to 11 Years | 30 (90.9%) | 13 (41.9%) |
| 12 to 14 Years | 8 (100.0%) | 22 (100.0%) |
| 15 Years | 7 (100.0%) | 17 (73.9%) |
| 16 and 17 Years | 0 (0.0%) | 0 (0.0%) |
| 18 to 24 Years | 57 (93.4%) | 52 (100.0%) |
| 25 to 34 Years | 16 (51.6%) | 40 (90.9%) |
| 35 to 44 Years | 44 (83.0%) | 31 (100.0%) |
| 45 to 54 Years | 53 (77.9%) | 43 (75.4%) |
| 55 to 64 Years | 72 (86.8%) | 99 (85.3%) |
| 65 to 74 Years | 131 (96.3%) | 119 (76.8%) |
| 75 Years and over | 71 (98.6%) | 59 (75.6%) |
| Total | 507 (88.9%) | 499 (81.4%) |
Income Below Poverty Among Married-Couple Families in Cape Charles
The poverty statistics for married-couple families in Cape Charles show that 1.7% or 4 of the total 231 families live below the poverty line. Families with no children have the highest poverty rate of 2.0%, comprising of 4 families. On the other hand, families with 1 or 2 children have the lowest poverty rate of 0.0%, which includes 0 families.
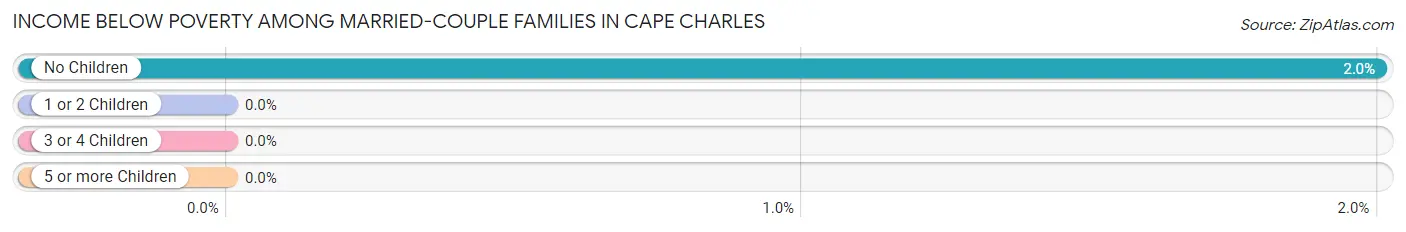
| Children | Above Poverty | Below Poverty |
| No Children | 196 (98.0%) | 4 (2.0%) |
| 1 or 2 Children | 31 (100.0%) | 0 (0.0%) |
| 3 or 4 Children | 0 (0.0%) | 0 (0.0%) |
| 5 or more Children | 0 (0.0%) | 0 (0.0%) |
| Total | 227 (98.3%) | 4 (1.7%) |
Income Below Poverty Among Single-Parent Households in Cape Charles
According to the poverty data in Cape Charles, 37.5% or 9 single-father households and 23.5% or 4 single-mother households are living below the poverty line. Among single-father households, those with 1 or 2 children have the highest poverty rate, with 9 households (37.5%) experiencing poverty. Likewise, among single-mother households, those with 1 or 2 children have the highest poverty rate, with 4 households (30.8%) falling below the poverty line.
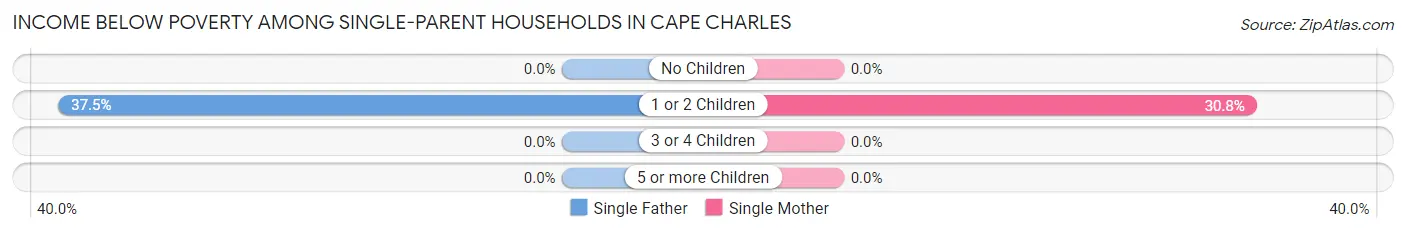
| Children | Single Father | Single Mother |
| No Children | 0 (0.0%) | 0 (0.0%) |
| 1 or 2 Children | 9 (37.5%) | 4 (30.8%) |
| 3 or 4 Children | 0 (0.0%) | 0 (0.0%) |
| 5 or more Children | 0 (0.0%) | 0 (0.0%) |
| Total | 9 (37.5%) | 4 (23.5%) |
Income Below Poverty Among Married-Couple vs Single-Parent Households in Cape Charles
The poverty data for Cape Charles shows that 4 of the married-couple family households (1.7%) and 13 of the single-parent households (31.7%) are living below the poverty level. Within the married-couple family households, those with no children have the highest poverty rate, with 4 households (2.0%) falling below the poverty line. Among the single-parent households, those with 1 or 2 children have the highest poverty rate, with 13 household (35.1%) living below poverty.
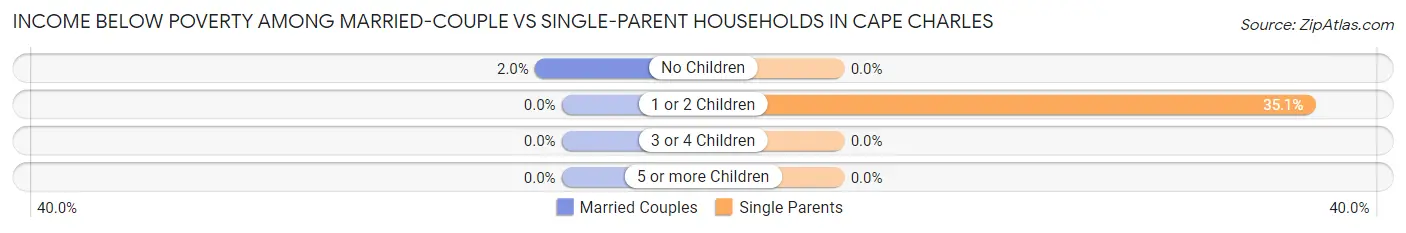
| Children | Married-Couple Families | Single-Parent Households |
| No Children | 4 (2.0%) | 0 (0.0%) |
| 1 or 2 Children | 0 (0.0%) | 13 (35.1%) |
| 3 or 4 Children | 0 (0.0%) | 0 (0.0%) |
| 5 or more Children | 0 (0.0%) | 0 (0.0%) |
| Total | 4 (1.7%) | 13 (31.7%) |
Race in Cape Charles
The most populous races in Cape Charles are White / Caucasian (1,010 | 85.4%), Black / African American (103 | 8.7%), and Hispanic or Latino (99 | 8.4%).
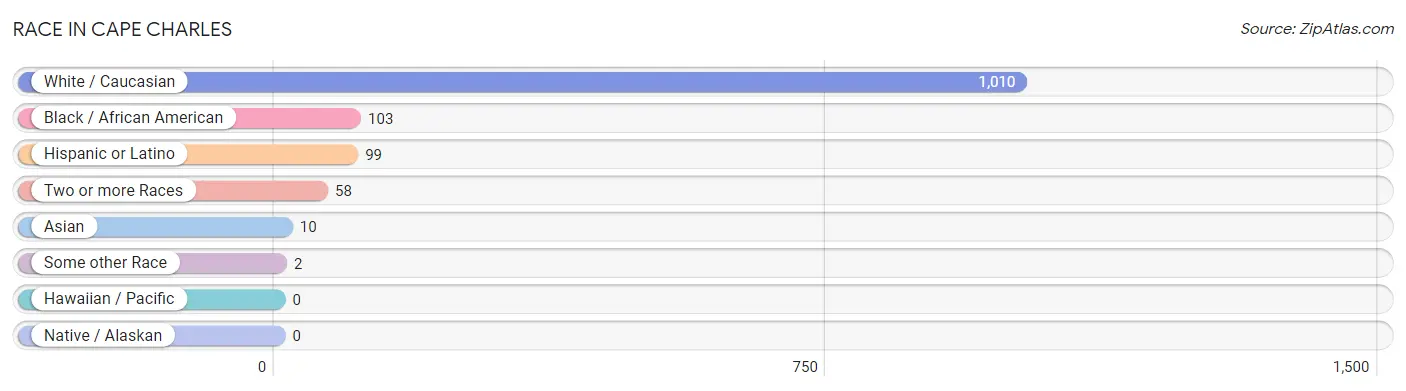
| Race | # Population | % Population |
| Asian | 10 | 0.9% |
| Black / African American | 103 | 8.7% |
| Hawaiian / Pacific | 0 | 0.0% |
| Hispanic or Latino | 99 | 8.4% |
| Native / Alaskan | 0 | 0.0% |
| White / Caucasian | 1,010 | 85.4% |
| Two or more Races | 58 | 4.9% |
| Some other Race | 2 | 0.2% |
| Total | 1,183 | 100.0% |
Ancestry in Cape Charles
The most populous ancestries reported in Cape Charles are American (438 | 37.0%), German (205 | 17.3%), English (146 | 12.3%), Irish (142 | 12.0%), and Puerto Rican (60 | 5.1%), together accounting for 83.8% of all Cape Charles residents.
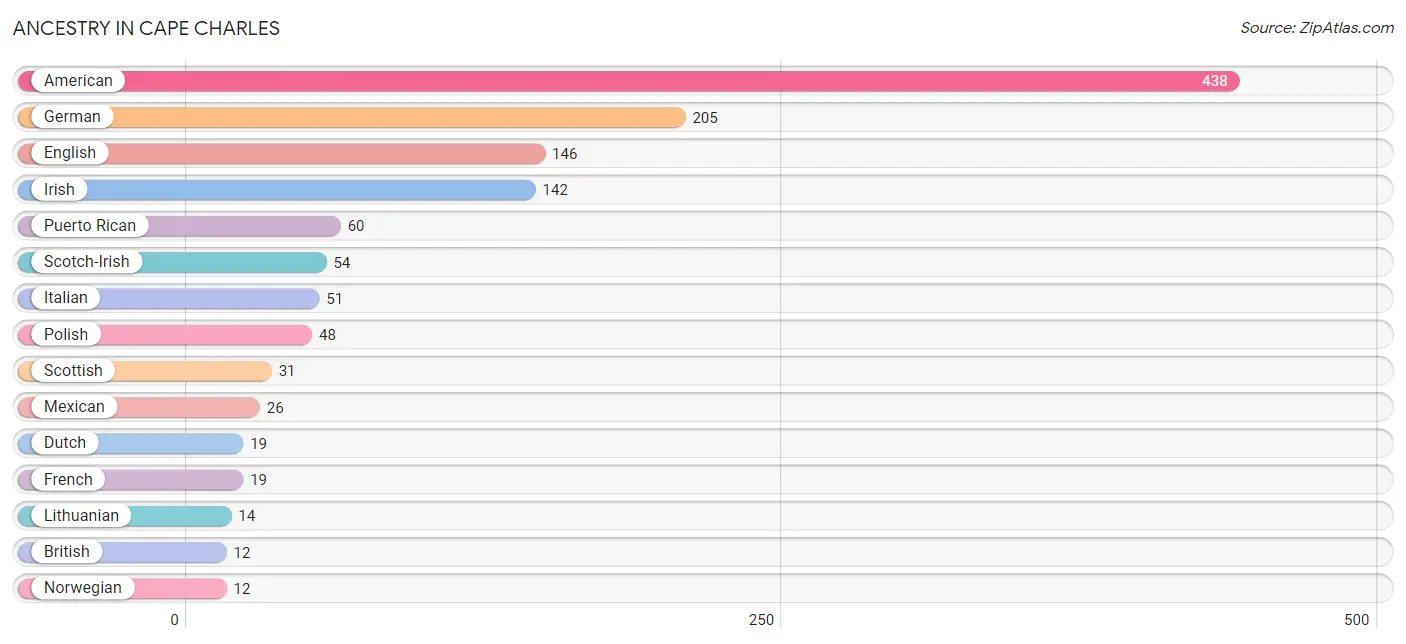
| Ancestry | # Population | % Population |
| American | 438 | 37.0% |
| Armenian | 7 | 0.6% |
| Australian | 3 | 0.3% |
| British | 12 | 1.0% |
| Burmese | 6 | 0.5% |
| Cherokee | 6 | 0.5% |
| Cuban | 5 | 0.4% |
| Czech | 3 | 0.3% |
| Czechoslovakian | 4 | 0.3% |
| Dominican | 8 | 0.7% |
| Dutch | 19 | 1.6% |
| English | 146 | 12.3% |
| European | 10 | 0.9% |
| French | 19 | 1.6% |
| French Canadian | 5 | 0.4% |
| German | 205 | 17.3% |
| Hungarian | 7 | 0.6% |
| Iranian | 2 | 0.2% |
| Irish | 142 | 12.0% |
| Italian | 51 | 4.3% |
| Korean | 6 | 0.5% |
| Laotian | 1 | 0.1% |
| Lithuanian | 14 | 1.2% |
| Mexican | 26 | 2.2% |
| Norwegian | 12 | 1.0% |
| Polish | 48 | 4.1% |
| Portuguese | 7 | 0.6% |
| Puerto Rican | 60 | 5.1% |
| Russian | 3 | 0.3% |
| Scandinavian | 2 | 0.2% |
| Scotch-Irish | 54 | 4.6% |
| Scottish | 31 | 2.6% |
| Serbian | 1 | 0.1% |
| Slovene | 2 | 0.2% |
| Swedish | 5 | 0.4% |
| Swiss | 6 | 0.5% |
| Welsh | 6 | 0.5% | View All 37 Rows |
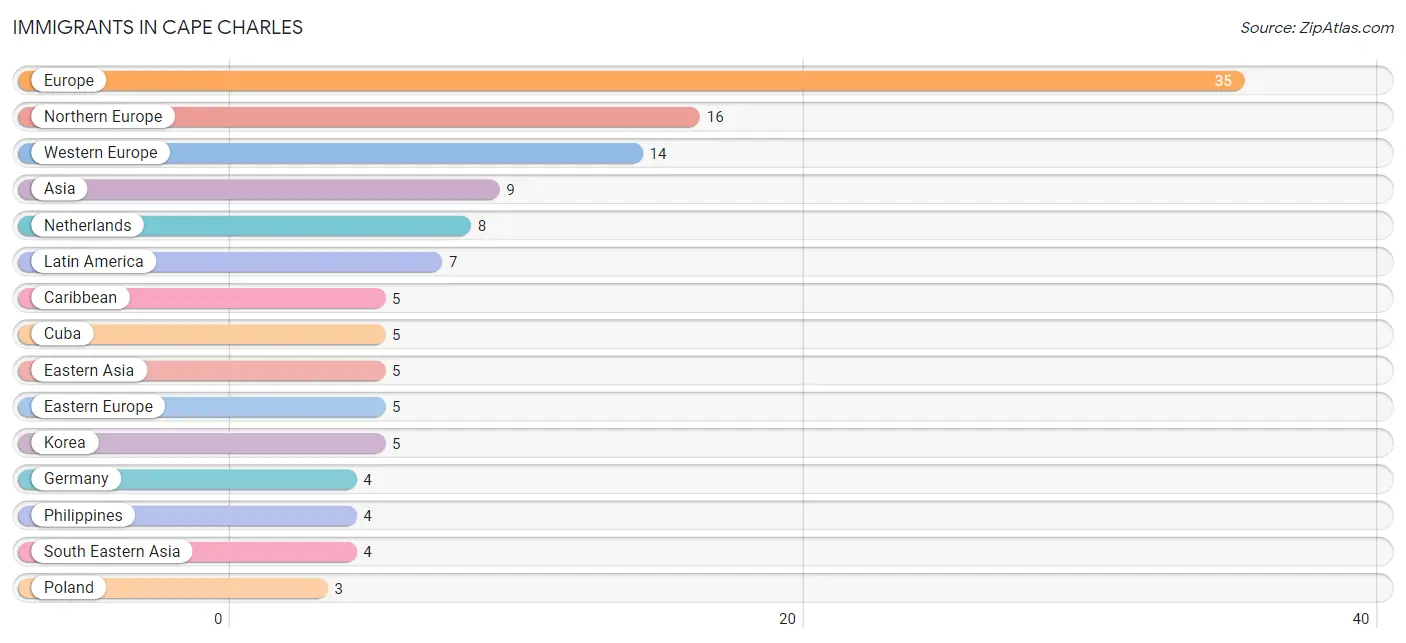
Immigrants in Cape Charles
The most numerous immigrant groups reported in Cape Charles came from Europe (35 | 3.0%), Northern Europe (16 | 1.3%), Western Europe (14 | 1.2%), Asia (9 | 0.8%), and Netherlands (8 | 0.7%), together accounting for 6.9% of all Cape Charles residents.
| Immigration Origin | # Population | % Population |
| Africa | 2 | 0.2% |
| Asia | 9 | 0.8% |
| Caribbean | 5 | 0.4% |
| Central America | 2 | 0.2% |
| Cuba | 5 | 0.4% |
| Eastern Asia | 5 | 0.4% |
| Eastern Europe | 5 | 0.4% |
| Egypt | 2 | 0.2% |
| Europe | 35 | 3.0% |
| France | 2 | 0.2% |
| Germany | 4 | 0.3% |
| Korea | 5 | 0.4% |
| Latin America | 7 | 0.6% |
| Lithuania | 2 | 0.2% |
| Mexico | 2 | 0.2% |
| Netherlands | 8 | 0.7% |
| Northern Africa | 2 | 0.2% |
| Northern Europe | 16 | 1.3% |
| Philippines | 4 | 0.3% |
| Poland | 3 | 0.3% |
| South Eastern Asia | 4 | 0.3% |
| Western Europe | 14 | 1.2% | View All 22 Rows |
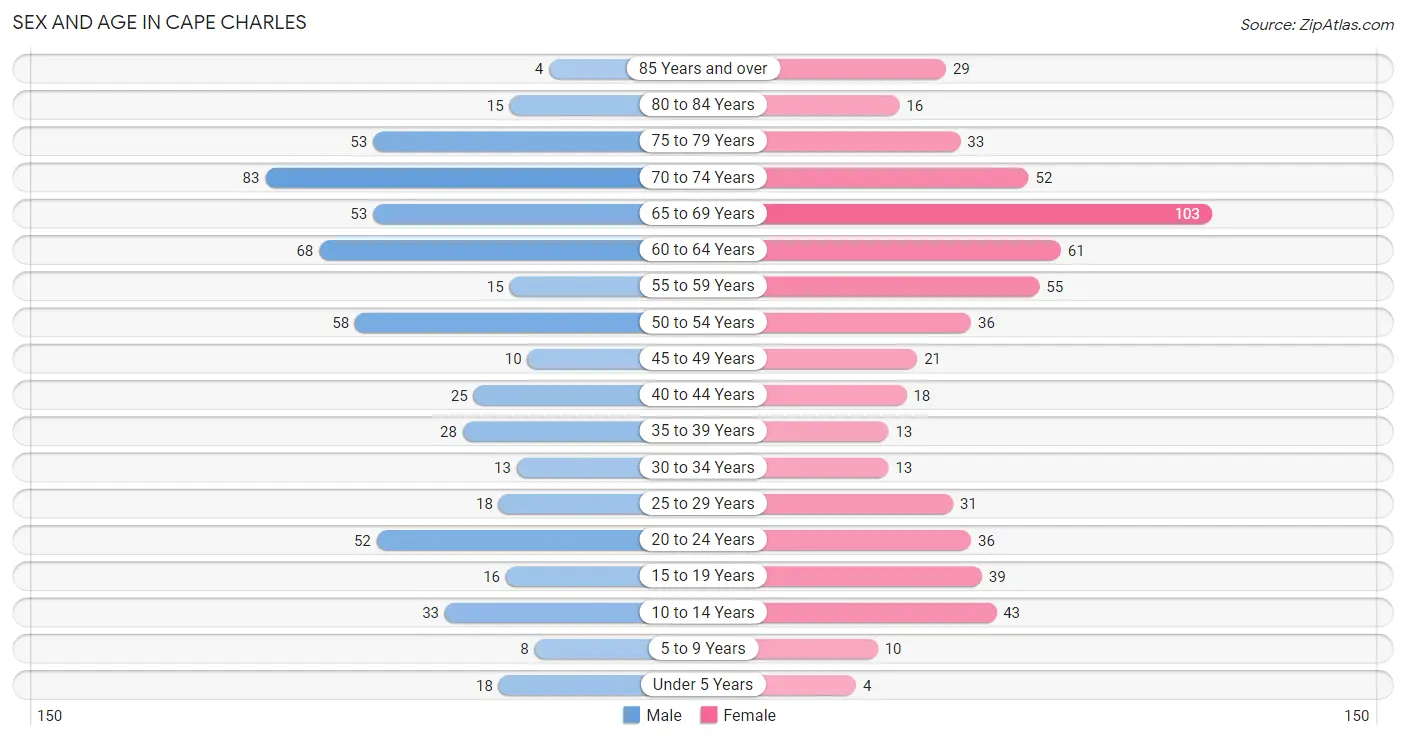
Sex and Age in Cape Charles
Sex and Age in Cape Charles
The most populous age groups in Cape Charles are 70 to 74 Years (83 | 14.6%) for men and 65 to 69 Years (103 | 16.8%) for women.
| Age Bracket | Male | Female |
| Under 5 Years | 18 (3.2%) | 4 (0.6%) |
| 5 to 9 Years | 8 (1.4%) | 10 (1.6%) |
| 10 to 14 Years | 33 (5.8%) | 43 (7.0%) |
| 15 to 19 Years | 16 (2.8%) | 39 (6.4%) |
| 20 to 24 Years | 52 (9.1%) | 36 (5.9%) |
| 25 to 29 Years | 18 (3.2%) | 31 (5.1%) |
| 30 to 34 Years | 13 (2.3%) | 13 (2.1%) |
| 35 to 39 Years | 28 (4.9%) | 13 (2.1%) |
| 40 to 44 Years | 25 (4.4%) | 18 (2.9%) |
| 45 to 49 Years | 10 (1.8%) | 21 (3.4%) |
| 50 to 54 Years | 58 (10.2%) | 36 (5.9%) |
| 55 to 59 Years | 15 (2.6%) | 55 (9.0%) |
| 60 to 64 Years | 68 (11.9%) | 61 (10.0%) |
| 65 to 69 Years | 53 (9.3%) | 103 (16.8%) |
| 70 to 74 Years | 83 (14.6%) | 52 (8.5%) |
| 75 to 79 Years | 53 (9.3%) | 33 (5.4%) |
| 80 to 84 Years | 15 (2.6%) | 16 (2.6%) |
| 85 Years and over | 4 (0.7%) | 29 (4.7%) |
| Total | 570 (100.0%) | 613 (100.0%) |
Families and Households in Cape Charles
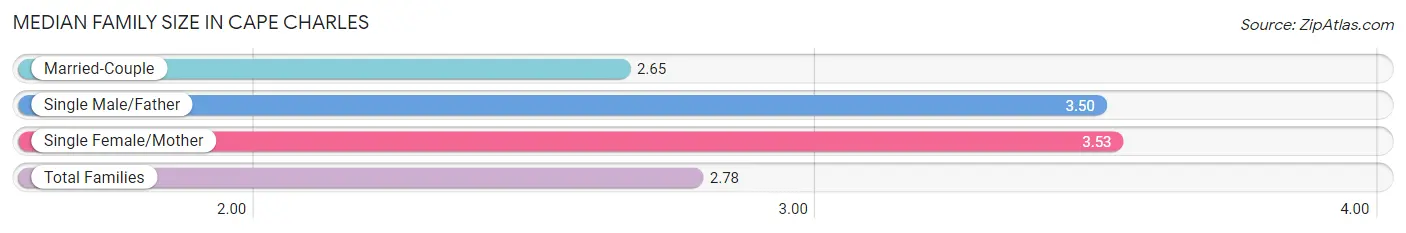
Median Family Size in Cape Charles
The median family size in Cape Charles is 2.78 persons per family, with single female/mother families (17 | 6.2%) accounting for the largest median family size of 3.53 persons per family. On the other hand, married-couple families (231 | 84.9%) represent the smallest median family size with 2.65 persons per family.
| Family Type | # Families | Family Size |
| Married-Couple | 231 (84.9%) | 2.65 |
| Single Male/Father | 24 (8.8%) | 3.50 |
| Single Female/Mother | 17 (6.2%) | 3.53 |
| Total Families | 272 (100.0%) | 2.78 |
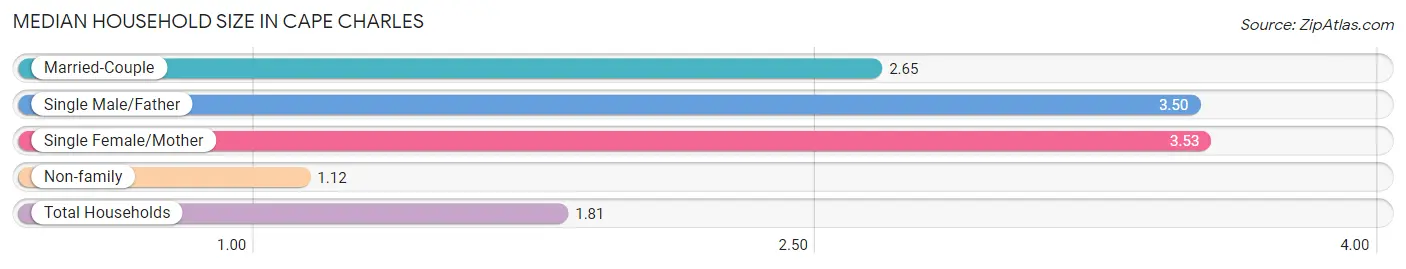
Median Household Size in Cape Charles
The median household size in Cape Charles is 1.81 persons per household, with single female/mother households (17 | 2.6%) accounting for the largest median household size of 3.53 persons per household. non-family households (381 | 58.4%) represent the smallest median household size with 1.12 persons per household.
| Household Type | # Households | Household Size |
| Married-Couple | 231 (35.4%) | 2.65 |
| Single Male/Father | 24 (3.7%) | 3.50 |
| Single Female/Mother | 17 (2.6%) | 3.53 |
| Non-family | 381 (58.4%) | 1.12 |
| Total Households | 653 (100.0%) | 1.81 |
Household Size by Marriage Status in Cape Charles
Out of a total of 653 households in Cape Charles, 272 (41.6%) are family households, while 381 (58.4%) are nonfamily households. The most numerous type of family households are 2-person households, comprising 184, and the most common type of nonfamily households are 1-person households, comprising 335.
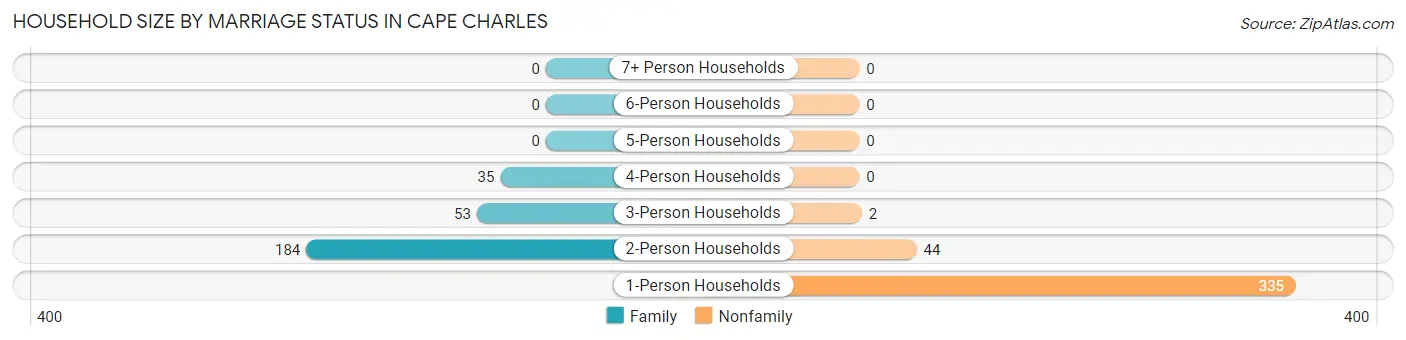
| Household Size | Family Households | Nonfamily Households |
| 1-Person Households | - | 335 (51.3%) |
| 2-Person Households | 184 (28.2%) | 44 (6.7%) |
| 3-Person Households | 53 (8.1%) | 2 (0.3%) |
| 4-Person Households | 35 (5.4%) | 0 (0.0%) |
| 5-Person Households | 0 (0.0%) | 0 (0.0%) |
| 6-Person Households | 0 (0.0%) | 0 (0.0%) |
| 7+ Person Households | 0 (0.0%) | 0 (0.0%) |
| Total | 272 (41.6%) | 381 (58.4%) |
Female Fertility in Cape Charles
Fertility by Age in Cape Charles
Average fertility rate in Cape Charles is 23.0 births per 1,000 women. Women in the age bracket of 20 to 34 years have the highest fertility rate with 38.0 births per 1,000 women. Women in the age bracket of 20 to 34 years acount for 75.0% of all women with births.
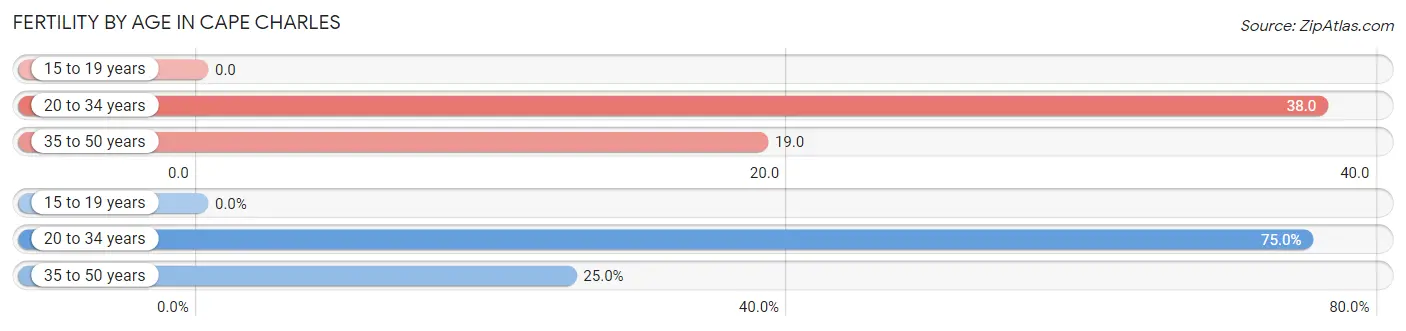
| Age Bracket | Women with Births | Births / 1,000 Women |
| 15 to 19 years | 0 (0.0%) | 0.0 |
| 20 to 34 years | 3 (75.0%) | 38.0 |
| 35 to 50 years | 1 (25.0%) | 19.0 |
| Total | 4 (100.0%) | 23.0 |
Fertility by Age by Marriage Status in Cape Charles
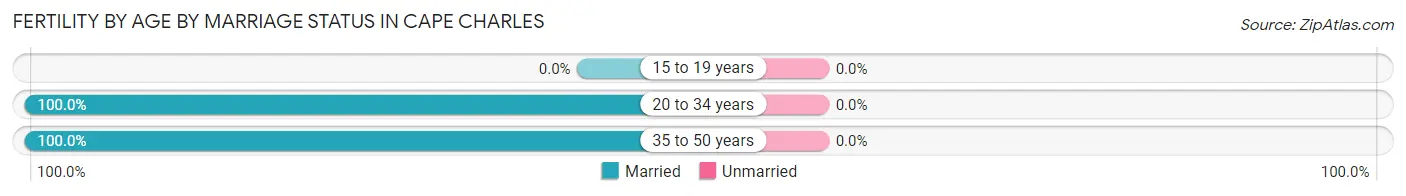
| Age Bracket | Married | Unmarried |
| 15 to 19 years | 0 (0.0%) | 0 (0.0%) |
| 20 to 34 years | 3 (100.0%) | 0 (0.0%) |
| 35 to 50 years | 1 (100.0%) | 0 (0.0%) |
| Total | 4 (100.0%) | 0 (0.0%) |
Fertility by Education in Cape Charles
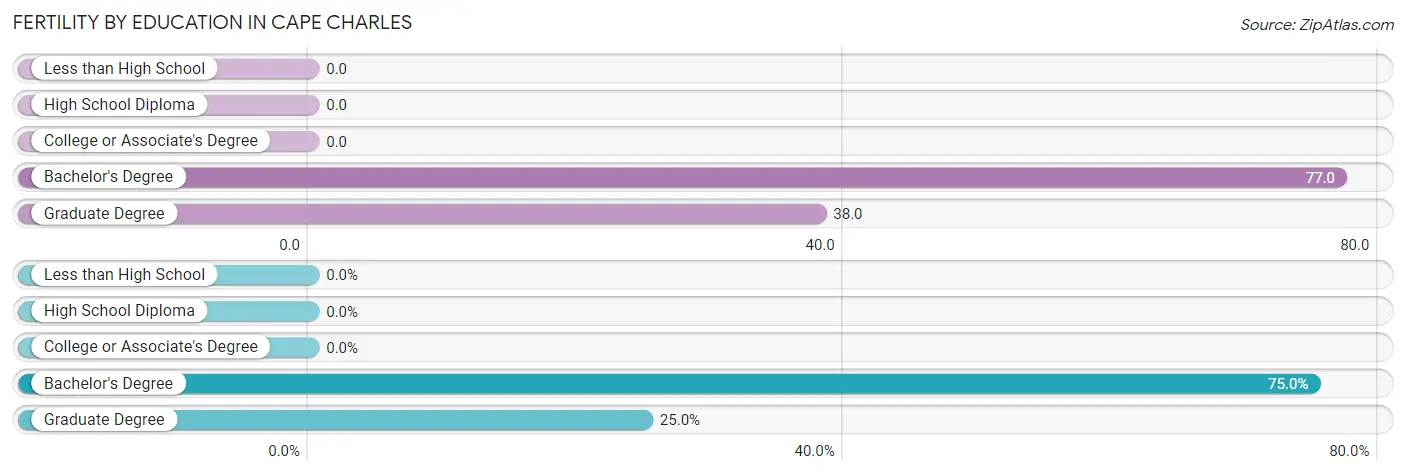
| Educational Attainment | Women with Births | Births / 1,000 Women |
| Less than High School | 0 (0.0%) | 0.0 |
| High School Diploma | 0 (0.0%) | 0.0 |
| College or Associate's Degree | 0 (0.0%) | 0.0 |
| Bachelor's Degree | 3 (75.0%) | 77.0 |
| Graduate Degree | 1 (25.0%) | 38.0 |
| Total | 4 (100.0%) | 23.0 |
Fertility by Education by Marriage Status in Cape Charles
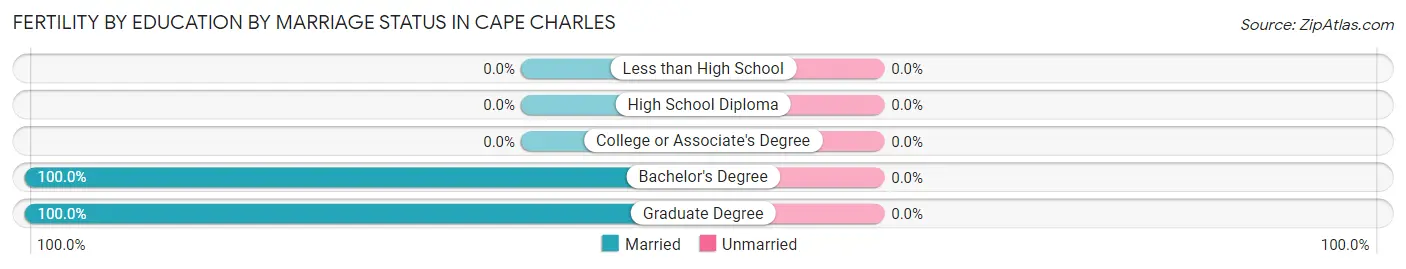
| Educational Attainment | Married | Unmarried |
| Less than High School | 0 (0.0%) | 0 (0.0%) |
| High School Diploma | 0 (0.0%) | 0 (0.0%) |
| College or Associate's Degree | 0 (0.0%) | 0 (0.0%) |
| Bachelor's Degree | 3 (100.0%) | 0 (0.0%) |
| Graduate Degree | 1 (100.0%) | 0 (0.0%) |
| Total | 4 (100.0%) | 0 (0.0%) |
Employment Characteristics in Cape Charles
Employment by Class of Employer in Cape Charles
Among the 488 employed individuals in Cape Charles, private company employees (298 | 61.1%), self-employed (incorporated) (62 | 12.7%), and federal government employees (42 | 8.6%) make up the most common classes of employment.
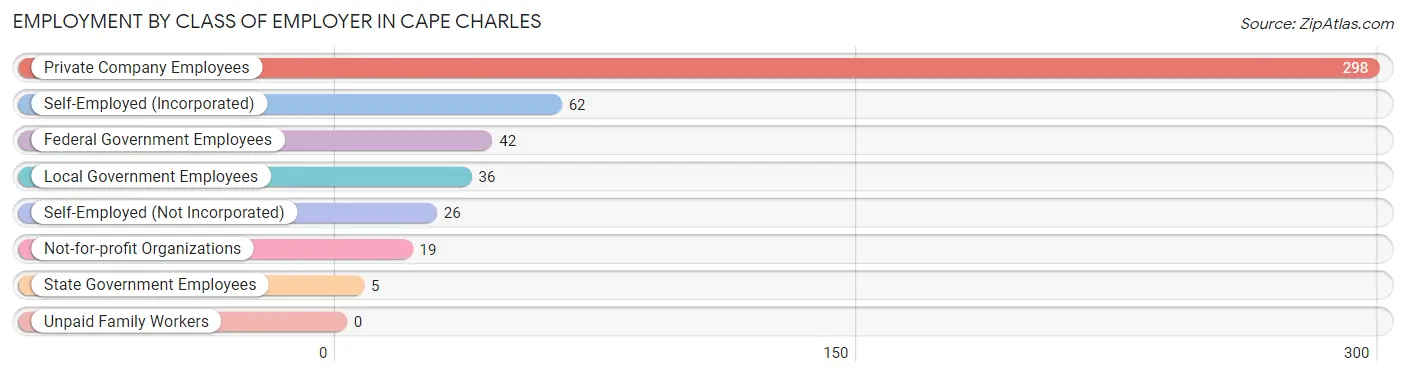
| Employer Class | # Employees | % Employees |
| Private Company Employees | 298 | 61.1% |
| Self-Employed (Incorporated) | 62 | 12.7% |
| Self-Employed (Not Incorporated) | 26 | 5.3% |
| Not-for-profit Organizations | 19 | 3.9% |
| Local Government Employees | 36 | 7.4% |
| State Government Employees | 5 | 1.0% |
| Federal Government Employees | 42 | 8.6% |
| Unpaid Family Workers | 0 | 0.0% |
| Total | 488 | 100.0% |
Employment Status by Age in Cape Charles
According to the labor force statistics for Cape Charles, out of the total population over 16 years of age (1,037), 50.9% or 528 individuals are in the labor force, with 7.5% or 40 of them unemployed. The age group with the highest labor force participation rate is 25 to 29 years, with 100.0% or 49 individuals in the labor force. Within the labor force, the 30 to 34 years age range has the highest percentage of unemployed individuals, with 20.0% or 5 of them being unemployed.
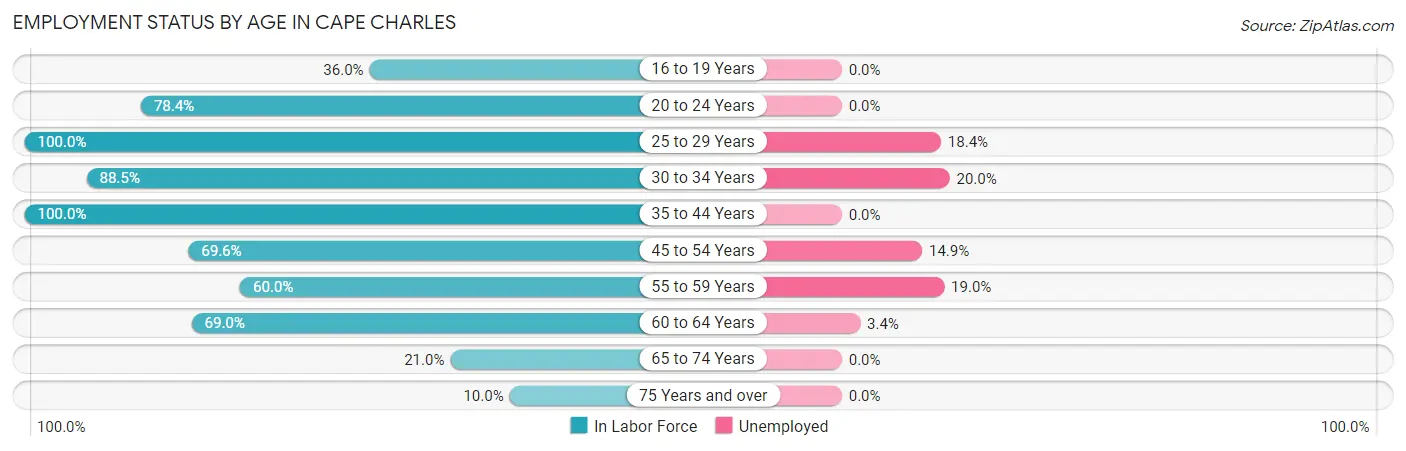
| Age Bracket | In Labor Force | Unemployed |
| 16 to 19 Years | 9 (36.0%) | 0 (0.0%) |
| 20 to 24 Years | 69 (78.4%) | 0 (0.0%) |
| 25 to 29 Years | 49 (100.0%) | 9 (18.4%) |
| 30 to 34 Years | 23 (88.5%) | 5 (20.0%) |
| 35 to 44 Years | 84 (100.0%) | 0 (0.0%) |
| 45 to 54 Years | 87 (69.6%) | 13 (14.9%) |
| 55 to 59 Years | 42 (60.0%) | 8 (19.0%) |
| 60 to 64 Years | 89 (69.0%) | 3 (3.4%) |
| 65 to 74 Years | 61 (21.0%) | 0 (0.0%) |
| 75 Years and over | 15 (10.0%) | 0 (0.0%) |
| Total | 528 (50.9%) | 40 (7.5%) |
Employment Status by Educational Attainment in Cape Charles
According to labor force statistics for Cape Charles, 77.4% of individuals (374) out of the total population between 25 and 64 years of age (483) are in the labor force, with 10.0% or 37 of them being unemployed. The group with the highest labor force participation rate are those with the educational attainment of high school diploma, with 84.4% or 38 individuals in the labor force. Within the labor force, individuals with less than high school education have the highest percentage of unemployment, with 50.0% or 13 of them being unemployed.
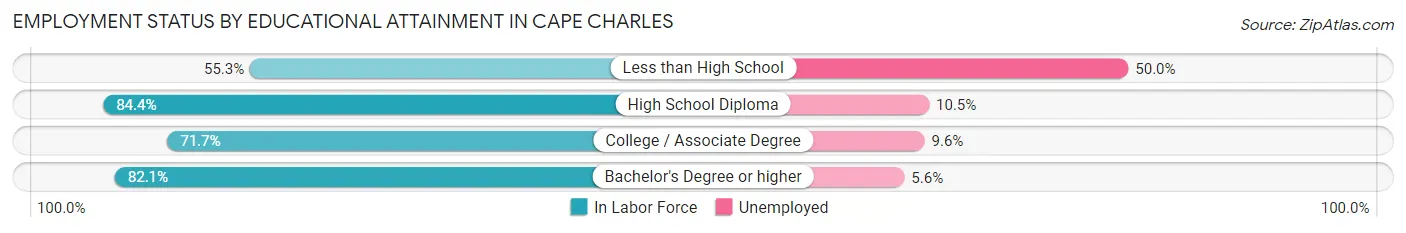
| Educational Attainment | In Labor Force | Unemployed |
| Less than High School | 26 (55.3%) | 24 (50.0%) |
| High School Diploma | 38 (84.4%) | 5 (10.5%) |
| College / Associate Degree | 76 (71.7%) | 10 (9.6%) |
| Bachelor's Degree or higher | 234 (82.1%) | 16 (5.6%) |
| Total | 374 (77.4%) | 48 (10.0%) |
Employment Occupations by Sex in Cape Charles
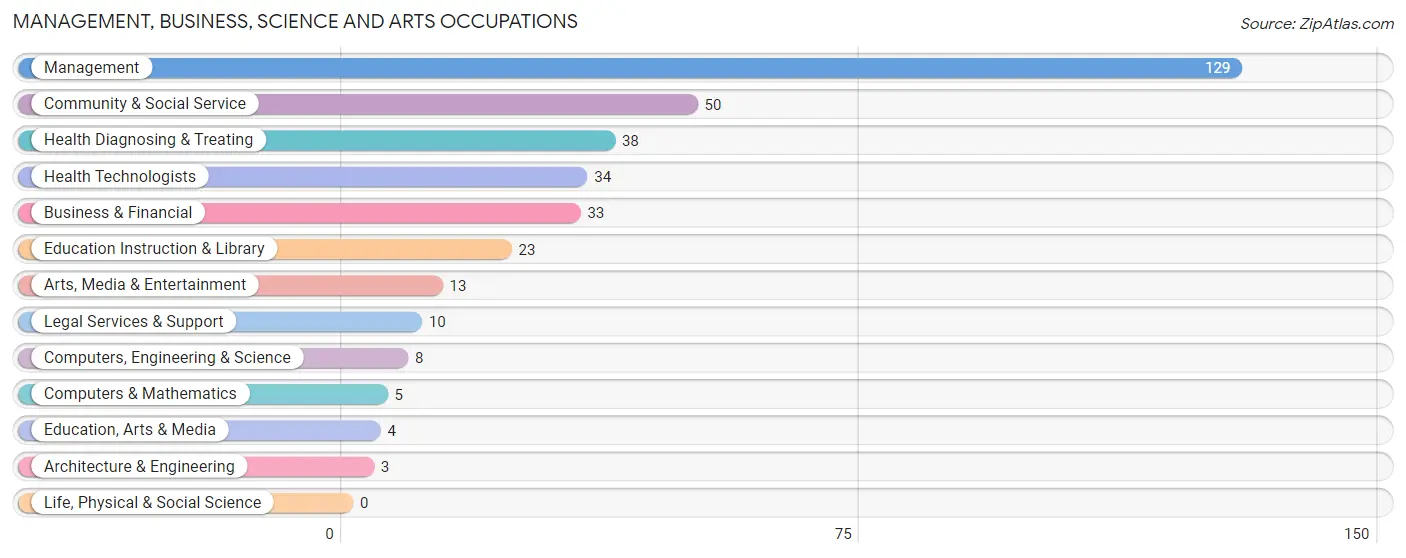
Management, Business, Science and Arts Occupations
The most common Management, Business, Science and Arts occupations in Cape Charles are Management (129 | 28.4%), Community & Social Service (50 | 11.0%), Health Diagnosing & Treating (38 | 8.4%), Health Technologists (34 | 7.5%), and Business & Financial (33 | 7.3%).
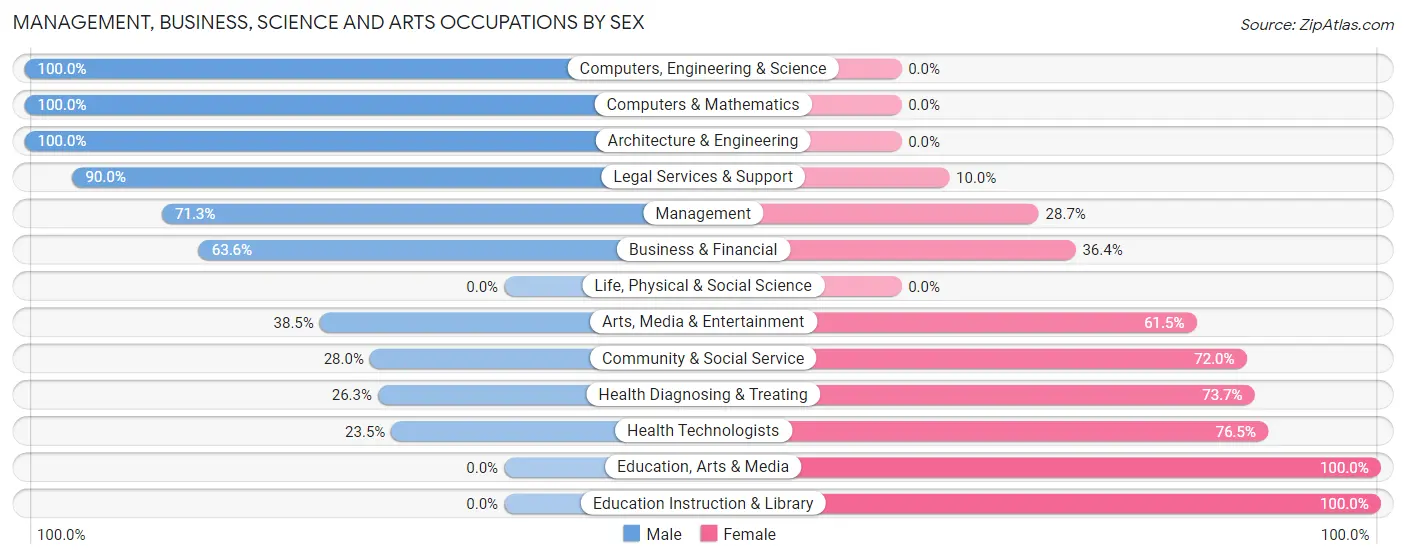
Management, Business, Science and Arts Occupations by Sex
Within the Management, Business, Science and Arts occupations in Cape Charles, the most male-oriented occupations are Computers, Engineering & Science (100.0%), Computers & Mathematics (100.0%), and Architecture & Engineering (100.0%), while the most female-oriented occupations are Education, Arts & Media (100.0%), Education Instruction & Library (100.0%), and Health Technologists (76.5%).
| Occupation | Male | Female |
| Management | 92 (71.3%) | 37 (28.7%) |
| Business & Financial | 21 (63.6%) | 12 (36.4%) |
| Computers, Engineering & Science | 8 (100.0%) | 0 (0.0%) |
| Computers & Mathematics | 5 (100.0%) | 0 (0.0%) |
| Architecture & Engineering | 3 (100.0%) | 0 (0.0%) |
| Life, Physical & Social Science | 0 (0.0%) | 0 (0.0%) |
| Community & Social Service | 14 (28.0%) | 36 (72.0%) |
| Education, Arts & Media | 0 (0.0%) | 4 (100.0%) |
| Legal Services & Support | 9 (90.0%) | 1 (10.0%) |
| Education Instruction & Library | 0 (0.0%) | 23 (100.0%) |
| Arts, Media & Entertainment | 5 (38.5%) | 8 (61.5%) |
| Health Diagnosing & Treating | 10 (26.3%) | 28 (73.7%) |
| Health Technologists | 8 (23.5%) | 26 (76.5%) |
| Total (Category) | 145 (56.2%) | 113 (43.8%) |
| Total (Overall) | 233 (51.3%) | 221 (48.7%) |
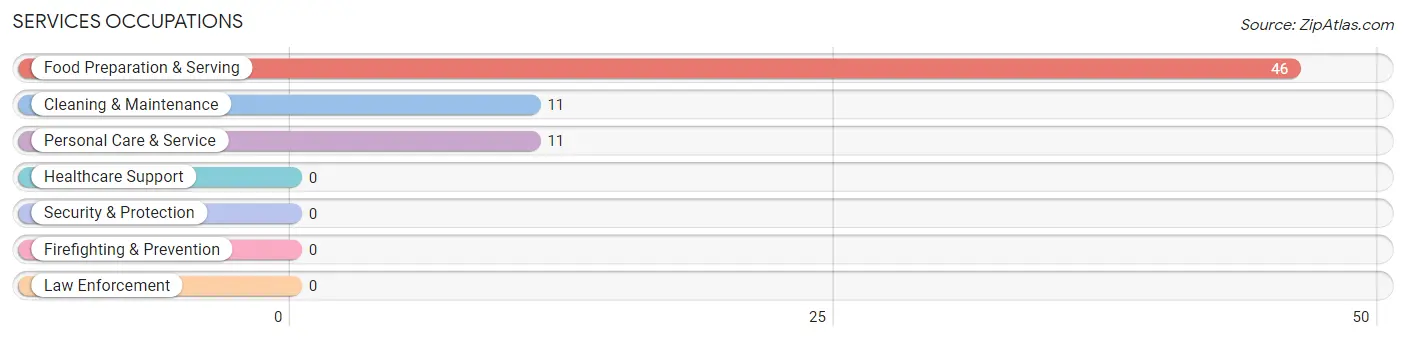
Services Occupations
The most common Services occupations in Cape Charles are Food Preparation & Serving (46 | 10.1%), Cleaning & Maintenance (11 | 2.4%), and Personal Care & Service (11 | 2.4%).
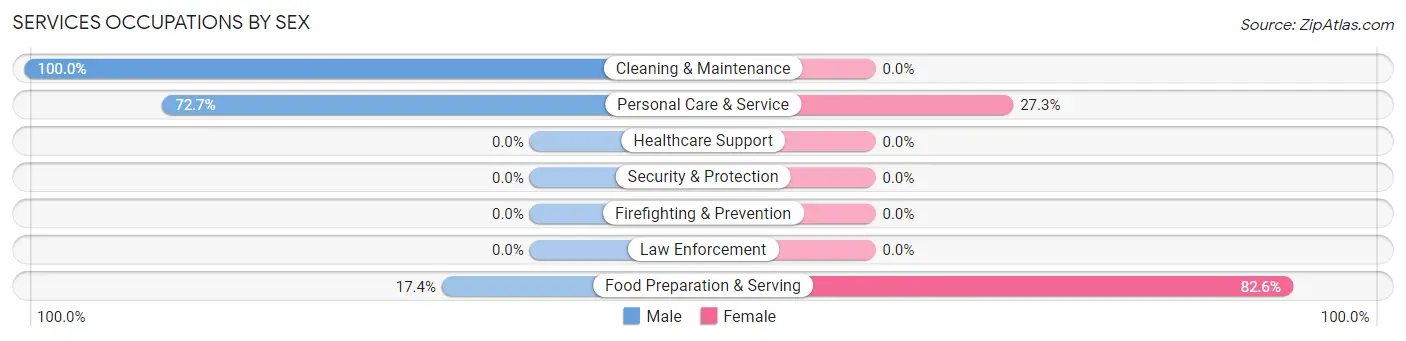
Services Occupations by Sex
Within the Services occupations in Cape Charles, the most male-oriented occupations are Cleaning & Maintenance (100.0%), Personal Care & Service (72.7%), and Food Preparation & Serving (17.4%), while the most female-oriented occupations are Food Preparation & Serving (82.6%), and Personal Care & Service (27.3%).
| Occupation | Male | Female |
| Healthcare Support | 0 (0.0%) | 0 (0.0%) |
| Security & Protection | 0 (0.0%) | 0 (0.0%) |
| Firefighting & Prevention | 0 (0.0%) | 0 (0.0%) |
| Law Enforcement | 0 (0.0%) | 0 (0.0%) |
| Food Preparation & Serving | 8 (17.4%) | 38 (82.6%) |
| Cleaning & Maintenance | 11 (100.0%) | 0 (0.0%) |
| Personal Care & Service | 8 (72.7%) | 3 (27.3%) |
| Total (Category) | 27 (39.7%) | 41 (60.3%) |
| Total (Overall) | 233 (51.3%) | 221 (48.7%) |
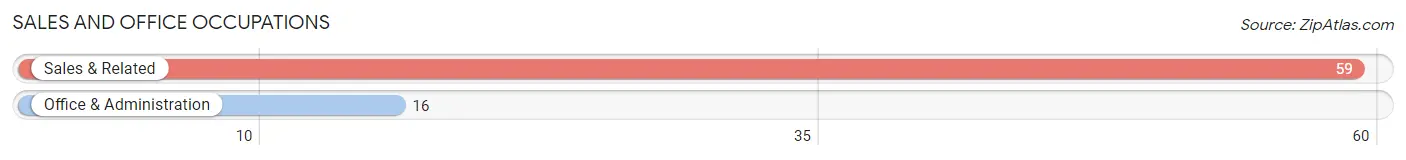
Sales and Office Occupations
The most common Sales and Office occupations in Cape Charles are Sales & Related (59 | 13.0%), and Office & Administration (16 | 3.5%).
Sales and Office Occupations by Sex
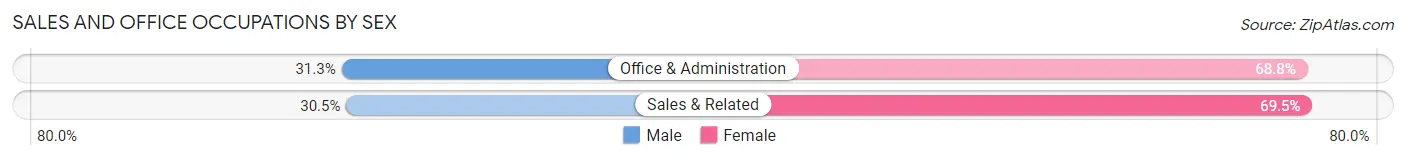
| Occupation | Male | Female |
| Sales & Related | 18 (30.5%) | 41 (69.5%) |
| Office & Administration | 5 (31.2%) | 11 (68.8%) |
| Total (Category) | 23 (30.7%) | 52 (69.3%) |
| Total (Overall) | 233 (51.3%) | 221 (48.7%) |
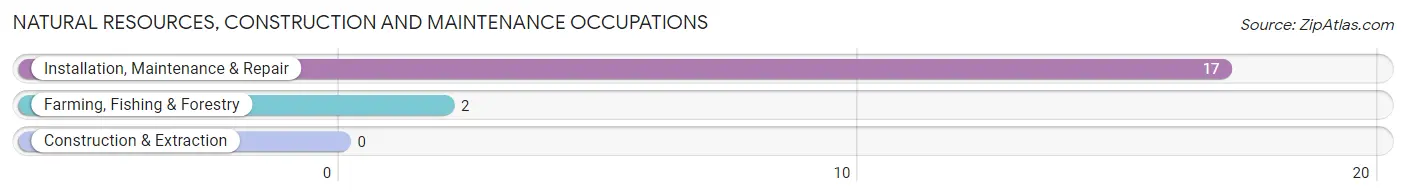
Natural Resources, Construction and Maintenance Occupations
The most common Natural Resources, Construction and Maintenance occupations in Cape Charles are Installation, Maintenance & Repair (17 | 3.7%), and Farming, Fishing & Forestry (2 | 0.4%).
Natural Resources, Construction and Maintenance Occupations by Sex
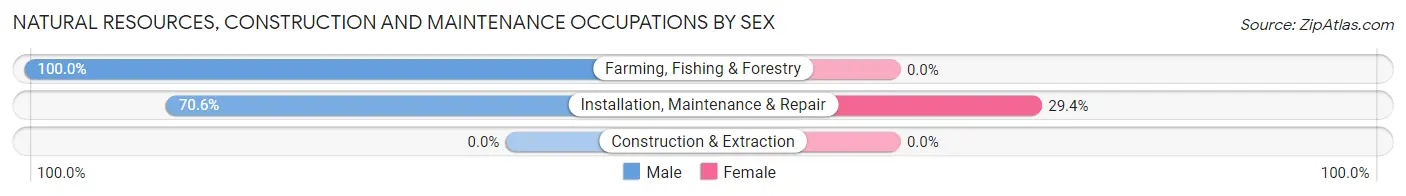
| Occupation | Male | Female |
| Farming, Fishing & Forestry | 2 (100.0%) | 0 (0.0%) |
| Construction & Extraction | 0 (0.0%) | 0 (0.0%) |
| Installation, Maintenance & Repair | 12 (70.6%) | 5 (29.4%) |
| Total (Category) | 14 (73.7%) | 5 (26.3%) |
| Total (Overall) | 233 (51.3%) | 221 (48.7%) |
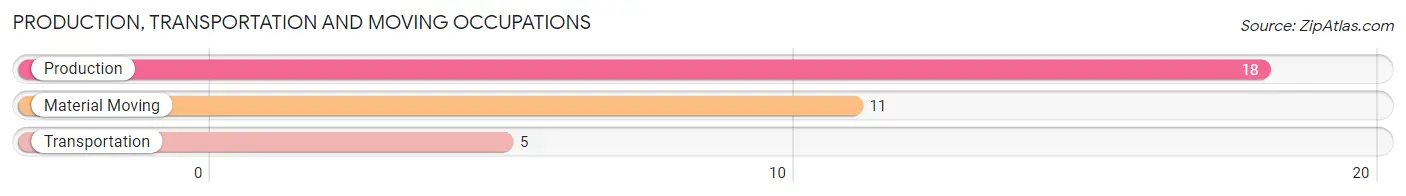
Production, Transportation and Moving Occupations
The most common Production, Transportation and Moving occupations in Cape Charles are Production (18 | 4.0%), Material Moving (11 | 2.4%), and Transportation (5 | 1.1%).
Production, Transportation and Moving Occupations by Sex
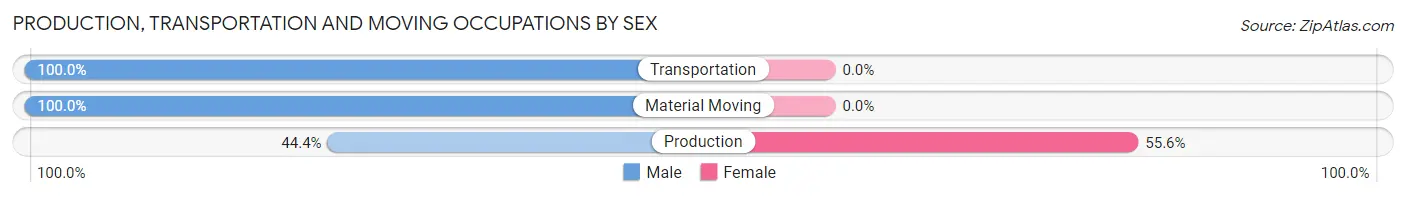
| Occupation | Male | Female |
| Production | 8 (44.4%) | 10 (55.6%) |
| Transportation | 5 (100.0%) | 0 (0.0%) |
| Material Moving | 11 (100.0%) | 0 (0.0%) |
| Total (Category) | 24 (70.6%) | 10 (29.4%) |
| Total (Overall) | 233 (51.3%) | 221 (48.7%) |
Employment Industries by Sex in Cape Charles
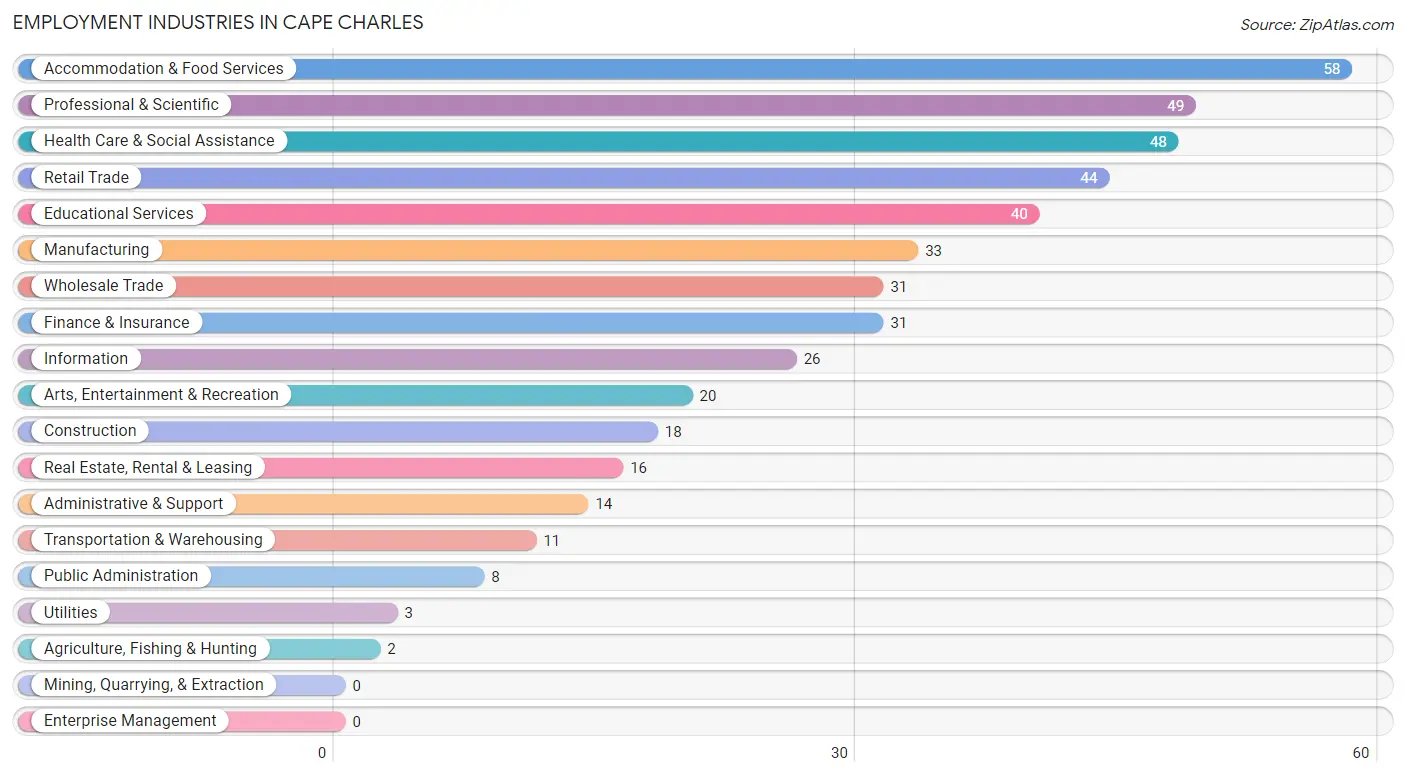
Employment Industries in Cape Charles
The major employment industries in Cape Charles include Accommodation & Food Services (58 | 12.8%), Professional & Scientific (49 | 10.8%), Health Care & Social Assistance (48 | 10.6%), Retail Trade (44 | 9.7%), and Educational Services (40 | 8.8%).
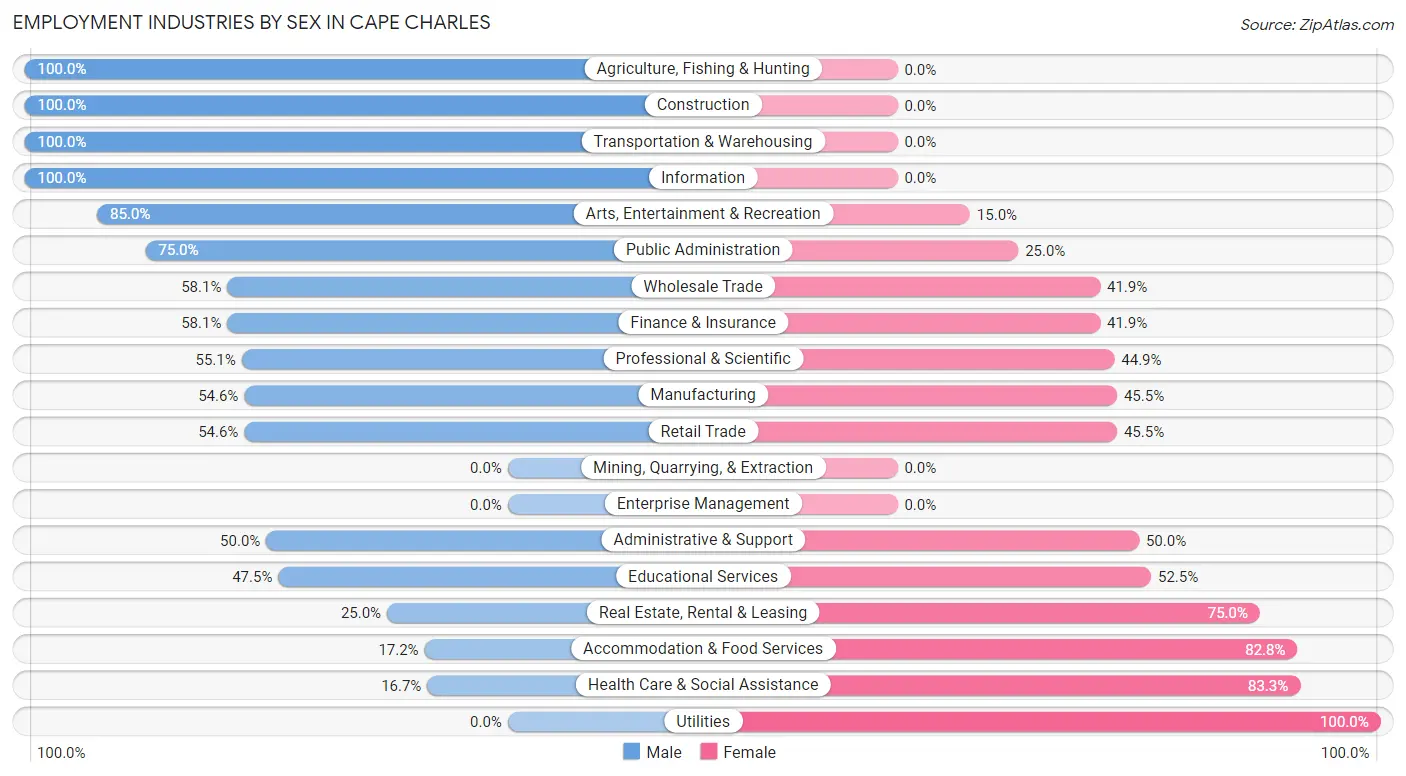
Employment Industries by Sex in Cape Charles
The Cape Charles industries that see more men than women are Agriculture, Fishing & Hunting (100.0%), Construction (100.0%), and Transportation & Warehousing (100.0%), whereas the industries that tend to have a higher number of women are Utilities (100.0%), Health Care & Social Assistance (83.3%), and Accommodation & Food Services (82.8%).
| Industry | Male | Female |
| Agriculture, Fishing & Hunting | 2 (100.0%) | 0 (0.0%) |
| Mining, Quarrying, & Extraction | 0 (0.0%) | 0 (0.0%) |
| Construction | 18 (100.0%) | 0 (0.0%) |
| Manufacturing | 18 (54.5%) | 15 (45.5%) |
| Wholesale Trade | 18 (58.1%) | 13 (41.9%) |
| Retail Trade | 24 (54.5%) | 20 (45.5%) |
| Transportation & Warehousing | 11 (100.0%) | 0 (0.0%) |
| Utilities | 0 (0.0%) | 3 (100.0%) |
| Information | 26 (100.0%) | 0 (0.0%) |
| Finance & Insurance | 18 (58.1%) | 13 (41.9%) |
| Real Estate, Rental & Leasing | 4 (25.0%) | 12 (75.0%) |
| Professional & Scientific | 27 (55.1%) | 22 (44.9%) |
| Enterprise Management | 0 (0.0%) | 0 (0.0%) |
| Administrative & Support | 7 (50.0%) | 7 (50.0%) |
| Educational Services | 19 (47.5%) | 21 (52.5%) |
| Health Care & Social Assistance | 8 (16.7%) | 40 (83.3%) |
| Arts, Entertainment & Recreation | 17 (85.0%) | 3 (15.0%) |
| Accommodation & Food Services | 10 (17.2%) | 48 (82.8%) |
| Public Administration | 6 (75.0%) | 2 (25.0%) |
| Total | 233 (51.3%) | 221 (48.7%) |
Education in Cape Charles
School Enrollment in Cape Charles
The most common levels of schooling among the 191 students in Cape Charles are middle school (68 | 35.6%), college / undergraduate (47 | 24.6%), and elementary school (41 | 21.5%).
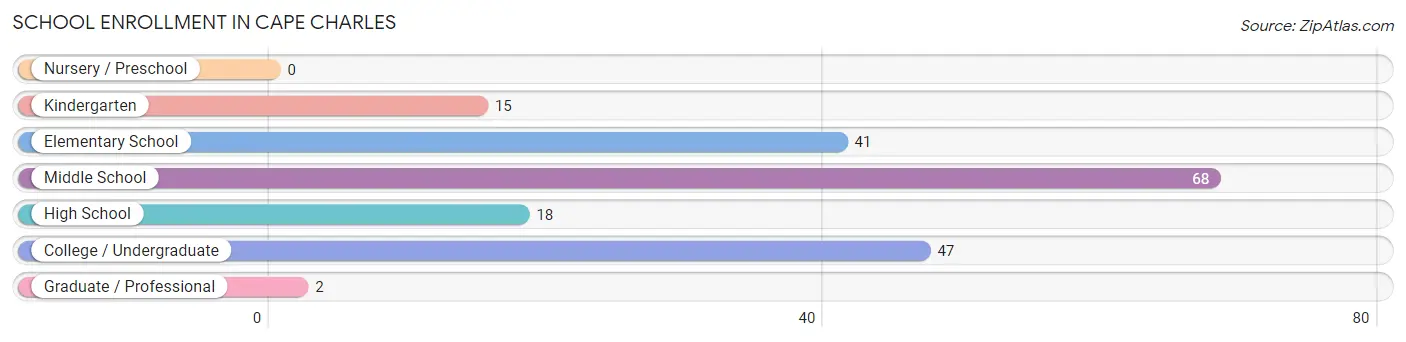
| School Level | # Students | % Students |
| Nursery / Preschool | 0 | 0.0% |
| Kindergarten | 15 | 7.9% |
| Elementary School | 41 | 21.5% |
| Middle School | 68 | 35.6% |
| High School | 18 | 9.4% |
| College / Undergraduate | 47 | 24.6% |
| Graduate / Professional | 2 | 1.1% |
| Total | 191 | 100.0% |
School Enrollment by Age by Funding Source in Cape Charles
Out of a total of 191 students who are enrolled in schools in Cape Charles, 40 (20.9%) attend a private institution, while the remaining 151 (79.1%) are enrolled in public schools. The age group of 5 to 9 year old has the highest likelihood of being enrolled in private schools, with 15 (83.3% in the age bracket) enrolled. Conversely, the age group of 3 to 4 year olds has the lowest likelihood of being enrolled in a private school, with 13 (100.0% in the age bracket) attending a public institution.
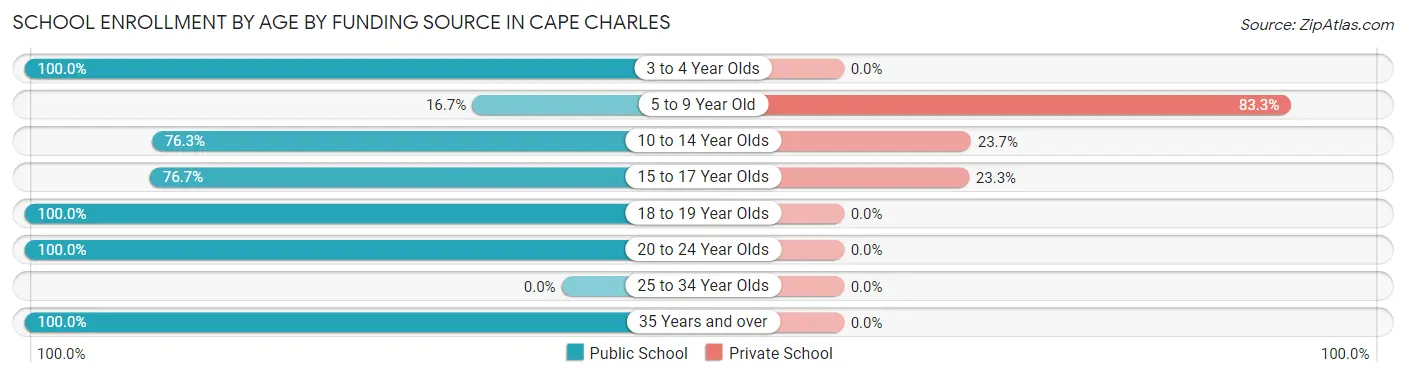
| Age Bracket | Public School | Private School |
| 3 to 4 Year Olds | 13 (100.0%) | 0 (0.0%) |
| 5 to 9 Year Old | 3 (16.7%) | 15 (83.3%) |
| 10 to 14 Year Olds | 58 (76.3%) | 18 (23.7%) |
| 15 to 17 Year Olds | 23 (76.7%) | 7 (23.3%) |
| 18 to 19 Year Olds | 21 (100.0%) | 0 (0.0%) |
| 20 to 24 Year Olds | 19 (100.0%) | 0 (0.0%) |
| 25 to 34 Year Olds | 0 (0.0%) | 0 (0.0%) |
| 35 Years and over | 14 (100.0%) | 0 (0.0%) |
| Total | 151 (79.1%) | 40 (20.9%) |
Educational Attainment by Field of Study in Cape Charles
Business (131 | 23.8%), education (67 | 12.2%), social sciences (59 | 10.7%), science & technology (58 | 10.5%), and bio, nature & agricultural (52 | 9.5%) are the most common fields of study among 550 individuals in Cape Charles who have obtained a bachelor's degree or higher.
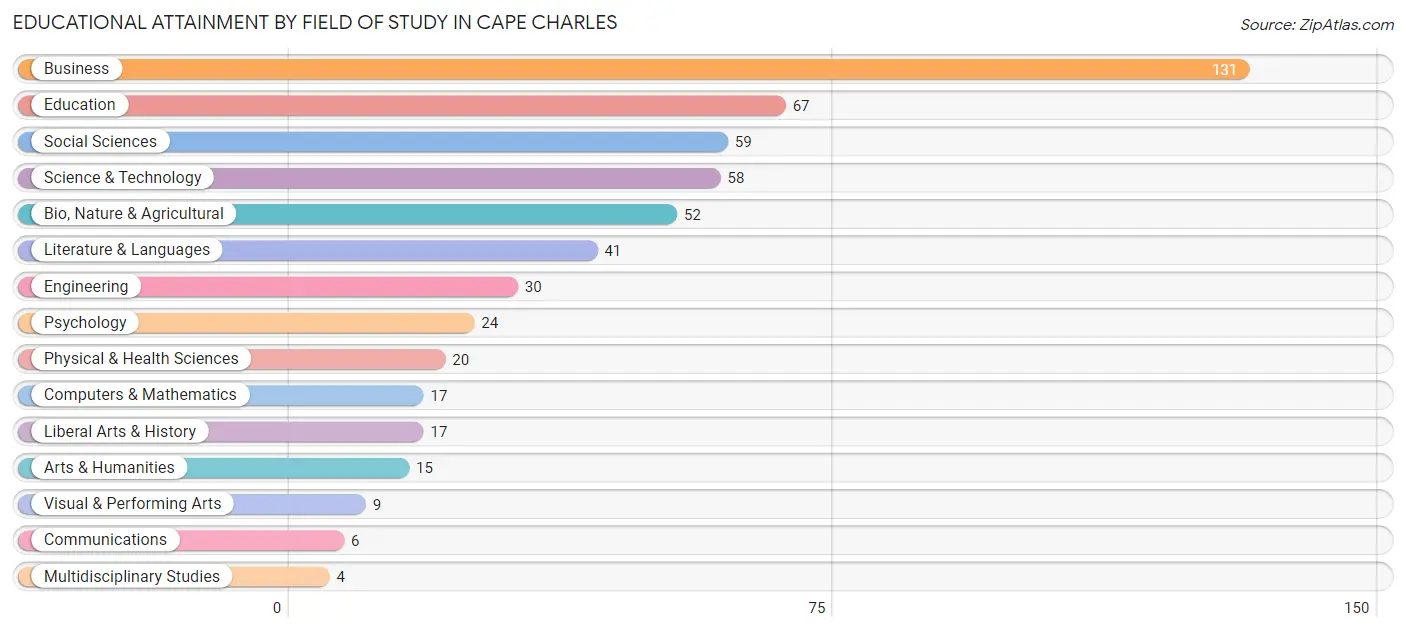
| Field of Study | # Graduates | % Graduates |
| Computers & Mathematics | 17 | 3.1% |
| Bio, Nature & Agricultural | 52 | 9.5% |
| Physical & Health Sciences | 20 | 3.6% |
| Psychology | 24 | 4.4% |
| Social Sciences | 59 | 10.7% |
| Engineering | 30 | 5.4% |
| Multidisciplinary Studies | 4 | 0.7% |
| Science & Technology | 58 | 10.5% |
| Business | 131 | 23.8% |
| Education | 67 | 12.2% |
| Literature & Languages | 41 | 7.4% |
| Liberal Arts & History | 17 | 3.1% |
| Visual & Performing Arts | 9 | 1.6% |
| Communications | 6 | 1.1% |
| Arts & Humanities | 15 | 2.7% |
| Total | 550 | 100.0% |
Transportation & Commute in Cape Charles
Vehicle Availability by Sex in Cape Charles
The most prevalent vehicle ownership categories in Cape Charles are males with 2 vehicles (166, accounting for 61.7%) and females with 2 vehicles (84, making up 75.8%).
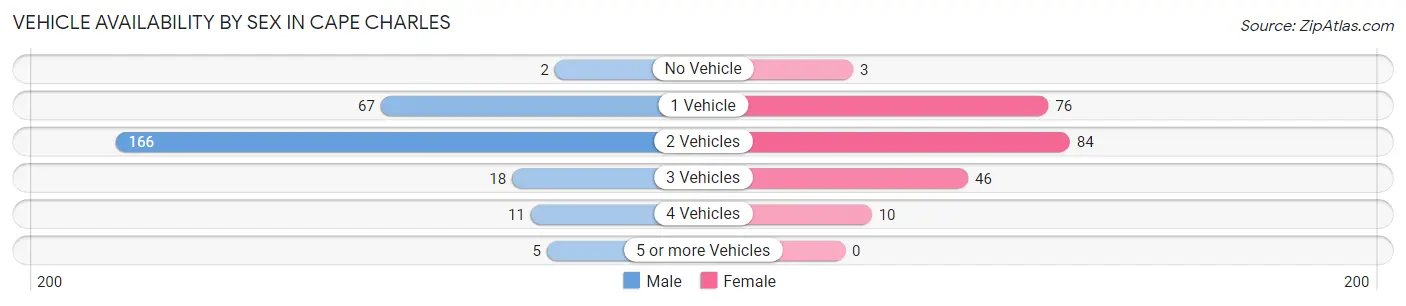
| Vehicles Available | Male | Female |
| No Vehicle | 2 (0.7%) | 3 (1.4%) |
| 1 Vehicle | 67 (24.9%) | 76 (34.7%) |
| 2 Vehicles | 166 (61.7%) | 84 (38.4%) |
| 3 Vehicles | 18 (6.7%) | 46 (21.0%) |
| 4 Vehicles | 11 (4.1%) | 10 (4.6%) |
| 5 or more Vehicles | 5 (1.9%) | 0 (0.0%) |
| Total | 269 (100.0%) | 219 (100.0%) |
Commute Time in Cape Charles
The most frequently occuring commute durations in Cape Charles are 5 to 9 minutes (161 commuters, 39.5%), less than 5 minutes (57 commuters, 14.0%), and 10 to 14 minutes (48 commuters, 11.8%).
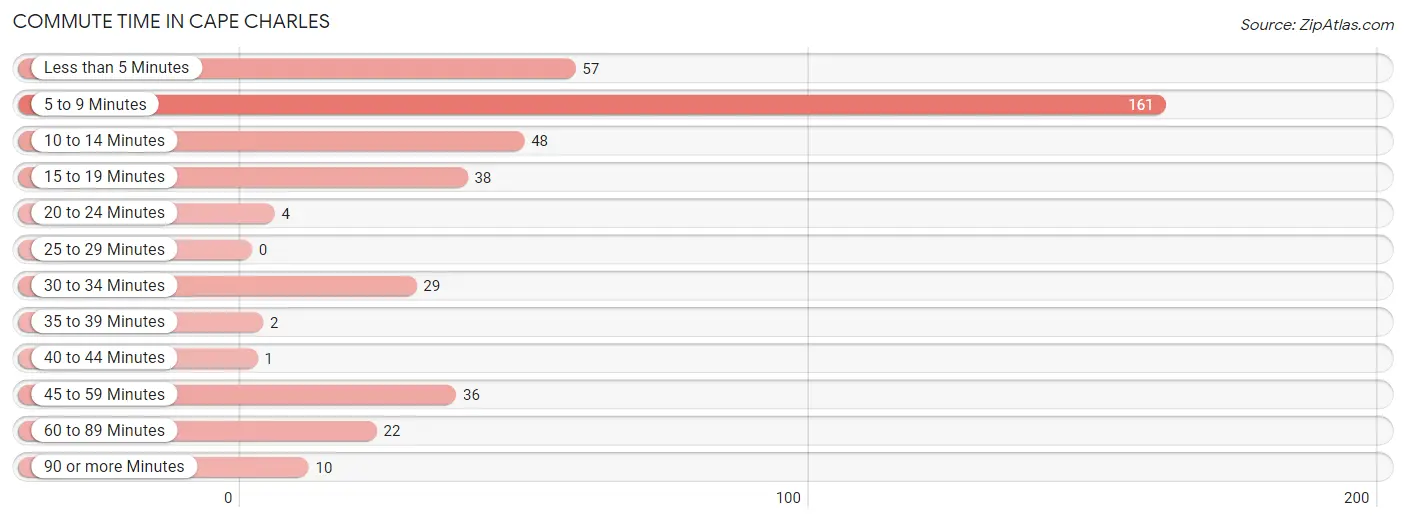
| Commute Time | # Commuters | % Commuters |
| Less than 5 Minutes | 57 | 14.0% |
| 5 to 9 Minutes | 161 | 39.5% |
| 10 to 14 Minutes | 48 | 11.8% |
| 15 to 19 Minutes | 38 | 9.3% |
| 20 to 24 Minutes | 4 | 1.0% |
| 25 to 29 Minutes | 0 | 0.0% |
| 30 to 34 Minutes | 29 | 7.1% |
| 35 to 39 Minutes | 2 | 0.5% |
| 40 to 44 Minutes | 1 | 0.3% |
| 45 to 59 Minutes | 36 | 8.8% |
| 60 to 89 Minutes | 22 | 5.4% |
| 90 or more Minutes | 10 | 2.5% |
Commute Time by Sex in Cape Charles
The most common commute times in Cape Charles are 5 to 9 minutes (74 commuters, 31.9%) for males and 5 to 9 minutes (87 commuters, 49.4%) for females.
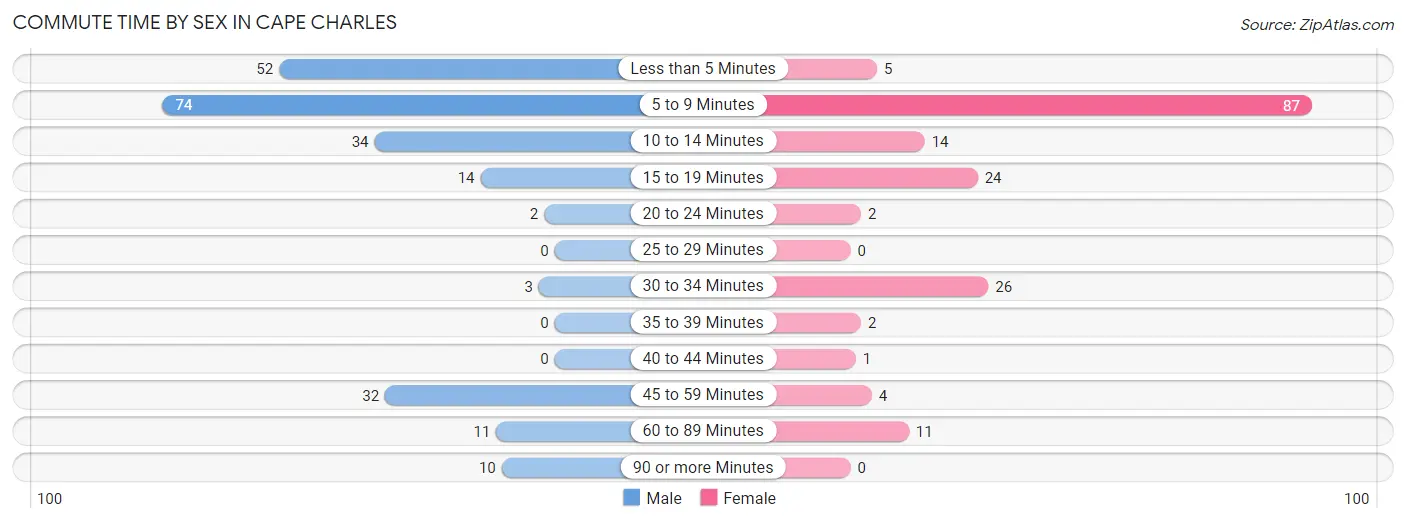
| Commute Time | Male | Female |
| Less than 5 Minutes | 52 (22.4%) | 5 (2.8%) |
| 5 to 9 Minutes | 74 (31.9%) | 87 (49.4%) |
| 10 to 14 Minutes | 34 (14.7%) | 14 (8.0%) |
| 15 to 19 Minutes | 14 (6.0%) | 24 (13.6%) |
| 20 to 24 Minutes | 2 (0.9%) | 2 (1.1%) |
| 25 to 29 Minutes | 0 (0.0%) | 0 (0.0%) |
| 30 to 34 Minutes | 3 (1.3%) | 26 (14.8%) |
| 35 to 39 Minutes | 0 (0.0%) | 2 (1.1%) |
| 40 to 44 Minutes | 0 (0.0%) | 1 (0.6%) |
| 45 to 59 Minutes | 32 (13.8%) | 4 (2.3%) |
| 60 to 89 Minutes | 11 (4.7%) | 11 (6.2%) |
| 90 or more Minutes | 10 (4.3%) | 0 (0.0%) |
Time of Departure to Work by Sex in Cape Charles
The most frequent times of departure to work in Cape Charles are 7:30 AM to 7:59 AM (75, 32.3%) for males and 8:00 AM to 8:29 AM (41, 23.3%) for females.
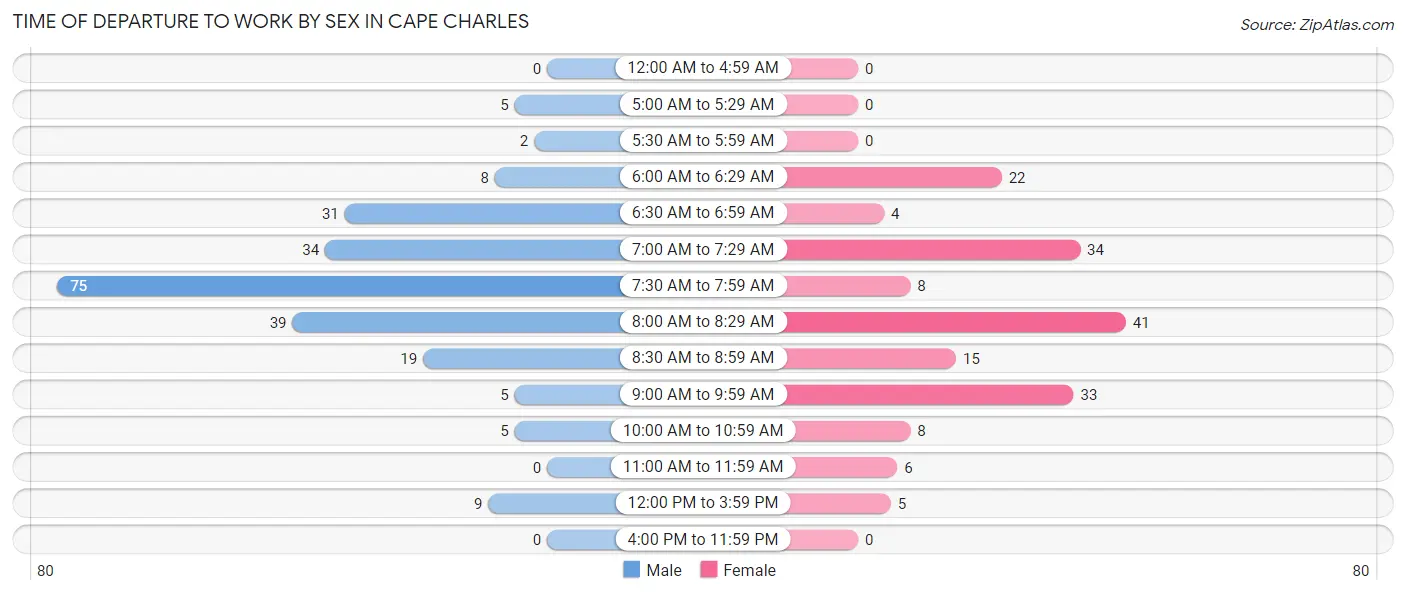
| Time of Departure | Male | Female |
| 12:00 AM to 4:59 AM | 0 (0.0%) | 0 (0.0%) |
| 5:00 AM to 5:29 AM | 5 (2.2%) | 0 (0.0%) |
| 5:30 AM to 5:59 AM | 2 (0.9%) | 0 (0.0%) |
| 6:00 AM to 6:29 AM | 8 (3.5%) | 22 (12.5%) |
| 6:30 AM to 6:59 AM | 31 (13.4%) | 4 (2.3%) |
| 7:00 AM to 7:29 AM | 34 (14.7%) | 34 (19.3%) |
| 7:30 AM to 7:59 AM | 75 (32.3%) | 8 (4.5%) |
| 8:00 AM to 8:29 AM | 39 (16.8%) | 41 (23.3%) |
| 8:30 AM to 8:59 AM | 19 (8.2%) | 15 (8.5%) |
| 9:00 AM to 9:59 AM | 5 (2.2%) | 33 (18.8%) |
| 10:00 AM to 10:59 AM | 5 (2.2%) | 8 (4.5%) |
| 11:00 AM to 11:59 AM | 0 (0.0%) | 6 (3.4%) |
| 12:00 PM to 3:59 PM | 9 (3.9%) | 5 (2.8%) |
| 4:00 PM to 11:59 PM | 0 (0.0%) | 0 (0.0%) |
| Total | 232 (100.0%) | 176 (100.0%) |
Housing Occupancy in Cape Charles
Occupancy by Ownership in Cape Charles
Of the total 653 dwellings in Cape Charles, owner-occupied units account for 373 (57.1%), while renter-occupied units make up 280 (42.9%).
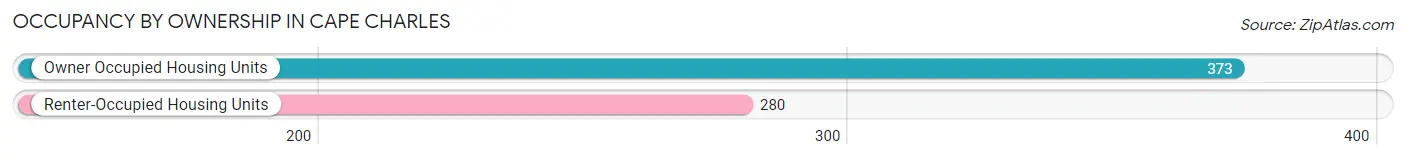
| Occupancy | # Housing Units | % Housing Units |
| Owner Occupied Housing Units | 373 | 57.1% |
| Renter-Occupied Housing Units | 280 | 42.9% |
| Total Occupied Housing Units | 653 | 100.0% |
Occupancy by Household Size in Cape Charles
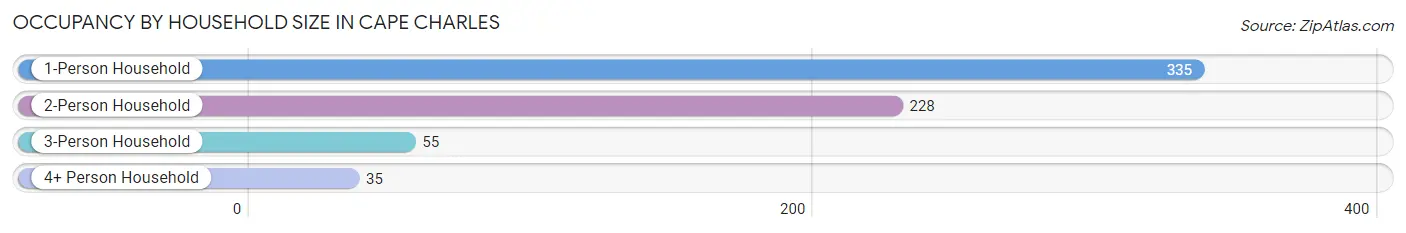
| Household Size | # Housing Units | % Housing Units |
| 1-Person Household | 335 | 51.3% |
| 2-Person Household | 228 | 34.9% |
| 3-Person Household | 55 | 8.4% |
| 4+ Person Household | 35 | 5.4% |
| Total Housing Units | 653 | 100.0% |
Occupancy by Ownership by Household Size in Cape Charles
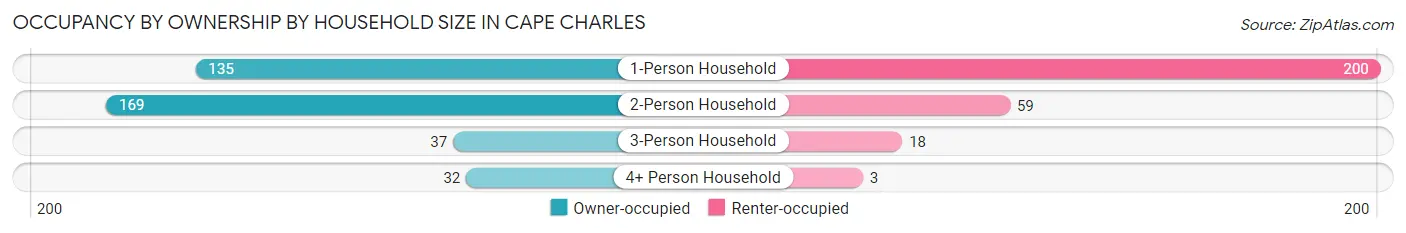
| Household Size | Owner-occupied | Renter-occupied |
| 1-Person Household | 135 (40.3%) | 200 (59.7%) |
| 2-Person Household | 169 (74.1%) | 59 (25.9%) |
| 3-Person Household | 37 (67.3%) | 18 (32.7%) |
| 4+ Person Household | 32 (91.4%) | 3 (8.6%) |
| Total Housing Units | 373 (57.1%) | 280 (42.9%) |
Occupancy by Educational Attainment in Cape Charles
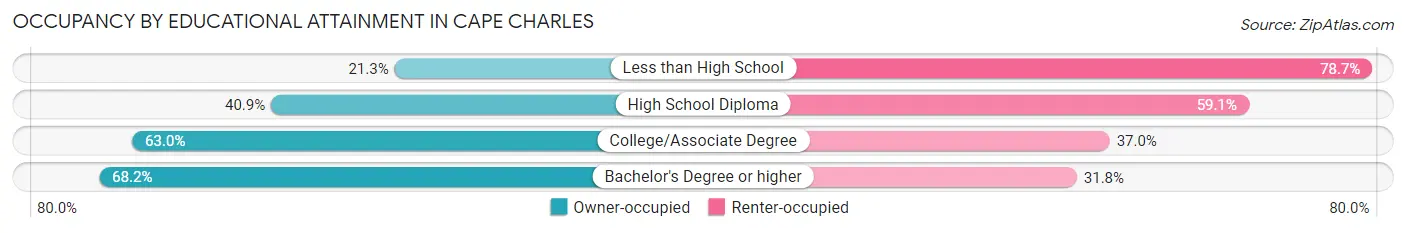
| Household Size | Owner-occupied | Renter-occupied |
| Less than High School | 16 (21.3%) | 59 (78.7%) |
| High School Diploma | 45 (40.9%) | 65 (59.1%) |
| College/Associate Degree | 85 (63.0%) | 50 (37.0%) |
| Bachelor's Degree or higher | 227 (68.2%) | 106 (31.8%) |
Occupancy by Age of Householder in Cape Charles
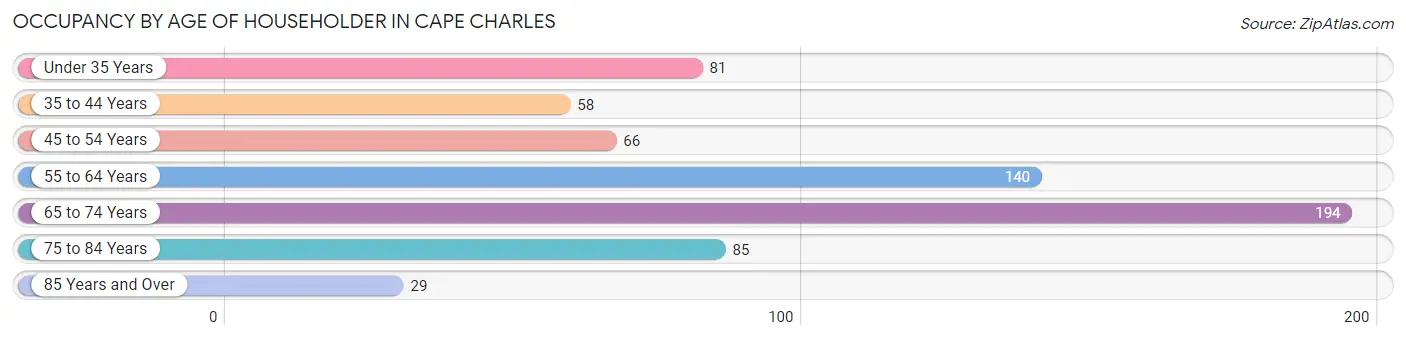
| Age Bracket | # Households | % Households |
| Under 35 Years | 81 | 12.4% |
| 35 to 44 Years | 58 | 8.9% |
| 45 to 54 Years | 66 | 10.1% |
| 55 to 64 Years | 140 | 21.4% |
| 65 to 74 Years | 194 | 29.7% |
| 75 to 84 Years | 85 | 13.0% |
| 85 Years and Over | 29 | 4.4% |
| Total | 653 | 100.0% |
Housing Finances in Cape Charles
Median Income by Occupancy in Cape Charles
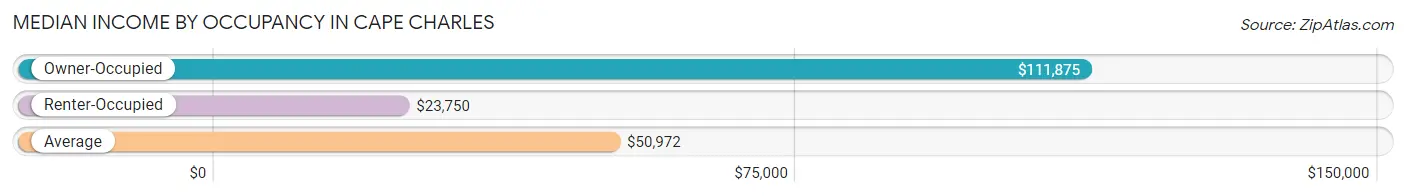
| Occupancy Type | # Households | Median Income |
| Owner-Occupied | 373 (57.1%) | $111,875 |
| Renter-Occupied | 280 (42.9%) | $23,750 |
| Average | 653 (100.0%) | $50,972 |
Occupancy by Householder Income Bracket in Cape Charles
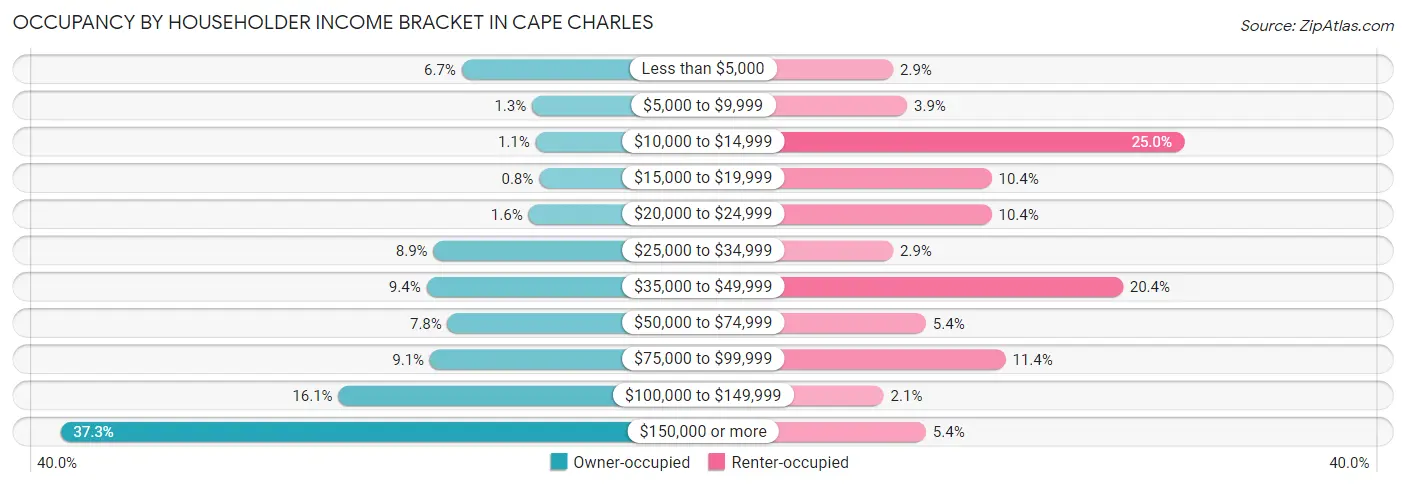
| Income Bracket | Owner-occupied | Renter-occupied |
| Less than $5,000 | 25 (6.7%) | 8 (2.9%) |
| $5,000 to $9,999 | 5 (1.3%) | 11 (3.9%) |
| $10,000 to $14,999 | 4 (1.1%) | 70 (25.0%) |
| $15,000 to $19,999 | 3 (0.8%) | 29 (10.4%) |
| $20,000 to $24,999 | 6 (1.6%) | 29 (10.4%) |
| $25,000 to $34,999 | 33 (8.8%) | 8 (2.9%) |
| $35,000 to $49,999 | 35 (9.4%) | 57 (20.4%) |
| $50,000 to $74,999 | 29 (7.8%) | 15 (5.4%) |
| $75,000 to $99,999 | 34 (9.1%) | 32 (11.4%) |
| $100,000 to $149,999 | 60 (16.1%) | 6 (2.1%) |
| $150,000 or more | 139 (37.3%) | 15 (5.4%) |
| Total | 373 (100.0%) | 280 (100.0%) |
Monthly Housing Cost Tiers in Cape Charles
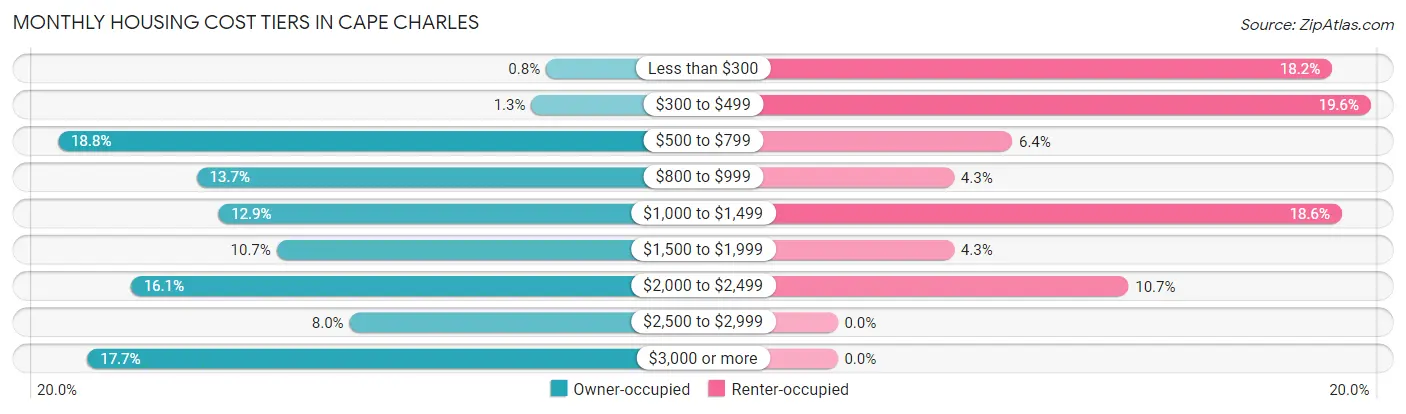
| Monthly Cost | Owner-occupied | Renter-occupied |
| Less than $300 | 3 (0.8%) | 51 (18.2%) |
| $300 to $499 | 5 (1.3%) | 55 (19.6%) |
| $500 to $799 | 70 (18.8%) | 18 (6.4%) |
| $800 to $999 | 51 (13.7%) | 12 (4.3%) |
| $1,000 to $1,499 | 48 (12.9%) | 52 (18.6%) |
| $1,500 to $1,999 | 40 (10.7%) | 12 (4.3%) |
| $2,000 to $2,499 | 60 (16.1%) | 30 (10.7%) |
| $2,500 to $2,999 | 30 (8.0%) | 0 (0.0%) |
| $3,000 or more | 66 (17.7%) | 0 (0.0%) |
| Total | 373 (100.0%) | 280 (100.0%) |
Physical Housing Characteristics in Cape Charles
Housing Structures in Cape Charles
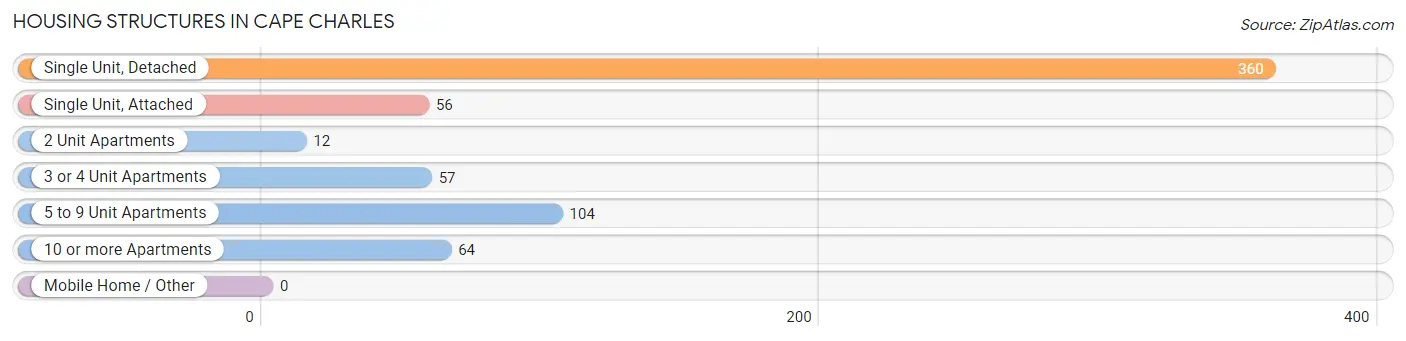
| Structure Type | # Housing Units | % Housing Units |
| Single Unit, Detached | 360 | 55.1% |
| Single Unit, Attached | 56 | 8.6% |
| 2 Unit Apartments | 12 | 1.8% |
| 3 or 4 Unit Apartments | 57 | 8.7% |
| 5 to 9 Unit Apartments | 104 | 15.9% |
| 10 or more Apartments | 64 | 9.8% |
| Mobile Home / Other | 0 | 0.0% |
| Total | 653 | 100.0% |
Housing Structures by Occupancy in Cape Charles
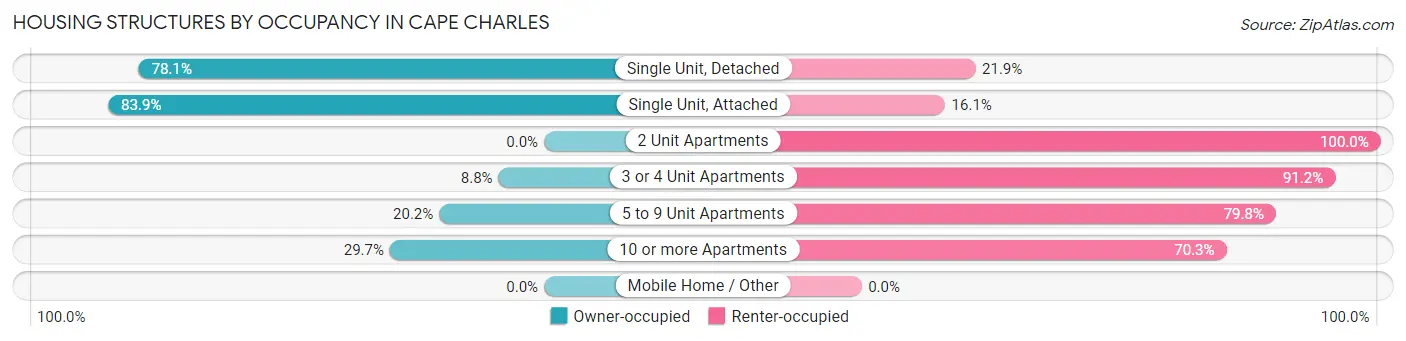
| Structure Type | Owner-occupied | Renter-occupied |
| Single Unit, Detached | 281 (78.1%) | 79 (21.9%) |
| Single Unit, Attached | 47 (83.9%) | 9 (16.1%) |
| 2 Unit Apartments | 0 (0.0%) | 12 (100.0%) |
| 3 or 4 Unit Apartments | 5 (8.8%) | 52 (91.2%) |
| 5 to 9 Unit Apartments | 21 (20.2%) | 83 (79.8%) |
| 10 or more Apartments | 19 (29.7%) | 45 (70.3%) |
| Mobile Home / Other | 0 (0.0%) | 0 (0.0%) |
| Total | 373 (57.1%) | 280 (42.9%) |
Housing Structures by Number of Rooms in Cape Charles
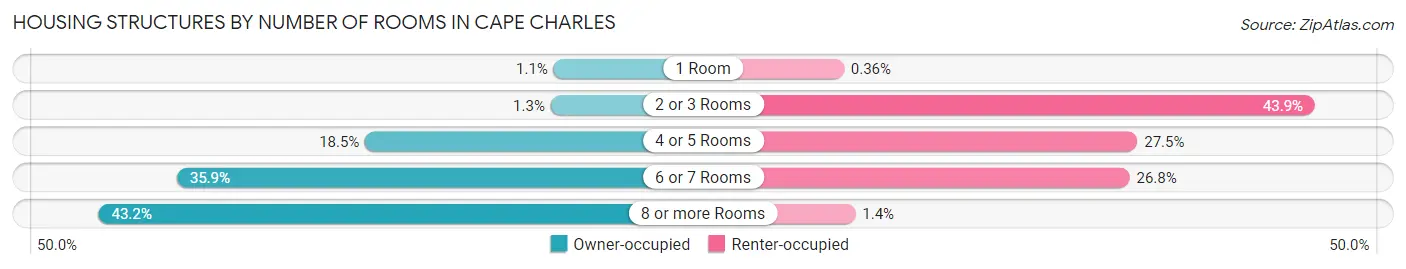
| Number of Rooms | Owner-occupied | Renter-occupied |
| 1 Room | 4 (1.1%) | 1 (0.4%) |
| 2 or 3 Rooms | 5 (1.3%) | 123 (43.9%) |
| 4 or 5 Rooms | 69 (18.5%) | 77 (27.5%) |
| 6 or 7 Rooms | 134 (35.9%) | 75 (26.8%) |
| 8 or more Rooms | 161 (43.2%) | 4 (1.4%) |
| Total | 373 (100.0%) | 280 (100.0%) |
Housing Structure by Heating Type in Cape Charles
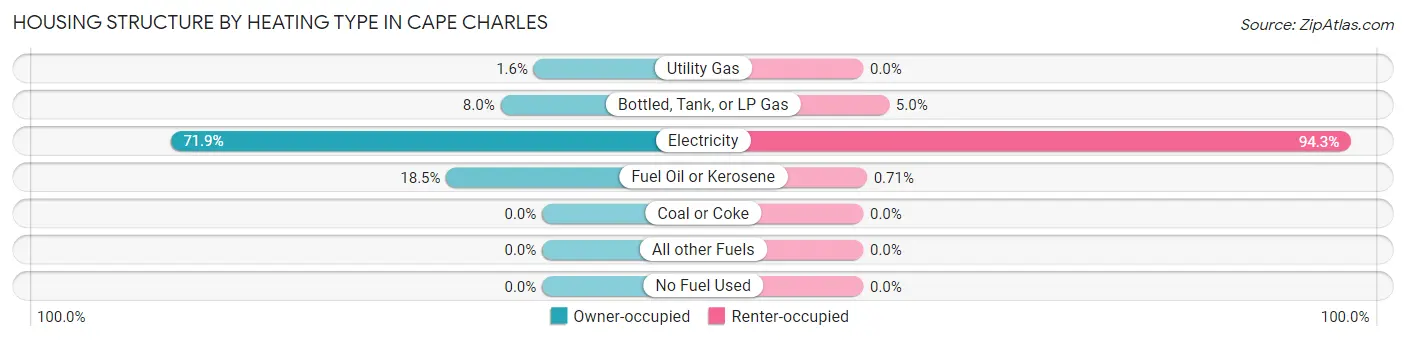
| Heating Type | Owner-occupied | Renter-occupied |
| Utility Gas | 6 (1.6%) | 0 (0.0%) |
| Bottled, Tank, or LP Gas | 30 (8.0%) | 14 (5.0%) |
| Electricity | 268 (71.9%) | 264 (94.3%) |
| Fuel Oil or Kerosene | 69 (18.5%) | 2 (0.7%) |
| Coal or Coke | 0 (0.0%) | 0 (0.0%) |
| All other Fuels | 0 (0.0%) | 0 (0.0%) |
| No Fuel Used | 0 (0.0%) | 0 (0.0%) |
| Total | 373 (100.0%) | 280 (100.0%) |
Household Vehicle Usage in Cape Charles
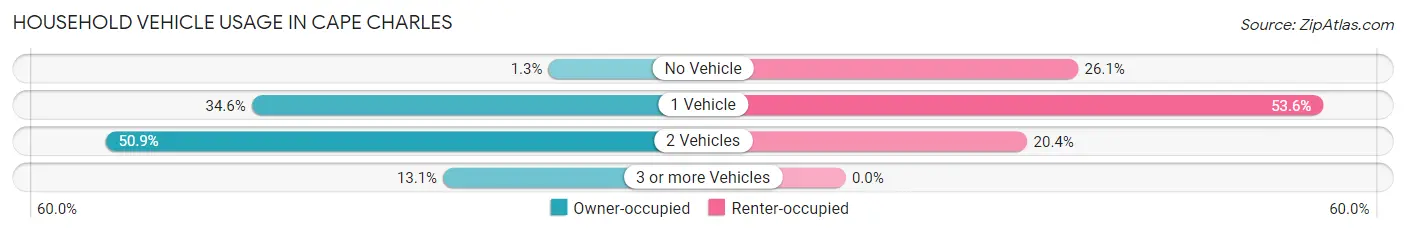
| Vehicles per Household | Owner-occupied | Renter-occupied |
| No Vehicle | 5 (1.3%) | 73 (26.1%) |
| 1 Vehicle | 129 (34.6%) | 150 (53.6%) |
| 2 Vehicles | 190 (50.9%) | 57 (20.4%) |
| 3 or more Vehicles | 49 (13.1%) | 0 (0.0%) |
| Total | 373 (100.0%) | 280 (100.0%) |
Real Estate & Mortgages in Cape Charles
Real Estate and Mortgage Overview in Cape Charles
| Characteristic | Without Mortgage | With Mortgage |
| Housing Units | 136 | 237 |
| Median Property Value | $480,000 | $574,600 |
| Median Household Income | $77,857 | $103 |
| Monthly Housing Costs | $774 | $66 |
| Real Estate Taxes | $3,359 | $3 |
Property Value by Mortgage Status in Cape Charles
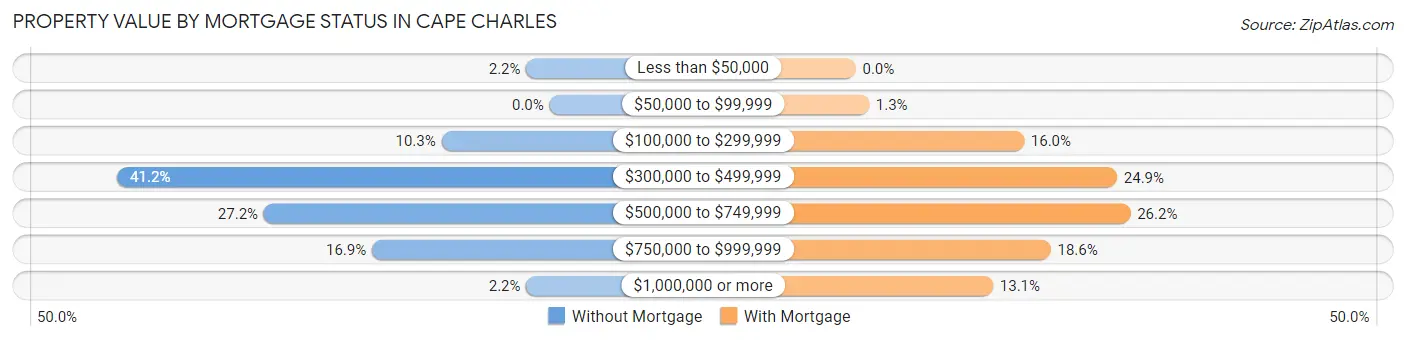
| Property Value | Without Mortgage | With Mortgage |
| Less than $50,000 | 3 (2.2%) | 0 (0.0%) |
| $50,000 to $99,999 | 0 (0.0%) | 3 (1.3%) |
| $100,000 to $299,999 | 14 (10.3%) | 38 (16.0%) |
| $300,000 to $499,999 | 56 (41.2%) | 59 (24.9%) |
| $500,000 to $749,999 | 37 (27.2%) | 62 (26.2%) |
| $750,000 to $999,999 | 23 (16.9%) | 44 (18.6%) |
| $1,000,000 or more | 3 (2.2%) | 31 (13.1%) |
| Total | 136 (100.0%) | 237 (100.0%) |
Household Income by Mortgage Status in Cape Charles
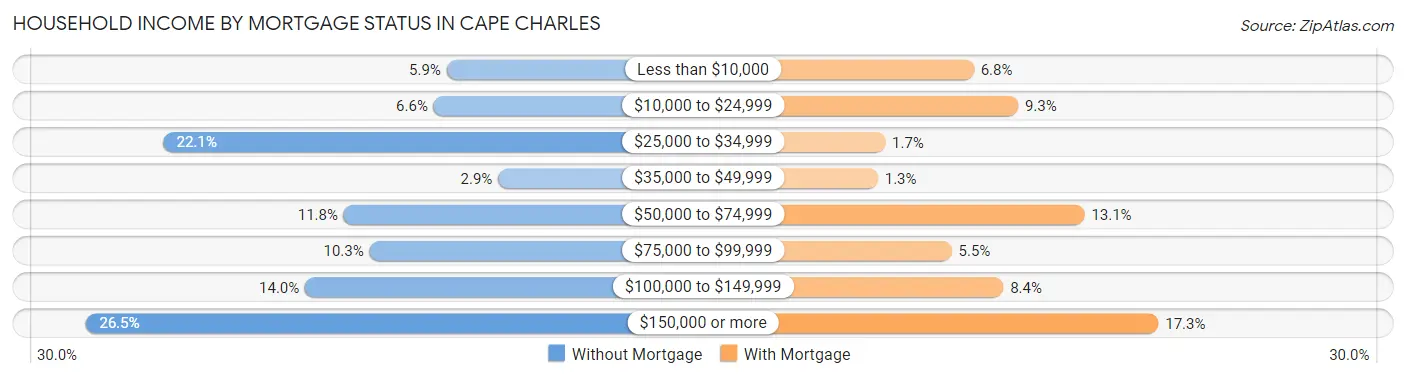
| Household Income | Without Mortgage | With Mortgage |
| Less than $10,000 | 8 (5.9%) | 16 (6.8%) |
| $10,000 to $24,999 | 9 (6.6%) | 22 (9.3%) |
| $25,000 to $34,999 | 30 (22.1%) | 4 (1.7%) |
| $35,000 to $49,999 | 4 (2.9%) | 3 (1.3%) |
| $50,000 to $74,999 | 16 (11.8%) | 31 (13.1%) |
| $75,000 to $99,999 | 14 (10.3%) | 13 (5.5%) |
| $100,000 to $149,999 | 19 (14.0%) | 20 (8.4%) |
| $150,000 or more | 36 (26.5%) | 41 (17.3%) |
| Total | 136 (100.0%) | 237 (100.0%) |
Property Value to Household Income Ratio in Cape Charles
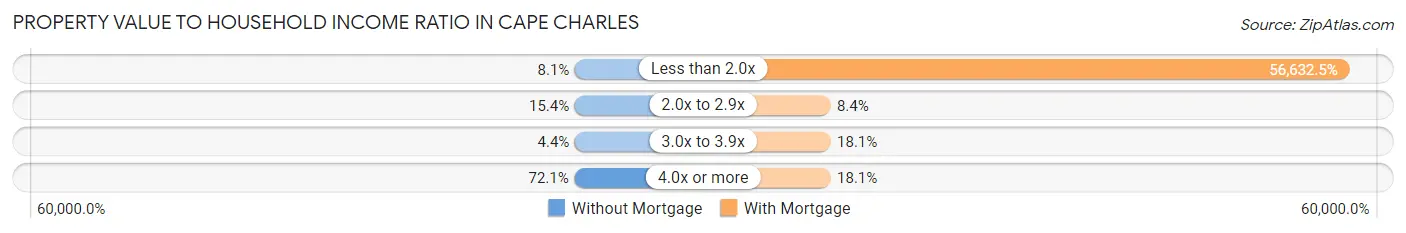
| Value-to-Income Ratio | Without Mortgage | With Mortgage |
| Less than 2.0x | 11 (8.1%) | 134,219 (56,632.5%) |
| 2.0x to 2.9x | 21 (15.4%) | 20 (8.4%) |
| 3.0x to 3.9x | 6 (4.4%) | 43 (18.1%) |
| 4.0x or more | 98 (72.1%) | 43 (18.1%) |
| Total | 136 (100.0%) | 237 (100.0%) |
Real Estate Taxes by Mortgage Status in Cape Charles
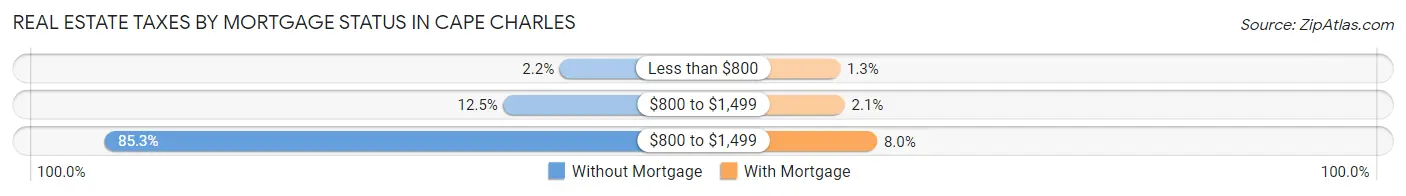
| Property Taxes | Without Mortgage | With Mortgage |
| Less than $800 | 3 (2.2%) | 3 (1.3%) |
| $800 to $1,499 | 17 (12.5%) | 5 (2.1%) |
| $800 to $1,499 | 116 (85.3%) | 19 (8.0%) |
| Total | 136 (100.0%) | 237 (100.0%) |
Health & Disability in Cape Charles
Health Insurance Coverage by Age in Cape Charles
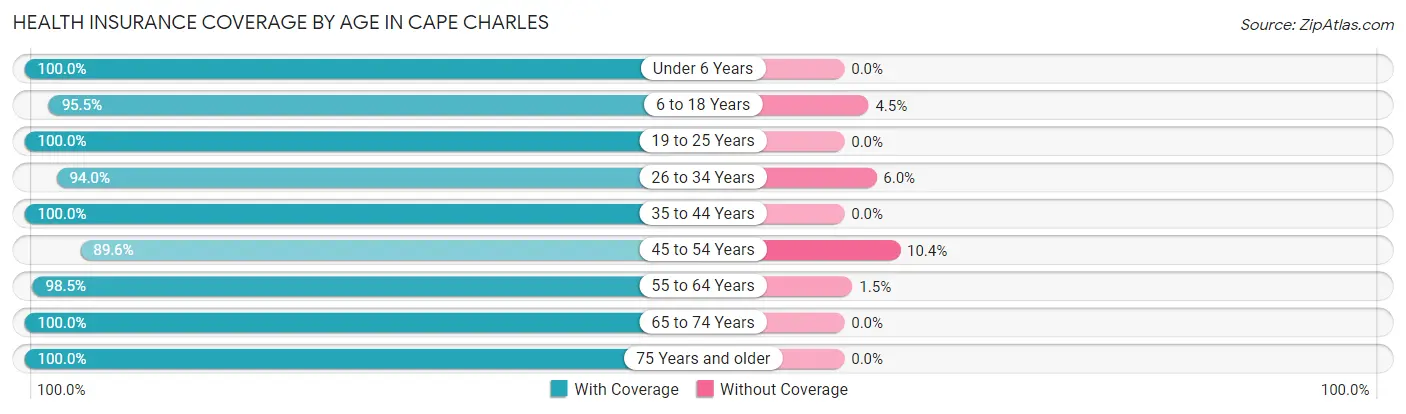
| Age Bracket | With Coverage | Without Coverage |
| Under 6 Years | 22 (100.0%) | 0 (0.0%) |
| 6 to 18 Years | 127 (95.5%) | 6 (4.5%) |
| 19 to 25 Years | 75 (100.0%) | 0 (0.0%) |
| 26 to 34 Years | 63 (94.0%) | 4 (6.0%) |
| 35 to 44 Years | 84 (100.0%) | 0 (0.0%) |
| 45 to 54 Years | 112 (89.6%) | 13 (10.4%) |
| 55 to 64 Years | 196 (98.5%) | 3 (1.5%) |
| 65 to 74 Years | 291 (100.0%) | 0 (0.0%) |
| 75 Years and older | 150 (100.0%) | 0 (0.0%) |
| Total | 1,120 (97.7%) | 26 (2.3%) |
Health Insurance Coverage by Citizenship Status in Cape Charles
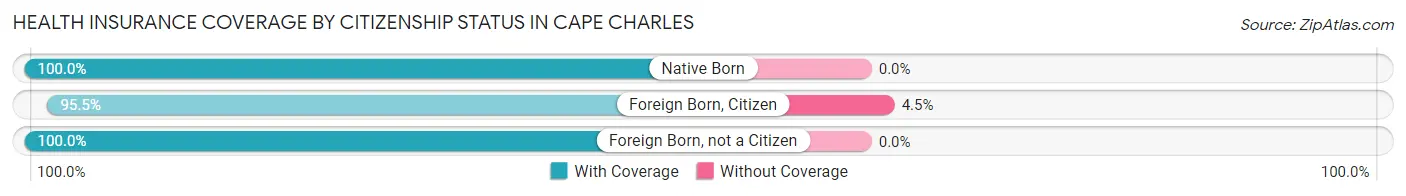
| Citizenship Status | With Coverage | Without Coverage |
| Native Born | 22 (100.0%) | 0 (0.0%) |
| Foreign Born, Citizen | 127 (95.5%) | 6 (4.5%) |
| Foreign Born, not a Citizen | 75 (100.0%) | 0 (0.0%) |
Health Insurance Coverage by Household Income in Cape Charles
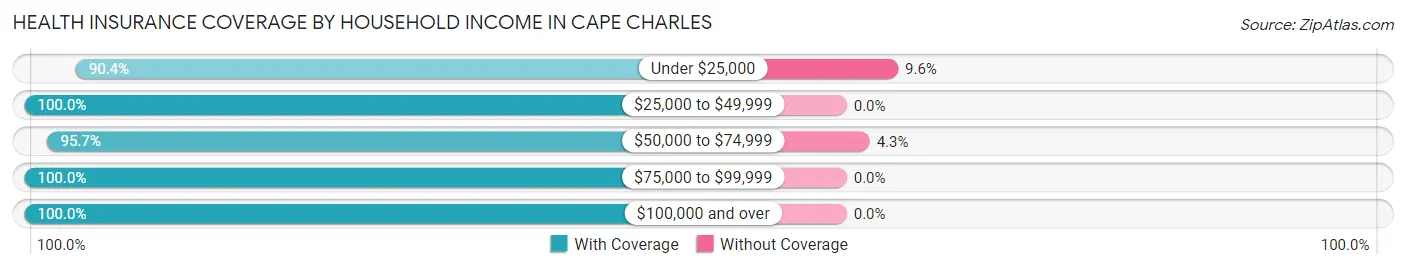
| Household Income | With Coverage | Without Coverage |
| Under $25,000 | 207 (90.4%) | 22 (9.6%) |
| $25,000 to $49,999 | 225 (100.0%) | 0 (0.0%) |
| $50,000 to $74,999 | 89 (95.7%) | 4 (4.3%) |
| $75,000 to $99,999 | 69 (100.0%) | 0 (0.0%) |
| $100,000 and over | 530 (100.0%) | 0 (0.0%) |
Public vs Private Health Insurance Coverage by Age in Cape Charles
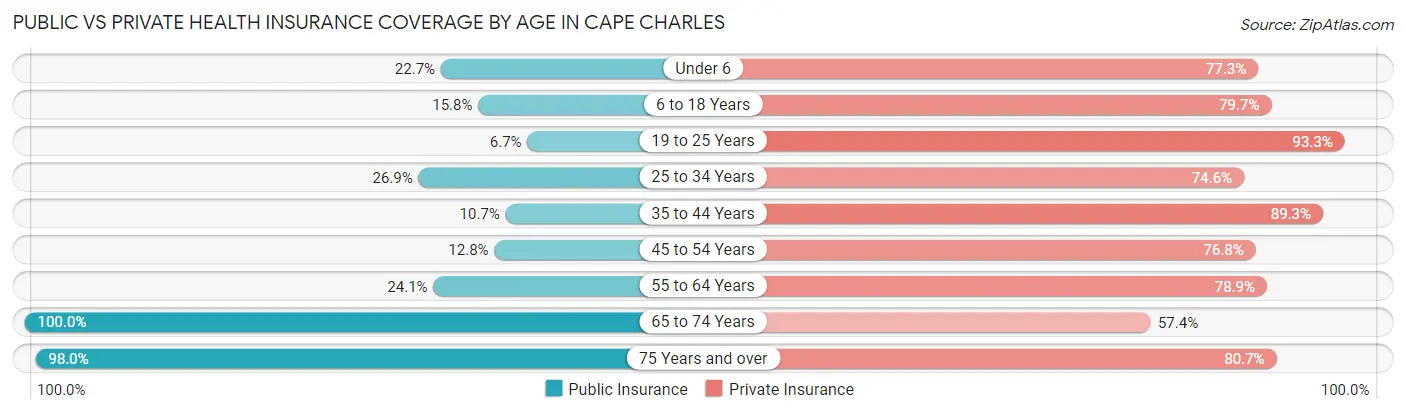
| Age Bracket | Public Insurance | Private Insurance |
| Under 6 | 5 (22.7%) | 17 (77.3%) |
| 6 to 18 Years | 21 (15.8%) | 106 (79.7%) |
| 19 to 25 Years | 5 (6.7%) | 70 (93.3%) |
| 25 to 34 Years | 18 (26.9%) | 50 (74.6%) |
| 35 to 44 Years | 9 (10.7%) | 75 (89.3%) |
| 45 to 54 Years | 16 (12.8%) | 96 (76.8%) |
| 55 to 64 Years | 48 (24.1%) | 157 (78.9%) |
| 65 to 74 Years | 291 (100.0%) | 167 (57.4%) |
| 75 Years and over | 147 (98.0%) | 121 (80.7%) |
| Total | 560 (48.9%) | 859 (75.0%) |
Disability Status by Sex by Age in Cape Charles
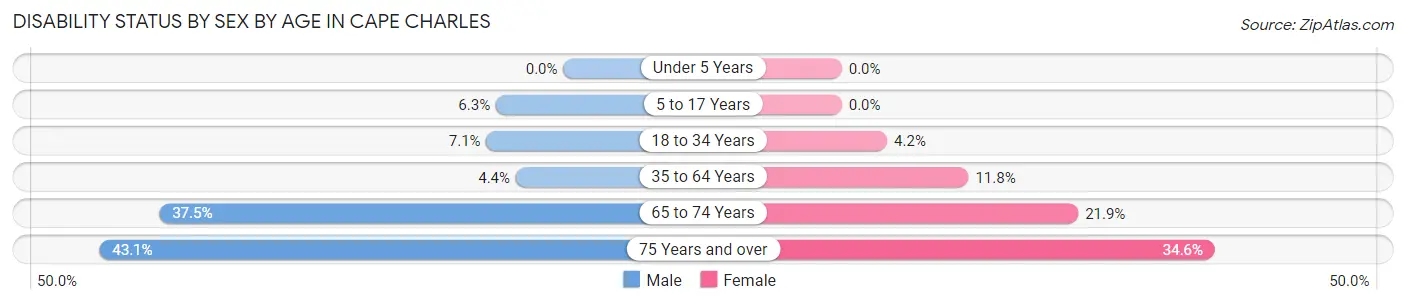
| Age Bracket | Male | Female |
| Under 5 Years | 0 (0.0%) | 0 (0.0%) |
| 5 to 17 Years | 3 (6.2%) | 0 (0.0%) |
| 18 to 34 Years | 4 (7.1%) | 4 (4.2%) |
| 35 to 64 Years | 9 (4.4%) | 24 (11.8%) |
| 65 to 74 Years | 51 (37.5%) | 34 (21.9%) |
| 75 Years and over | 31 (43.1%) | 27 (34.6%) |
Disability Class by Sex by Age in Cape Charles
Disability Class: Hearing Difficulty
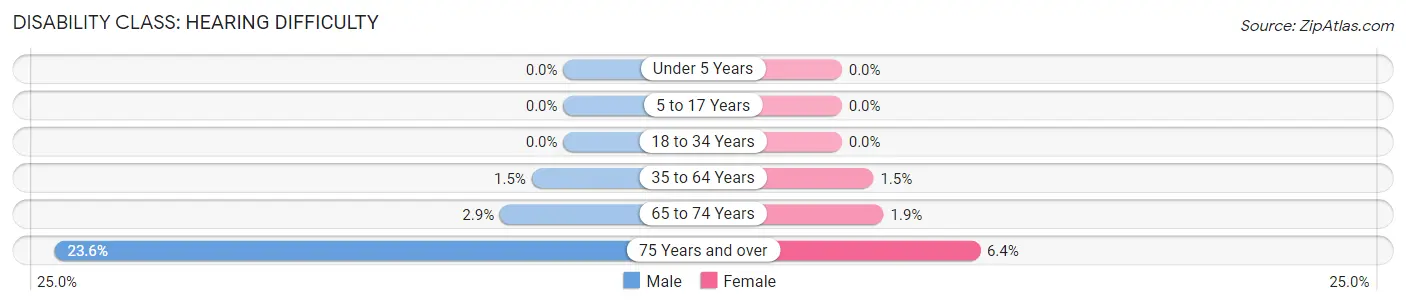
| Age Bracket | Male | Female |
| Under 5 Years | 0 (0.0%) | 0 (0.0%) |
| 5 to 17 Years | 0 (0.0%) | 0 (0.0%) |
| 18 to 34 Years | 0 (0.0%) | 0 (0.0%) |
| 35 to 64 Years | 3 (1.5%) | 3 (1.5%) |
| 65 to 74 Years | 4 (2.9%) | 3 (1.9%) |
| 75 Years and over | 17 (23.6%) | 5 (6.4%) |
Disability Class: Vision Difficulty
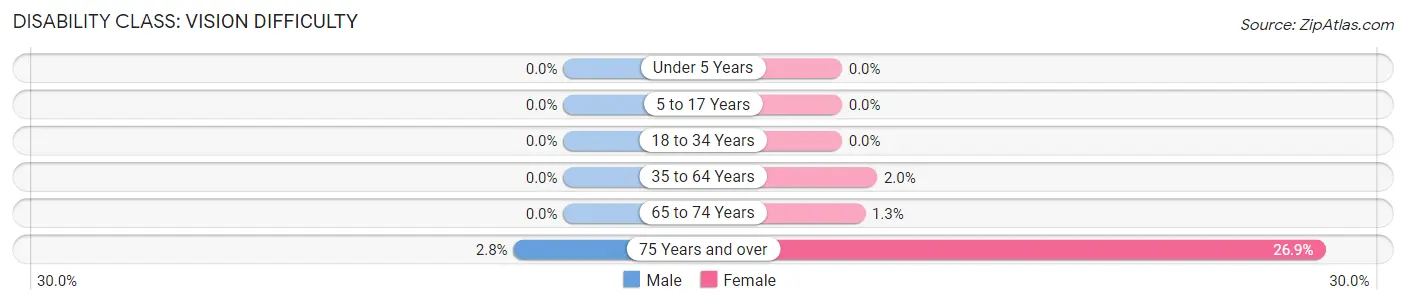
| Age Bracket | Male | Female |
| Under 5 Years | 0 (0.0%) | 0 (0.0%) |
| 5 to 17 Years | 0 (0.0%) | 0 (0.0%) |
| 18 to 34 Years | 0 (0.0%) | 0 (0.0%) |
| 35 to 64 Years | 0 (0.0%) | 4 (2.0%) |
| 65 to 74 Years | 0 (0.0%) | 2 (1.3%) |
| 75 Years and over | 2 (2.8%) | 21 (26.9%) |
Disability Class: Cognitive Difficulty
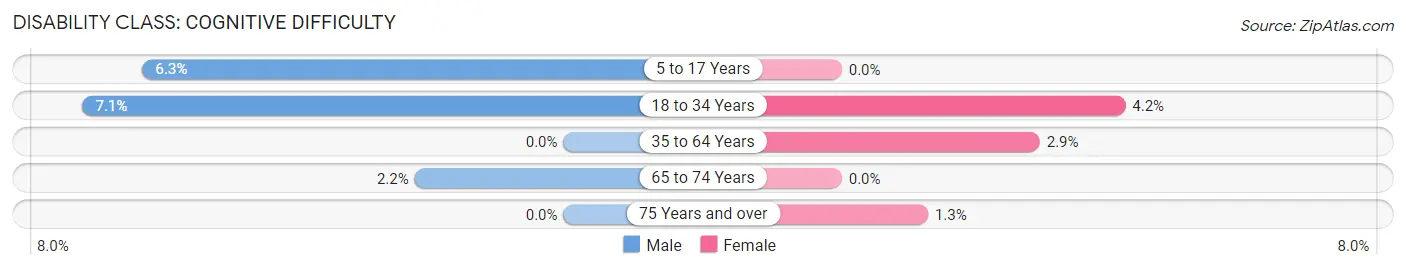
| Age Bracket | Male | Female |
| 5 to 17 Years | 3 (6.2%) | 0 (0.0%) |
| 18 to 34 Years | 4 (7.1%) | 4 (4.2%) |
| 35 to 64 Years | 0 (0.0%) | 6 (2.9%) |
| 65 to 74 Years | 3 (2.2%) | 0 (0.0%) |
| 75 Years and over | 0 (0.0%) | 1 (1.3%) |
Disability Class: Ambulatory Difficulty
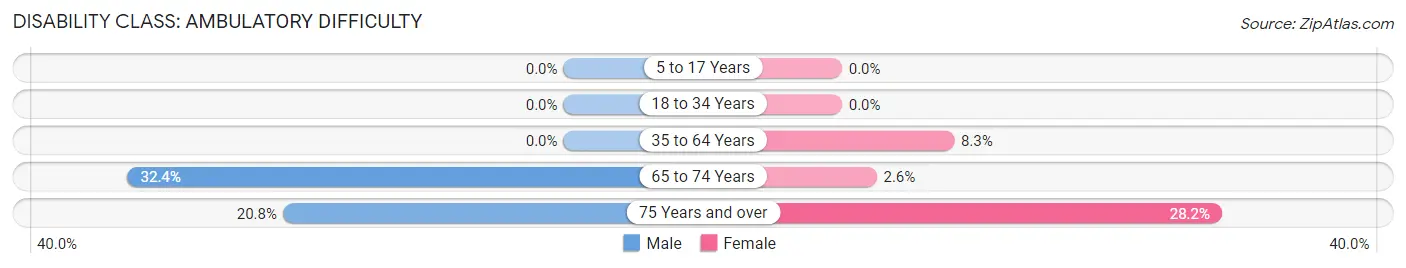
| Age Bracket | Male | Female |
| 5 to 17 Years | 0 (0.0%) | 0 (0.0%) |
| 18 to 34 Years | 0 (0.0%) | 0 (0.0%) |
| 35 to 64 Years | 0 (0.0%) | 17 (8.3%) |
| 65 to 74 Years | 44 (32.4%) | 4 (2.6%) |
| 75 Years and over | 15 (20.8%) | 22 (28.2%) |
Disability Class: Self-Care Difficulty
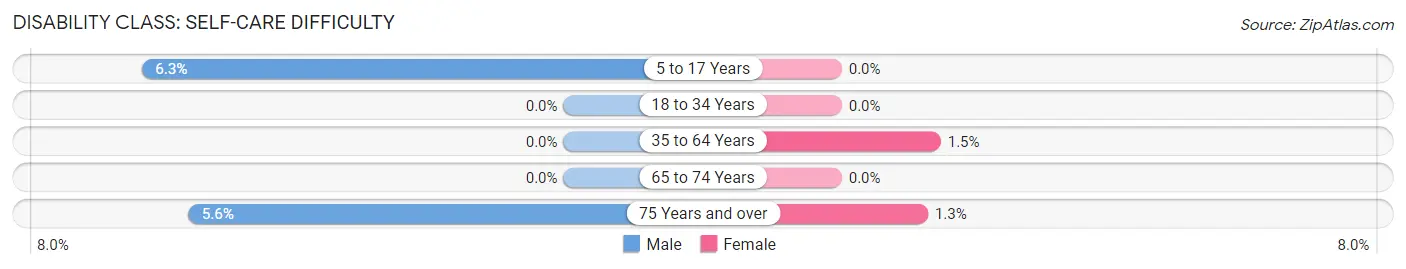
| Age Bracket | Male | Female |
| 5 to 17 Years | 3 (6.2%) | 0 (0.0%) |
| 18 to 34 Years | 0 (0.0%) | 0 (0.0%) |
| 35 to 64 Years | 0 (0.0%) | 3 (1.5%) |
| 65 to 74 Years | 0 (0.0%) | 0 (0.0%) |
| 75 Years and over | 4 (5.6%) | 1 (1.3%) |
Technology Access in Cape Charles
Computing Device Access in Cape Charles
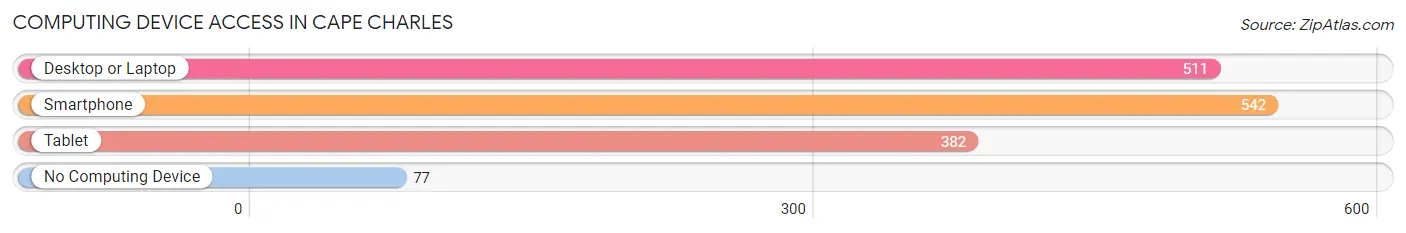
| Device Type | # Households | % Households |
| Desktop or Laptop | 511 | 78.2% |
| Smartphone | 542 | 83.0% |
| Tablet | 382 | 58.5% |
| No Computing Device | 77 | 11.8% |
| Total | 653 | 100.0% |
Internet Access in Cape Charles
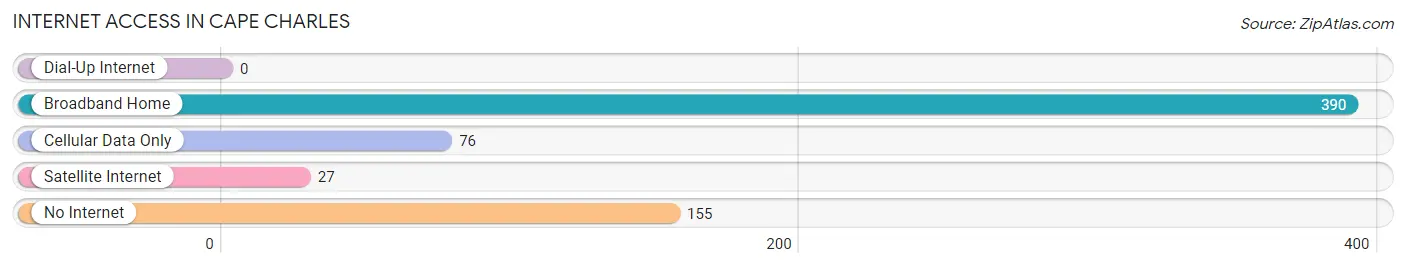
| Internet Type | # Households | % Households |
| Dial-Up Internet | 0 | 0.0% |
| Broadband Home | 390 | 59.7% |
| Cellular Data Only | 76 | 11.6% |
| Satellite Internet | 27 | 4.1% |
| No Internet | 155 | 23.7% |
| Total | 653 | 100.0% |
Cape Charles Summary
Cape Charles is a town located in Northampton County, Virginia, United States. It is situated on the Eastern Shore of the Chesapeake Bay, and is the county seat of Northampton County. The population was 1,009 at the 2010 census.
Geography
Cape Charles is located at 37°17′N 75°59′W (37.28, -75.98). According to the United States Census Bureau, the town has a total area of 0.7 square miles (1.8 km2), all of it land.
History
Cape Charles was founded in 1884 as a port town on the Chesapeake Bay. The town was named after Charles II of England, who was the first English monarch to grant a charter to the Virginia Company of London in 1609. The town was incorporated in 1888.
In the early 20th century, Cape Charles was a popular resort town, with many wealthy families from the Washington, D.C. area building summer homes there. The town was also a major shipping port for the Chesapeake Bay region.
In the 1950s, the Chesapeake Bay Bridge-Tunnel was built, connecting the Eastern Shore of Virginia to the mainland. This caused a decline in the town's economy, as many of the wealthy families moved away and the shipping industry declined.
Economy
Cape Charles is a small town with a limited economy. The town's main industries are tourism, fishing, and agriculture. The town is home to several small businesses, including restaurants, shops, and a marina.
The town is also home to the Cape Charles Yacht Center, which is a popular destination for sailing and fishing. The town also hosts several festivals throughout the year, including the Cape Charles Seafood Festival and the Cape Charles Arts and Crafts Festival.
Demographics
As of the census of 2010, there were 1,009 people, 441 households, and 259 families residing in the town. The population density was 1,427.1 people per square mile (550.7/km2). There were 486 housing units at an average density of 686.7 per square mile (265.2/km2). The racial makeup of the town was 79.2% White, 17.2% African American, 0.3% Native American, 0.7% Asian, 0.1% Pacific Islander, 0.7% from other races, and 1.9% from two or more races. Hispanic or Latino of any race were 2.2% of the population.
There were 441 households, out of which 24.3% had children under the age of 18 living with them, 41.2% were married couples living together, 14.3% had a female householder with no husband present, and 40.1% were non-families. 33.2% of all households were made up of individuals, and 14.3% had someone living alone who was 65 years of age or older. The average household size was 2.27 and the average family size was 2.88.
In the town, the population was spread out, with 21.2% under the age of 18, 6.7% from 18 to 24, 24.2% from 25 to 44, 28.2% from 45 to 64, and 19.7% who were 65 years of age or older. The median age was 43 years. For every 100 females, there were 87.2 males. For every 100 females age 18 and over, there were 83.3 males.
The median income for a household in the town was $35,000, and the median income for a family was $45,000. Males had a median income of $31,250 versus $25,000 for females. The per capita income for the town was $20,845. About 8.3% of families and 11.2% of the population were below the poverty line, including 16.7% of those under age 18 and 8.3% of those age 65 or over.
Common Questions
What is Per Capita Income in Cape Charles?
Per Capita income in Cape Charles is $61,031.
What is the Median Family Income in Cape Charles?
Median Family Income in Cape Charles is $139,688.
What is the Median Household income in Cape Charles?
Median Household Income in Cape Charles is $50,972.
What is Income or Wage Gap in Cape Charles?
Income or Wage Gap in Cape Charles is 61.7%.
Women in Cape Charles earn 38.3 cents for every dollar earned by a man.
What is Inequality or Gini Index in Cape Charles?
Inequality or Gini Index in Cape Charles is 0.57.
What is the Total Population of Cape Charles?
Total Population of Cape Charles is 1,183.
What is the Total Male Population of Cape Charles?
Total Male Population of Cape Charles is 570.
What is the Total Female Population of Cape Charles?
Total Female Population of Cape Charles is 613.
What is the Ratio of Males per 100 Females in Cape Charles?
There are 92.99 Males per 100 Females in Cape Charles.
What is the Ratio of Females per 100 Males in Cape Charles?
There are 107.54 Females per 100 Males in Cape Charles.
What is the Median Population Age in Cape Charles?
Median Population Age in Cape Charles is 58.4 Years.
What is the Average Family Size in Cape Charles
Average Family Size in Cape Charles is 2.8 People.
What is the Average Household Size in Cape Charles
Average Household Size in Cape Charles is 1.8 People.
How Large is the Labor Force in Cape Charles?
There are 528 People in the Labor Forcein in Cape Charles.
What is the Percentage of People in the Labor Force in Cape Charles?
50.9% of People are in the Labor Force in Cape Charles.
What is the Unemployment Rate in Cape Charles?
Unemployment Rate in Cape Charles is 7.5%.