Hanover County, VA Map & Demographics
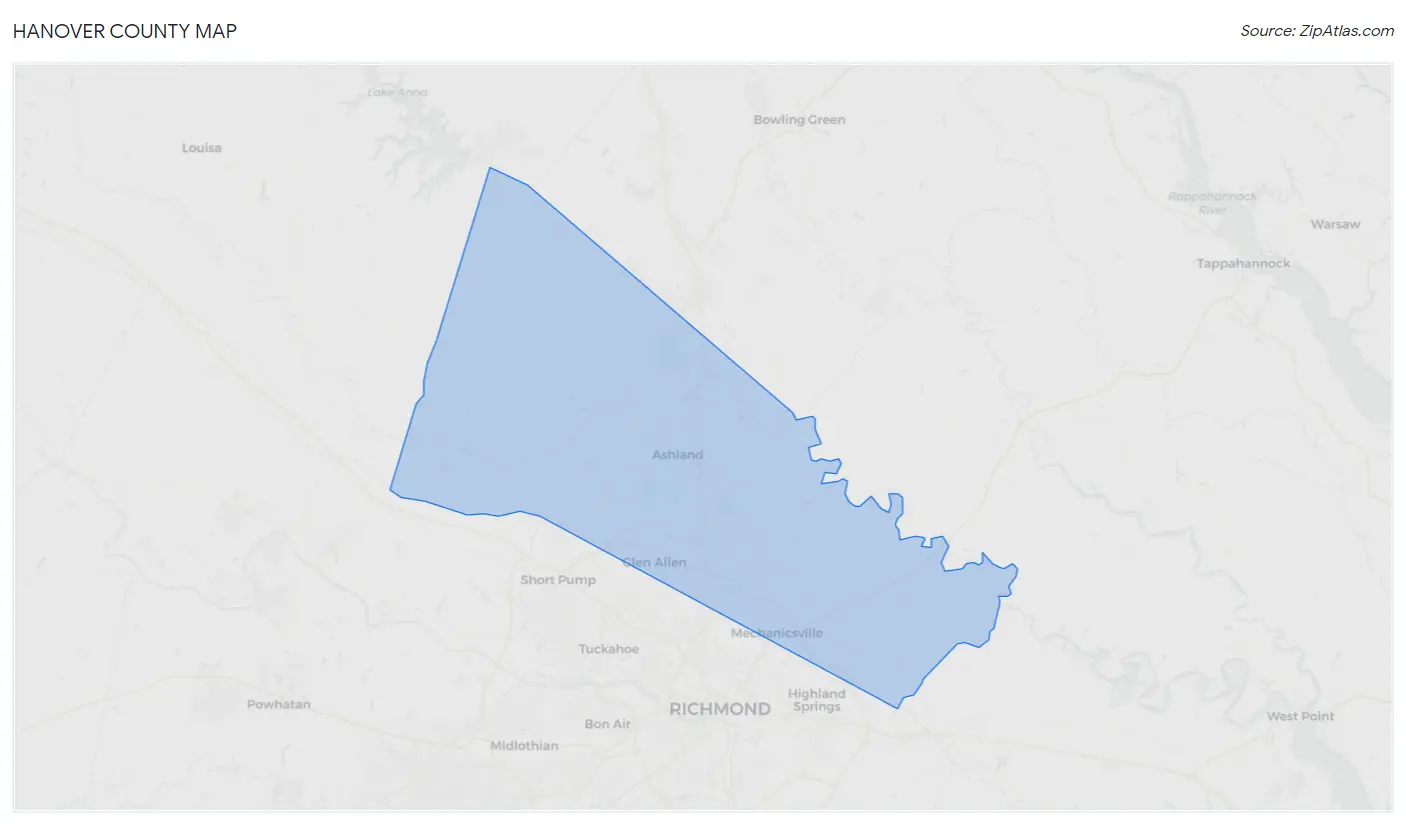
Hanover County Map
Hanover County Overview
$49,110
PER CAPITA INCOME
$124,004
AVG FAMILY INCOME
$104,678
AVG HOUSEHOLD INCOME
25.7%
WAGE / INCOME GAP [ % ]
74.3¢/ $1
WAGE / INCOME GAP [ $ ]
$10,759
FAMILY INCOME DEFICIT
0.42
INEQUALITY / GINI INDEX
110,513
TOTAL POPULATION
54,636
MALE POPULATION
55,877
FEMALE POPULATION
97.78
MALES / 100 FEMALES
102.27
FEMALES / 100 MALES
42.4
MEDIAN AGE
3.1
AVG FAMILY SIZE
2.6
AVG HOUSEHOLD SIZE
59,482
LABOR FORCE [ PEOPLE ]
66.4%
PERCENT IN LABOR FORCE
2.9%
UNEMPLOYMENT RATE
Hanover County Area Codes
Income in Hanover County
Income Overview in Hanover County
Per Capita Income in Hanover County is $49,110, while median incomes of families and households are $124,004 and $104,678 respectively.
| Characteristic | Number | Measure |
| Per Capita Income | 110,513 | $49,110 |
| Median Family Income | 30,139 | $124,004 |
| Mean Family Income | 30,139 | $145,043 |
| Median Household Income | 41,383 | $104,678 |
| Mean Household Income | 41,383 | $129,282 |
| Income Deficit | 30,139 | $10,759 |
| Wage / Income Gap (%) | 110,513 | 25.65% |
| Wage / Income Gap ($) | 110,513 | 74.35¢ per $1 |
| Gini / Inequality Index | 110,513 | 0.42 |
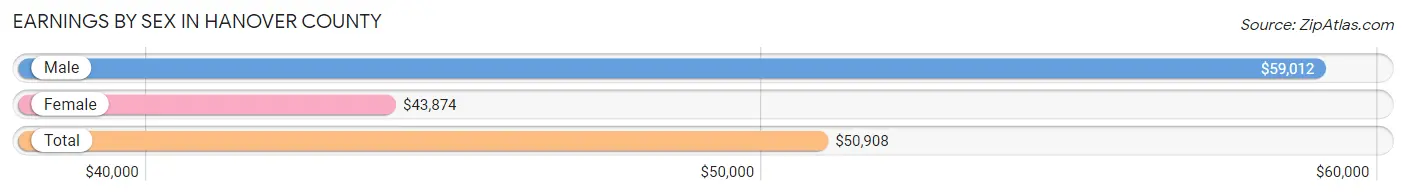
Earnings by Sex in Hanover County
Average Earnings in Hanover County are $50,908, $59,012 for men and $43,874 for women, a difference of 25.7%.
| Sex | Number | Average Earnings |
| Male | 32,874 (52.3%) | $59,012 |
| Female | 30,014 (47.7%) | $43,874 |
| Total | 62,888 (100.0%) | $50,908 |
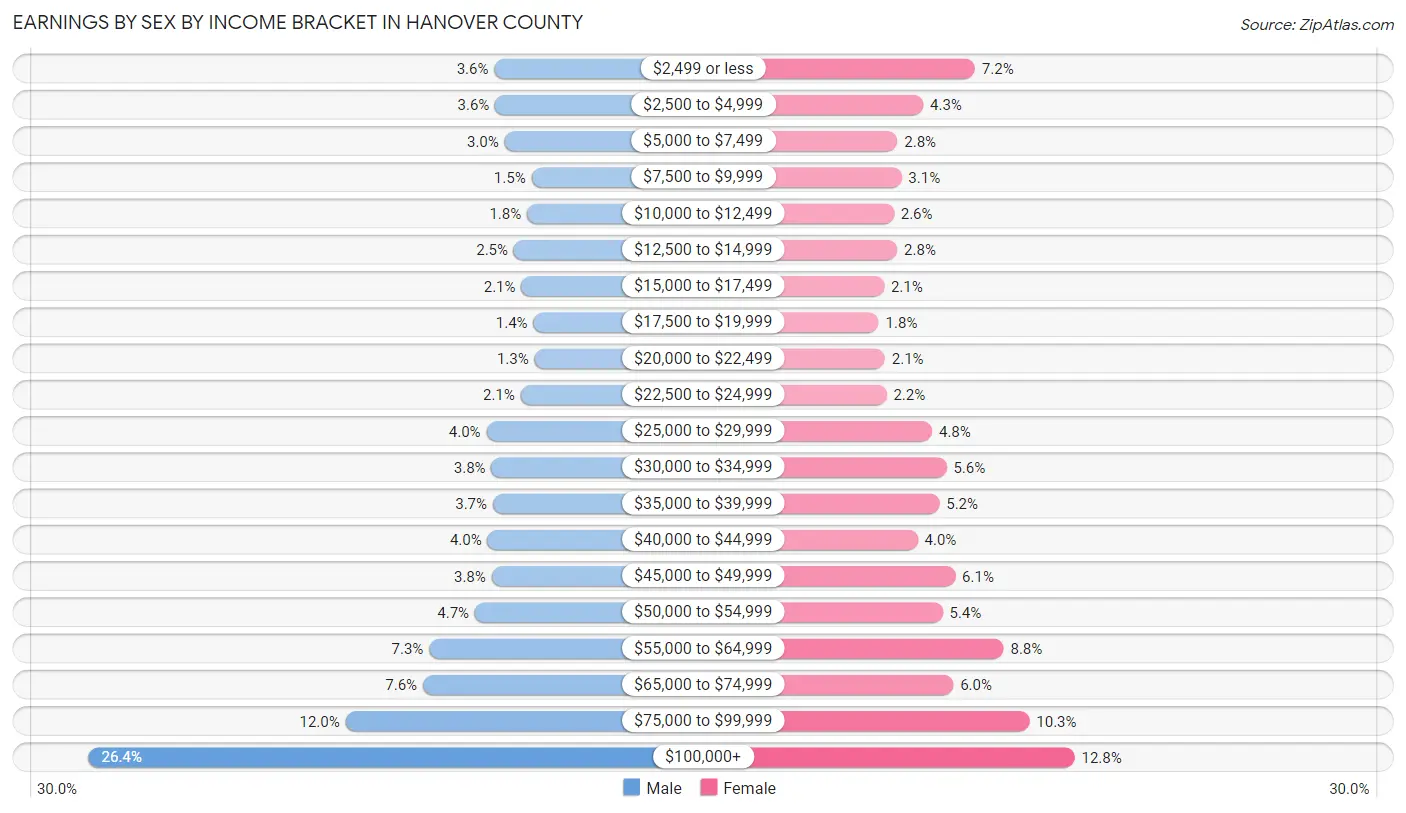
Earnings by Sex by Income Bracket in Hanover County
The most common earnings brackets in Hanover County are $100,000+ for men (8,678 | 26.4%) and $100,000+ for women (3,843 | 12.8%).
| Income | Male | Female |
| $2,499 or less | 1,182 (3.6%) | 2,162 (7.2%) |
| $2,500 to $4,999 | 1,168 (3.5%) | 1,288 (4.3%) |
| $5,000 to $7,499 | 993 (3.0%) | 851 (2.8%) |
| $7,500 to $9,999 | 495 (1.5%) | 921 (3.1%) |
| $10,000 to $12,499 | 579 (1.8%) | 791 (2.6%) |
| $12,500 to $14,999 | 822 (2.5%) | 849 (2.8%) |
| $15,000 to $17,499 | 684 (2.1%) | 627 (2.1%) |
| $17,500 to $19,999 | 459 (1.4%) | 538 (1.8%) |
| $20,000 to $22,499 | 440 (1.3%) | 641 (2.1%) |
| $22,500 to $24,999 | 696 (2.1%) | 669 (2.2%) |
| $25,000 to $29,999 | 1,329 (4.0%) | 1,439 (4.8%) |
| $30,000 to $34,999 | 1,236 (3.8%) | 1,680 (5.6%) |
| $35,000 to $39,999 | 1,210 (3.7%) | 1,561 (5.2%) |
| $40,000 to $44,999 | 1,309 (4.0%) | 1,194 (4.0%) |
| $45,000 to $49,999 | 1,233 (3.7%) | 1,827 (6.1%) |
| $50,000 to $54,999 | 1,541 (4.7%) | 1,614 (5.4%) |
| $55,000 to $64,999 | 2,386 (7.3%) | 2,645 (8.8%) |
| $65,000 to $74,999 | 2,503 (7.6%) | 1,794 (6.0%) |
| $75,000 to $99,999 | 3,931 (12.0%) | 3,080 (10.3%) |
| $100,000+ | 8,678 (26.4%) | 3,843 (12.8%) |
| Total | 32,874 (100.0%) | 30,014 (100.0%) |
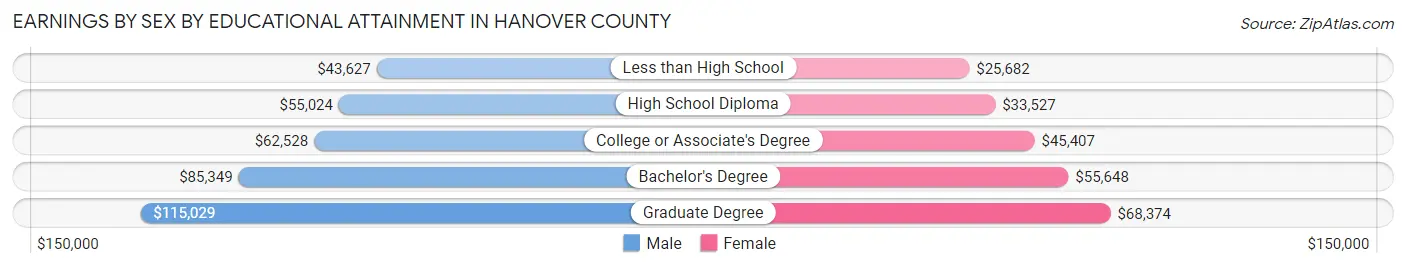
Earnings by Sex by Educational Attainment in Hanover County
Average earnings in Hanover County are $69,240 for men and $50,198 for women, a difference of 27.5%. Men with an educational attainment of graduate degree enjoy the highest average annual earnings of $115,029, while those with less than high school education earn the least with $43,627. Women with an educational attainment of graduate degree earn the most with the average annual earnings of $68,374, while those with less than high school education have the smallest earnings of $25,682.
| Educational Attainment | Male Income | Female Income |
| Less than High School | $43,627 | $25,682 |
| High School Diploma | $55,024 | $33,527 |
| College or Associate's Degree | $62,528 | $45,407 |
| Bachelor's Degree | $85,349 | $55,648 |
| Graduate Degree | $115,029 | $68,374 |
| Total | $69,240 | $50,198 |
Family Income in Hanover County
Family Income Brackets in Hanover County
According to the Hanover County family income data, there are 7,927 families falling into the $100,000 to $149,999 income range, which is the most common income bracket and makes up 26.3% of all families. Conversely, the $10,000 to $14,999 income bracket is the least frequent group with only 181 families (0.6%) belonging to this category.
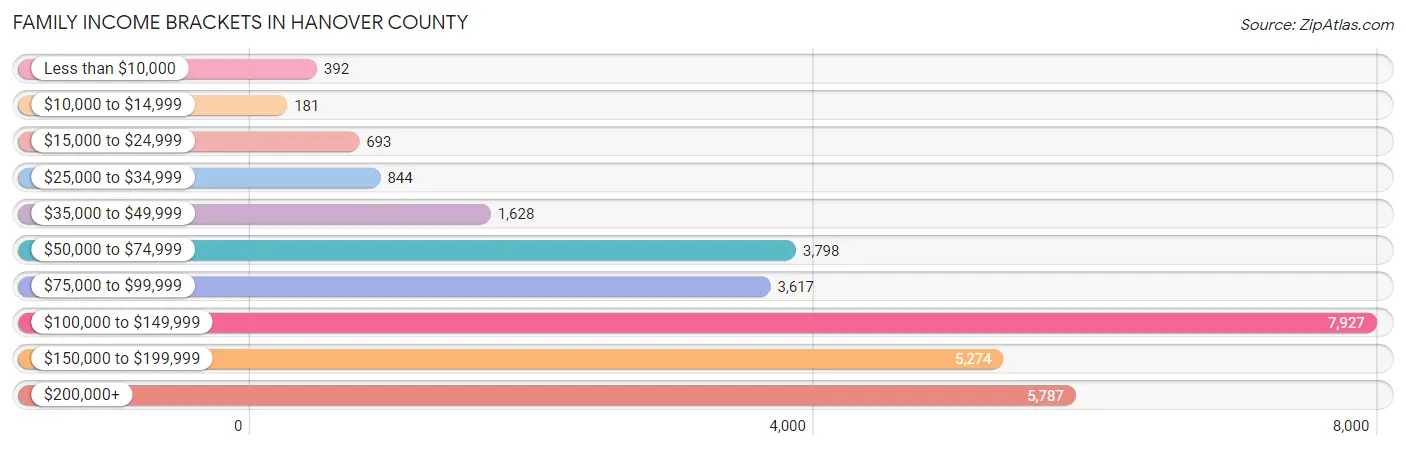
| Income Bracket | # Families | % Families |
| Less than $10,000 | 392 | 1.3% |
| $10,000 to $14,999 | 181 | 0.6% |
| $15,000 to $24,999 | 693 | 2.3% |
| $25,000 to $34,999 | 844 | 2.8% |
| $35,000 to $49,999 | 1,628 | 5.4% |
| $50,000 to $74,999 | 3,798 | 12.6% |
| $75,000 to $99,999 | 3,617 | 12.0% |
| $100,000 to $149,999 | 7,927 | 26.3% |
| $150,000 to $199,999 | 5,274 | 17.5% |
| $200,000+ | 5,787 | 19.2% |
Family Income by Famaliy Size in Hanover County
7+ person families (190 | 0.6%) account for the highest median family income in Hanover County with $155,104 per family, while 2-person families (14,406 | 47.8%) have the highest median income of $53,738 per family member.
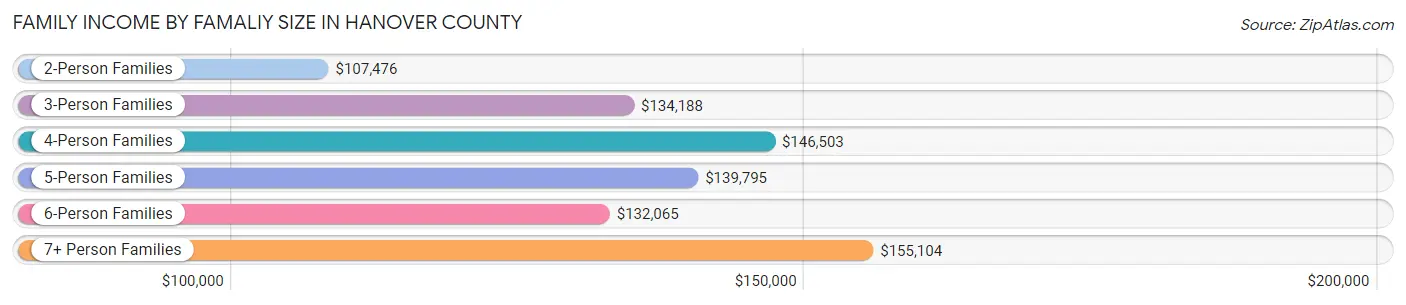
| Income Bracket | # Families | Median Income |
| 2-Person Families | 14,406 (47.8%) | $107,476 |
| 3-Person Families | 7,085 (23.5%) | $134,188 |
| 4-Person Families | 5,566 (18.5%) | $146,503 |
| 5-Person Families | 2,282 (7.6%) | $139,795 |
| 6-Person Families | 610 (2.0%) | $132,065 |
| 7+ Person Families | 190 (0.6%) | $155,104 |
| Total | 30,139 (100.0%) | $124,004 |
Family Income by Number of Earners in Hanover County
The median family income in Hanover County is $124,004, with families comprising 3+ earners (3,968) having the highest median family income of $162,964, while families with no earners (4,040) have the lowest median family income of $71,207, accounting for 13.2% and 13.4% of families, respectively.
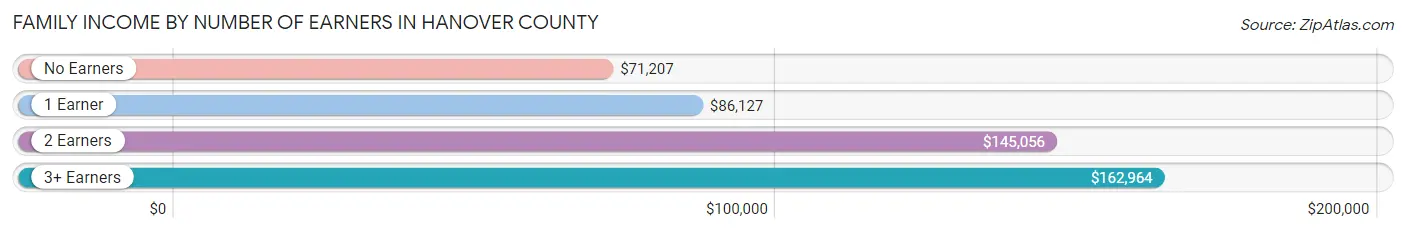
| Number of Earners | # Families | Median Income |
| No Earners | 4,040 (13.4%) | $71,207 |
| 1 Earner | 7,561 (25.1%) | $86,127 |
| 2 Earners | 14,570 (48.3%) | $145,056 |
| 3+ Earners | 3,968 (13.2%) | $162,964 |
| Total | 30,139 (100.0%) | $124,004 |
Household Income in Hanover County
Household Income Brackets in Hanover County
With 9,518 households falling in the category, the $100,000 to $149,999 income range is the most frequent in Hanover County, accounting for 23.0% of all households. In contrast, only 745 households (1.8%) fall into the $10,000 to $14,999 income bracket, making it the least populous group.
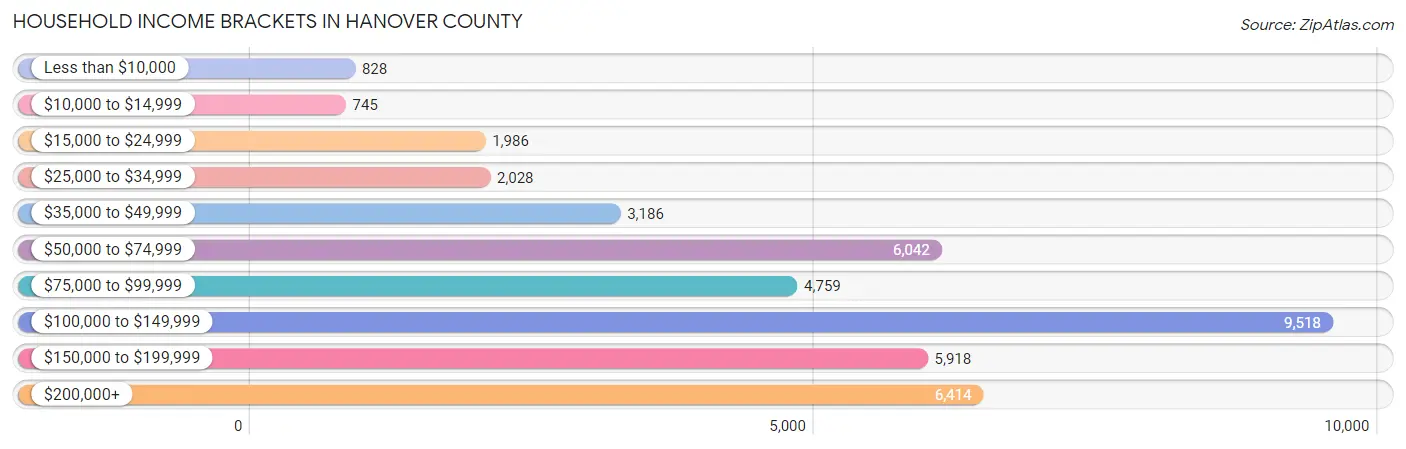
| Income Bracket | # Households | % Households |
| Less than $10,000 | 828 | 2.0% |
| $10,000 to $14,999 | 745 | 1.8% |
| $15,000 to $24,999 | 1,986 | 4.8% |
| $25,000 to $34,999 | 2,028 | 4.9% |
| $35,000 to $49,999 | 3,186 | 7.7% |
| $50,000 to $74,999 | 6,042 | 14.6% |
| $75,000 to $99,999 | 4,759 | 11.5% |
| $100,000 to $149,999 | 9,518 | 23.0% |
| $150,000 to $199,999 | 5,918 | 14.3% |
| $200,000+ | 6,414 | 15.5% |
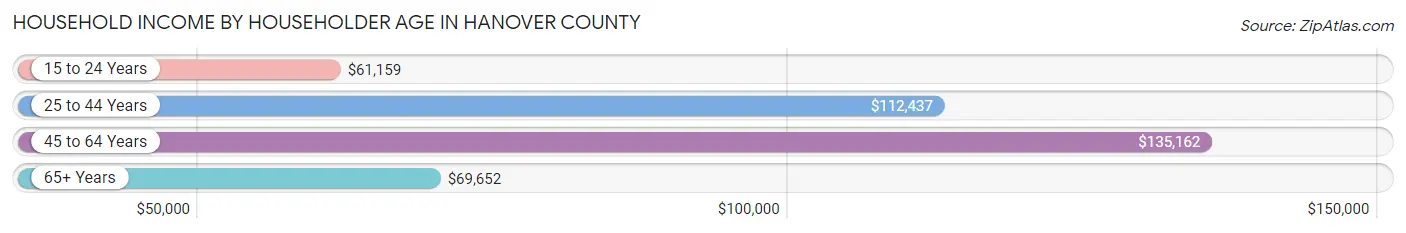
Household Income by Householder Age in Hanover County
The median household income in Hanover County is $104,678, with the highest median household income of $135,162 found in the 45 to 64 years age bracket for the primary householder. A total of 17,043 households (41.2%) fall into this category. Meanwhile, the 15 to 24 years age bracket for the primary householder has the lowest median household income of $61,159, with 684 households (1.7%) in this group.
| Income Bracket | # Households | Median Income |
| 15 to 24 Years | 684 (1.7%) | $61,159 |
| 25 to 44 Years | 11,492 (27.8%) | $112,437 |
| 45 to 64 Years | 17,043 (41.2%) | $135,162 |
| 65+ Years | 12,164 (29.4%) | $69,652 |
| Total | 41,383 (100.0%) | $104,678 |
Poverty in Hanover County
Income Below Poverty by Sex and Age in Hanover County
With 4.8% poverty level for males and 5.5% for females among the residents of Hanover County, 5 year old males and under 5 year old females are the most vulnerable to poverty, with 103 males (14.6%) and 307 females (12.0%) in their respective age groups living below the poverty level.
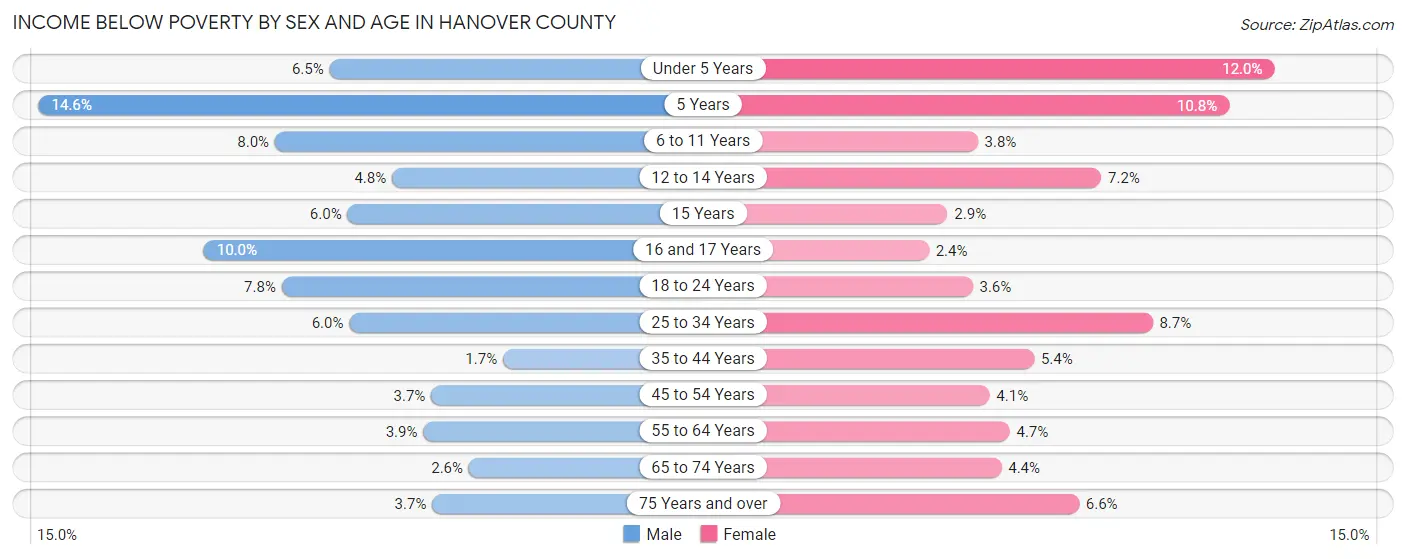
| Age Bracket | Male | Female |
| Under 5 Years | 182 (6.5%) | 307 (12.0%) |
| 5 Years | 103 (14.6%) | 54 (10.8%) |
| 6 to 11 Years | 331 (8.0%) | 138 (3.8%) |
| 12 to 14 Years | 109 (4.8%) | 172 (7.2%) |
| 15 Years | 51 (6.0%) | 26 (2.9%) |
| 16 and 17 Years | 157 (10.0%) | 34 (2.4%) |
| 18 to 24 Years | 357 (7.8%) | 138 (3.6%) |
| 25 to 34 Years | 331 (6.0%) | 498 (8.6%) |
| 35 to 44 Years | 113 (1.7%) | 371 (5.3%) |
| 45 to 54 Years | 271 (3.7%) | 312 (4.1%) |
| 55 to 64 Years | 307 (3.9%) | 390 (4.7%) |
| 65 to 74 Years | 152 (2.6%) | 281 (4.4%) |
| 75 Years and over | 123 (3.6%) | 312 (6.6%) |
| Total | 2,587 (4.8%) | 3,033 (5.5%) |
Income Above Poverty by Sex and Age in Hanover County
According to the poverty statistics in Hanover County, males aged 35 to 44 years and females aged 16 and 17 years are the age groups that are most secure financially, with 98.3% of males and 97.6% of females in these age groups living above the poverty line.
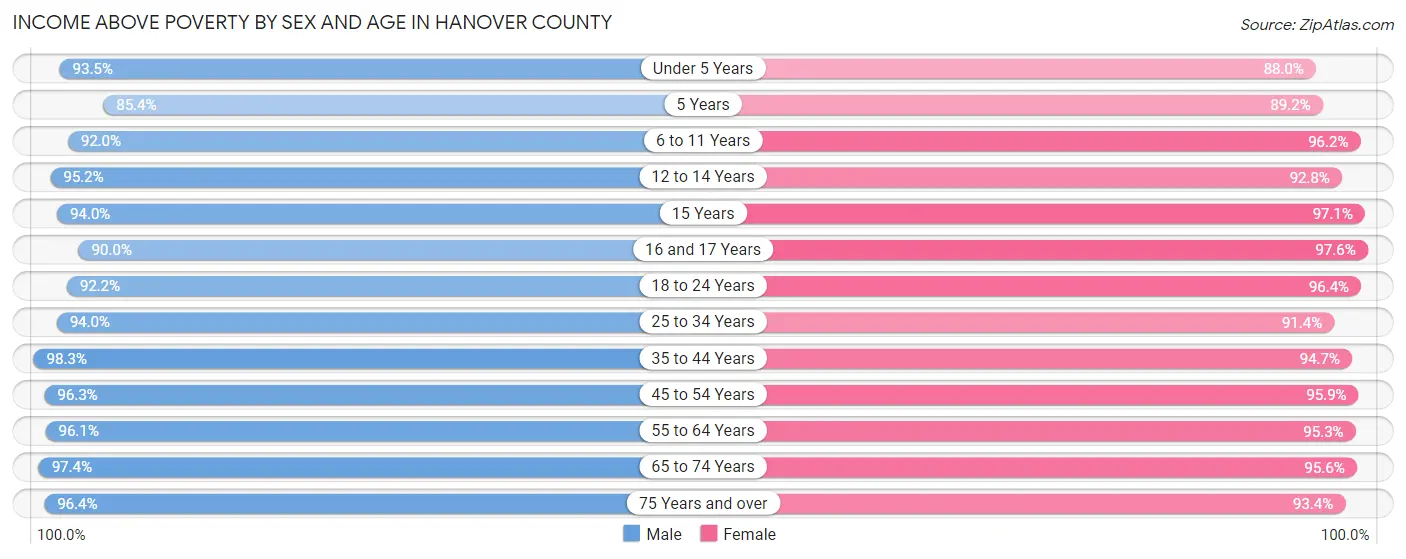
| Age Bracket | Male | Female |
| Under 5 Years | 2,612 (93.5%) | 2,242 (88.0%) |
| 5 Years | 602 (85.4%) | 447 (89.2%) |
| 6 to 11 Years | 3,791 (92.0%) | 3,514 (96.2%) |
| 12 to 14 Years | 2,175 (95.2%) | 2,209 (92.8%) |
| 15 Years | 798 (94.0%) | 858 (97.1%) |
| 16 and 17 Years | 1,412 (90.0%) | 1,371 (97.6%) |
| 18 to 24 Years | 4,195 (92.2%) | 3,658 (96.4%) |
| 25 to 34 Years | 5,222 (94.0%) | 5,262 (91.3%) |
| 35 to 44 Years | 6,620 (98.3%) | 6,560 (94.7%) |
| 45 to 54 Years | 7,096 (96.3%) | 7,286 (95.9%) |
| 55 to 64 Years | 7,569 (96.1%) | 7,961 (95.3%) |
| 65 to 74 Years | 5,636 (97.4%) | 6,050 (95.6%) |
| 75 Years and over | 3,245 (96.4%) | 4,418 (93.4%) |
| Total | 50,973 (95.2%) | 51,836 (94.5%) |
Income Below Poverty Among Married-Couple Families in Hanover County
The poverty statistics for married-couple families in Hanover County show that 1.9% or 465 of the total 24,568 families live below the poverty line. Families with 5 or more children have the highest poverty rate of 22.6%, comprising of 19 families. On the other hand, families with 1 or 2 children have the lowest poverty rate of 1.5%, which includes 120 families.
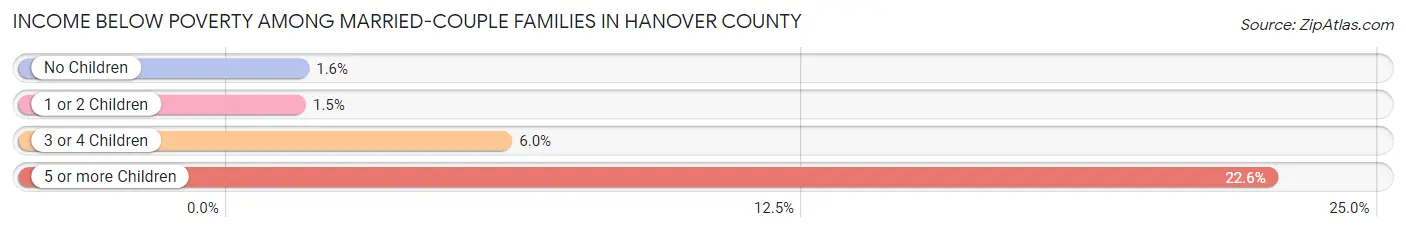
| Children | Above Poverty | Below Poverty |
| No Children | 14,550 (98.5%) | 229 (1.5%) |
| 1 or 2 Children | 7,961 (98.5%) | 120 (1.5%) |
| 3 or 4 Children | 1,527 (94.0%) | 97 (6.0%) |
| 5 or more Children | 65 (77.4%) | 19 (22.6%) |
| Total | 24,103 (98.1%) | 465 (1.9%) |
Income Below Poverty Among Single-Parent Households in Hanover County
According to the poverty data in Hanover County, 5.5% or 100 single-father households and 12.2% or 458 single-mother households are living below the poverty line. Among single-father households, those with no children have the highest poverty rate, with 55 households (6.0%) experiencing poverty. Likewise, among single-mother households, those with 5 or more children have the highest poverty rate, with 15 households (100.0%) falling below the poverty line.
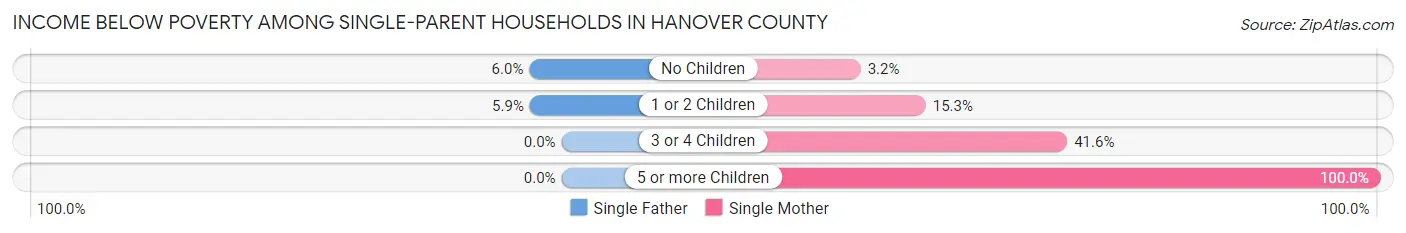
| Children | Single Father | Single Mother |
| No Children | 55 (6.0%) | 53 (3.2%) |
| 1 or 2 Children | 45 (5.9%) | 278 (15.3%) |
| 3 or 4 Children | 0 (0.0%) | 112 (41.6%) |
| 5 or more Children | 0 (0.0%) | 15 (100.0%) |
| Total | 100 (5.5%) | 458 (12.2%) |
Income Below Poverty Among Married-Couple vs Single-Parent Households in Hanover County
The poverty data for Hanover County shows that 465 of the married-couple family households (1.9%) and 558 of the single-parent households (10.0%) are living below the poverty level. Within the married-couple family households, those with 5 or more children have the highest poverty rate, with 19 households (22.6%) falling below the poverty line. Among the single-parent households, those with 5 or more children have the highest poverty rate, with 15 household (100.0%) living below poverty.
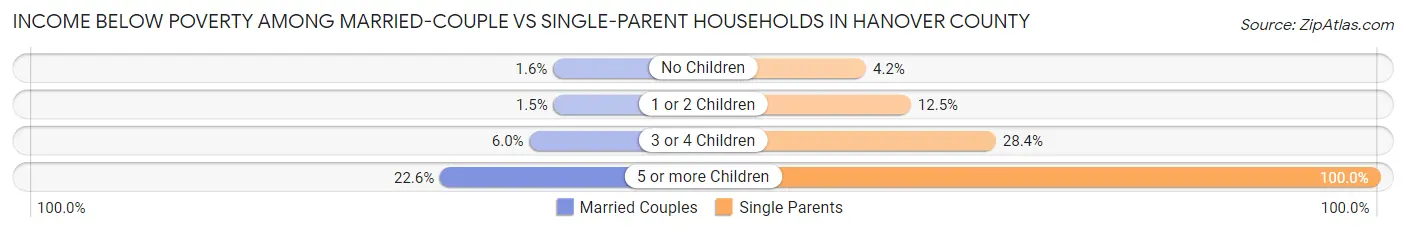
| Children | Married-Couple Families | Single-Parent Households |
| No Children | 229 (1.5%) | 108 (4.2%) |
| 1 or 2 Children | 120 (1.5%) | 323 (12.5%) |
| 3 or 4 Children | 97 (6.0%) | 112 (28.3%) |
| 5 or more Children | 19 (22.6%) | 15 (100.0%) |
| Total | 465 (1.9%) | 558 (10.0%) |
Race in Hanover County
The most populous races in Hanover County are White / Caucasian (91,983 | 83.2%), Black / African American (9,591 | 8.7%), and Two or more Races (5,320 | 4.8%).
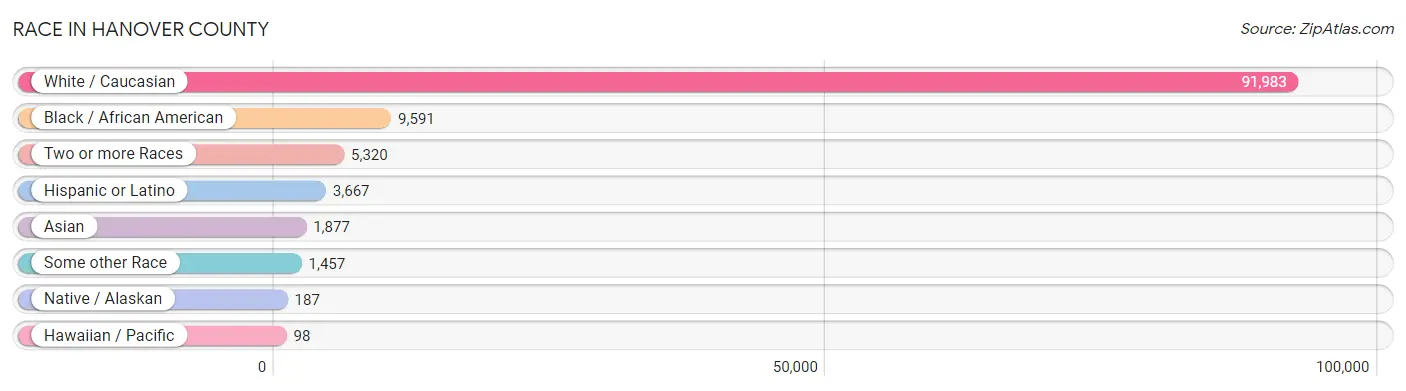
| Race | # Population | % Population |
| Asian | 1,877 | 1.7% |
| Black / African American | 9,591 | 8.7% |
| Hawaiian / Pacific | 98 | 0.1% |
| Hispanic or Latino | 3,667 | 3.3% |
| Native / Alaskan | 187 | 0.2% |
| White / Caucasian | 91,983 | 83.2% |
| Two or more Races | 5,320 | 4.8% |
| Some other Race | 1,457 | 1.3% |
| Total | 110,513 | 100.0% |
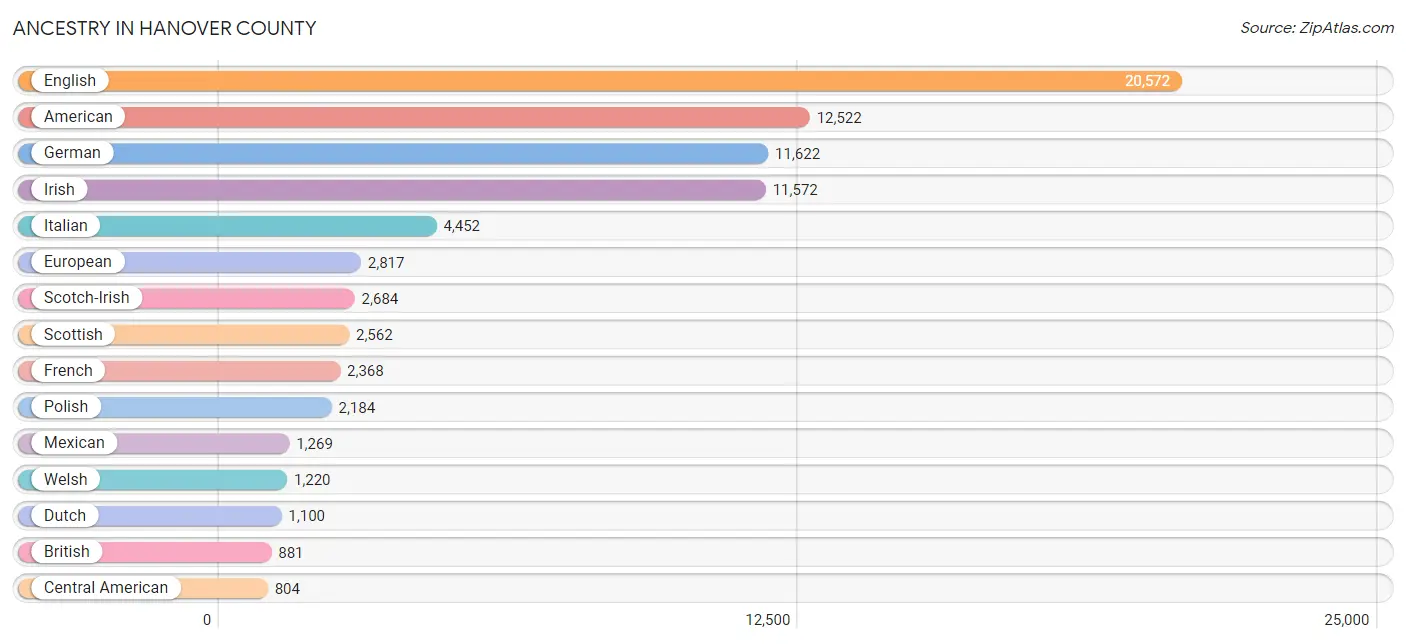
Ancestry in Hanover County
The most populous ancestries reported in Hanover County are English (20,572 | 18.6%), American (12,522 | 11.3%), German (11,622 | 10.5%), Irish (11,572 | 10.5%), and Italian (4,452 | 4.0%), together accounting for 55.0% of all Hanover County residents.
| Ancestry | # Population | % Population |
| Afghan | 36 | 0.0% |
| African | 615 | 0.6% |
| American | 12,522 | 11.3% |
| Apache | 3 | 0.0% |
| Arab | 577 | 0.5% |
| Armenian | 34 | 0.0% |
| Australian | 15 | 0.0% |
| Austrian | 213 | 0.2% |
| Barbadian | 7 | 0.0% |
| Belgian | 26 | 0.0% |
| Bhutanese | 221 | 0.2% |
| Blackfeet | 3 | 0.0% |
| Brazilian | 71 | 0.1% |
| British | 881 | 0.8% |
| Burmese | 256 | 0.2% |
| Cajun | 86 | 0.1% |
| Cambodian | 6 | 0.0% |
| Canadian | 228 | 0.2% |
| Cape Verdean | 26 | 0.0% |
| Celtic | 32 | 0.0% |
| Central American | 804 | 0.7% |
| Cherokee | 206 | 0.2% |
| Chilean | 176 | 0.2% |
| Chippewa | 27 | 0.0% |
| Choctaw | 11 | 0.0% |
| Colombian | 373 | 0.3% |
| Costa Rican | 11 | 0.0% |
| Creek | 39 | 0.0% |
| Croatian | 55 | 0.1% |
| Crow | 4 | 0.0% |
| Cuban | 113 | 0.1% |
| Czech | 365 | 0.3% |
| Czechoslovakian | 81 | 0.1% |
| Danish | 122 | 0.1% |
| Dominican | 183 | 0.2% |
| Dutch | 1,100 | 1.0% |
| Eastern European | 268 | 0.2% |
| Ecuadorian | 32 | 0.0% |
| Egyptian | 17 | 0.0% |
| English | 20,572 | 18.6% |
| Ethiopian | 53 | 0.1% |
| European | 2,817 | 2.5% |
| Finnish | 70 | 0.1% |
| French | 2,368 | 2.1% |
| French Canadian | 416 | 0.4% |
| German | 11,622 | 10.5% |
| Ghanaian | 18 | 0.0% |
| Greek | 484 | 0.4% |
| Guamanian / Chamorro | 48 | 0.0% |
| Guatemalan | 93 | 0.1% |
| Guyanese | 38 | 0.0% |
| Haitian | 16 | 0.0% |
| Honduran | 243 | 0.2% |
| Hungarian | 343 | 0.3% |
| Icelander | 33 | 0.0% |
| Indian (Asian) | 285 | 0.3% |
| Indonesian | 138 | 0.1% |
| Iranian | 10 | 0.0% |
| Irish | 11,572 | 10.5% |
| Israeli | 24 | 0.0% |
| Italian | 4,452 | 4.0% |
| Jamaican | 122 | 0.1% |
| Japanese | 325 | 0.3% |
| Jordanian | 12 | 0.0% |
| Korean | 610 | 0.5% |
| Laotian | 8 | 0.0% |
| Latvian | 41 | 0.0% |
| Lebanese | 483 | 0.4% |
| Lithuanian | 140 | 0.1% |
| Lumbee | 10 | 0.0% |
| Luxembourger | 9 | 0.0% |
| Macedonian | 32 | 0.0% |
| Mexican | 1,269 | 1.1% |
| Moroccan | 12 | 0.0% |
| Native Hawaiian | 13 | 0.0% |
| Navajo | 18 | 0.0% |
| New Zealander | 9 | 0.0% |
| Nicaraguan | 174 | 0.2% |
| Nigerian | 14 | 0.0% |
| Northern European | 99 | 0.1% |
| Norwegian | 508 | 0.5% |
| Pakistani | 163 | 0.2% |
| Panamanian | 29 | 0.0% |
| Pennsylvania German | 53 | 0.1% |
| Peruvian | 60 | 0.1% |
| Polish | 2,184 | 2.0% |
| Portuguese | 234 | 0.2% |
| Puerto Rican | 191 | 0.2% |
| Romanian | 176 | 0.2% |
| Russian | 429 | 0.4% |
| Salvadoran | 254 | 0.2% |
| Scandinavian | 181 | 0.2% |
| Scotch-Irish | 2,684 | 2.4% |
| Scottish | 2,562 | 2.3% |
| Serbian | 18 | 0.0% |
| Slavic | 26 | 0.0% |
| Slovak | 321 | 0.3% |
| Slovene | 14 | 0.0% |
| South African | 23 | 0.0% |
| South American | 720 | 0.6% |
| Spaniard | 77 | 0.1% |
| Spanish | 260 | 0.2% |
| Sri Lankan | 197 | 0.2% |
| Subsaharan African | 756 | 0.7% |
| Swedish | 428 | 0.4% |
| Swiss | 209 | 0.2% |
| Syrian | 13 | 0.0% |
| Thai | 447 | 0.4% |
| Trinidadian and Tobagonian | 23 | 0.0% |
| Ukrainian | 177 | 0.2% |
| Uruguayan | 9 | 0.0% |
| Venezuelan | 70 | 0.1% |
| Welsh | 1,220 | 1.1% |
| West Indian | 146 | 0.1% |
| Yaqui | 33 | 0.0% |
| Yugoslavian | 29 | 0.0% | View All 116 Rows |
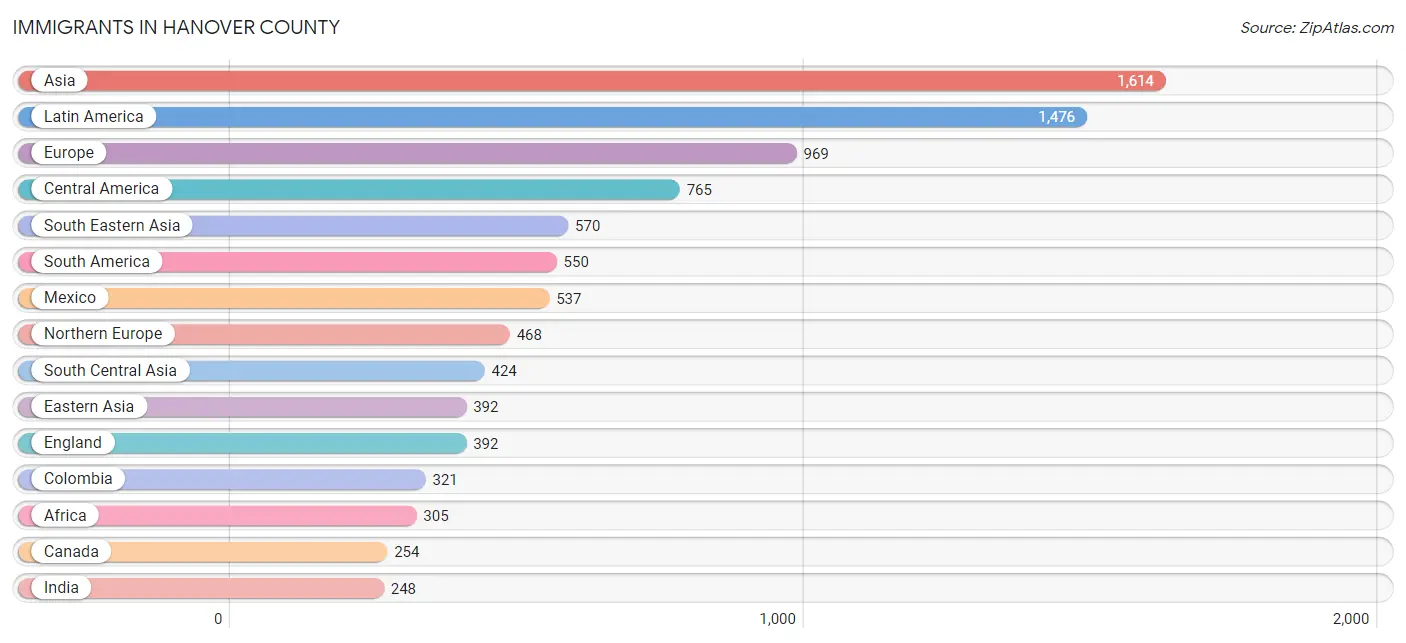
Immigrants in Hanover County
The most numerous immigrant groups reported in Hanover County came from Asia (1,614 | 1.5%), Latin America (1,476 | 1.3%), Europe (969 | 0.9%), Central America (765 | 0.7%), and South Eastern Asia (570 | 0.5%), together accounting for 4.9% of all Hanover County residents.
| Immigration Origin | # Population | % Population |
| Afghanistan | 36 | 0.0% |
| Africa | 305 | 0.3% |
| Asia | 1,614 | 1.5% |
| Austria | 11 | 0.0% |
| Belgium | 18 | 0.0% |
| Brazil | 119 | 0.1% |
| Cambodia | 120 | 0.1% |
| Canada | 254 | 0.2% |
| Caribbean | 161 | 0.2% |
| Central America | 765 | 0.7% |
| Chile | 58 | 0.1% |
| China | 168 | 0.2% |
| Colombia | 321 | 0.3% |
| Costa Rica | 6 | 0.0% |
| Cuba | 23 | 0.0% |
| Dominican Republic | 134 | 0.1% |
| Eastern Africa | 134 | 0.1% |
| Eastern Asia | 392 | 0.4% |
| Eastern Europe | 207 | 0.2% |
| Ecuador | 11 | 0.0% |
| Egypt | 17 | 0.0% |
| El Salvador | 67 | 0.1% |
| England | 392 | 0.4% |
| Eritrea | 28 | 0.0% |
| Ethiopia | 72 | 0.1% |
| Europe | 969 | 0.9% |
| France | 8 | 0.0% |
| Germany | 149 | 0.1% |
| Ghana | 40 | 0.0% |
| Guatemala | 24 | 0.0% |
| Honduras | 69 | 0.1% |
| Hong Kong | 14 | 0.0% |
| Hungary | 33 | 0.0% |
| India | 248 | 0.2% |
| Indonesia | 8 | 0.0% |
| Iran | 4 | 0.0% |
| Israel | 7 | 0.0% |
| Italy | 108 | 0.1% |
| Jamaica | 3 | 0.0% |
| Japan | 133 | 0.1% |
| Jordan | 42 | 0.0% |
| Kazakhstan | 28 | 0.0% |
| Korea | 91 | 0.1% |
| Latin America | 1,476 | 1.3% |
| Latvia | 8 | 0.0% |
| Lebanon | 98 | 0.1% |
| Malaysia | 7 | 0.0% |
| Mexico | 537 | 0.5% |
| Micronesia | 10 | 0.0% |
| Morocco | 17 | 0.0% |
| Nepal | 55 | 0.1% |
| Nicaragua | 62 | 0.1% |
| Northern Africa | 34 | 0.0% |
| Northern Europe | 468 | 0.4% |
| Oceania | 10 | 0.0% |
| Pakistan | 53 | 0.1% |
| Peru | 17 | 0.0% |
| Philippines | 202 | 0.2% |
| Romania | 30 | 0.0% |
| Russia | 95 | 0.1% |
| Saudi Arabia | 31 | 0.0% |
| Scotland | 40 | 0.0% |
| Sierra Leone | 1 | 0.0% |
| South Africa | 45 | 0.0% |
| South America | 550 | 0.5% |
| South Central Asia | 424 | 0.4% |
| South Eastern Asia | 570 | 0.5% |
| Southern Europe | 108 | 0.1% |
| Taiwan | 7 | 0.0% |
| Thailand | 18 | 0.0% |
| Trinidad and Tobago | 1 | 0.0% |
| Ukraine | 35 | 0.0% |
| Uruguay | 9 | 0.0% |
| Venezuela | 15 | 0.0% |
| Vietnam | 112 | 0.1% |
| Western Africa | 92 | 0.1% |
| Western Asia | 218 | 0.2% |
| Western Europe | 186 | 0.2% |
| Zimbabwe | 27 | 0.0% | View All 79 Rows |
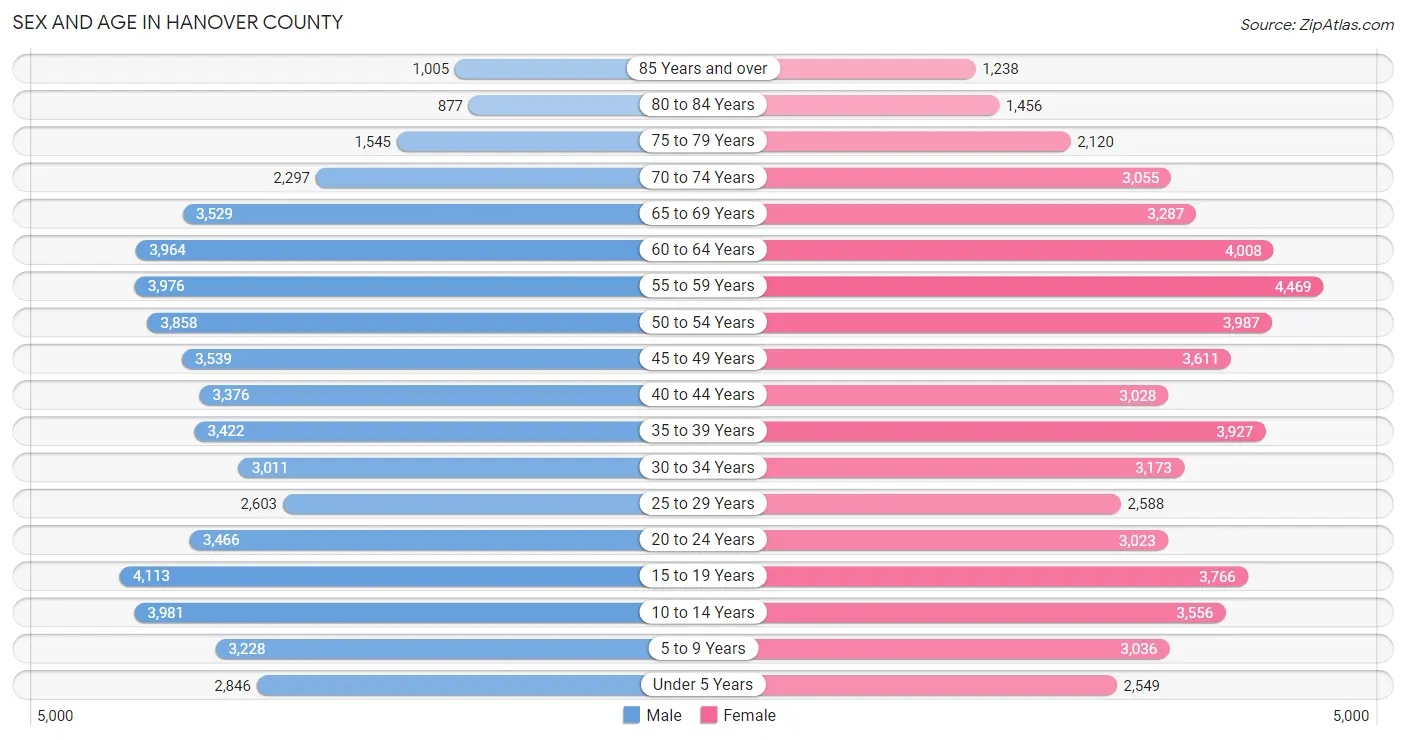
Sex and Age in Hanover County
Sex and Age in Hanover County
The most populous age groups in Hanover County are 15 to 19 Years (4,113 | 7.5%) for men and 55 to 59 Years (4,469 | 8.0%) for women.
| Age Bracket | Male | Female |
| Under 5 Years | 2,846 (5.2%) | 2,549 (4.6%) |
| 5 to 9 Years | 3,228 (5.9%) | 3,036 (5.4%) |
| 10 to 14 Years | 3,981 (7.3%) | 3,556 (6.4%) |
| 15 to 19 Years | 4,113 (7.5%) | 3,766 (6.7%) |
| 20 to 24 Years | 3,466 (6.3%) | 3,023 (5.4%) |
| 25 to 29 Years | 2,603 (4.8%) | 2,588 (4.6%) |
| 30 to 34 Years | 3,011 (5.5%) | 3,173 (5.7%) |
| 35 to 39 Years | 3,422 (6.3%) | 3,927 (7.0%) |
| 40 to 44 Years | 3,376 (6.2%) | 3,028 (5.4%) |
| 45 to 49 Years | 3,539 (6.5%) | 3,611 (6.5%) |
| 50 to 54 Years | 3,858 (7.1%) | 3,987 (7.1%) |
| 55 to 59 Years | 3,976 (7.3%) | 4,469 (8.0%) |
| 60 to 64 Years | 3,964 (7.3%) | 4,008 (7.2%) |
| 65 to 69 Years | 3,529 (6.5%) | 3,287 (5.9%) |
| 70 to 74 Years | 2,297 (4.2%) | 3,055 (5.5%) |
| 75 to 79 Years | 1,545 (2.8%) | 2,120 (3.8%) |
| 80 to 84 Years | 877 (1.6%) | 1,456 (2.6%) |
| 85 Years and over | 1,005 (1.8%) | 1,238 (2.2%) |
| Total | 54,636 (100.0%) | 55,877 (100.0%) |
Families and Households in Hanover County
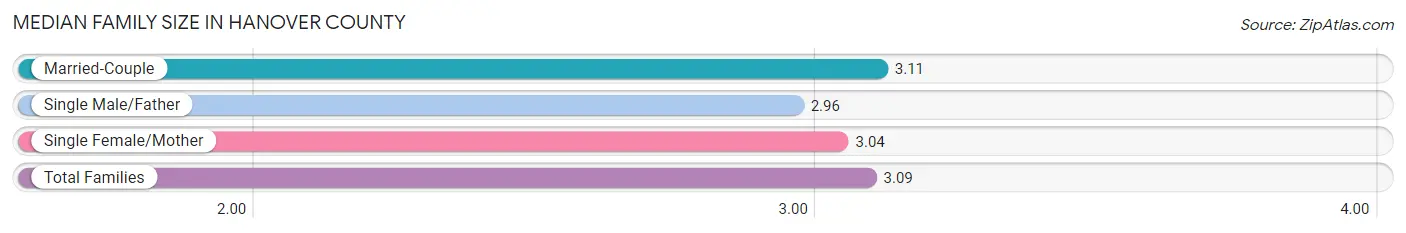
Median Family Size in Hanover County
The median family size in Hanover County is 3.09 persons per family, with married-couple families (24,568 | 81.5%) accounting for the largest median family size of 3.11 persons per family. On the other hand, single male/father families (1,804 | 6.0%) represent the smallest median family size with 2.96 persons per family.
| Family Type | # Families | Family Size |
| Married-Couple | 24,568 (81.5%) | 3.11 |
| Single Male/Father | 1,804 (6.0%) | 2.96 |
| Single Female/Mother | 3,767 (12.5%) | 3.04 |
| Total Families | 30,139 (100.0%) | 3.09 |
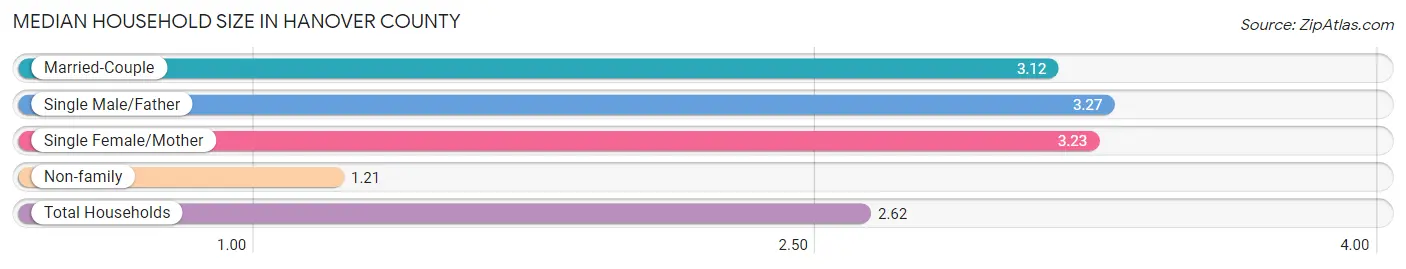
Median Household Size in Hanover County
The median household size in Hanover County is 2.62 persons per household, with single male/father households (1,804 | 4.4%) accounting for the largest median household size of 3.27 persons per household. non-family households (11,244 | 27.2%) represent the smallest median household size with 1.21 persons per household.
| Household Type | # Households | Household Size |
| Married-Couple | 24,568 (59.4%) | 3.12 |
| Single Male/Father | 1,804 (4.4%) | 3.27 |
| Single Female/Mother | 3,767 (9.1%) | 3.23 |
| Non-family | 11,244 (27.2%) | 1.21 |
| Total Households | 41,383 (100.0%) | 2.62 |
Household Size by Marriage Status in Hanover County
Out of a total of 41,383 households in Hanover County, 30,139 (72.8%) are family households, while 11,244 (27.2%) are nonfamily households. The most numerous type of family households are 2-person households, comprising 13,898, and the most common type of nonfamily households are 1-person households, comprising 9,320.
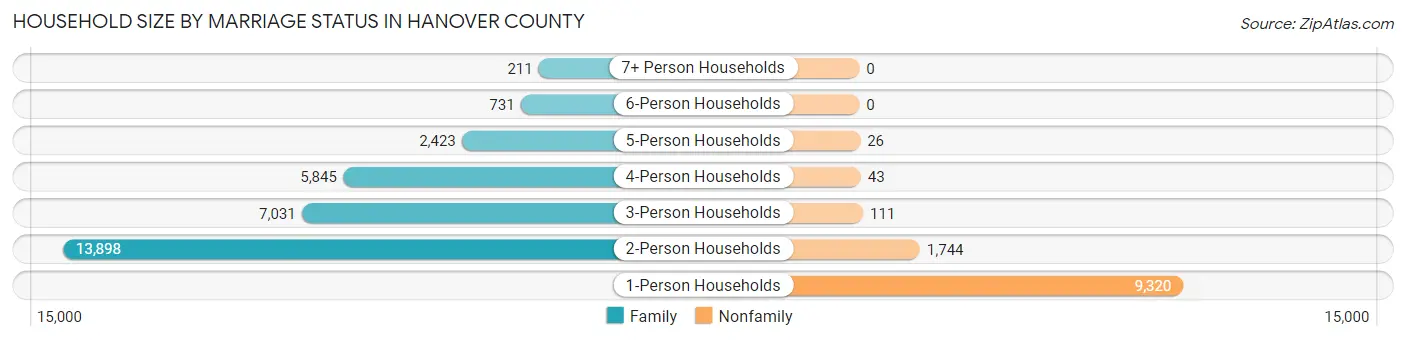
| Household Size | Family Households | Nonfamily Households |
| 1-Person Households | - | 9,320 (22.5%) |
| 2-Person Households | 13,898 (33.6%) | 1,744 (4.2%) |
| 3-Person Households | 7,031 (17.0%) | 111 (0.3%) |
| 4-Person Households | 5,845 (14.1%) | 43 (0.1%) |
| 5-Person Households | 2,423 (5.9%) | 26 (0.1%) |
| 6-Person Households | 731 (1.8%) | 0 (0.0%) |
| 7+ Person Households | 211 (0.5%) | 0 (0.0%) |
| Total | 30,139 (72.8%) | 11,244 (27.2%) |
Female Fertility in Hanover County
Fertility by Age in Hanover County
Average fertility rate in Hanover County is 49.0 births per 1,000 women. Women in the age bracket of 20 to 34 years have the highest fertility rate with 97.0 births per 1,000 women. Women in the age bracket of 20 to 34 years acount for 72.3% of all women with births.
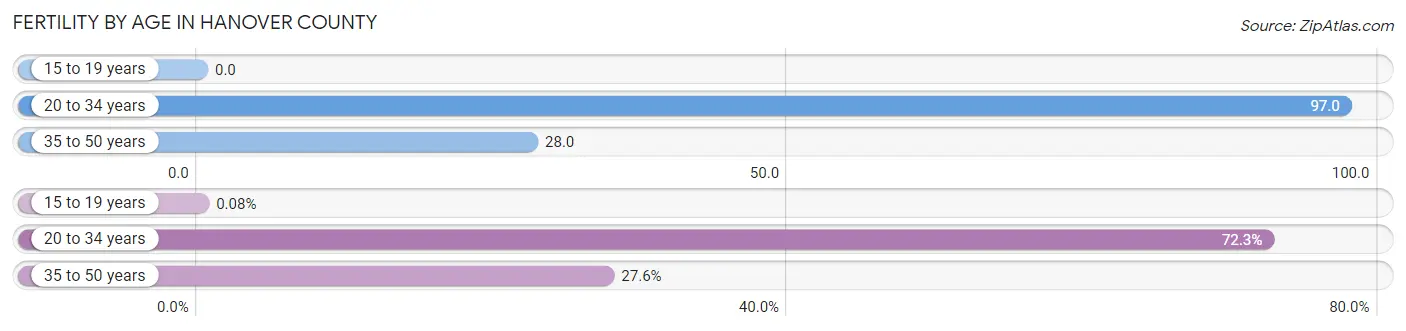
| Age Bracket | Women with Births | Births / 1,000 Women |
| 15 to 19 years | 1 (0.1%) | 0.0 |
| 20 to 34 years | 855 (72.3%) | 97.0 |
| 35 to 50 years | 326 (27.6%) | 28.0 |
| Total | 1,182 (100.0%) | 49.0 |
Fertility by Age by Marriage Status in Hanover County
78.0% of women with births (1,182) in Hanover County are married. The highest percentage of unmarried women with births falls into 15 to 19 years age bracket with 100.0% of them unmarried at the time of birth, while the lowest percentage of unmarried women with births belong to 35 to 50 years age bracket with 6.8% of them unmarried.
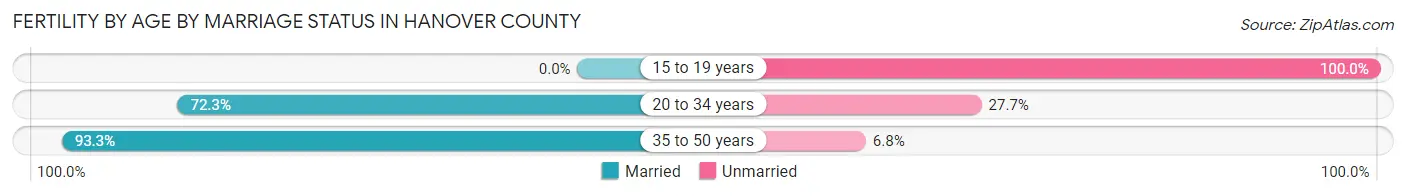
| Age Bracket | Married | Unmarried |
| 15 to 19 years | 0 (0.0%) | 1 (100.0%) |
| 20 to 34 years | 618 (72.3%) | 237 (27.7%) |
| 35 to 50 years | 304 (93.2%) | 22 (6.8%) |
| Total | 922 (78.0%) | 260 (22.0%) |
Fertility by Education in Hanover County
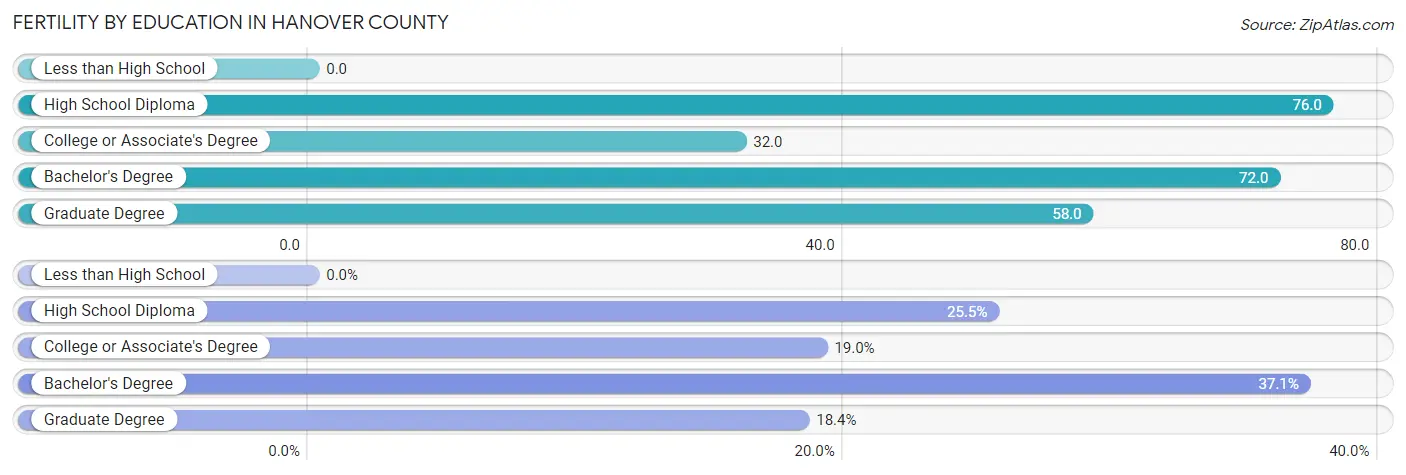
| Educational Attainment | Women with Births | Births / 1,000 Women |
| Less than High School | 0 (0.0%) | 0.0 |
| High School Diploma | 301 (25.5%) | 76.0 |
| College or Associate's Degree | 225 (19.0%) | 32.0 |
| Bachelor's Degree | 439 (37.1%) | 72.0 |
| Graduate Degree | 217 (18.4%) | 58.0 |
| Total | 1,182 (100.0%) | 49.0 |
Fertility by Education by Marriage Status in Hanover County
22.0% of women with births in Hanover County are unmarried. Women with the educational attainment of bachelor's degree are most likely to be married with 98.0% of them married at childbirth, while women with the educational attainment of graduate degree are least likely to be married with 35.0% of them unmarried at childbirth.
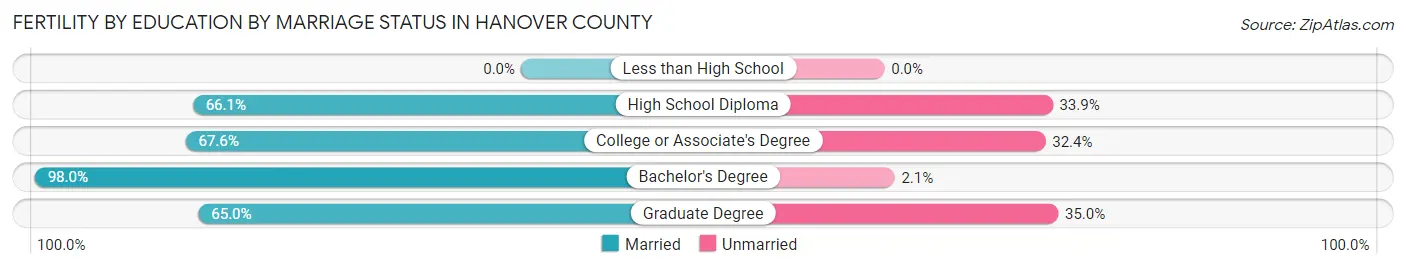
| Educational Attainment | Married | Unmarried |
| Less than High School | 0 (0.0%) | 0 (0.0%) |
| High School Diploma | 199 (66.1%) | 102 (33.9%) |
| College or Associate's Degree | 152 (67.6%) | 73 (32.4%) |
| Bachelor's Degree | 430 (98.0%) | 9 (2.1%) |
| Graduate Degree | 141 (65.0%) | 76 (35.0%) |
| Total | 922 (78.0%) | 260 (22.0%) |
Employment Characteristics in Hanover County
Employment by Class of Employer in Hanover County
Among the 56,934 employed individuals in Hanover County, private company employees (37,126 | 65.2%), local government employees (5,254 | 9.2%), and not-for-profit organizations (4,530 | 8.0%) make up the most common classes of employment.
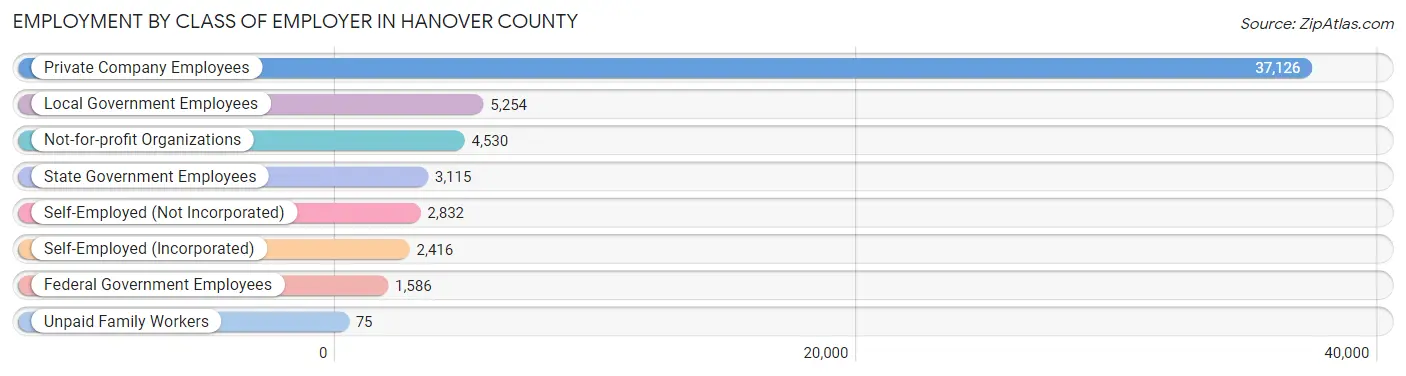
| Employer Class | # Employees | % Employees |
| Private Company Employees | 37,126 | 65.2% |
| Self-Employed (Incorporated) | 2,416 | 4.2% |
| Self-Employed (Not Incorporated) | 2,832 | 5.0% |
| Not-for-profit Organizations | 4,530 | 8.0% |
| Local Government Employees | 5,254 | 9.2% |
| State Government Employees | 3,115 | 5.5% |
| Federal Government Employees | 1,586 | 2.8% |
| Unpaid Family Workers | 75 | 0.1% |
| Total | 56,934 | 100.0% |
Employment Status by Age in Hanover County
According to the labor force statistics for Hanover County, out of the total population over 16 years of age (89,582), 66.4% or 59,482 individuals are in the labor force, with 2.9% or 1,725 of them unemployed. The age group with the highest labor force participation rate is 30 to 34 years, with 89.9% or 5,559 individuals in the labor force. Within the labor force, the 16 to 19 years age range has the highest percentage of unemployed individuals, with 8.0% or 230 of them being unemployed.
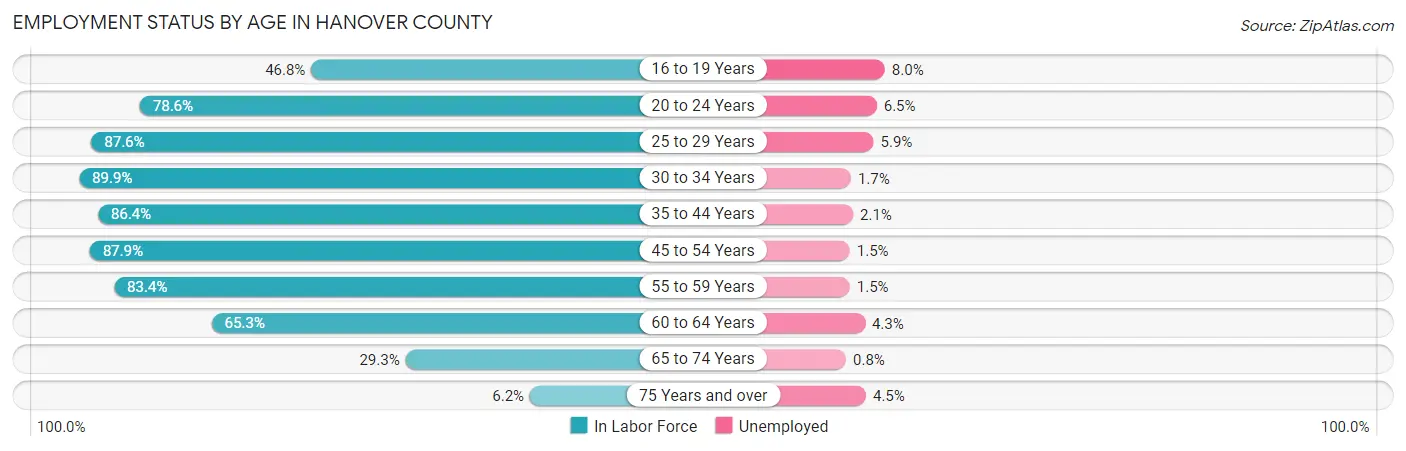
| Age Bracket | In Labor Force | Unemployed |
| 16 to 19 Years | 2,875 (46.8%) | 230 (8.0%) |
| 20 to 24 Years | 5,100 (78.6%) | 332 (6.5%) |
| 25 to 29 Years | 4,547 (87.6%) | 268 (5.9%) |
| 30 to 34 Years | 5,559 (89.9%) | 95 (1.7%) |
| 35 to 44 Years | 11,883 (86.4%) | 250 (2.1%) |
| 45 to 54 Years | 13,181 (87.9%) | 198 (1.5%) |
| 55 to 59 Years | 7,043 (83.4%) | 106 (1.5%) |
| 60 to 64 Years | 5,206 (65.3%) | 224 (4.3%) |
| 65 to 74 Years | 3,565 (29.3%) | 29 (0.8%) |
| 75 Years and over | 511 (6.2%) | 23 (4.5%) |
| Total | 59,482 (66.4%) | 1,725 (2.9%) |
Employment Status by Educational Attainment in Hanover County
According to labor force statistics for Hanover County, 83.9% of individuals (47,437) out of the total population between 25 and 64 years of age (56,540) are in the labor force, with 2.4% or 1,138 of them being unemployed. The group with the highest labor force participation rate are those with the educational attainment of bachelor's degree or higher, with 88.7% or 22,824 individuals in the labor force. Within the labor force, individuals with high school diploma education have the highest percentage of unemployment, with 4.5% or 411 of them being unemployed.
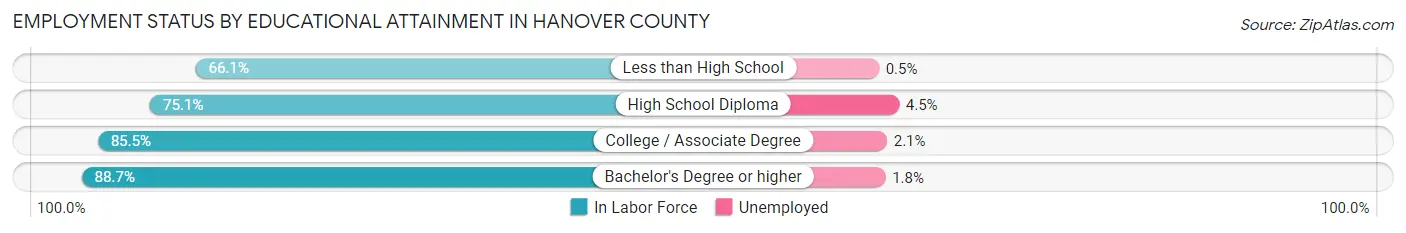
| Educational Attainment | In Labor Force | Unemployed |
| Less than High School | 1,643 (66.1%) | 12 (0.5%) |
| High School Diploma | 9,144 (75.1%) | 548 (4.5%) |
| College / Associate Degree | 13,806 (85.5%) | 339 (2.1%) |
| Bachelor's Degree or higher | 22,824 (88.7%) | 463 (1.8%) |
| Total | 47,437 (83.9%) | 1,357 (2.4%) |
Employment Occupations by Sex in Hanover County
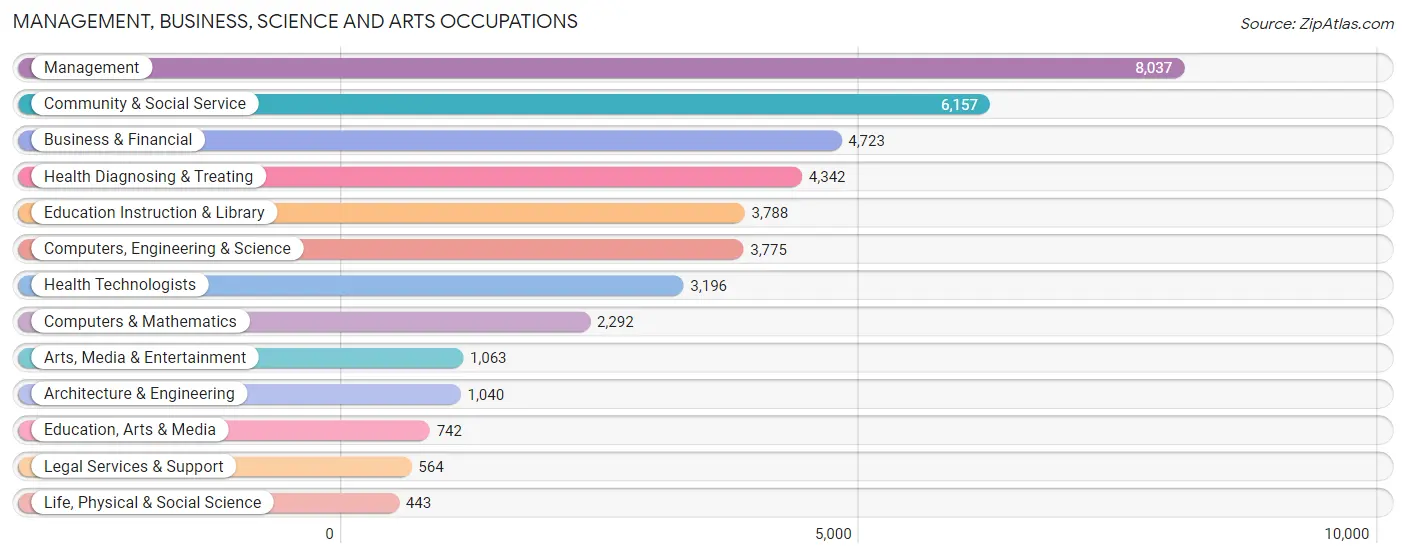
Management, Business, Science and Arts Occupations
The most common Management, Business, Science and Arts occupations in Hanover County are Management (8,037 | 14.0%), Community & Social Service (6,157 | 10.7%), Business & Financial (4,723 | 8.2%), Health Diagnosing & Treating (4,342 | 7.5%), and Education Instruction & Library (3,788 | 6.6%).
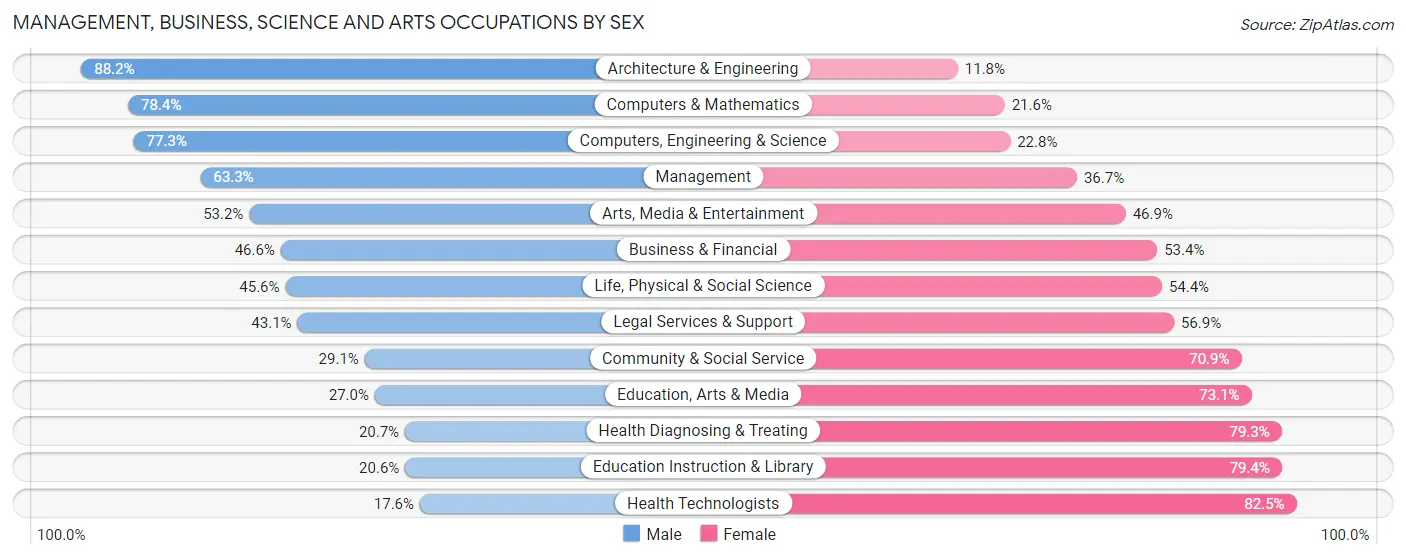
Management, Business, Science and Arts Occupations by Sex
Within the Management, Business, Science and Arts occupations in Hanover County, the most male-oriented occupations are Architecture & Engineering (88.2%), Computers & Mathematics (78.4%), and Computers, Engineering & Science (77.2%), while the most female-oriented occupations are Health Technologists (82.5%), Education Instruction & Library (79.4%), and Health Diagnosing & Treating (79.3%).
| Occupation | Male | Female |
| Management | 5,089 (63.3%) | 2,948 (36.7%) |
| Business & Financial | 2,200 (46.6%) | 2,523 (53.4%) |
| Computers, Engineering & Science | 2,916 (77.2%) | 859 (22.8%) |
| Computers & Mathematics | 1,797 (78.4%) | 495 (21.6%) |
| Architecture & Engineering | 917 (88.2%) | 123 (11.8%) |
| Life, Physical & Social Science | 202 (45.6%) | 241 (54.4%) |
| Community & Social Service | 1,789 (29.1%) | 4,368 (70.9%) |
| Education, Arts & Media | 200 (27.0%) | 542 (73.1%) |
| Legal Services & Support | 243 (43.1%) | 321 (56.9%) |
| Education Instruction & Library | 781 (20.6%) | 3,007 (79.4%) |
| Arts, Media & Entertainment | 565 (53.1%) | 498 (46.9%) |
| Health Diagnosing & Treating | 897 (20.7%) | 3,445 (79.3%) |
| Health Technologists | 561 (17.5%) | 2,635 (82.5%) |
| Total (Category) | 12,891 (47.7%) | 14,143 (52.3%) |
| Total (Overall) | 30,178 (52.4%) | 27,434 (47.6%) |
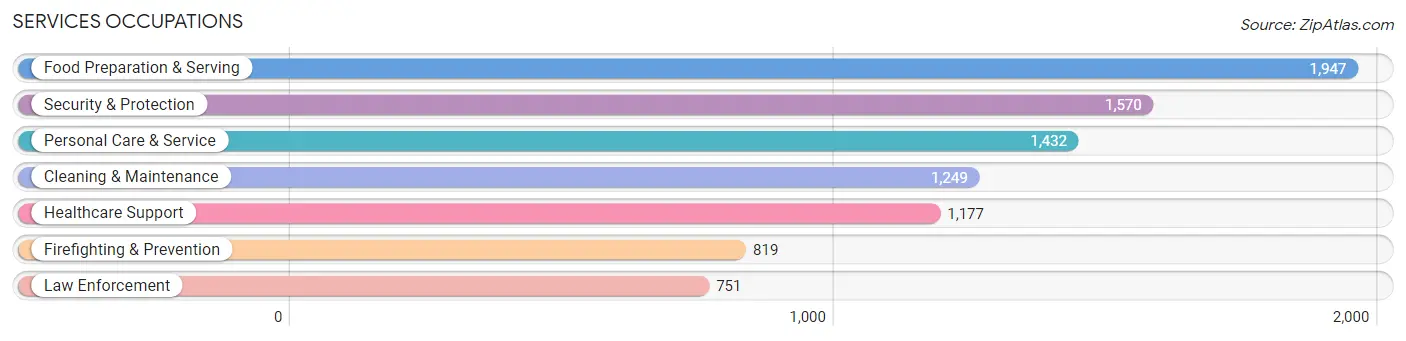
Services Occupations
The most common Services occupations in Hanover County are Food Preparation & Serving (1,947 | 3.4%), Security & Protection (1,570 | 2.7%), Personal Care & Service (1,432 | 2.5%), Cleaning & Maintenance (1,249 | 2.2%), and Healthcare Support (1,177 | 2.0%).
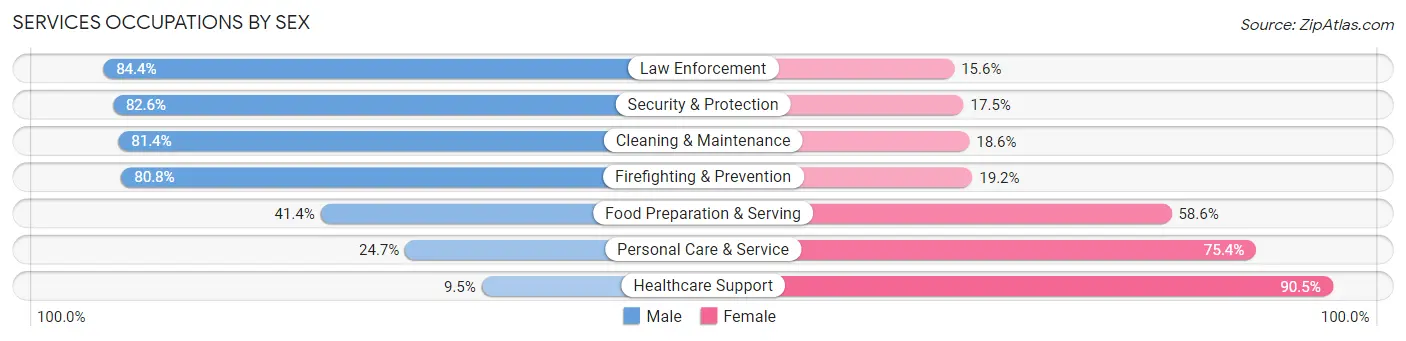
Services Occupations by Sex
Within the Services occupations in Hanover County, the most male-oriented occupations are Law Enforcement (84.4%), Security & Protection (82.6%), and Cleaning & Maintenance (81.4%), while the most female-oriented occupations are Healthcare Support (90.5%), Personal Care & Service (75.3%), and Food Preparation & Serving (58.6%).
| Occupation | Male | Female |
| Healthcare Support | 112 (9.5%) | 1,065 (90.5%) |
| Security & Protection | 1,296 (82.6%) | 274 (17.4%) |
| Firefighting & Prevention | 662 (80.8%) | 157 (19.2%) |
| Law Enforcement | 634 (84.4%) | 117 (15.6%) |
| Food Preparation & Serving | 806 (41.4%) | 1,141 (58.6%) |
| Cleaning & Maintenance | 1,017 (81.4%) | 232 (18.6%) |
| Personal Care & Service | 353 (24.6%) | 1,079 (75.3%) |
| Total (Category) | 3,584 (48.6%) | 3,791 (51.4%) |
| Total (Overall) | 30,178 (52.4%) | 27,434 (47.6%) |
Sales and Office Occupations
The most common Sales and Office occupations in Hanover County are Office & Administration (6,456 | 11.2%), and Sales & Related (6,153 | 10.7%).

Sales and Office Occupations by Sex
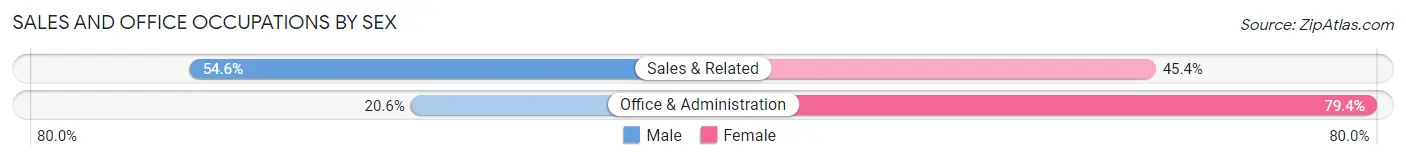
| Occupation | Male | Female |
| Sales & Related | 3,359 (54.6%) | 2,794 (45.4%) |
| Office & Administration | 1,331 (20.6%) | 5,125 (79.4%) |
| Total (Category) | 4,690 (37.2%) | 7,919 (62.8%) |
| Total (Overall) | 30,178 (52.4%) | 27,434 (47.6%) |
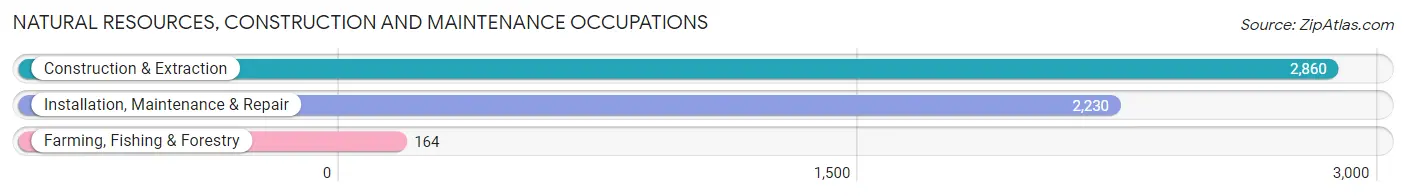
Natural Resources, Construction and Maintenance Occupations
The most common Natural Resources, Construction and Maintenance occupations in Hanover County are Construction & Extraction (2,860 | 5.0%), Installation, Maintenance & Repair (2,230 | 3.9%), and Farming, Fishing & Forestry (164 | 0.3%).
Natural Resources, Construction and Maintenance Occupations by Sex
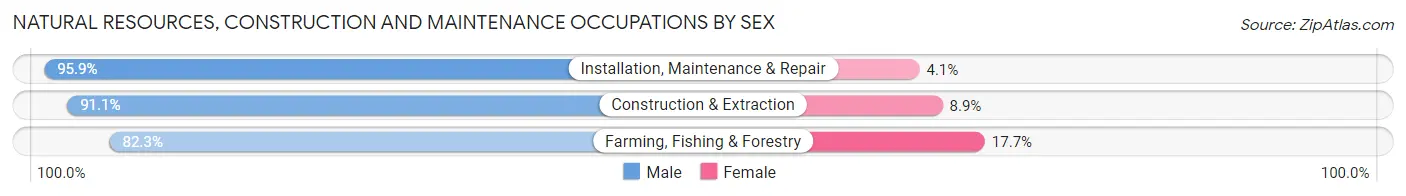
| Occupation | Male | Female |
| Farming, Fishing & Forestry | 135 (82.3%) | 29 (17.7%) |
| Construction & Extraction | 2,606 (91.1%) | 254 (8.9%) |
| Installation, Maintenance & Repair | 2,139 (95.9%) | 91 (4.1%) |
| Total (Category) | 4,880 (92.9%) | 374 (7.1%) |
| Total (Overall) | 30,178 (52.4%) | 27,434 (47.6%) |
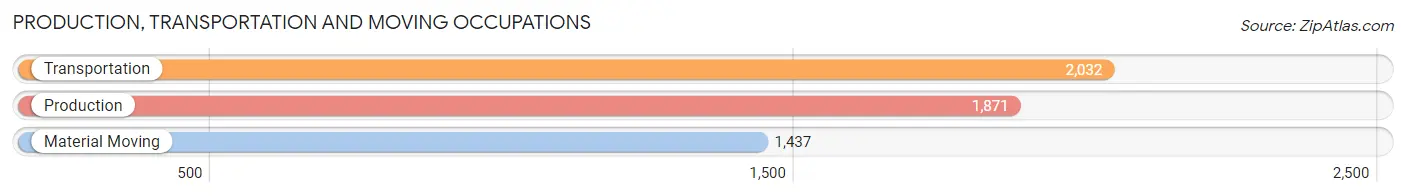
Production, Transportation and Moving Occupations
The most common Production, Transportation and Moving occupations in Hanover County are Transportation (2,032 | 3.5%), Production (1,871 | 3.3%), and Material Moving (1,437 | 2.5%).
Production, Transportation and Moving Occupations by Sex
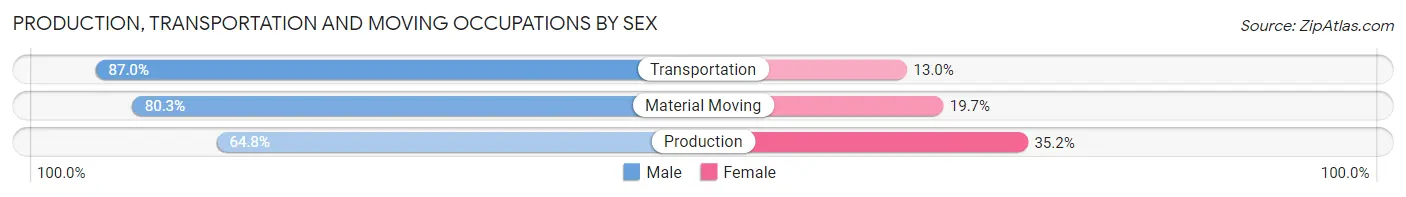
| Occupation | Male | Female |
| Production | 1,212 (64.8%) | 659 (35.2%) |
| Transportation | 1,767 (87.0%) | 265 (13.0%) |
| Material Moving | 1,154 (80.3%) | 283 (19.7%) |
| Total (Category) | 4,133 (77.4%) | 1,207 (22.6%) |
| Total (Overall) | 30,178 (52.4%) | 27,434 (47.6%) |
Employment Industries by Sex in Hanover County
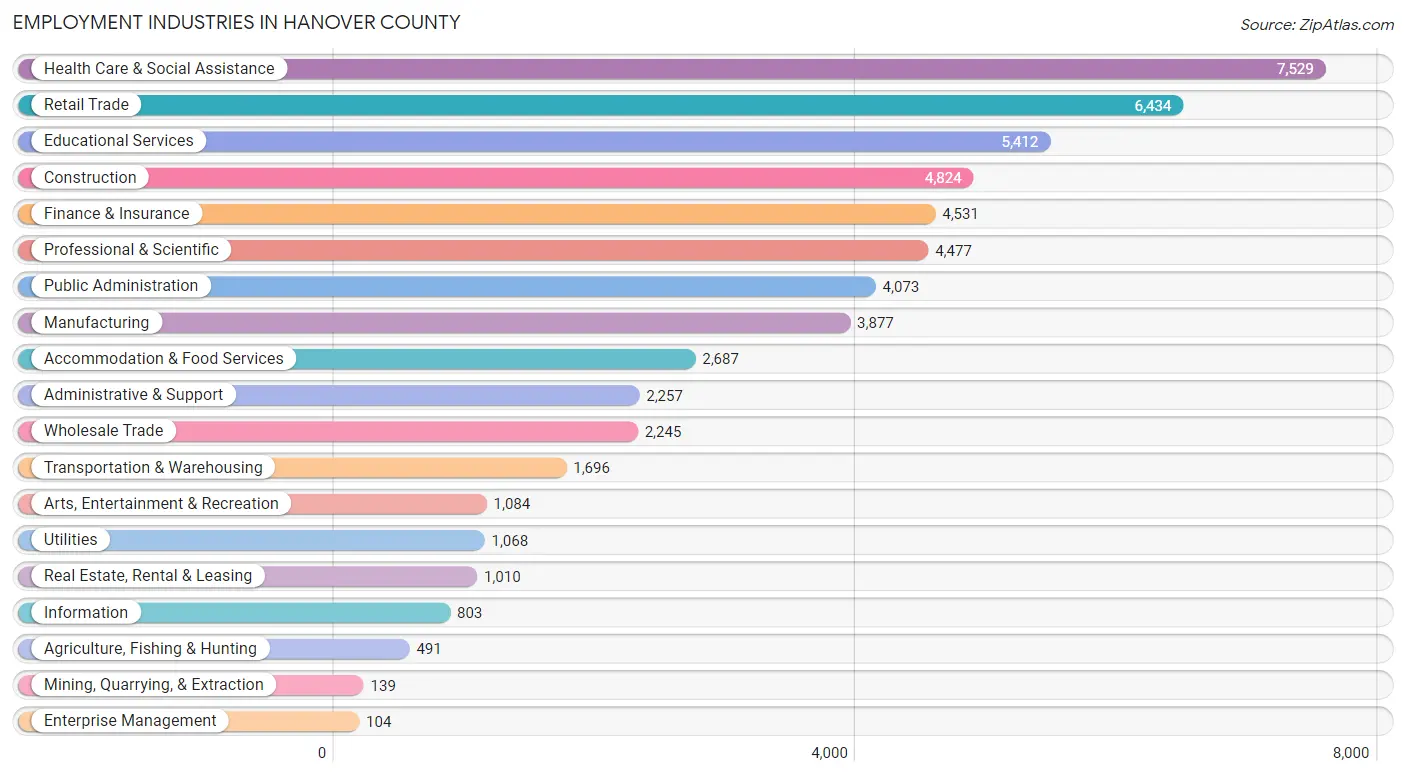
Employment Industries in Hanover County
The major employment industries in Hanover County include Health Care & Social Assistance (7,529 | 13.1%), Retail Trade (6,434 | 11.2%), Educational Services (5,412 | 9.4%), Construction (4,824 | 8.4%), and Finance & Insurance (4,531 | 7.9%).
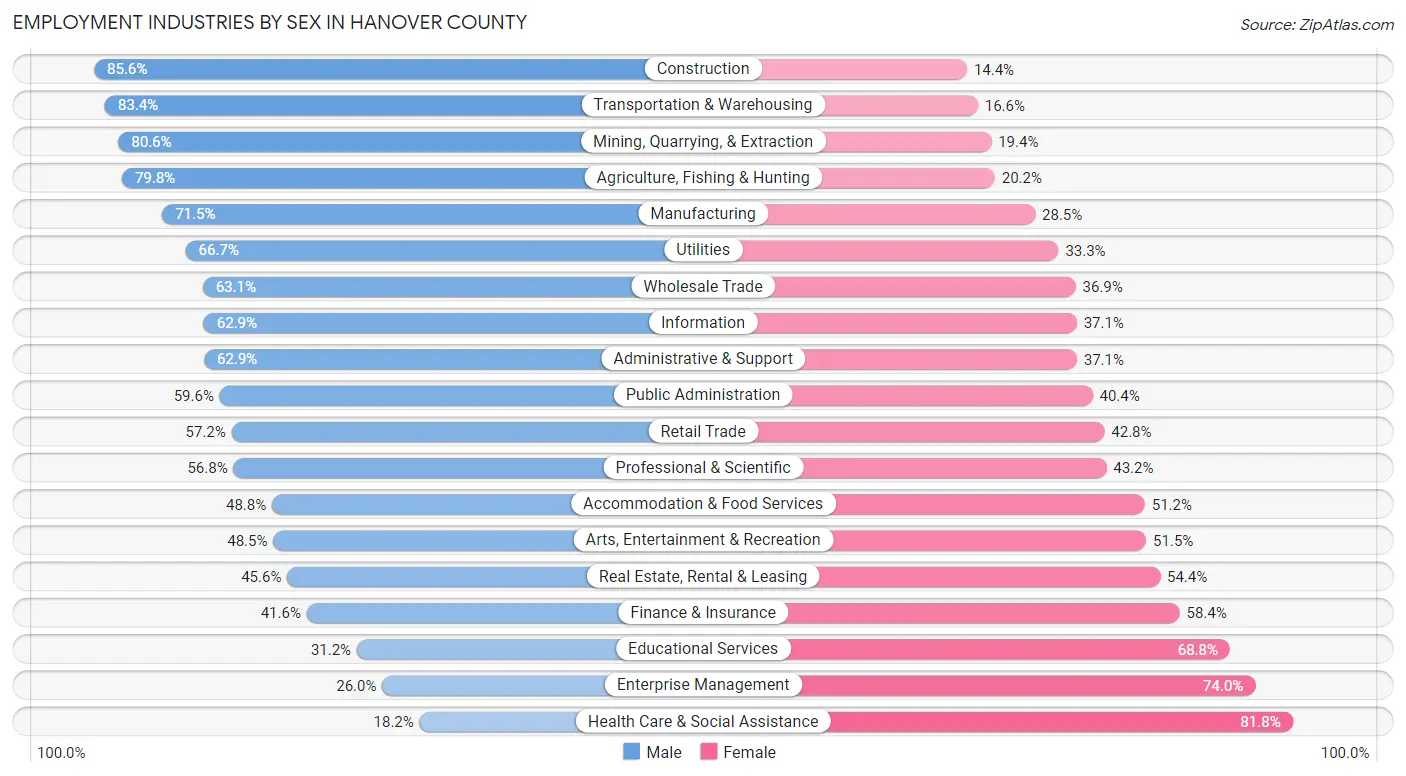
Employment Industries by Sex in Hanover County
The Hanover County industries that see more men than women are Construction (85.6%), Transportation & Warehousing (83.4%), and Mining, Quarrying, & Extraction (80.6%), whereas the industries that tend to have a higher number of women are Health Care & Social Assistance (81.8%), Enterprise Management (74.0%), and Educational Services (68.8%).
| Industry | Male | Female |
| Agriculture, Fishing & Hunting | 392 (79.8%) | 99 (20.2%) |
| Mining, Quarrying, & Extraction | 112 (80.6%) | 27 (19.4%) |
| Construction | 4,130 (85.6%) | 694 (14.4%) |
| Manufacturing | 2,772 (71.5%) | 1,105 (28.5%) |
| Wholesale Trade | 1,417 (63.1%) | 828 (36.9%) |
| Retail Trade | 3,678 (57.2%) | 2,756 (42.8%) |
| Transportation & Warehousing | 1,414 (83.4%) | 282 (16.6%) |
| Utilities | 712 (66.7%) | 356 (33.3%) |
| Information | 505 (62.9%) | 298 (37.1%) |
| Finance & Insurance | 1,885 (41.6%) | 2,646 (58.4%) |
| Real Estate, Rental & Leasing | 461 (45.6%) | 549 (54.4%) |
| Professional & Scientific | 2,541 (56.8%) | 1,936 (43.2%) |
| Enterprise Management | 27 (26.0%) | 77 (74.0%) |
| Administrative & Support | 1,419 (62.9%) | 838 (37.1%) |
| Educational Services | 1,689 (31.2%) | 3,723 (68.8%) |
| Health Care & Social Assistance | 1,373 (18.2%) | 6,156 (81.8%) |
| Arts, Entertainment & Recreation | 526 (48.5%) | 558 (51.5%) |
| Accommodation & Food Services | 1,311 (48.8%) | 1,376 (51.2%) |
| Public Administration | 2,428 (59.6%) | 1,645 (40.4%) |
| Total | 30,178 (52.4%) | 27,434 (47.6%) |
Education in Hanover County
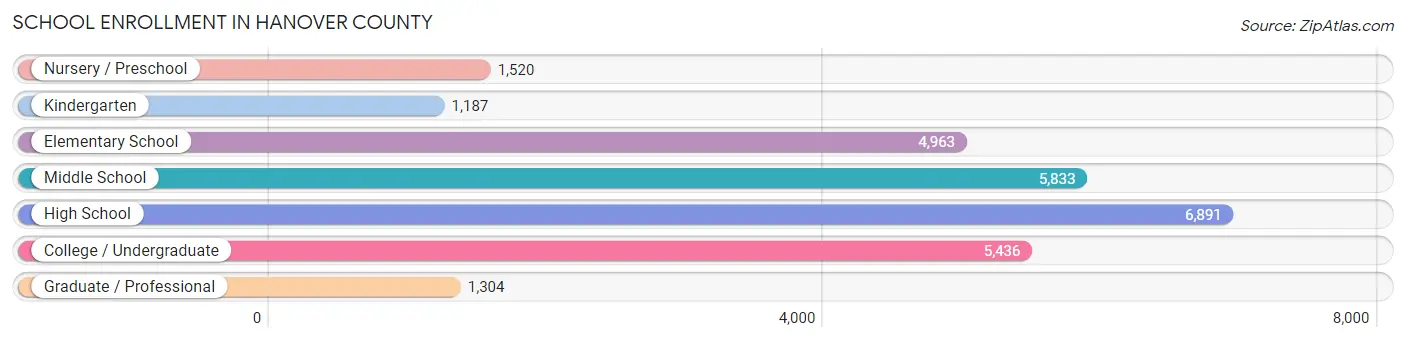
School Enrollment in Hanover County
The most common levels of schooling among the 27,134 students in Hanover County are high school (6,891 | 25.4%), middle school (5,833 | 21.5%), and college / undergraduate (5,436 | 20.0%).
| School Level | # Students | % Students |
| Nursery / Preschool | 1,520 | 5.6% |
| Kindergarten | 1,187 | 4.4% |
| Elementary School | 4,963 | 18.3% |
| Middle School | 5,833 | 21.5% |
| High School | 6,891 | 25.4% |
| College / Undergraduate | 5,436 | 20.0% |
| Graduate / Professional | 1,304 | 4.8% |
| Total | 27,134 | 100.0% |
School Enrollment by Age by Funding Source in Hanover County
Out of a total of 27,134 students who are enrolled in schools in Hanover County, 5,400 (19.9%) attend a private institution, while the remaining 21,734 (80.1%) are enrolled in public schools. The age group of 3 to 4 year olds has the highest likelihood of being enrolled in private schools, with 716 (58.7% in the age bracket) enrolled. Conversely, the age group of 10 to 14 year olds has the lowest likelihood of being enrolled in a private school, with 6,747 (92.4% in the age bracket) attending a public institution.
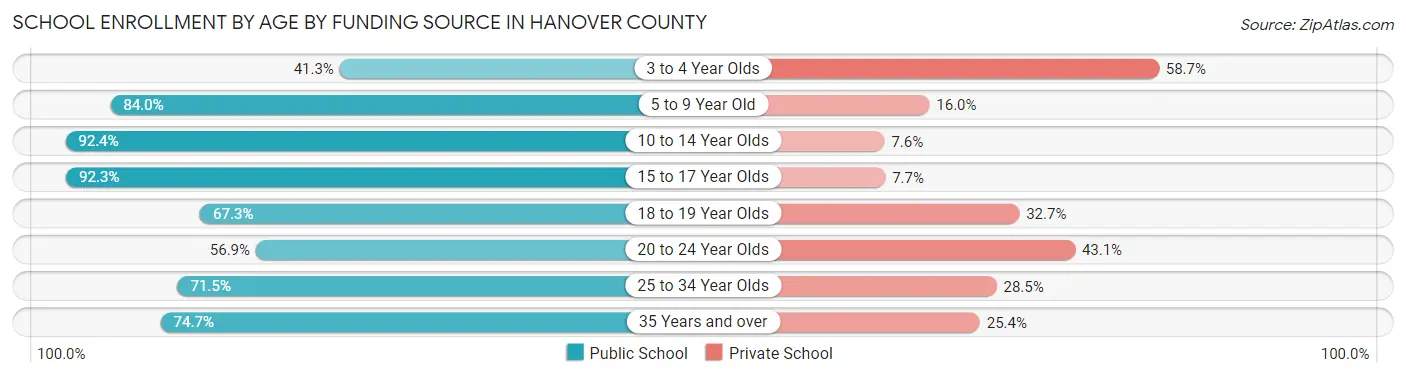
| Age Bracket | Public School | Private School |
| 3 to 4 Year Olds | 504 (41.3%) | 716 (58.7%) |
| 5 to 9 Year Old | 4,951 (84.0%) | 940 (16.0%) |
| 10 to 14 Year Olds | 6,747 (92.4%) | 555 (7.6%) |
| 15 to 17 Year Olds | 4,289 (92.3%) | 360 (7.7%) |
| 18 to 19 Year Olds | 1,702 (67.3%) | 827 (32.7%) |
| 20 to 24 Year Olds | 1,751 (56.9%) | 1,325 (43.1%) |
| 25 to 34 Year Olds | 884 (71.5%) | 352 (28.5%) |
| 35 Years and over | 919 (74.7%) | 312 (25.4%) |
| Total | 21,734 (80.1%) | 5,400 (19.9%) |
Educational Attainment by Field of Study in Hanover County
Business (6,670 | 19.1%), science & technology (3,718 | 10.7%), education (3,503 | 10.1%), social sciences (3,320 | 9.5%), and arts & humanities (2,181 | 6.3%) are the most common fields of study among 34,866 individuals in Hanover County who have obtained a bachelor's degree or higher.
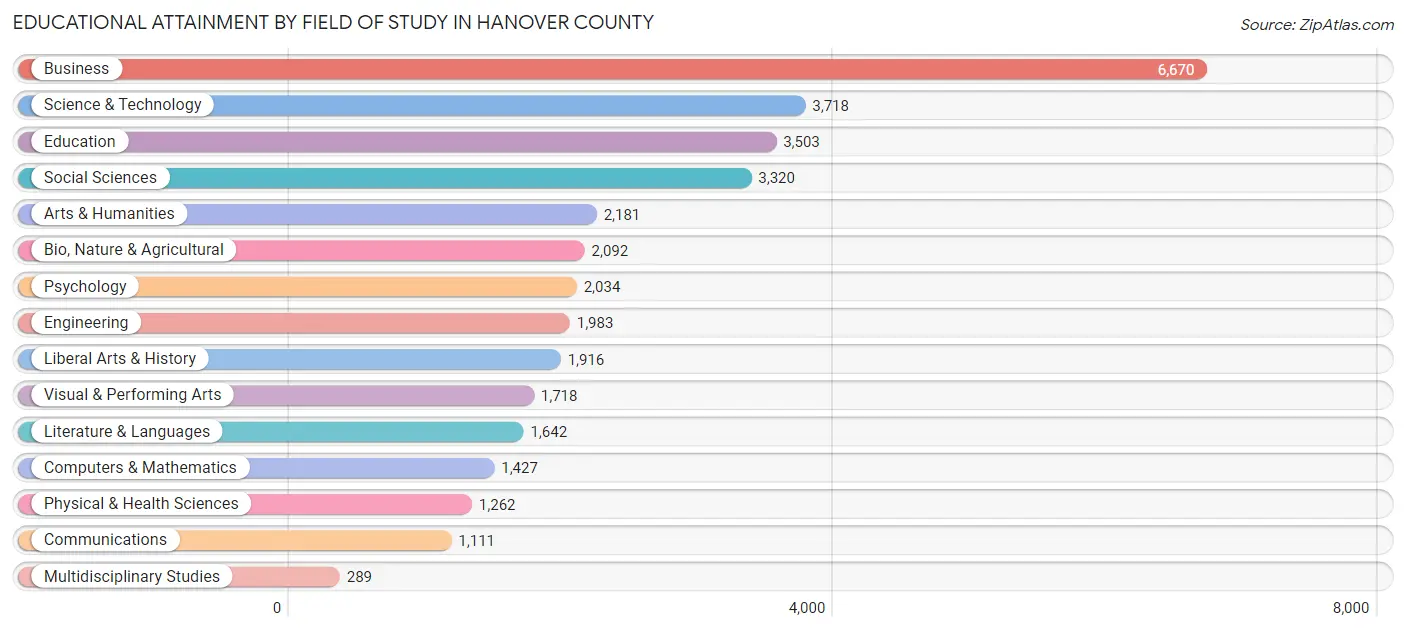
| Field of Study | # Graduates | % Graduates |
| Computers & Mathematics | 1,427 | 4.1% |
| Bio, Nature & Agricultural | 2,092 | 6.0% |
| Physical & Health Sciences | 1,262 | 3.6% |
| Psychology | 2,034 | 5.8% |
| Social Sciences | 3,320 | 9.5% |
| Engineering | 1,983 | 5.7% |
| Multidisciplinary Studies | 289 | 0.8% |
| Science & Technology | 3,718 | 10.7% |
| Business | 6,670 | 19.1% |
| Education | 3,503 | 10.1% |
| Literature & Languages | 1,642 | 4.7% |
| Liberal Arts & History | 1,916 | 5.5% |
| Visual & Performing Arts | 1,718 | 4.9% |
| Communications | 1,111 | 3.2% |
| Arts & Humanities | 2,181 | 6.3% |
| Total | 34,866 | 100.0% |
Transportation & Commute in Hanover County
Vehicle Availability by Sex in Hanover County
The most prevalent vehicle ownership categories in Hanover County are males with 2 vehicles (10,802, accounting for 36.2%) and females with 2 vehicles (9,192, making up 40.3%).
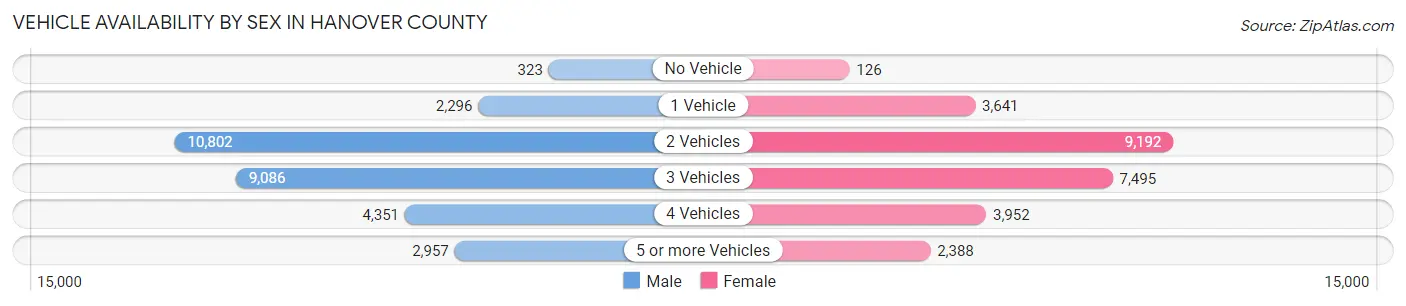
| Vehicles Available | Male | Female |
| No Vehicle | 323 (1.1%) | 126 (0.5%) |
| 1 Vehicle | 2,296 (7.7%) | 3,641 (13.6%) |
| 2 Vehicles | 10,802 (36.2%) | 9,192 (34.3%) |
| 3 Vehicles | 9,086 (30.5%) | 7,495 (28.0%) |
| 4 Vehicles | 4,351 (14.6%) | 3,952 (14.7%) |
| 5 or more Vehicles | 2,957 (9.9%) | 2,388 (8.9%) |
| Total | 29,815 (100.0%) | 26,794 (100.0%) |
Commute Time in Hanover County
The most frequently occuring commute durations in Hanover County are 20 to 24 minutes (9,587 commuters, 19.7%), 30 to 34 minutes (8,538 commuters, 17.5%), and 15 to 19 minutes (6,406 commuters, 13.1%).
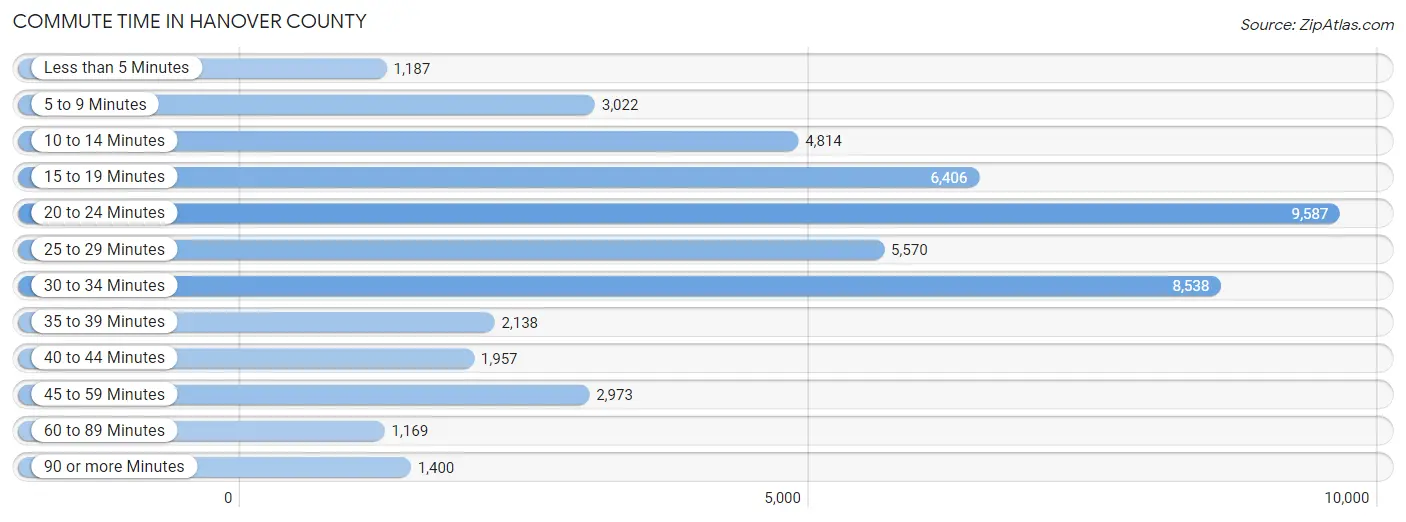
| Commute Time | # Commuters | % Commuters |
| Less than 5 Minutes | 1,187 | 2.4% |
| 5 to 9 Minutes | 3,022 | 6.2% |
| 10 to 14 Minutes | 4,814 | 9.9% |
| 15 to 19 Minutes | 6,406 | 13.1% |
| 20 to 24 Minutes | 9,587 | 19.7% |
| 25 to 29 Minutes | 5,570 | 11.4% |
| 30 to 34 Minutes | 8,538 | 17.5% |
| 35 to 39 Minutes | 2,138 | 4.4% |
| 40 to 44 Minutes | 1,957 | 4.0% |
| 45 to 59 Minutes | 2,973 | 6.1% |
| 60 to 89 Minutes | 1,169 | 2.4% |
| 90 or more Minutes | 1,400 | 2.9% |
Commute Time by Sex in Hanover County
The most common commute times in Hanover County are 20 to 24 minutes (5,248 commuters, 20.0%) for males and 20 to 24 minutes (4,339 commuters, 19.2%) for females.
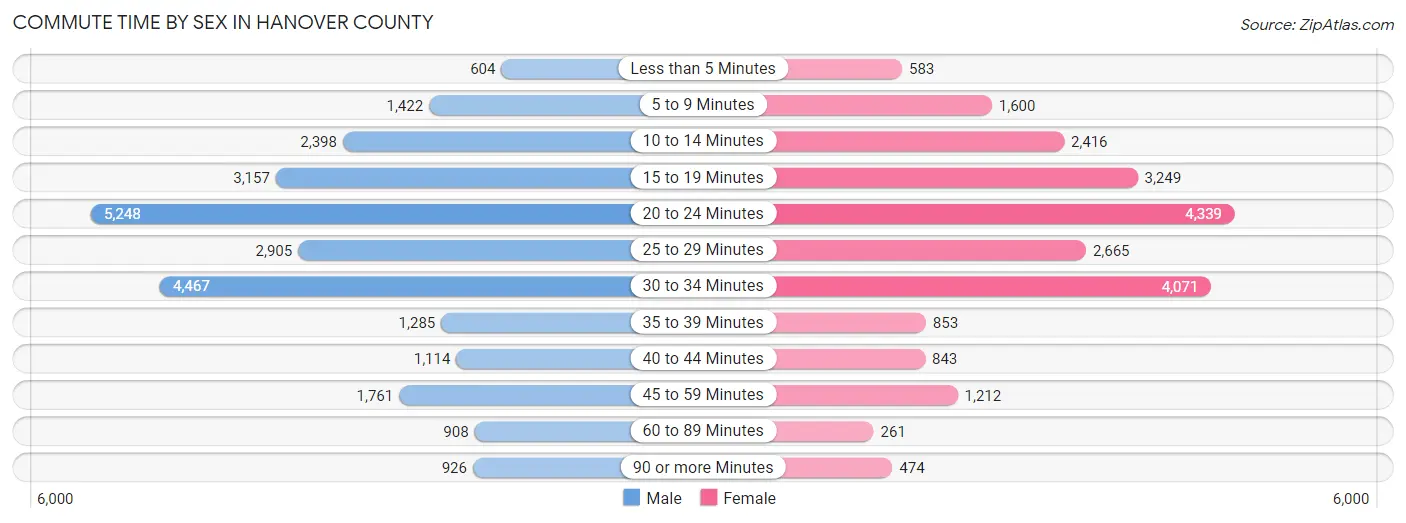
| Commute Time | Male | Female |
| Less than 5 Minutes | 604 (2.3%) | 583 (2.6%) |
| 5 to 9 Minutes | 1,422 (5.4%) | 1,600 (7.1%) |
| 10 to 14 Minutes | 2,398 (9.1%) | 2,416 (10.7%) |
| 15 to 19 Minutes | 3,157 (12.0%) | 3,249 (14.4%) |
| 20 to 24 Minutes | 5,248 (20.0%) | 4,339 (19.2%) |
| 25 to 29 Minutes | 2,905 (11.1%) | 2,665 (11.8%) |
| 30 to 34 Minutes | 4,467 (17.1%) | 4,071 (18.0%) |
| 35 to 39 Minutes | 1,285 (4.9%) | 853 (3.8%) |
| 40 to 44 Minutes | 1,114 (4.3%) | 843 (3.7%) |
| 45 to 59 Minutes | 1,761 (6.7%) | 1,212 (5.4%) |
| 60 to 89 Minutes | 908 (3.5%) | 261 (1.2%) |
| 90 or more Minutes | 926 (3.5%) | 474 (2.1%) |
Time of Departure to Work by Sex in Hanover County
The most frequent times of departure to work in Hanover County are 7:00 AM to 7:29 AM (4,380, 16.7%) for males and 7:00 AM to 7:29 AM (4,013, 17.8%) for females.
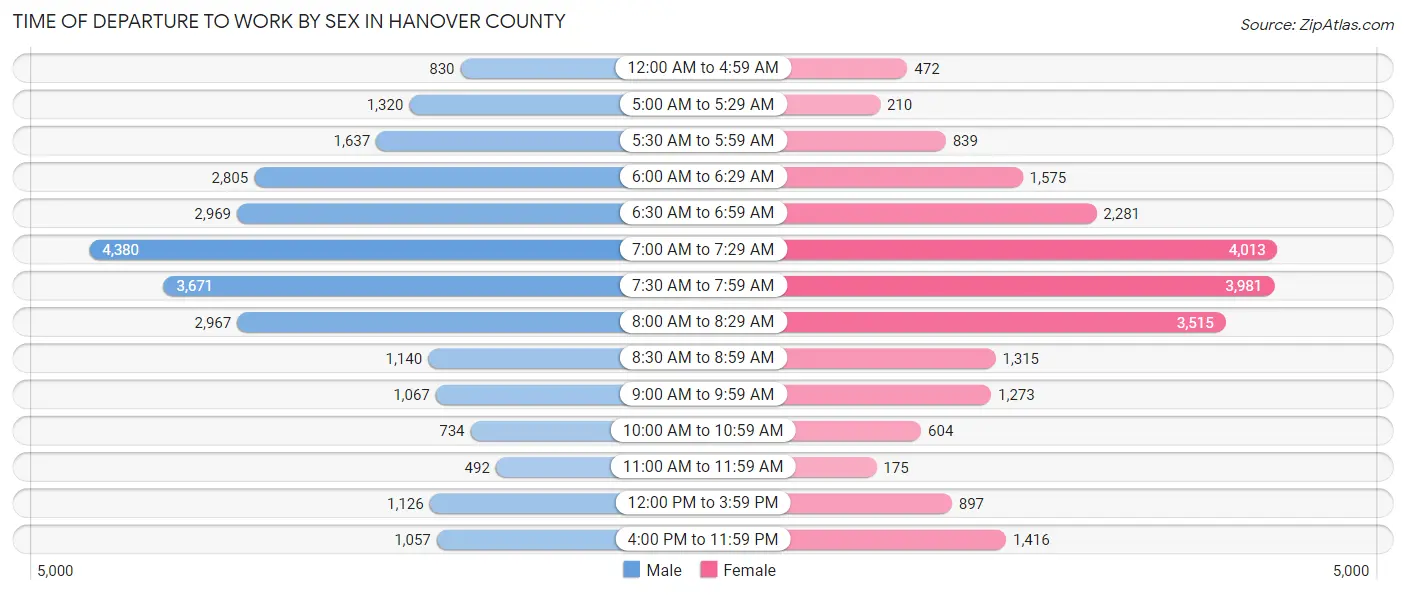
| Time of Departure | Male | Female |
| 12:00 AM to 4:59 AM | 830 (3.2%) | 472 (2.1%) |
| 5:00 AM to 5:29 AM | 1,320 (5.0%) | 210 (0.9%) |
| 5:30 AM to 5:59 AM | 1,637 (6.2%) | 839 (3.7%) |
| 6:00 AM to 6:29 AM | 2,805 (10.7%) | 1,575 (7.0%) |
| 6:30 AM to 6:59 AM | 2,969 (11.3%) | 2,281 (10.1%) |
| 7:00 AM to 7:29 AM | 4,380 (16.7%) | 4,013 (17.8%) |
| 7:30 AM to 7:59 AM | 3,671 (14.0%) | 3,981 (17.6%) |
| 8:00 AM to 8:29 AM | 2,967 (11.3%) | 3,515 (15.6%) |
| 8:30 AM to 8:59 AM | 1,140 (4.3%) | 1,315 (5.8%) |
| 9:00 AM to 9:59 AM | 1,067 (4.1%) | 1,273 (5.6%) |
| 10:00 AM to 10:59 AM | 734 (2.8%) | 604 (2.7%) |
| 11:00 AM to 11:59 AM | 492 (1.9%) | 175 (0.8%) |
| 12:00 PM to 3:59 PM | 1,126 (4.3%) | 897 (4.0%) |
| 4:00 PM to 11:59 PM | 1,057 (4.0%) | 1,416 (6.3%) |
| Total | 26,195 (100.0%) | 22,566 (100.0%) |
Housing Occupancy in Hanover County
Occupancy by Ownership in Hanover County
Of the total 41,383 dwellings in Hanover County, owner-occupied units account for 34,360 (83.0%), while renter-occupied units make up 7,023 (17.0%).
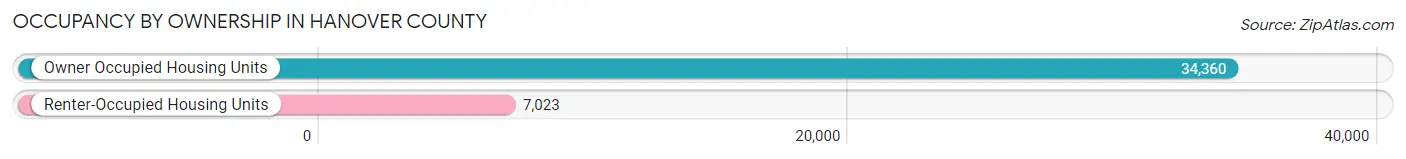
| Occupancy | # Housing Units | % Housing Units |
| Owner Occupied Housing Units | 34,360 | 83.0% |
| Renter-Occupied Housing Units | 7,023 | 17.0% |
| Total Occupied Housing Units | 41,383 | 100.0% |
Occupancy by Household Size in Hanover County
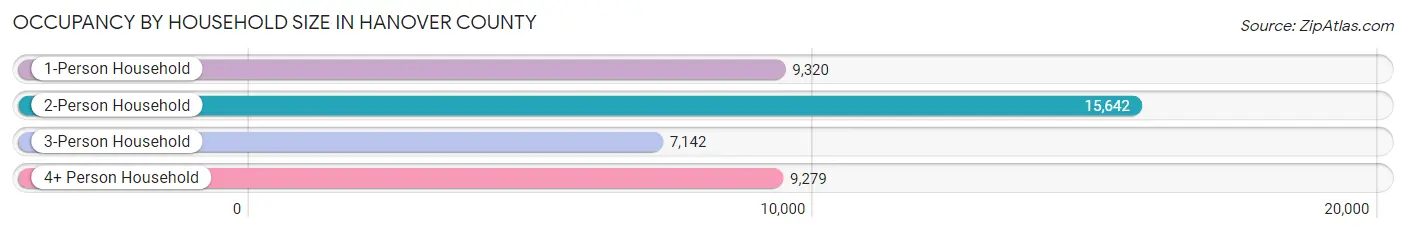
| Household Size | # Housing Units | % Housing Units |
| 1-Person Household | 9,320 | 22.5% |
| 2-Person Household | 15,642 | 37.8% |
| 3-Person Household | 7,142 | 17.3% |
| 4+ Person Household | 9,279 | 22.4% |
| Total Housing Units | 41,383 | 100.0% |
Occupancy by Ownership by Household Size in Hanover County
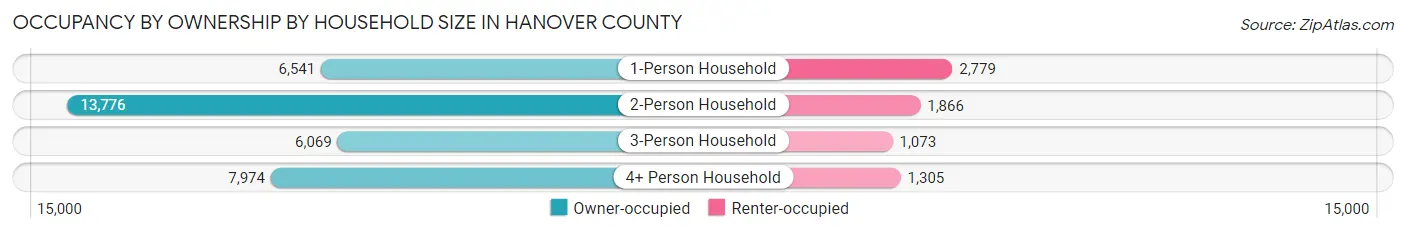
| Household Size | Owner-occupied | Renter-occupied |
| 1-Person Household | 6,541 (70.2%) | 2,779 (29.8%) |
| 2-Person Household | 13,776 (88.1%) | 1,866 (11.9%) |
| 3-Person Household | 6,069 (85.0%) | 1,073 (15.0%) |
| 4+ Person Household | 7,974 (85.9%) | 1,305 (14.1%) |
| Total Housing Units | 34,360 (83.0%) | 7,023 (17.0%) |
Occupancy by Educational Attainment in Hanover County
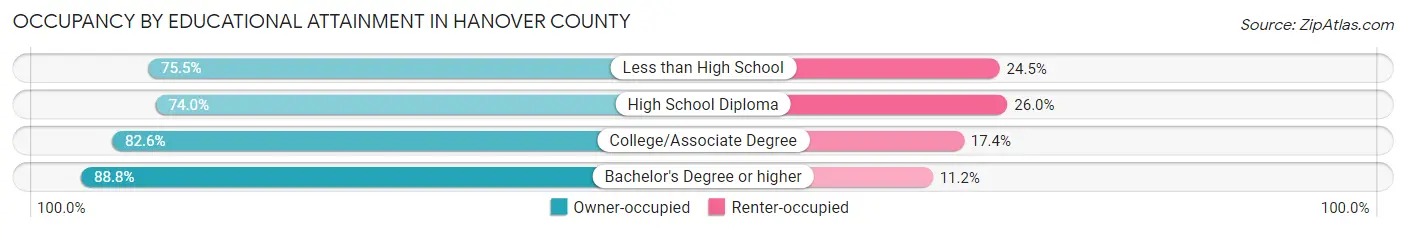
| Household Size | Owner-occupied | Renter-occupied |
| Less than High School | 1,851 (75.5%) | 600 (24.5%) |
| High School Diploma | 6,634 (74.0%) | 2,332 (26.0%) |
| College/Associate Degree | 9,820 (82.6%) | 2,064 (17.4%) |
| Bachelor's Degree or higher | 16,055 (88.8%) | 2,027 (11.2%) |
Occupancy by Age of Householder in Hanover County
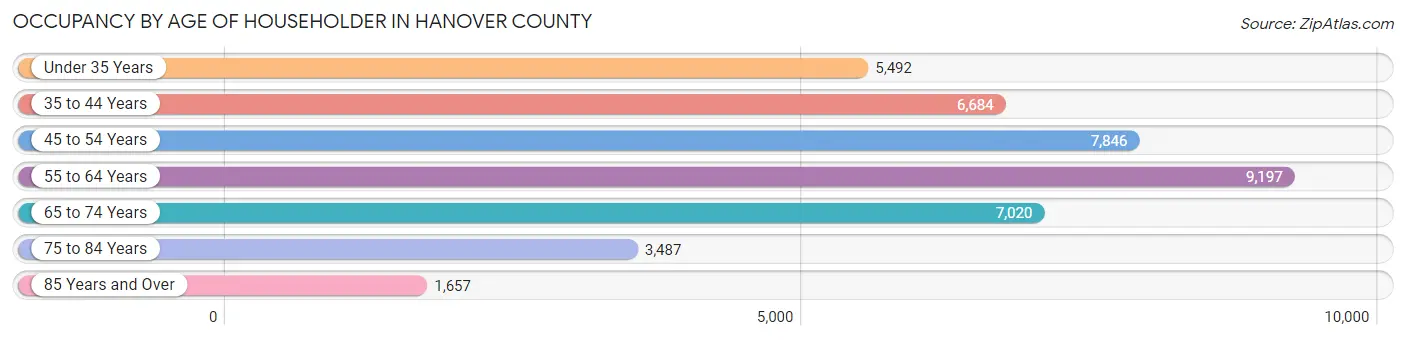
| Age Bracket | # Households | % Households |
| Under 35 Years | 5,492 | 13.3% |
| 35 to 44 Years | 6,684 | 16.2% |
| 45 to 54 Years | 7,846 | 19.0% |
| 55 to 64 Years | 9,197 | 22.2% |
| 65 to 74 Years | 7,020 | 17.0% |
| 75 to 84 Years | 3,487 | 8.4% |
| 85 Years and Over | 1,657 | 4.0% |
| Total | 41,383 | 100.0% |
Housing Finances in Hanover County
Median Income by Occupancy in Hanover County
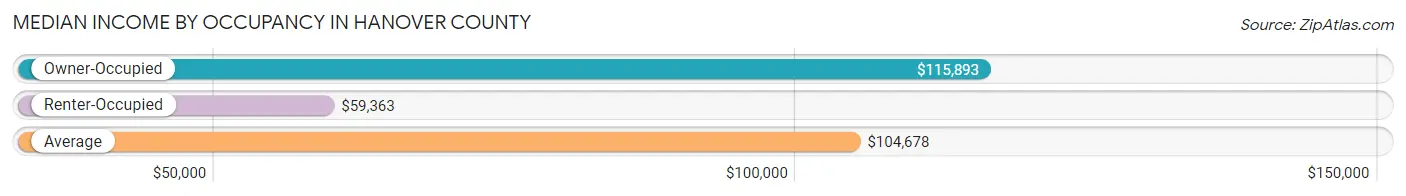
| Occupancy Type | # Households | Median Income |
| Owner-Occupied | 34,360 (83.0%) | $115,893 |
| Renter-Occupied | 7,023 (17.0%) | $59,363 |
| Average | 41,383 (100.0%) | $104,678 |
Occupancy by Householder Income Bracket in Hanover County
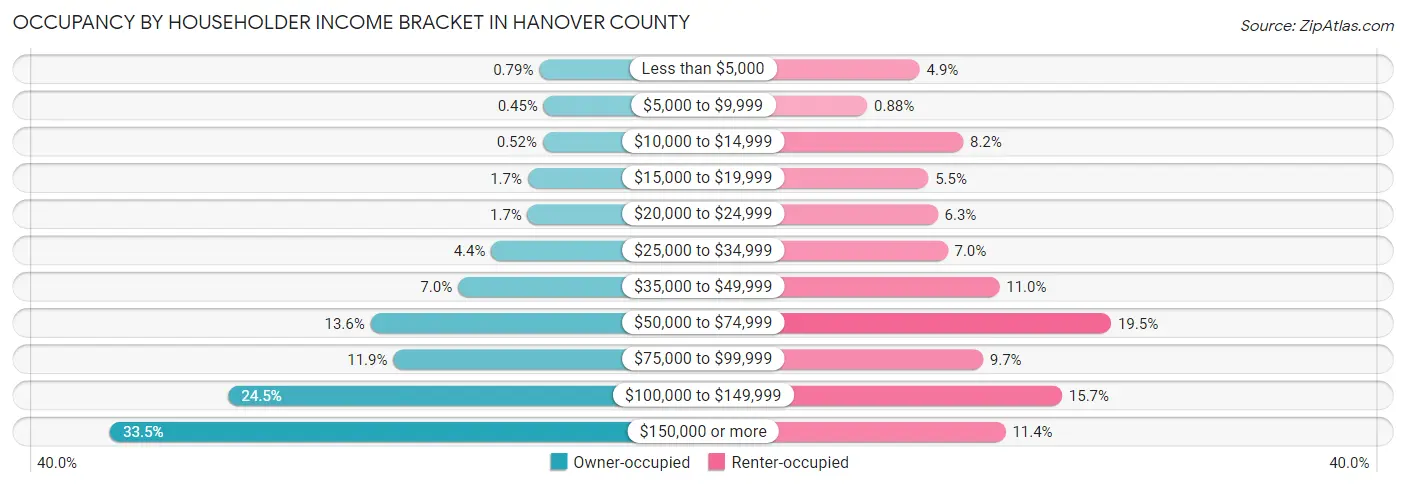
| Income Bracket | Owner-occupied | Renter-occupied |
| Less than $5,000 | 272 (0.8%) | 343 (4.9%) |
| $5,000 to $9,999 | 153 (0.4%) | 62 (0.9%) |
| $10,000 to $14,999 | 178 (0.5%) | 575 (8.2%) |
| $15,000 to $19,999 | 569 (1.7%) | 389 (5.5%) |
| $20,000 to $24,999 | 575 (1.7%) | 439 (6.2%) |
| $25,000 to $34,999 | 1,524 (4.4%) | 492 (7.0%) |
| $35,000 to $49,999 | 2,399 (7.0%) | 769 (11.0%) |
| $50,000 to $74,999 | 4,687 (13.6%) | 1,367 (19.5%) |
| $75,000 to $99,999 | 4,092 (11.9%) | 681 (9.7%) |
| $100,000 to $149,999 | 8,408 (24.5%) | 1,104 (15.7%) |
| $150,000 or more | 11,503 (33.5%) | 802 (11.4%) |
| Total | 34,360 (100.0%) | 7,023 (100.0%) |
Monthly Housing Cost Tiers in Hanover County
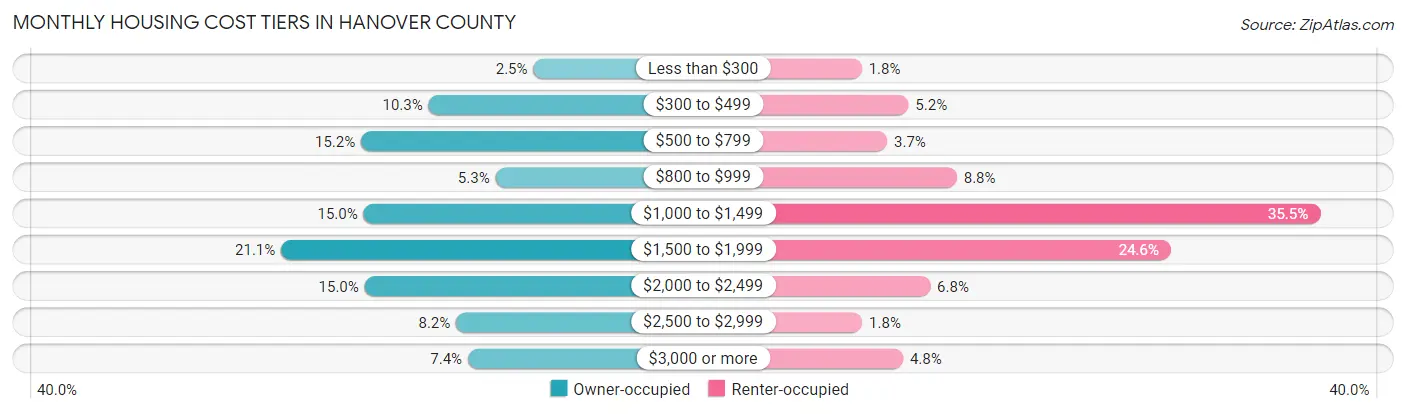
| Monthly Cost | Owner-occupied | Renter-occupied |
| Less than $300 | 870 (2.5%) | 126 (1.8%) |
| $300 to $499 | 3,521 (10.2%) | 367 (5.2%) |
| $500 to $799 | 5,229 (15.2%) | 257 (3.7%) |
| $800 to $999 | 1,827 (5.3%) | 617 (8.8%) |
| $1,000 to $1,499 | 5,168 (15.0%) | 2,496 (35.5%) |
| $1,500 to $1,999 | 7,253 (21.1%) | 1,724 (24.5%) |
| $2,000 to $2,499 | 5,141 (15.0%) | 480 (6.8%) |
| $2,500 to $2,999 | 2,826 (8.2%) | 128 (1.8%) |
| $3,000 or more | 2,525 (7.3%) | 339 (4.8%) |
| Total | 34,360 (100.0%) | 7,023 (100.0%) |
Physical Housing Characteristics in Hanover County
Housing Structures in Hanover County
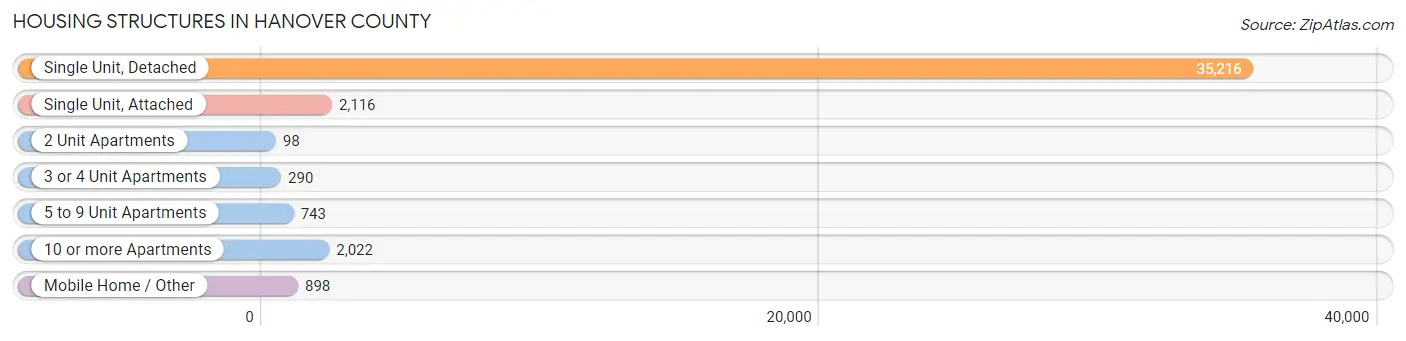
| Structure Type | # Housing Units | % Housing Units |
| Single Unit, Detached | 35,216 | 85.1% |
| Single Unit, Attached | 2,116 | 5.1% |
| 2 Unit Apartments | 98 | 0.2% |
| 3 or 4 Unit Apartments | 290 | 0.7% |
| 5 to 9 Unit Apartments | 743 | 1.8% |
| 10 or more Apartments | 2,022 | 4.9% |
| Mobile Home / Other | 898 | 2.2% |
| Total | 41,383 | 100.0% |
Housing Structures by Occupancy in Hanover County
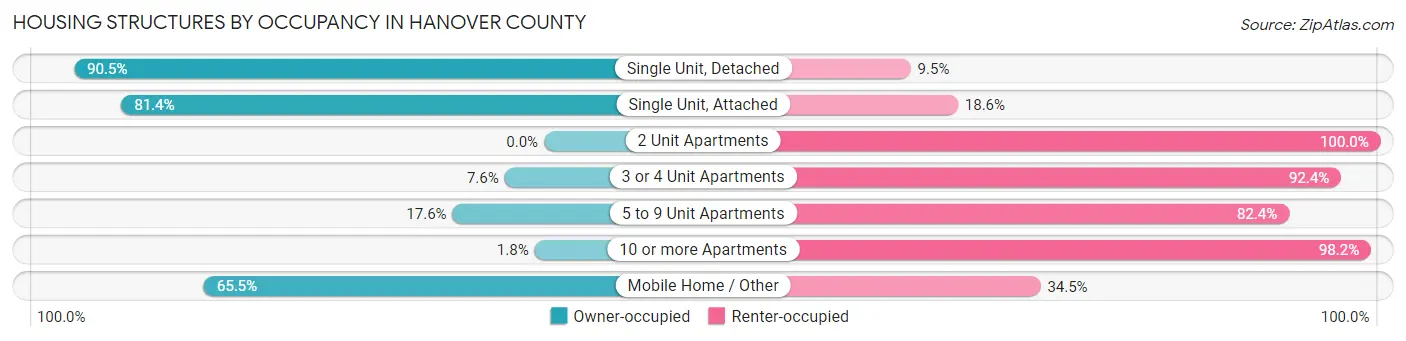
| Structure Type | Owner-occupied | Renter-occupied |
| Single Unit, Detached | 31,860 (90.5%) | 3,356 (9.5%) |
| Single Unit, Attached | 1,722 (81.4%) | 394 (18.6%) |
| 2 Unit Apartments | 0 (0.0%) | 98 (100.0%) |
| 3 or 4 Unit Apartments | 22 (7.6%) | 268 (92.4%) |
| 5 to 9 Unit Apartments | 131 (17.6%) | 612 (82.4%) |
| 10 or more Apartments | 37 (1.8%) | 1,985 (98.2%) |
| Mobile Home / Other | 588 (65.5%) | 310 (34.5%) |
| Total | 34,360 (83.0%) | 7,023 (17.0%) |
Housing Structures by Number of Rooms in Hanover County
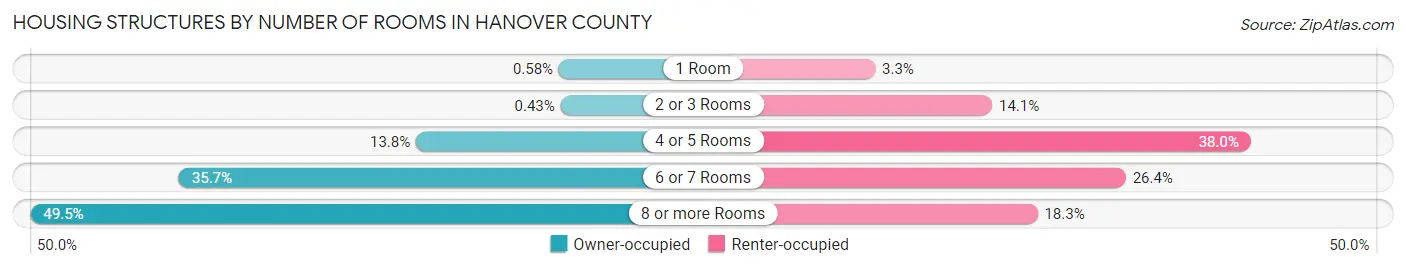
| Number of Rooms | Owner-occupied | Renter-occupied |
| 1 Room | 201 (0.6%) | 228 (3.3%) |
| 2 or 3 Rooms | 147 (0.4%) | 988 (14.1%) |
| 4 or 5 Rooms | 4,741 (13.8%) | 2,668 (38.0%) |
| 6 or 7 Rooms | 12,276 (35.7%) | 1,856 (26.4%) |
| 8 or more Rooms | 16,995 (49.5%) | 1,283 (18.3%) |
| Total | 34,360 (100.0%) | 7,023 (100.0%) |
Housing Structure by Heating Type in Hanover County
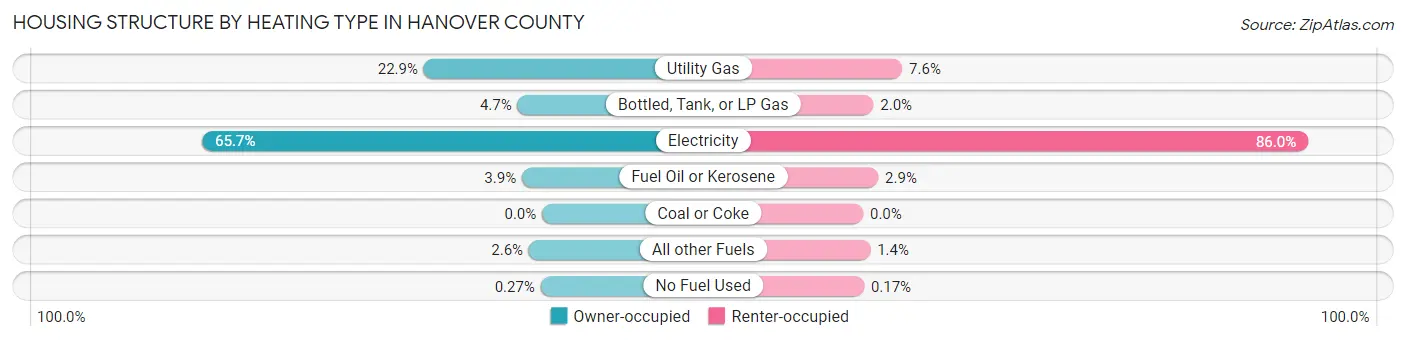
| Heating Type | Owner-occupied | Renter-occupied |
| Utility Gas | 7,856 (22.9%) | 531 (7.6%) |
| Bottled, Tank, or LP Gas | 1,629 (4.7%) | 140 (2.0%) |
| Electricity | 22,573 (65.7%) | 6,038 (86.0%) |
| Fuel Oil or Kerosene | 1,335 (3.9%) | 205 (2.9%) |
| Coal or Coke | 0 (0.0%) | 0 (0.0%) |
| All other Fuels | 875 (2.5%) | 97 (1.4%) |
| No Fuel Used | 92 (0.3%) | 12 (0.2%) |
| Total | 34,360 (100.0%) | 7,023 (100.0%) |
Household Vehicle Usage in Hanover County
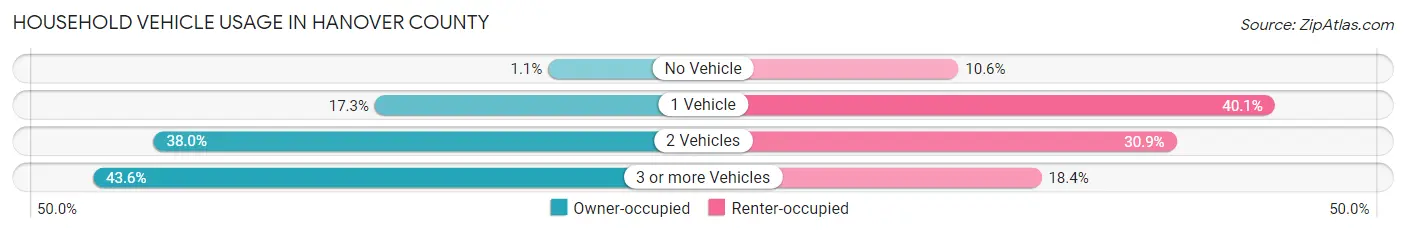
| Vehicles per Household | Owner-occupied | Renter-occupied |
| No Vehicle | 388 (1.1%) | 744 (10.6%) |
| 1 Vehicle | 5,947 (17.3%) | 2,817 (40.1%) |
| 2 Vehicles | 13,043 (38.0%) | 2,173 (30.9%) |
| 3 or more Vehicles | 14,982 (43.6%) | 1,289 (18.3%) |
| Total | 34,360 (100.0%) | 7,023 (100.0%) |
Real Estate & Mortgages in Hanover County
Real Estate and Mortgage Overview in Hanover County
| Characteristic | Without Mortgage | With Mortgage |
| Housing Units | 10,783 | 23,577 |
| Median Property Value | $329,100 | $355,300 |
| Median Household Income | $77,903 | $9,076 |
| Monthly Housing Costs | $553 | $2,485 |
| Real Estate Taxes | $2,437 | $385 |
Property Value by Mortgage Status in Hanover County
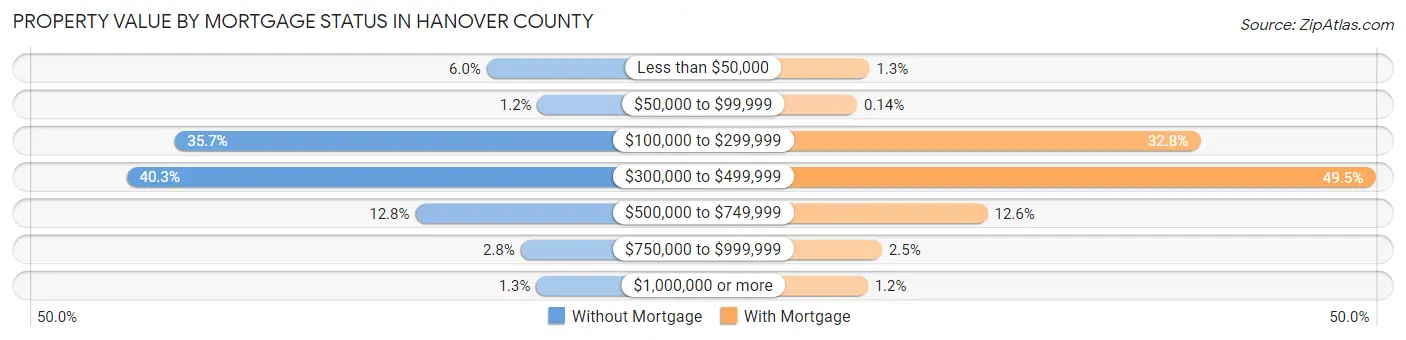
| Property Value | Without Mortgage | With Mortgage |
| Less than $50,000 | 646 (6.0%) | 316 (1.3%) |
| $50,000 to $99,999 | 125 (1.2%) | 34 (0.1%) |
| $100,000 to $299,999 | 3,853 (35.7%) | 7,733 (32.8%) |
| $300,000 to $499,999 | 4,345 (40.3%) | 11,667 (49.5%) |
| $500,000 to $749,999 | 1,379 (12.8%) | 2,963 (12.6%) |
| $750,000 to $999,999 | 298 (2.8%) | 591 (2.5%) |
| $1,000,000 or more | 137 (1.3%) | 273 (1.2%) |
| Total | 10,783 (100.0%) | 23,577 (100.0%) |
Household Income by Mortgage Status in Hanover County
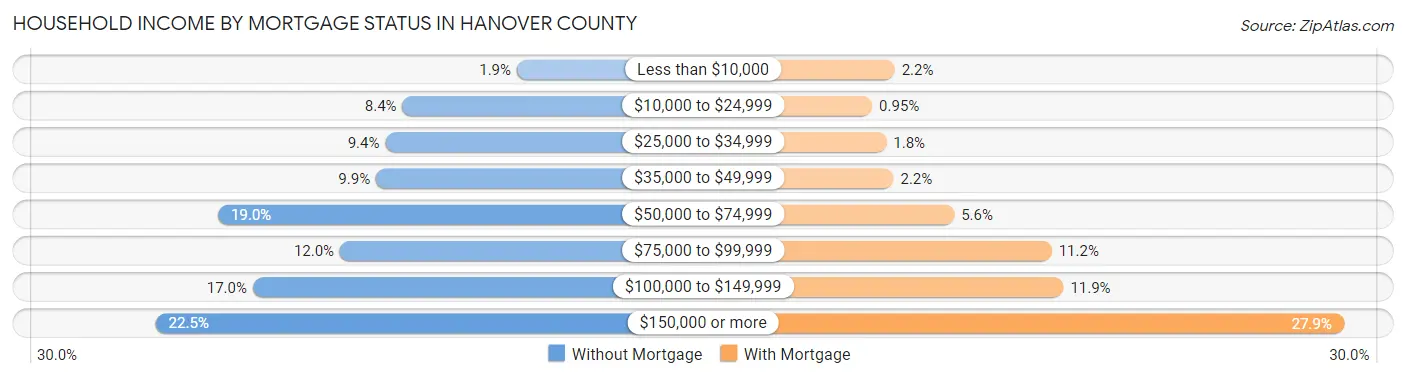
| Household Income | Without Mortgage | With Mortgage |
| Less than $10,000 | 202 (1.9%) | 529 (2.2%) |
| $10,000 to $24,999 | 907 (8.4%) | 223 (0.9%) |
| $25,000 to $34,999 | 1,013 (9.4%) | 415 (1.8%) |
| $35,000 to $49,999 | 1,070 (9.9%) | 511 (2.2%) |
| $50,000 to $74,999 | 2,043 (19.0%) | 1,329 (5.6%) |
| $75,000 to $99,999 | 1,292 (12.0%) | 2,644 (11.2%) |
| $100,000 to $149,999 | 1,829 (17.0%) | 2,800 (11.9%) |
| $150,000 or more | 2,427 (22.5%) | 6,579 (27.9%) |
| Total | 10,783 (100.0%) | 23,577 (100.0%) |
Property Value to Household Income Ratio in Hanover County
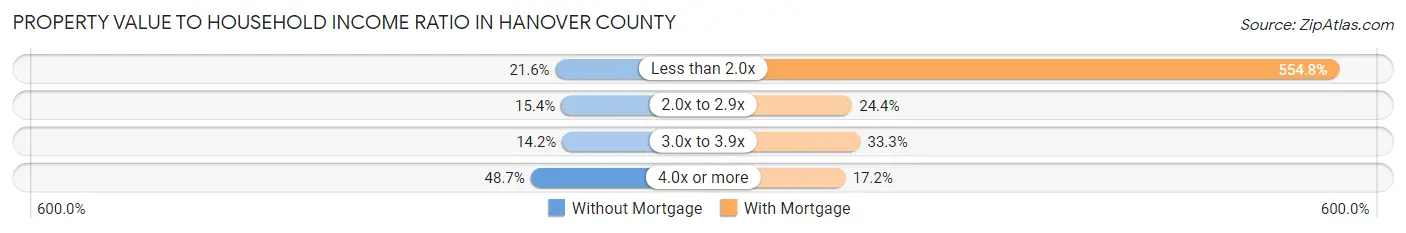
| Value-to-Income Ratio | Without Mortgage | With Mortgage |
| Less than 2.0x | 2,324 (21.5%) | 130,804 (554.8%) |
| 2.0x to 2.9x | 1,655 (15.3%) | 5,751 (24.4%) |
| 3.0x to 3.9x | 1,531 (14.2%) | 7,859 (33.3%) |
| 4.0x or more | 5,246 (48.6%) | 4,065 (17.2%) |
| Total | 10,783 (100.0%) | 23,577 (100.0%) |
Real Estate Taxes by Mortgage Status in Hanover County
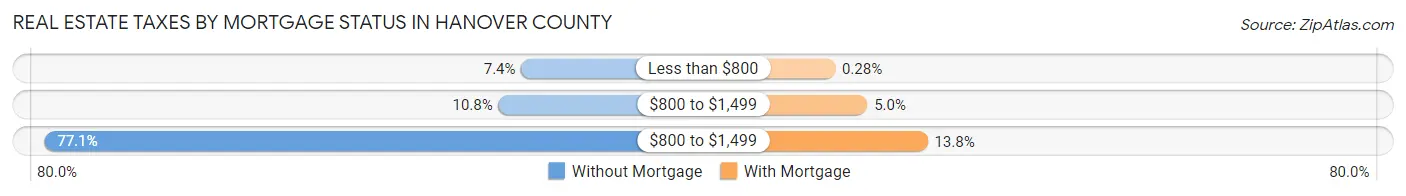
| Property Taxes | Without Mortgage | With Mortgage |
| Less than $800 | 799 (7.4%) | 67 (0.3%) |
| $800 to $1,499 | 1,159 (10.7%) | 1,176 (5.0%) |
| $800 to $1,499 | 8,316 (77.1%) | 3,254 (13.8%) |
| Total | 10,783 (100.0%) | 23,577 (100.0%) |
Health & Disability in Hanover County
Health Insurance Coverage by Age in Hanover County
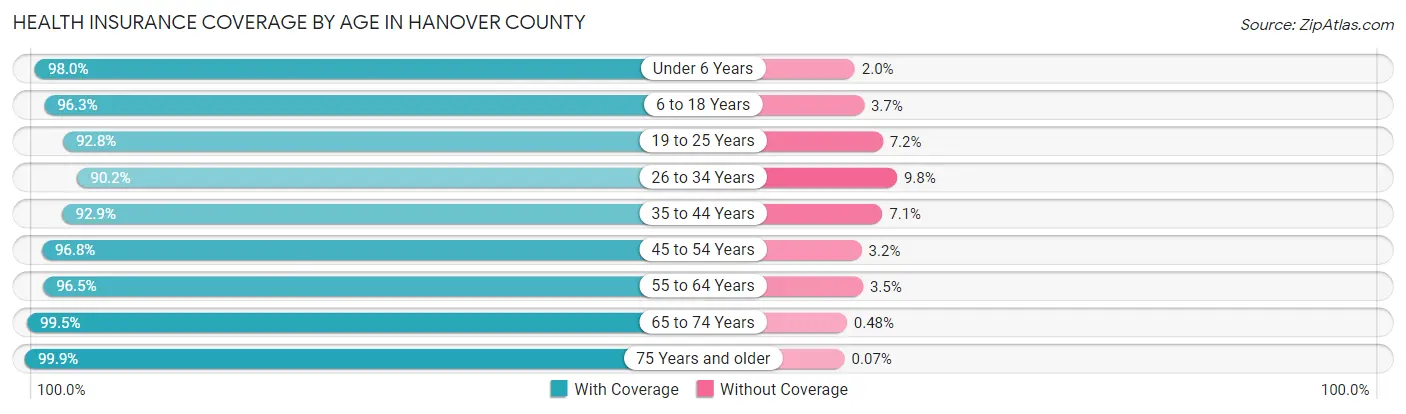
| Age Bracket | With Coverage | Without Coverage |
| Under 6 Years | 6,506 (98.0%) | 131 (2.0%) |
| 6 to 18 Years | 18,263 (96.3%) | 696 (3.7%) |
| 19 to 25 Years | 8,274 (92.8%) | 638 (7.2%) |
| 26 to 34 Years | 9,272 (90.2%) | 1,011 (9.8%) |
| 35 to 44 Years | 12,659 (92.9%) | 966 (7.1%) |
| 45 to 54 Years | 14,468 (96.8%) | 484 (3.2%) |
| 55 to 64 Years | 15,662 (96.5%) | 565 (3.5%) |
| 65 to 74 Years | 12,061 (99.5%) | 58 (0.5%) |
| 75 Years and older | 8,092 (99.9%) | 6 (0.1%) |
| Total | 105,257 (95.9%) | 4,555 (4.2%) |
Health Insurance Coverage by Citizenship Status in Hanover County
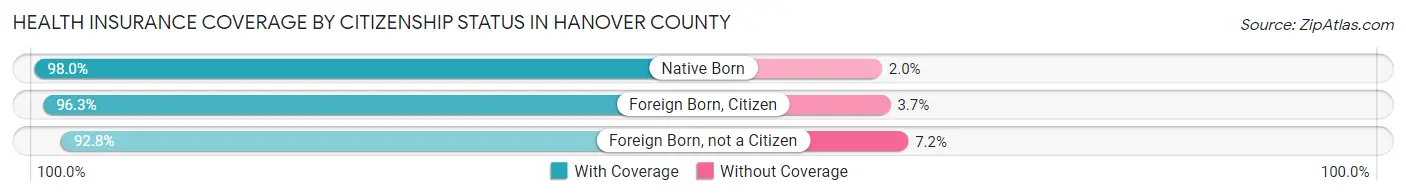
| Citizenship Status | With Coverage | Without Coverage |
| Native Born | 6,506 (98.0%) | 131 (2.0%) |
| Foreign Born, Citizen | 18,263 (96.3%) | 696 (3.7%) |
| Foreign Born, not a Citizen | 8,274 (92.8%) | 638 (7.2%) |
Health Insurance Coverage by Household Income in Hanover County
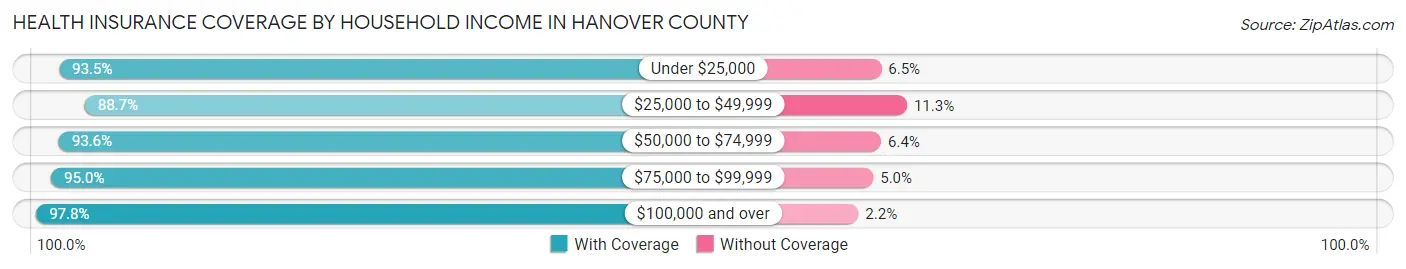
| Household Income | With Coverage | Without Coverage |
| Under $25,000 | 5,221 (93.5%) | 361 (6.5%) |
| $25,000 to $49,999 | 8,825 (88.7%) | 1,122 (11.3%) |
| $50,000 to $74,999 | 12,549 (93.6%) | 861 (6.4%) |
| $75,000 to $99,999 | 11,332 (95.0%) | 592 (5.0%) |
| $100,000 and over | 66,011 (97.8%) | 1,473 (2.2%) |
Public vs Private Health Insurance Coverage by Age in Hanover County
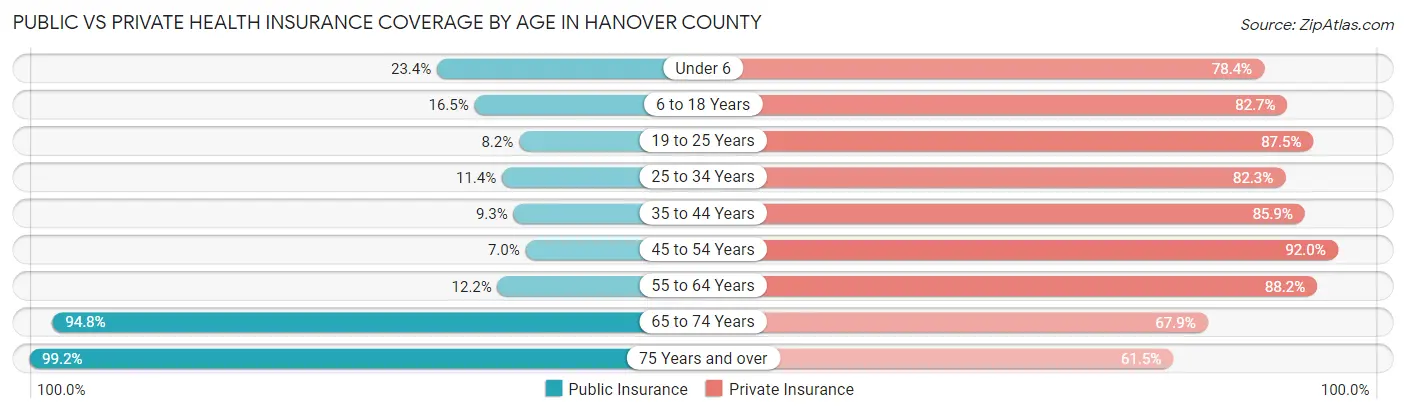
| Age Bracket | Public Insurance | Private Insurance |
| Under 6 | 1,556 (23.4%) | 5,200 (78.3%) |
| 6 to 18 Years | 3,126 (16.5%) | 15,680 (82.7%) |
| 19 to 25 Years | 733 (8.2%) | 7,798 (87.5%) |
| 25 to 34 Years | 1,170 (11.4%) | 8,461 (82.3%) |
| 35 to 44 Years | 1,260 (9.2%) | 11,707 (85.9%) |
| 45 to 54 Years | 1,049 (7.0%) | 13,756 (92.0%) |
| 55 to 64 Years | 1,980 (12.2%) | 14,313 (88.2%) |
| 65 to 74 Years | 11,494 (94.8%) | 8,225 (67.9%) |
| 75 Years and over | 8,029 (99.2%) | 4,980 (61.5%) |
| Total | 30,397 (27.7%) | 90,120 (82.1%) |
Disability Status by Sex by Age in Hanover County
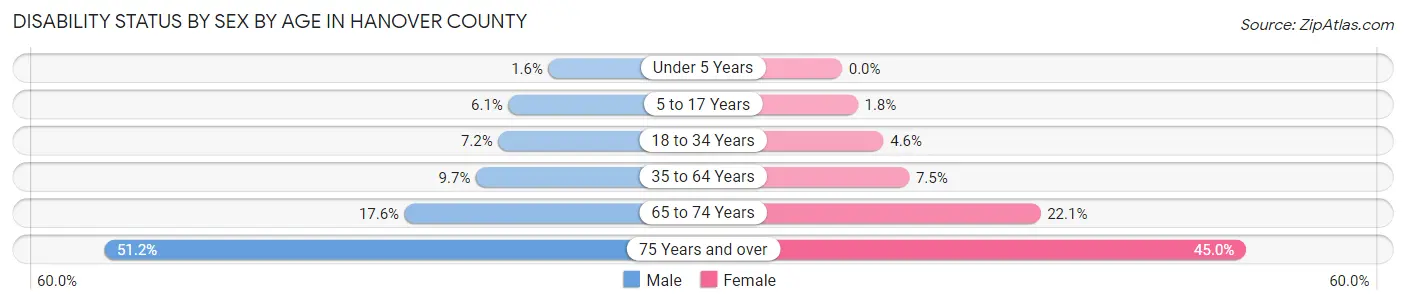
| Age Bracket | Male | Female |
| Under 5 Years | 46 (1.6%) | 0 (0.0%) |
| 5 to 17 Years | 586 (6.1%) | 155 (1.8%) |
| 18 to 34 Years | 769 (7.2%) | 473 (4.6%) |
| 35 to 64 Years | 2,129 (9.7%) | 1,709 (7.5%) |
| 65 to 74 Years | 1,021 (17.6%) | 1,399 (22.1%) |
| 75 Years and over | 1,723 (51.2%) | 2,130 (45.0%) |
Disability Class by Sex by Age in Hanover County
Disability Class: Hearing Difficulty
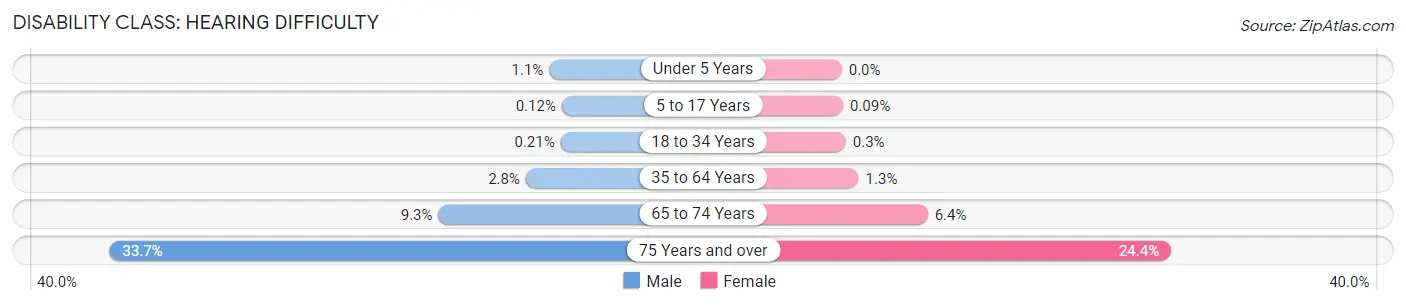
| Age Bracket | Male | Female |
| Under 5 Years | 30 (1.1%) | 0 (0.0%) |
| 5 to 17 Years | 12 (0.1%) | 8 (0.1%) |
| 18 to 34 Years | 22 (0.2%) | 31 (0.3%) |
| 35 to 64 Years | 613 (2.8%) | 285 (1.3%) |
| 65 to 74 Years | 537 (9.3%) | 404 (6.4%) |
| 75 Years and over | 1,135 (33.7%) | 1,156 (24.4%) |
Disability Class: Vision Difficulty
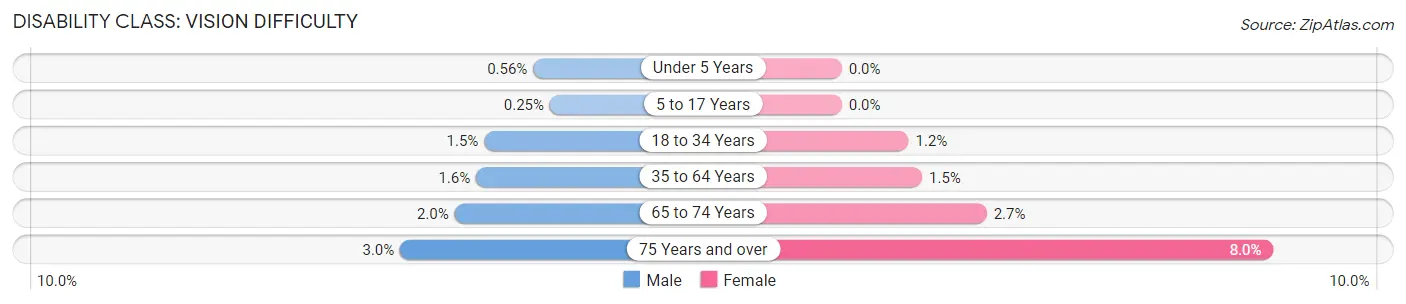
| Age Bracket | Male | Female |
| Under 5 Years | 16 (0.6%) | 0 (0.0%) |
| 5 to 17 Years | 24 (0.3%) | 0 (0.0%) |
| 18 to 34 Years | 156 (1.5%) | 127 (1.2%) |
| 35 to 64 Years | 356 (1.6%) | 340 (1.5%) |
| 65 to 74 Years | 117 (2.0%) | 170 (2.7%) |
| 75 Years and over | 102 (3.0%) | 379 (8.0%) |
Disability Class: Cognitive Difficulty
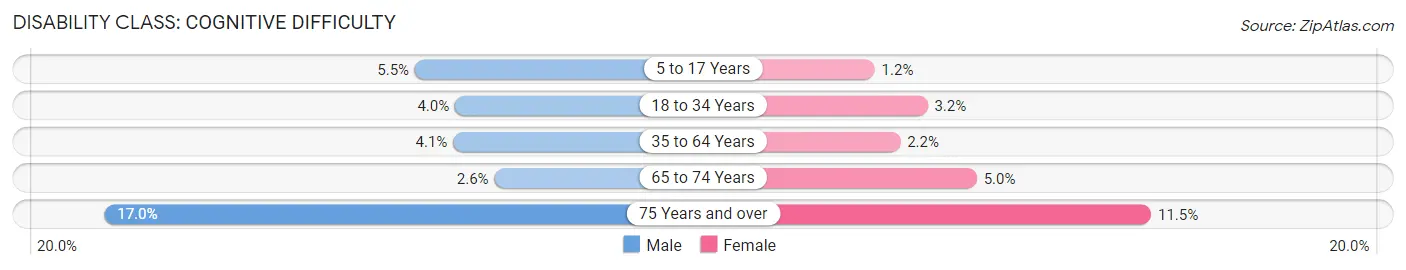
| Age Bracket | Male | Female |
| 5 to 17 Years | 530 (5.5%) | 108 (1.2%) |
| 18 to 34 Years | 428 (4.0%) | 326 (3.2%) |
| 35 to 64 Years | 897 (4.1%) | 496 (2.2%) |
| 65 to 74 Years | 148 (2.6%) | 317 (5.0%) |
| 75 Years and over | 574 (17.0%) | 543 (11.5%) |
Disability Class: Ambulatory Difficulty
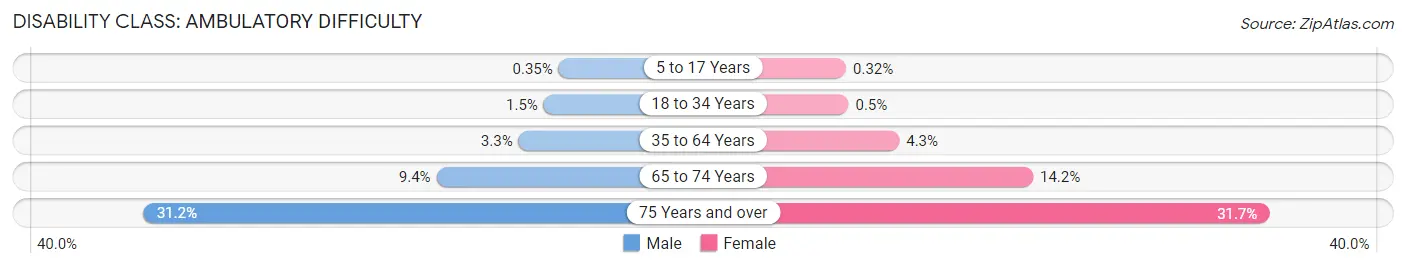
| Age Bracket | Male | Female |
| 5 to 17 Years | 34 (0.4%) | 28 (0.3%) |
| 18 to 34 Years | 155 (1.5%) | 51 (0.5%) |
| 35 to 64 Years | 731 (3.3%) | 975 (4.3%) |
| 65 to 74 Years | 545 (9.4%) | 899 (14.2%) |
| 75 Years and over | 1,049 (31.1%) | 1,501 (31.7%) |
Disability Class: Self-Care Difficulty
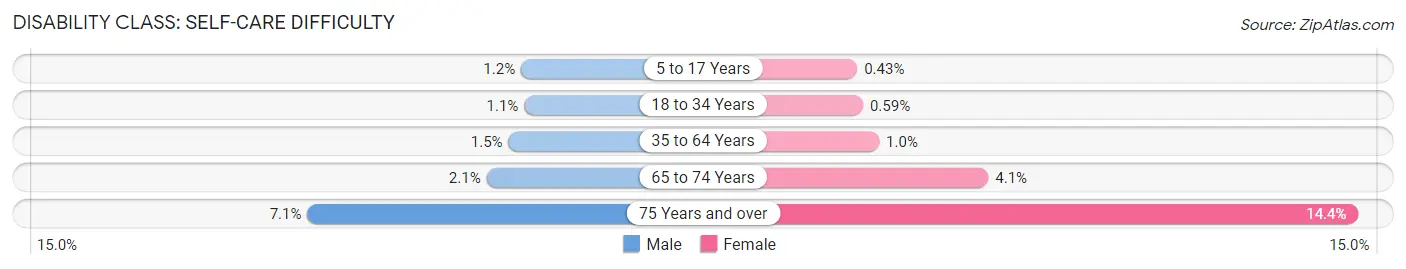
| Age Bracket | Male | Female |
| 5 to 17 Years | 114 (1.2%) | 38 (0.4%) |
| 18 to 34 Years | 116 (1.1%) | 60 (0.6%) |
| 35 to 64 Years | 336 (1.5%) | 237 (1.0%) |
| 65 to 74 Years | 124 (2.1%) | 258 (4.1%) |
| 75 Years and over | 240 (7.1%) | 680 (14.4%) |
Technology Access in Hanover County
Computing Device Access in Hanover County
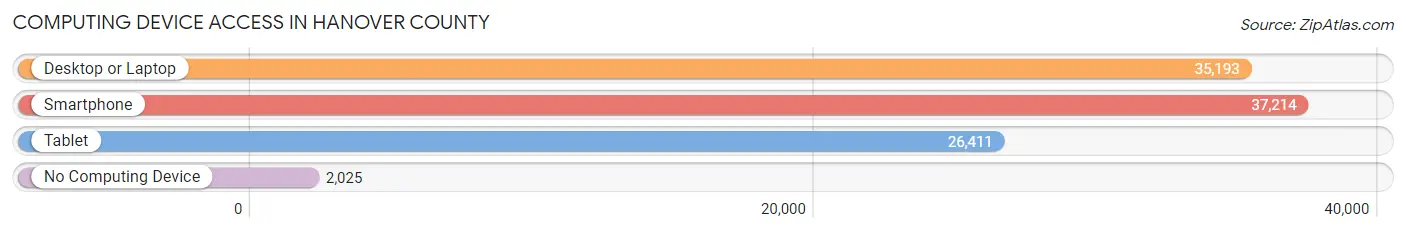
| Device Type | # Households | % Households |
| Desktop or Laptop | 35,193 | 85.0% |
| Smartphone | 37,214 | 89.9% |
| Tablet | 26,411 | 63.8% |
| No Computing Device | 2,025 | 4.9% |
| Total | 41,383 | 100.0% |
Internet Access in Hanover County
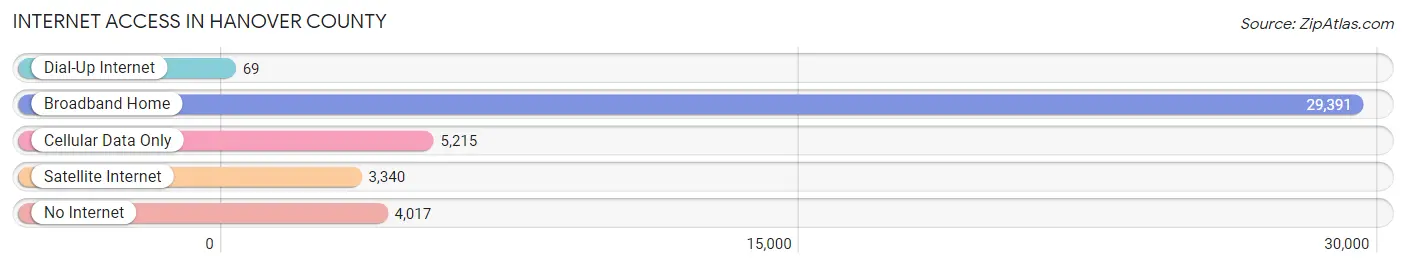
| Internet Type | # Households | % Households |
| Dial-Up Internet | 69 | 0.2% |
| Broadband Home | 29,391 | 71.0% |
| Cellular Data Only | 5,215 | 12.6% |
| Satellite Internet | 3,340 | 8.1% |
| No Internet | 4,017 | 9.7% |
| Total | 41,383 | 100.0% |
Hanover County Summary
Hanover County, Virginia is located in the central part of the state, just north of Richmond. It is bordered by Caroline, King William, King and Queen, and Spotsylvania counties. The county seat is Hanover Courthouse. The county was established in 1720 and named for the House of Hanover, which was the ruling house of Great Britain at the time.
Geography
Hanover County covers an area of 437 square miles and is located in the Piedmont region of Virginia. The terrain is mostly rolling hills, with the highest point being the summit of Totopotomoy Mountain at 845 feet. The county is drained by the Pamunkey and South Anna rivers, as well as several smaller streams. The county is home to several state parks, including Beaverdam Creek, Hanover Courthouse, and Totopotomoy Creek.
Economy
Hanover County has a diverse economy, with a mix of manufacturing, retail, and service industries. The county is home to several large employers, including Dominion Energy, Walmart, and the University of Richmond. The county also has a thriving agricultural sector, with crops such as corn, soybeans, and wheat being grown.
Demographics
As of the 2010 census, Hanover County had a population of 99,863. The population is predominantly white (83.3%), with African Americans making up 11.3% of the population. The median household income is $76,845, and the median home value is $269,400.
The county is served by several school districts, including Hanover County Public Schools, Hanover County Private Schools, and the University of Richmond. The county is also home to several higher education institutions, including Randolph-Macon College, Virginia Commonwealth University, and the University of Richmond.
Conclusion
Hanover County, Virginia is a vibrant and diverse county located in the central part of the state. It is home to a mix of manufacturing, retail, and service industries, as well as a thriving agricultural sector. The county is also home to several higher education institutions, making it an attractive place to live and work. With its diverse population and economy, Hanover County is a great place to call home.
Common Questions
What is Per Capita Income in Hanover County?
Per Capita income in Hanover County is $49,110.
What is the Median Family Income in Hanover County?
Median Family Income in Hanover County is $124,004.
What is the Median Household income in Hanover County?
Median Household Income in Hanover County is $104,678.
What is Income or Wage Gap in Hanover County?
Income or Wage Gap in Hanover County is 25.7%.
Women in Hanover County earn 74.3 cents for every dollar earned by a man.
What is Family Income Deficit in Hanover County?
Family Income Deficit in Hanover County is $10,759.
Families that are below poverty line in Hanover County earn $10,759 less on average than the poverty threshold level.
What is Inequality or Gini Index in Hanover County?
Inequality or Gini Index in Hanover County is 0.42.
What is the Total Population of Hanover County?
Total Population of Hanover County is 110,513.
What is the Total Male Population of Hanover County?
Total Male Population of Hanover County is 54,636.
What is the Total Female Population of Hanover County?
Total Female Population of Hanover County is 55,877.
What is the Ratio of Males per 100 Females in Hanover County?
There are 97.78 Males per 100 Females in Hanover County.
What is the Ratio of Females per 100 Males in Hanover County?
There are 102.27 Females per 100 Males in Hanover County.
What is the Median Population Age in Hanover County?
Median Population Age in Hanover County is 42.4 Years.
What is the Average Family Size in Hanover County
Average Family Size in Hanover County is 3.1 People.
What is the Average Household Size in Hanover County
Average Household Size in Hanover County is 2.6 People.
How Large is the Labor Force in Hanover County?
There are 59,482 People in the Labor Forcein in Hanover County.
What is the Percentage of People in the Labor Force in Hanover County?
66.4% of People are in the Labor Force in Hanover County.
What is the Unemployment Rate in Hanover County?
Unemployment Rate in Hanover County is 2.9%.