Chesapeake city, VA Map & Demographics
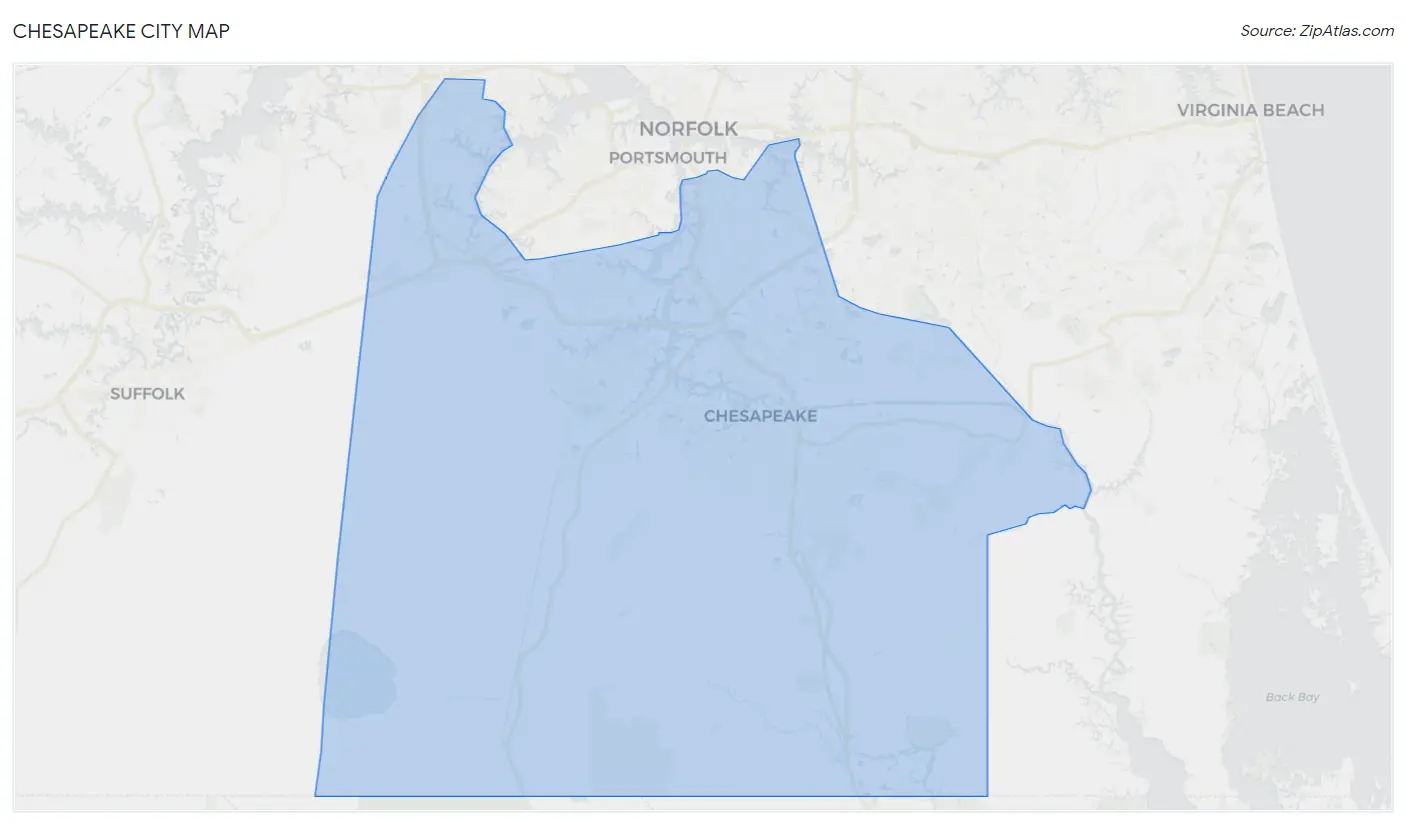
Chesapeake city Map
Chesapeake city Overview
$42,753
PER CAPITA INCOME
$109,923
AVG FAMILY INCOME
$92,703
AVG HOUSEHOLD INCOME
35.2%
WAGE / INCOME GAP [ % ]
64.8¢/ $1
WAGE / INCOME GAP [ $ ]
$11,162
FAMILY INCOME DEFICIT
0.42
INEQUALITY / GINI INDEX
249,377
TOTAL POPULATION
122,672
MALE POPULATION
126,705
FEMALE POPULATION
96.82
MALES / 100 FEMALES
103.29
FEMALES / 100 MALES
37.4
MEDIAN AGE
3.1
AVG FAMILY SIZE
2.7
AVG HOUSEHOLD SIZE
132,139
LABOR FORCE [ PEOPLE ]
67.2%
PERCENT IN LABOR FORCE
5.0%
UNEMPLOYMENT RATE
Chesapeake city Area Codes
Income in Chesapeake city
Income Overview in Chesapeake city
Per Capita Income in Chesapeake city is $42,753, while median incomes of families and households are $109,923 and $92,703 respectively.
| Characteristic | Number | Measure |
| Per Capita Income | 249,377 | $42,753 |
| Median Family Income | 66,760 | $109,923 |
| Mean Family Income | 66,760 | $131,047 |
| Median Household Income | 91,368 | $92,703 |
| Mean Household Income | 91,368 | $114,454 |
| Income Deficit | 66,760 | $11,162 |
| Wage / Income Gap (%) | 249,377 | 35.21% |
| Wage / Income Gap ($) | 249,377 | 64.79¢ per $1 |
| Gini / Inequality Index | 249,377 | 0.42 |
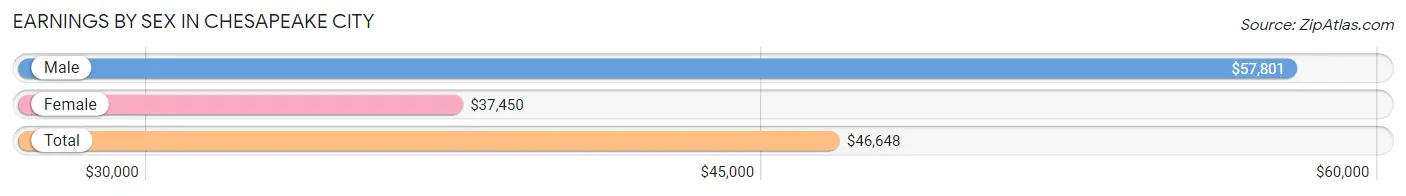
Earnings by Sex in Chesapeake city
Average Earnings in Chesapeake city are $46,648, $57,801 for men and $37,450 for women, a difference of 35.2%.
| Sex | Number | Average Earnings |
| Male | 72,809 (52.5%) | $57,801 |
| Female | 65,922 (47.5%) | $37,450 |
| Total | 138,731 (100.0%) | $46,648 |
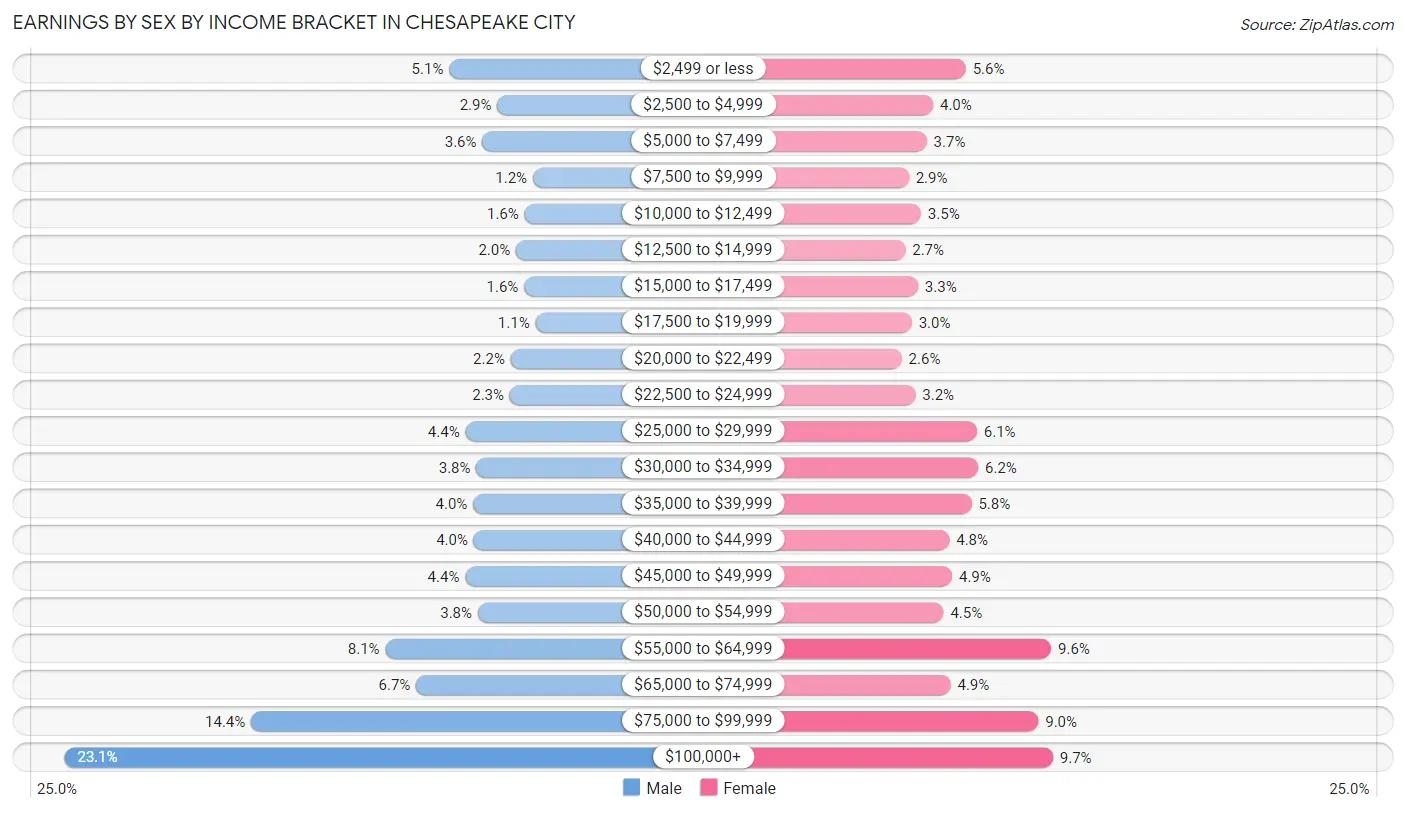
Earnings by Sex by Income Bracket in Chesapeake city
The most common earnings brackets in Chesapeake city are $100,000+ for men (16,851 | 23.1%) and $100,000+ for women (6,359 | 9.7%).
| Income | Male | Female |
| $2,499 or less | 3,723 (5.1%) | 3,672 (5.6%) |
| $2,500 to $4,999 | 2,084 (2.9%) | 2,664 (4.0%) |
| $5,000 to $7,499 | 2,590 (3.6%) | 2,468 (3.7%) |
| $7,500 to $9,999 | 868 (1.2%) | 1,910 (2.9%) |
| $10,000 to $12,499 | 1,152 (1.6%) | 2,286 (3.5%) |
| $12,500 to $14,999 | 1,442 (2.0%) | 1,806 (2.7%) |
| $15,000 to $17,499 | 1,165 (1.6%) | 2,193 (3.3%) |
| $17,500 to $19,999 | 782 (1.1%) | 2,002 (3.0%) |
| $20,000 to $22,499 | 1,623 (2.2%) | 1,693 (2.6%) |
| $22,500 to $24,999 | 1,653 (2.3%) | 2,119 (3.2%) |
| $25,000 to $29,999 | 3,164 (4.3%) | 4,017 (6.1%) |
| $30,000 to $34,999 | 2,793 (3.8%) | 4,055 (6.1%) |
| $35,000 to $39,999 | 2,907 (4.0%) | 3,852 (5.8%) |
| $40,000 to $44,999 | 2,880 (4.0%) | 3,161 (4.8%) |
| $45,000 to $49,999 | 3,172 (4.4%) | 3,253 (4.9%) |
| $50,000 to $54,999 | 2,742 (3.8%) | 2,986 (4.5%) |
| $55,000 to $64,999 | 5,897 (8.1%) | 6,312 (9.6%) |
| $65,000 to $74,999 | 4,847 (6.7%) | 3,204 (4.9%) |
| $75,000 to $99,999 | 10,474 (14.4%) | 5,910 (9.0%) |
| $100,000+ | 16,851 (23.1%) | 6,359 (9.7%) |
| Total | 72,809 (100.0%) | 65,922 (100.0%) |
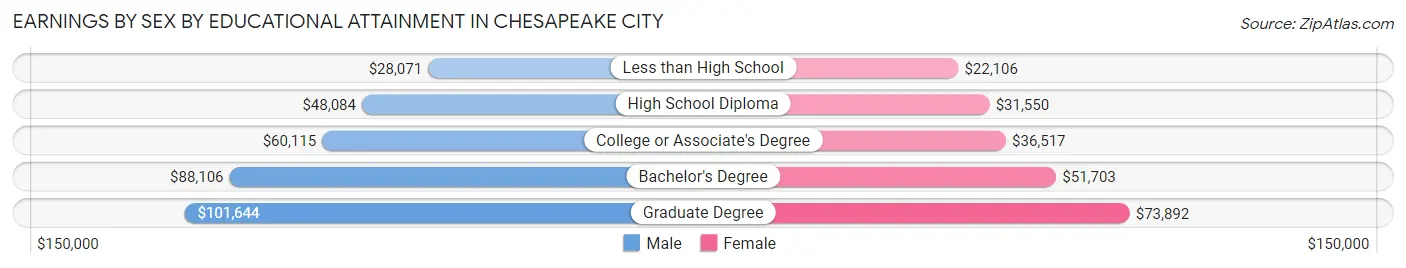
Earnings by Sex by Educational Attainment in Chesapeake city
Average earnings in Chesapeake city are $65,243 for men and $43,743 for women, a difference of 33.0%. Men with an educational attainment of graduate degree enjoy the highest average annual earnings of $101,644, while those with less than high school education earn the least with $28,071. Women with an educational attainment of graduate degree earn the most with the average annual earnings of $73,892, while those with less than high school education have the smallest earnings of $22,106.
| Educational Attainment | Male Income | Female Income |
| Less than High School | $28,071 | $22,106 |
| High School Diploma | $48,084 | $31,550 |
| College or Associate's Degree | $60,115 | $36,517 |
| Bachelor's Degree | $88,106 | $51,703 |
| Graduate Degree | $101,644 | $73,892 |
| Total | $65,243 | $43,743 |
Family Income in Chesapeake city
Family Income Brackets in Chesapeake city
According to the Chesapeake city family income data, there are 15,555 families falling into the $100,000 to $149,999 income range, which is the most common income bracket and makes up 23.3% of all families. Conversely, the $10,000 to $14,999 income bracket is the least frequent group with only 668 families (1.0%) belonging to this category.
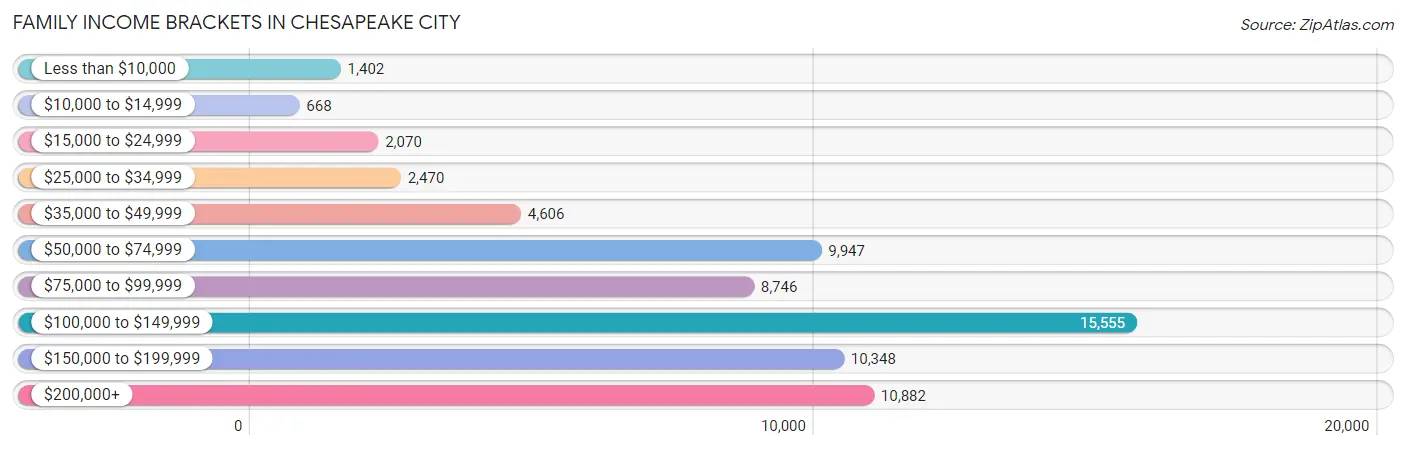
| Income Bracket | # Families | % Families |
| Less than $10,000 | 1,402 | 2.1% |
| $10,000 to $14,999 | 668 | 1.0% |
| $15,000 to $24,999 | 2,070 | 3.1% |
| $25,000 to $34,999 | 2,470 | 3.7% |
| $35,000 to $49,999 | 4,606 | 6.9% |
| $50,000 to $74,999 | 9,947 | 14.9% |
| $75,000 to $99,999 | 8,746 | 13.1% |
| $100,000 to $149,999 | 15,555 | 23.3% |
| $150,000 to $199,999 | 10,348 | 15.5% |
| $200,000+ | 10,882 | 16.3% |
Family Income by Famaliy Size in Chesapeake city
4-person families (13,259 | 19.9%) account for the highest median family income in Chesapeake city with $146,998 per family, while 2-person families (29,169 | 43.7%) have the highest median income of $45,098 per family member.
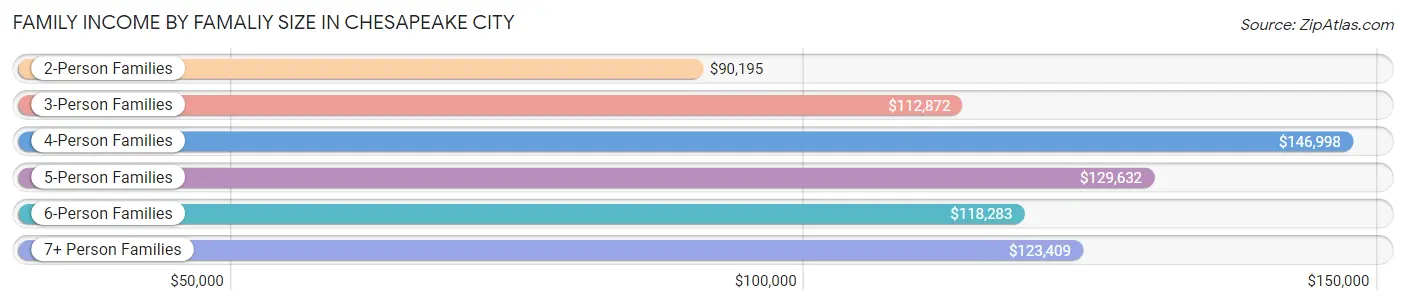
| Income Bracket | # Families | Median Income |
| 2-Person Families | 29,169 (43.7%) | $90,195 |
| 3-Person Families | 15,469 (23.2%) | $112,872 |
| 4-Person Families | 13,259 (19.9%) | $146,998 |
| 5-Person Families | 5,694 (8.5%) | $129,632 |
| 6-Person Families | 2,273 (3.4%) | $118,283 |
| 7+ Person Families | 896 (1.3%) | $123,409 |
| Total | 66,760 (100.0%) | $109,923 |
Family Income by Number of Earners in Chesapeake city
The median family income in Chesapeake city is $109,923, with families comprising 3+ earners (8,699) having the highest median family income of $168,810, while families with no earners (7,072) have the lowest median family income of $63,760, accounting for 13.0% and 10.6% of families, respectively.
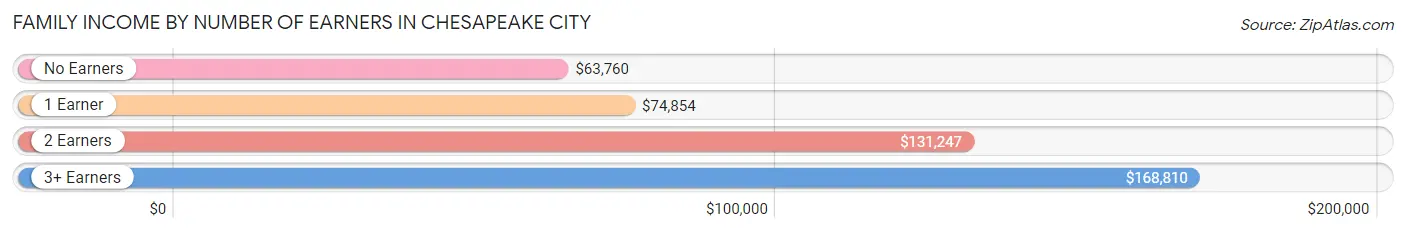
| Number of Earners | # Families | Median Income |
| No Earners | 7,072 (10.6%) | $63,760 |
| 1 Earner | 20,878 (31.3%) | $74,854 |
| 2 Earners | 30,111 (45.1%) | $131,247 |
| 3+ Earners | 8,699 (13.0%) | $168,810 |
| Total | 66,760 (100.0%) | $109,923 |
Household Income in Chesapeake city
Household Income Brackets in Chesapeake city
With 18,913 households falling in the category, the $100,000 to $149,999 income range is the most frequent in Chesapeake city, accounting for 20.7% of all households. In contrast, only 1,827 households (2.0%) fall into the $10,000 to $14,999 income bracket, making it the least populous group.
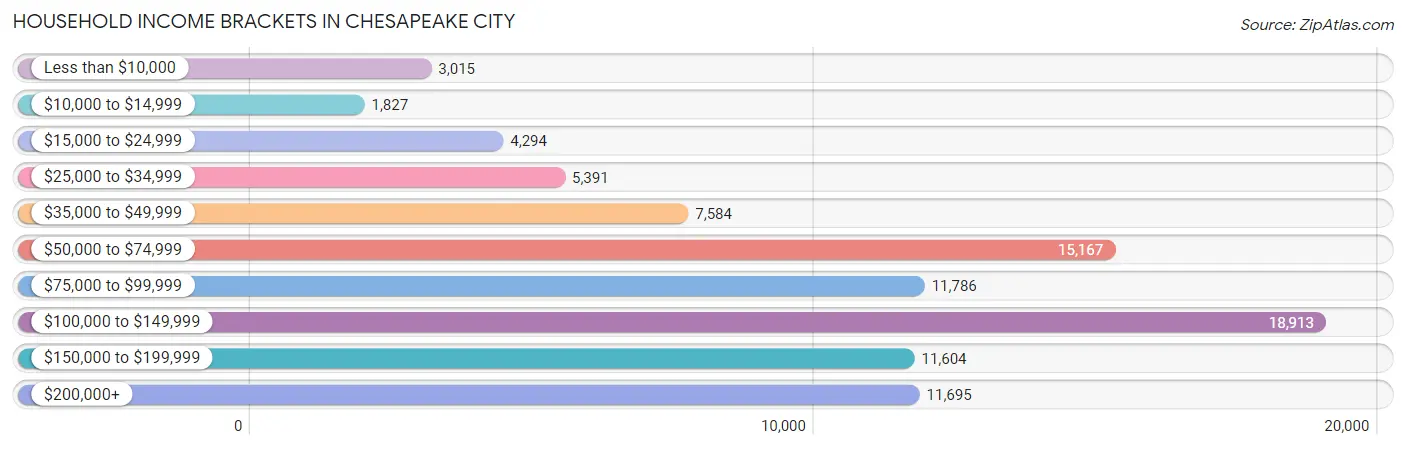
| Income Bracket | # Households | % Households |
| Less than $10,000 | 3,015 | 3.3% |
| $10,000 to $14,999 | 1,827 | 2.0% |
| $15,000 to $24,999 | 4,294 | 4.7% |
| $25,000 to $34,999 | 5,391 | 5.9% |
| $35,000 to $49,999 | 7,584 | 8.3% |
| $50,000 to $74,999 | 15,167 | 16.6% |
| $75,000 to $99,999 | 11,786 | 12.9% |
| $100,000 to $149,999 | 18,913 | 20.7% |
| $150,000 to $199,999 | 11,604 | 12.7% |
| $200,000+ | 11,695 | 12.8% |
Household Income by Householder Age in Chesapeake city
The median household income in Chesapeake city is $92,703, with the highest median household income of $115,047 found in the 45 to 64 years age bracket for the primary householder. A total of 35,337 households (38.7%) fall into this category. Meanwhile, the 15 to 24 years age bracket for the primary householder has the lowest median household income of $50,652, with 2,627 households (2.9%) in this group.
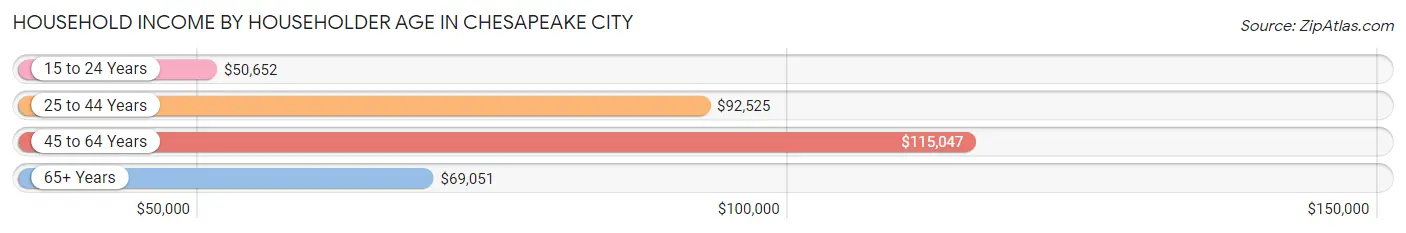
| Income Bracket | # Households | Median Income |
| 15 to 24 Years | 2,627 (2.9%) | $50,652 |
| 25 to 44 Years | 32,902 (36.0%) | $92,525 |
| 45 to 64 Years | 35,337 (38.7%) | $115,047 |
| 65+ Years | 20,502 (22.4%) | $69,051 |
| Total | 91,368 (100.0%) | $92,703 |
Poverty in Chesapeake city
Income Below Poverty by Sex and Age in Chesapeake city
With 6.9% poverty level for males and 8.4% for females among the residents of Chesapeake city, 15 year old males and 18 to 24 year old females are the most vulnerable to poverty, with 344 males (18.8%) and 1,378 females (13.7%) in their respective age groups living below the poverty level.
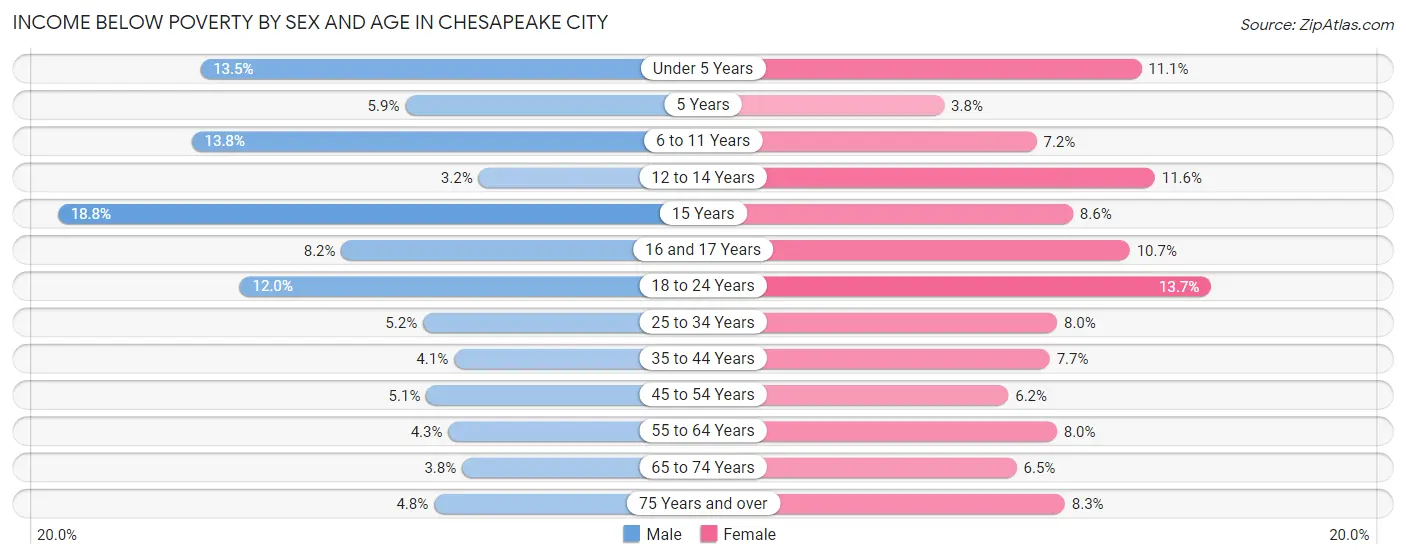
| Age Bracket | Male | Female |
| Under 5 Years | 1,026 (13.5%) | 825 (11.1%) |
| 5 Years | 109 (5.9%) | 52 (3.8%) |
| 6 to 11 Years | 1,406 (13.8%) | 730 (7.2%) |
| 12 to 14 Years | 163 (3.2%) | 582 (11.6%) |
| 15 Years | 344 (18.8%) | 135 (8.6%) |
| 16 and 17 Years | 301 (8.2%) | 396 (10.7%) |
| 18 to 24 Years | 1,242 (12.0%) | 1,378 (13.7%) |
| 25 to 34 Years | 867 (5.2%) | 1,358 (8.0%) |
| 35 to 44 Years | 679 (4.1%) | 1,393 (7.7%) |
| 45 to 54 Years | 757 (5.1%) | 972 (6.2%) |
| 55 to 64 Years | 651 (4.3%) | 1,333 (8.0%) |
| 65 to 74 Years | 360 (3.8%) | 756 (6.5%) |
| 75 Years and over | 237 (4.8%) | 617 (8.3%) |
| Total | 8,142 (6.9%) | 10,527 (8.4%) |
Income Above Poverty by Sex and Age in Chesapeake city
According to the poverty statistics in Chesapeake city, males aged 12 to 14 years and females aged 5 years are the age groups that are most secure financially, with 96.9% of males and 96.2% of females in these age groups living above the poverty line.
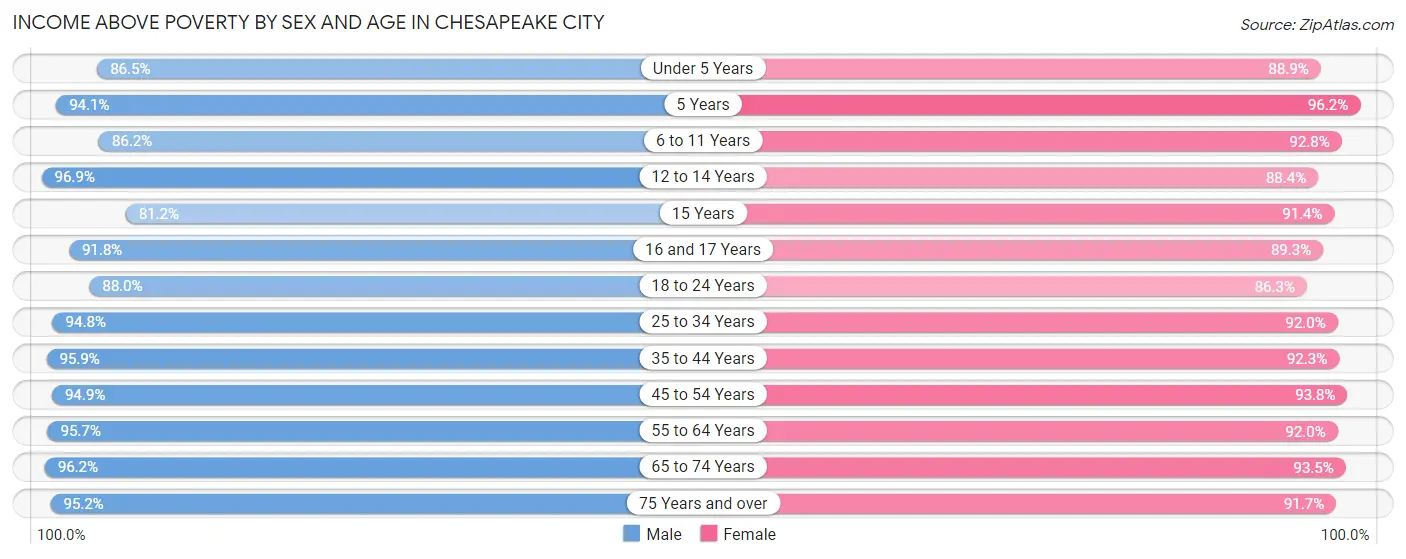
| Age Bracket | Male | Female |
| Under 5 Years | 6,583 (86.5%) | 6,593 (88.9%) |
| 5 Years | 1,749 (94.1%) | 1,315 (96.2%) |
| 6 to 11 Years | 8,785 (86.2%) | 9,369 (92.8%) |
| 12 to 14 Years | 5,013 (96.9%) | 4,426 (88.4%) |
| 15 Years | 1,489 (81.2%) | 1,438 (91.4%) |
| 16 and 17 Years | 3,353 (91.8%) | 3,308 (89.3%) |
| 18 to 24 Years | 9,094 (88.0%) | 8,671 (86.3%) |
| 25 to 34 Years | 15,771 (94.8%) | 15,634 (92.0%) |
| 35 to 44 Years | 16,055 (95.9%) | 16,656 (92.3%) |
| 45 to 54 Years | 14,120 (94.9%) | 14,760 (93.8%) |
| 55 to 64 Years | 14,579 (95.7%) | 15,373 (92.0%) |
| 65 to 74 Years | 9,212 (96.2%) | 10,896 (93.5%) |
| 75 Years and over | 4,703 (95.2%) | 6,837 (91.7%) |
| Total | 110,506 (93.1%) | 115,276 (91.6%) |
Income Below Poverty Among Married-Couple Families in Chesapeake city
The poverty statistics for married-couple families in Chesapeake city show that 2.1% or 1,063 of the total 50,283 families live below the poverty line. Families with 3 or 4 children have the highest poverty rate of 2.7%, comprising of 124 families. On the other hand, families with 5 or more children have the lowest poverty rate of 0.0%, which includes 0 families.
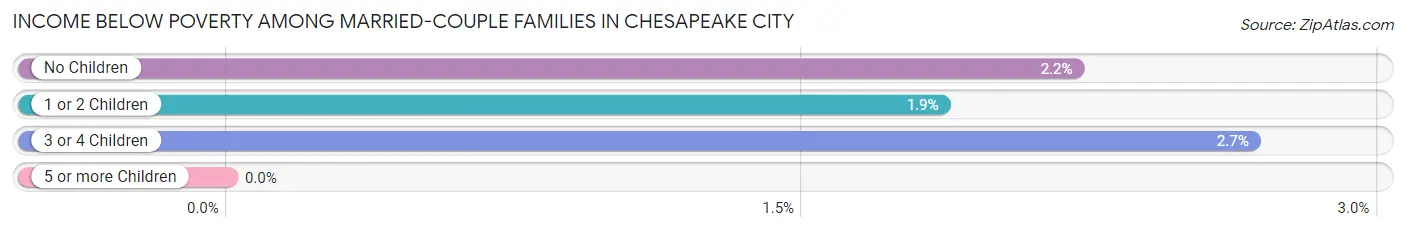
| Children | Above Poverty | Below Poverty |
| No Children | 26,377 (97.8%) | 597 (2.2%) |
| 1 or 2 Children | 18,074 (98.1%) | 342 (1.9%) |
| 3 or 4 Children | 4,515 (97.3%) | 124 (2.7%) |
| 5 or more Children | 254 (100.0%) | 0 (0.0%) |
| Total | 49,220 (97.9%) | 1,063 (2.1%) |
Income Below Poverty Among Single-Parent Households in Chesapeake city
According to the poverty data in Chesapeake city, 12.6% or 458 single-father households and 16.6% or 2,128 single-mother households are living below the poverty line. Among single-father households, those with 5 or more children have the highest poverty rate, with 45 households (100.0%) experiencing poverty. Likewise, among single-mother households, those with 5 or more children have the highest poverty rate, with 62 households (52.5%) falling below the poverty line.
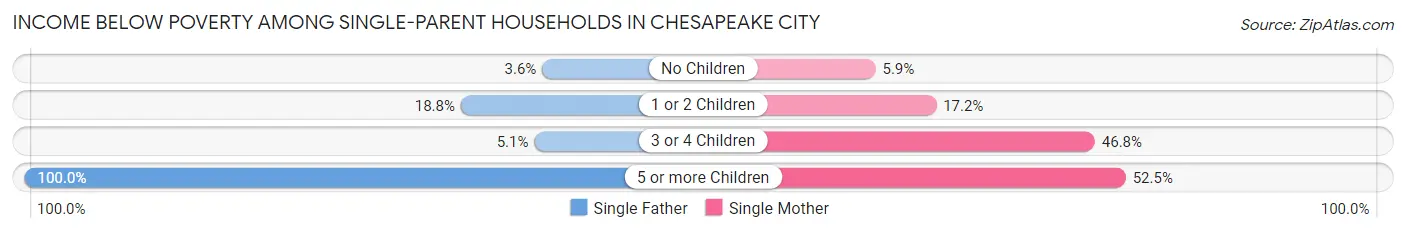
| Children | Single Father | Single Mother |
| No Children | 56 (3.6%) | 257 (5.9%) |
| 1 or 2 Children | 348 (18.8%) | 1,234 (17.2%) |
| 3 or 4 Children | 9 (5.1%) | 575 (46.8%) |
| 5 or more Children | 45 (100.0%) | 62 (52.5%) |
| Total | 458 (12.6%) | 2,128 (16.6%) |
Income Below Poverty Among Married-Couple vs Single-Parent Households in Chesapeake city
The poverty data for Chesapeake city shows that 1,063 of the married-couple family households (2.1%) and 2,586 of the single-parent households (15.7%) are living below the poverty level. Within the married-couple family households, those with 3 or 4 children have the highest poverty rate, with 124 households (2.7%) falling below the poverty line. Among the single-parent households, those with 5 or more children have the highest poverty rate, with 107 household (65.6%) living below poverty.
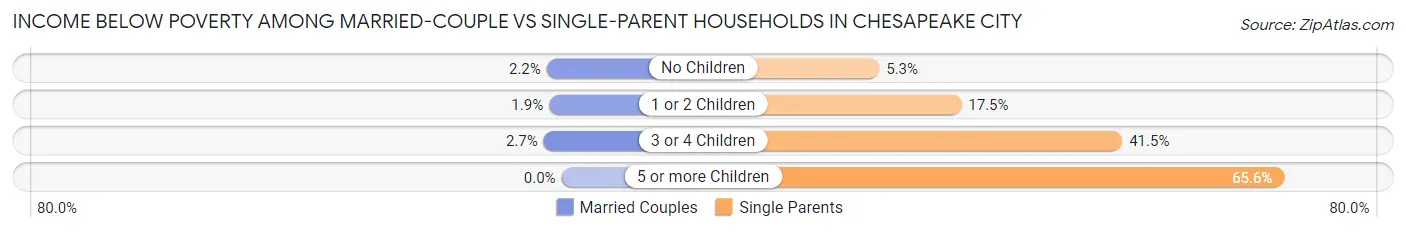
| Children | Married-Couple Families | Single-Parent Households |
| No Children | 597 (2.2%) | 313 (5.3%) |
| 1 or 2 Children | 342 (1.9%) | 1,582 (17.5%) |
| 3 or 4 Children | 124 (2.7%) | 584 (41.5%) |
| 5 or more Children | 0 (0.0%) | 107 (65.6%) |
| Total | 1,063 (2.1%) | 2,586 (15.7%) |
Race in Chesapeake city
The most populous races in Chesapeake city are White / Caucasian (142,840 | 57.3%), Black / African American (73,034 | 29.3%), and Two or more Races (17,786 | 7.1%).
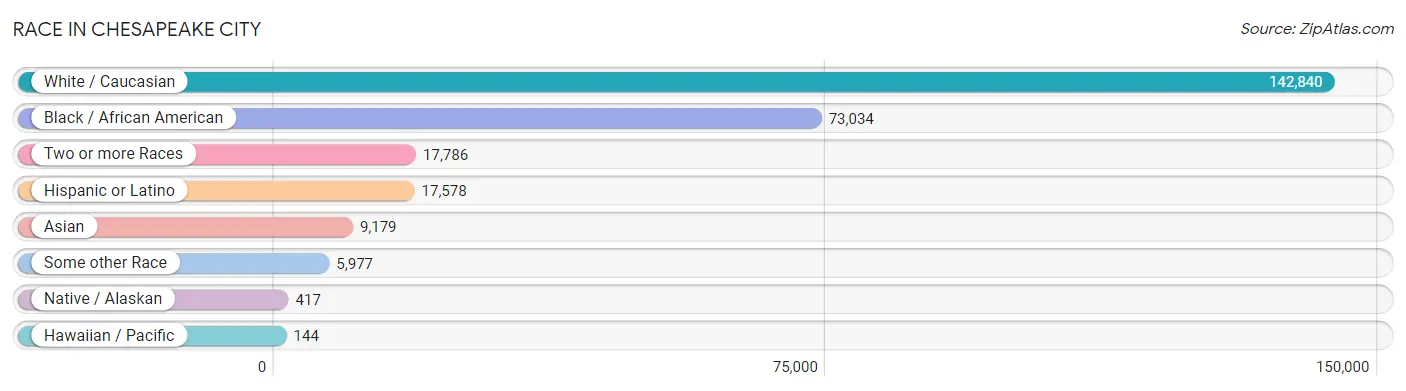
| Race | # Population | % Population |
| Asian | 9,179 | 3.7% |
| Black / African American | 73,034 | 29.3% |
| Hawaiian / Pacific | 144 | 0.1% |
| Hispanic or Latino | 17,578 | 7.0% |
| Native / Alaskan | 417 | 0.2% |
| White / Caucasian | 142,840 | 57.3% |
| Two or more Races | 17,786 | 7.1% |
| Some other Race | 5,977 | 2.4% |
| Total | 249,377 | 100.0% |
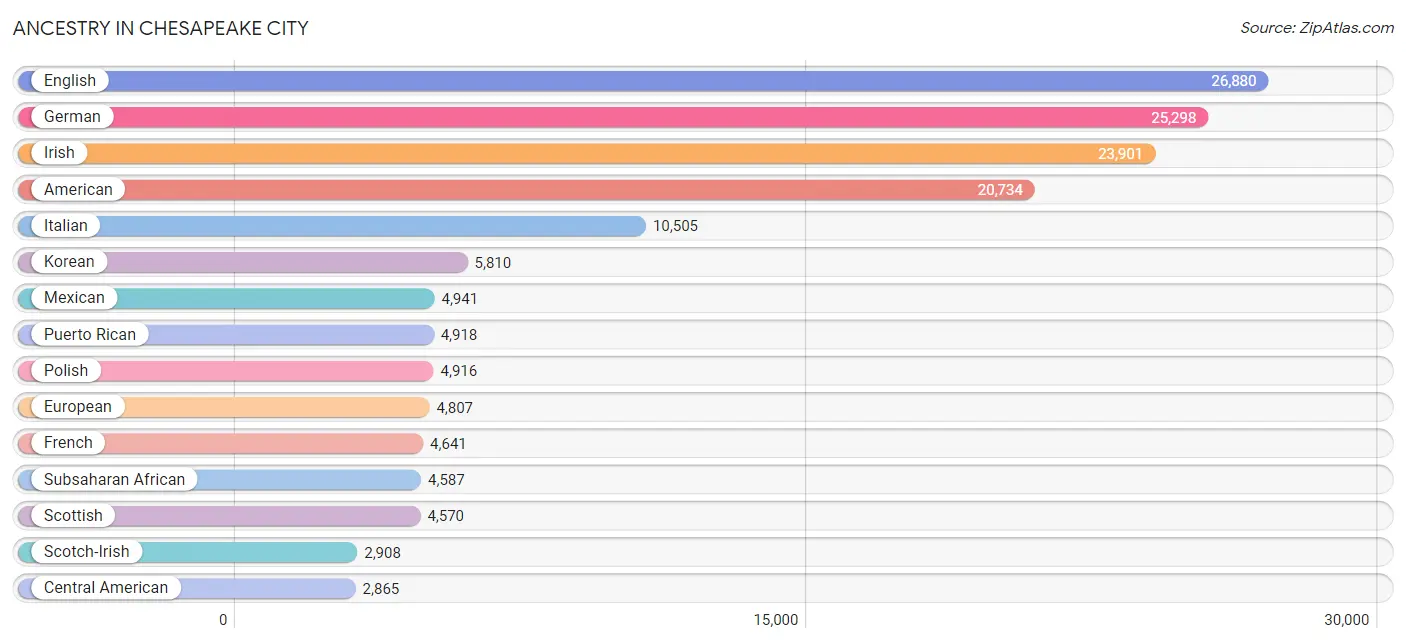
Ancestry in Chesapeake city
The most populous ancestries reported in Chesapeake city are English (26,880 | 10.8%), German (25,298 | 10.1%), Irish (23,901 | 9.6%), American (20,734 | 8.3%), and Italian (10,505 | 4.2%), together accounting for 43.0% of all Chesapeake city residents.
| Ancestry | # Population | % Population |
| Afghan | 95 | 0.0% |
| African | 2,647 | 1.1% |
| Albanian | 26 | 0.0% |
| American | 20,734 | 8.3% |
| Apache | 14 | 0.0% |
| Arab | 489 | 0.2% |
| Armenian | 40 | 0.0% |
| Australian | 47 | 0.0% |
| Austrian | 276 | 0.1% |
| Bangladeshi | 73 | 0.0% |
| Barbadian | 207 | 0.1% |
| Basque | 18 | 0.0% |
| Belgian | 106 | 0.0% |
| Bermudan | 36 | 0.0% |
| Bhutanese | 868 | 0.4% |
| Blackfeet | 145 | 0.1% |
| Bolivian | 220 | 0.1% |
| Brazilian | 255 | 0.1% |
| British | 1,346 | 0.5% |
| British West Indian | 24 | 0.0% |
| Bulgarian | 11 | 0.0% |
| Burmese | 1,618 | 0.6% |
| Cajun | 56 | 0.0% |
| Canadian | 374 | 0.2% |
| Cape Verdean | 45 | 0.0% |
| Central American | 2,865 | 1.1% |
| Central American Indian | 303 | 0.1% |
| Cherokee | 679 | 0.3% |
| Chickasaw | 46 | 0.0% |
| Chilean | 88 | 0.0% |
| Chippewa | 28 | 0.0% |
| Choctaw | 29 | 0.0% |
| Colombian | 444 | 0.2% |
| Creek | 42 | 0.0% |
| Croatian | 106 | 0.0% |
| Crow | 35 | 0.0% |
| Cuban | 1,009 | 0.4% |
| Czech | 507 | 0.2% |
| Czechoslovakian | 103 | 0.0% |
| Danish | 354 | 0.1% |
| Dominican | 539 | 0.2% |
| Dutch | 1,240 | 0.5% |
| Eastern European | 470 | 0.2% |
| Ecuadorian | 184 | 0.1% |
| Egyptian | 154 | 0.1% |
| English | 26,880 | 10.8% |
| Estonian | 29 | 0.0% |
| Ethiopian | 197 | 0.1% |
| European | 4,807 | 1.9% |
| Filipino | 78 | 0.0% |
| Finnish | 296 | 0.1% |
| French | 4,641 | 1.9% |
| French Canadian | 1,103 | 0.4% |
| German | 25,298 | 10.1% |
| Ghanaian | 234 | 0.1% |
| Greek | 979 | 0.4% |
| Guamanian / Chamorro | 130 | 0.1% |
| Guatemalan | 1,042 | 0.4% |
| Guyanese | 187 | 0.1% |
| Haitian | 1,004 | 0.4% |
| Honduran | 436 | 0.2% |
| Hopi | 31 | 0.0% |
| Hungarian | 733 | 0.3% |
| Indian (Asian) | 1,482 | 0.6% |
| Inupiat | 23 | 0.0% |
| Iranian | 72 | 0.0% |
| Iraqi | 39 | 0.0% |
| Irish | 23,901 | 9.6% |
| Iroquois | 16 | 0.0% |
| Italian | 10,505 | 4.2% |
| Jamaican | 1,075 | 0.4% |
| Japanese | 33 | 0.0% |
| Kenyan | 237 | 0.1% |
| Korean | 5,810 | 2.3% |
| Laotian | 52 | 0.0% |
| Latvian | 26 | 0.0% |
| Lebanese | 158 | 0.1% |
| Lithuanian | 391 | 0.2% |
| Lumbee | 14 | 0.0% |
| Luxembourger | 17 | 0.0% |
| Malaysian | 19 | 0.0% |
| Mexican | 4,941 | 2.0% |
| Mexican American Indian | 14 | 0.0% |
| Moroccan | 43 | 0.0% |
| Native Hawaiian | 201 | 0.1% |
| Navajo | 20 | 0.0% |
| Nicaraguan | 226 | 0.1% |
| Nigerian | 514 | 0.2% |
| Northern European | 224 | 0.1% |
| Norwegian | 1,670 | 0.7% |
| Pakistani | 351 | 0.1% |
| Panamanian | 345 | 0.1% |
| Paraguayan | 107 | 0.0% |
| Pennsylvania German | 7 | 0.0% |
| Peruvian | 340 | 0.1% |
| Polish | 4,916 | 2.0% |
| Portuguese | 503 | 0.2% |
| Pueblo | 73 | 0.0% |
| Puerto Rican | 4,918 | 2.0% |
| Romanian | 287 | 0.1% |
| Russian | 664 | 0.3% |
| Salvadoran | 816 | 0.3% |
| Samoan | 54 | 0.0% |
| Scandinavian | 743 | 0.3% |
| Scotch-Irish | 2,908 | 1.2% |
| Scottish | 4,570 | 1.8% |
| Seminole | 24 | 0.0% |
| Sierra Leonean | 60 | 0.0% |
| Sioux | 50 | 0.0% |
| Slavic | 63 | 0.0% |
| Slovak | 315 | 0.1% |
| Slovene | 46 | 0.0% |
| South African | 110 | 0.0% |
| South American | 1,454 | 0.6% |
| South American Indian | 62 | 0.0% |
| Spaniard | 608 | 0.2% |
| Spanish | 523 | 0.2% |
| Sri Lankan | 1,256 | 0.5% |
| Subsaharan African | 4,587 | 1.8% |
| Swedish | 1,380 | 0.5% |
| Swiss | 444 | 0.2% |
| Syrian | 31 | 0.0% |
| Thai | 921 | 0.4% |
| Trinidadian and Tobagonian | 201 | 0.1% |
| Turkish | 186 | 0.1% |
| U.S. Virgin Islander | 52 | 0.0% |
| Ukrainian | 312 | 0.1% |
| Uruguayan | 45 | 0.0% |
| Venezuelan | 26 | 0.0% |
| Welsh | 1,778 | 0.7% |
| West Indian | 375 | 0.2% |
| Yugoslavian | 45 | 0.0% |
| Zimbabwean | 31 | 0.0% | View All 133 Rows |
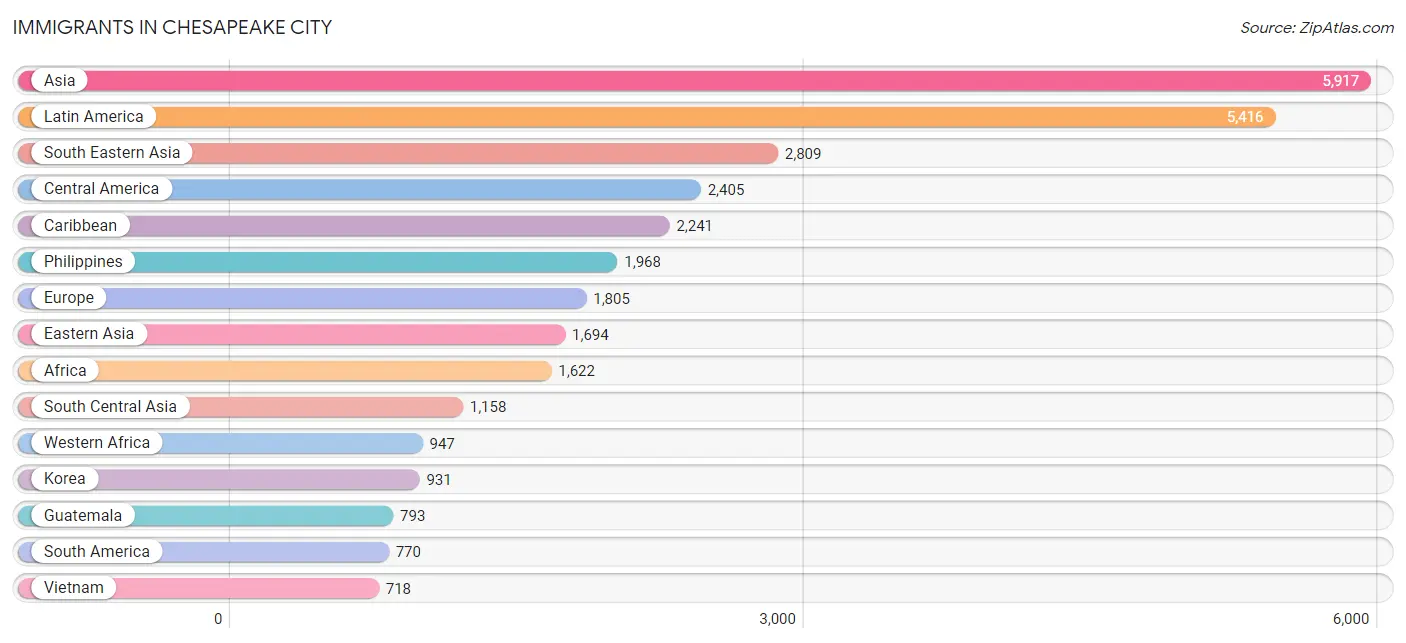
Immigrants in Chesapeake city
The most numerous immigrant groups reported in Chesapeake city came from Asia (5,917 | 2.4%), Latin America (5,416 | 2.2%), South Eastern Asia (2,809 | 1.1%), Central America (2,405 | 1.0%), and Caribbean (2,241 | 0.9%), together accounting for 7.5% of all Chesapeake city residents.
| Immigration Origin | # Population | % Population |
| Afghanistan | 34 | 0.0% |
| Africa | 1,622 | 0.6% |
| Albania | 26 | 0.0% |
| Asia | 5,917 | 2.4% |
| Australia | 10 | 0.0% |
| Austria | 47 | 0.0% |
| Bahamas | 14 | 0.0% |
| Bangladesh | 41 | 0.0% |
| Barbados | 208 | 0.1% |
| Bolivia | 110 | 0.0% |
| Bosnia and Herzegovina | 14 | 0.0% |
| Brazil | 135 | 0.1% |
| Cabo Verde | 22 | 0.0% |
| Canada | 184 | 0.1% |
| Caribbean | 2,241 | 0.9% |
| Central America | 2,405 | 1.0% |
| Chile | 33 | 0.0% |
| China | 574 | 0.2% |
| Colombia | 237 | 0.1% |
| Costa Rica | 29 | 0.0% |
| Cuba | 276 | 0.1% |
| Czechoslovakia | 17 | 0.0% |
| Denmark | 18 | 0.0% |
| Dominican Republic | 197 | 0.1% |
| Eastern Africa | 300 | 0.1% |
| Eastern Asia | 1,694 | 0.7% |
| Eastern Europe | 443 | 0.2% |
| Ecuador | 18 | 0.0% |
| Egypt | 34 | 0.0% |
| El Salvador | 479 | 0.2% |
| England | 188 | 0.1% |
| Ethiopia | 142 | 0.1% |
| Europe | 1,805 | 0.7% |
| France | 26 | 0.0% |
| Germany | 444 | 0.2% |
| Ghana | 309 | 0.1% |
| Guatemala | 793 | 0.3% |
| Guyana | 133 | 0.1% |
| Haiti | 644 | 0.3% |
| Honduras | 192 | 0.1% |
| Hong Kong | 61 | 0.0% |
| Hungary | 18 | 0.0% |
| India | 705 | 0.3% |
| Indonesia | 19 | 0.0% |
| Iran | 17 | 0.0% |
| Iraq | 39 | 0.0% |
| Ireland | 80 | 0.0% |
| Italy | 211 | 0.1% |
| Jamaica | 576 | 0.2% |
| Japan | 189 | 0.1% |
| Kazakhstan | 3 | 0.0% |
| Kenya | 97 | 0.0% |
| Korea | 931 | 0.4% |
| Kuwait | 8 | 0.0% |
| Latin America | 5,416 | 2.2% |
| Lebanon | 71 | 0.0% |
| Lithuania | 43 | 0.0% |
| Malaysia | 19 | 0.0% |
| Mexico | 622 | 0.3% |
| Middle Africa | 101 | 0.0% |
| Moldova | 84 | 0.0% |
| Morocco | 25 | 0.0% |
| Nepal | 81 | 0.0% |
| Netherlands | 73 | 0.0% |
| Nicaragua | 124 | 0.1% |
| Nigeria | 424 | 0.2% |
| Northern Africa | 147 | 0.1% |
| Northern Europe | 421 | 0.2% |
| Oceania | 10 | 0.0% |
| Pakistan | 277 | 0.1% |
| Panama | 166 | 0.1% |
| Peru | 82 | 0.0% |
| Philippines | 1,968 | 0.8% |
| Poland | 21 | 0.0% |
| Romania | 66 | 0.0% |
| Russia | 147 | 0.1% |
| Scotland | 26 | 0.0% |
| South Africa | 98 | 0.0% |
| South America | 770 | 0.3% |
| South Central Asia | 1,158 | 0.5% |
| South Eastern Asia | 2,809 | 1.1% |
| Southern Europe | 343 | 0.1% |
| Spain | 132 | 0.1% |
| Switzerland | 8 | 0.0% |
| Syria | 19 | 0.0% |
| Taiwan | 54 | 0.0% |
| Thailand | 85 | 0.0% |
| Trinidad and Tobago | 219 | 0.1% |
| Turkey | 119 | 0.1% |
| Uganda | 30 | 0.0% |
| Ukraine | 7 | 0.0% |
| Uruguay | 19 | 0.0% |
| Venezuela | 3 | 0.0% |
| Vietnam | 718 | 0.3% |
| West Indies | 18 | 0.0% |
| Western Africa | 947 | 0.4% |
| Western Asia | 256 | 0.1% |
| Western Europe | 598 | 0.2% |
| Zaire | 101 | 0.0% |
| Zimbabwe | 23 | 0.0% | View All 100 Rows |
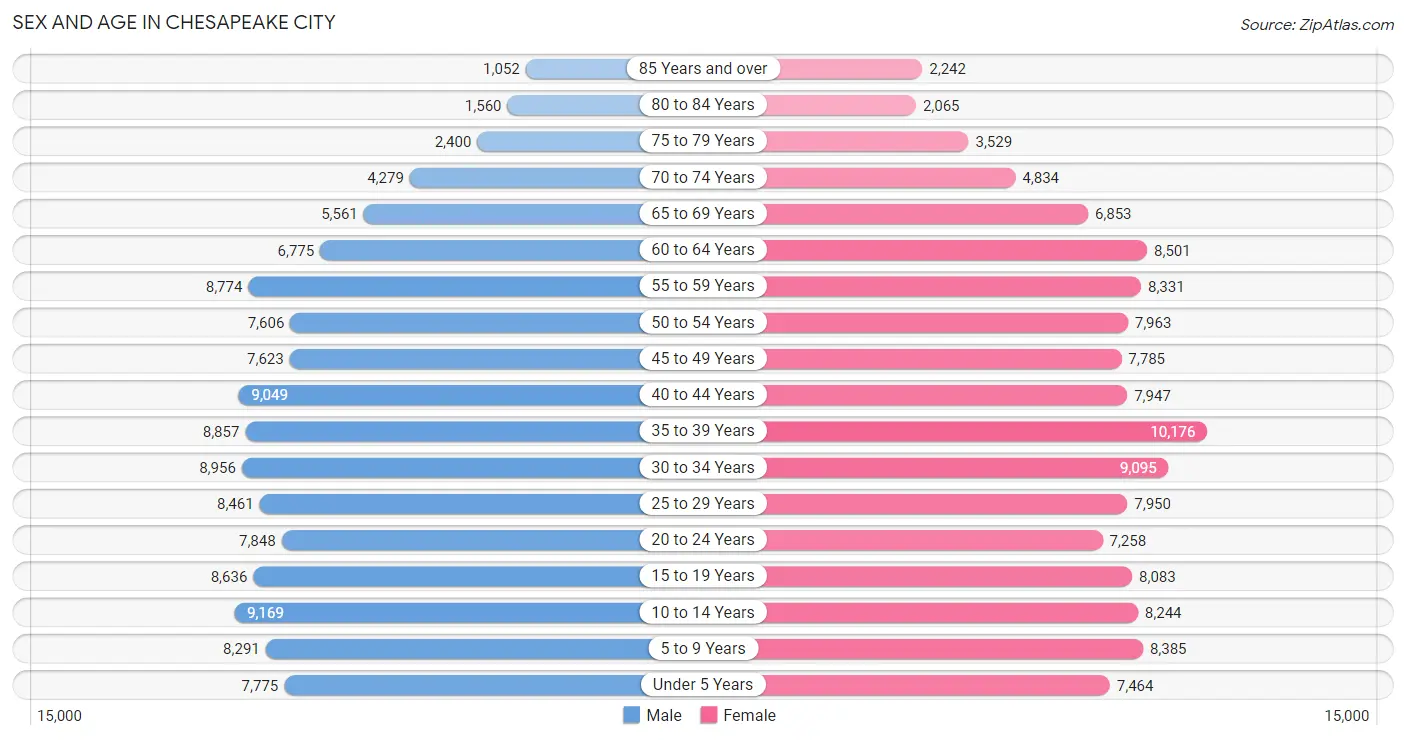
Sex and Age in Chesapeake city
Sex and Age in Chesapeake city
The most populous age groups in Chesapeake city are 10 to 14 Years (9,169 | 7.5%) for men and 35 to 39 Years (10,176 | 8.0%) for women.
| Age Bracket | Male | Female |
| Under 5 Years | 7,775 (6.3%) | 7,464 (5.9%) |
| 5 to 9 Years | 8,291 (6.8%) | 8,385 (6.6%) |
| 10 to 14 Years | 9,169 (7.5%) | 8,244 (6.5%) |
| 15 to 19 Years | 8,636 (7.0%) | 8,083 (6.4%) |
| 20 to 24 Years | 7,848 (6.4%) | 7,258 (5.7%) |
| 25 to 29 Years | 8,461 (6.9%) | 7,950 (6.3%) |
| 30 to 34 Years | 8,956 (7.3%) | 9,095 (7.2%) |
| 35 to 39 Years | 8,857 (7.2%) | 10,176 (8.0%) |
| 40 to 44 Years | 9,049 (7.4%) | 7,947 (6.3%) |
| 45 to 49 Years | 7,623 (6.2%) | 7,785 (6.1%) |
| 50 to 54 Years | 7,606 (6.2%) | 7,963 (6.3%) |
| 55 to 59 Years | 8,774 (7.1%) | 8,331 (6.6%) |
| 60 to 64 Years | 6,775 (5.5%) | 8,501 (6.7%) |
| 65 to 69 Years | 5,561 (4.5%) | 6,853 (5.4%) |
| 70 to 74 Years | 4,279 (3.5%) | 4,834 (3.8%) |
| 75 to 79 Years | 2,400 (2.0%) | 3,529 (2.8%) |
| 80 to 84 Years | 1,560 (1.3%) | 2,065 (1.6%) |
| 85 Years and over | 1,052 (0.9%) | 2,242 (1.8%) |
| Total | 122,672 (100.0%) | 126,705 (100.0%) |
Families and Households in Chesapeake city
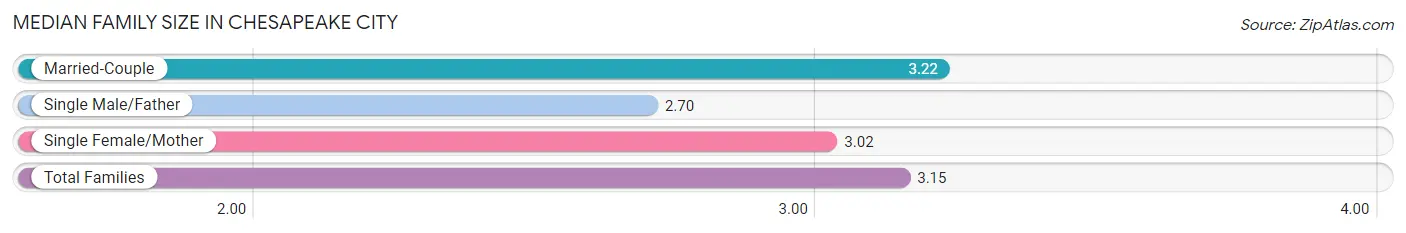
Median Family Size in Chesapeake city
The median family size in Chesapeake city is 3.15 persons per family, with married-couple families (50,283 | 75.3%) accounting for the largest median family size of 3.22 persons per family. On the other hand, single male/father families (3,636 | 5.4%) represent the smallest median family size with 2.70 persons per family.
| Family Type | # Families | Family Size |
| Married-Couple | 50,283 (75.3%) | 3.22 |
| Single Male/Father | 3,636 (5.4%) | 2.70 |
| Single Female/Mother | 12,841 (19.2%) | 3.02 |
| Total Families | 66,760 (100.0%) | 3.15 |
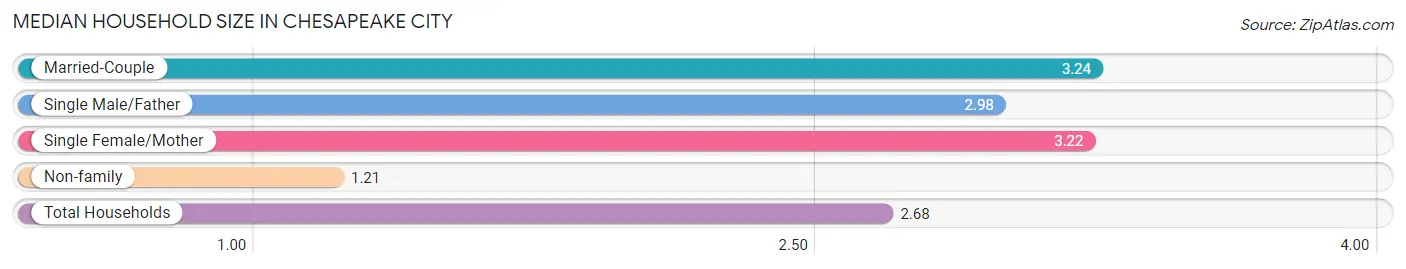
Median Household Size in Chesapeake city
The median household size in Chesapeake city is 2.68 persons per household, with married-couple households (50,283 | 55.0%) accounting for the largest median household size of 3.24 persons per household. non-family households (24,608 | 26.9%) represent the smallest median household size with 1.21 persons per household.
| Household Type | # Households | Household Size |
| Married-Couple | 50,283 (55.0%) | 3.24 |
| Single Male/Father | 3,636 (4.0%) | 2.98 |
| Single Female/Mother | 12,841 (14.1%) | 3.22 |
| Non-family | 24,608 (26.9%) | 1.21 |
| Total Households | 91,368 (100.0%) | 2.68 |
Household Size by Marriage Status in Chesapeake city
Out of a total of 91,368 households in Chesapeake city, 66,760 (73.1%) are family households, while 24,608 (26.9%) are nonfamily households. The most numerous type of family households are 2-person households, comprising 27,459, and the most common type of nonfamily households are 1-person households, comprising 20,345.
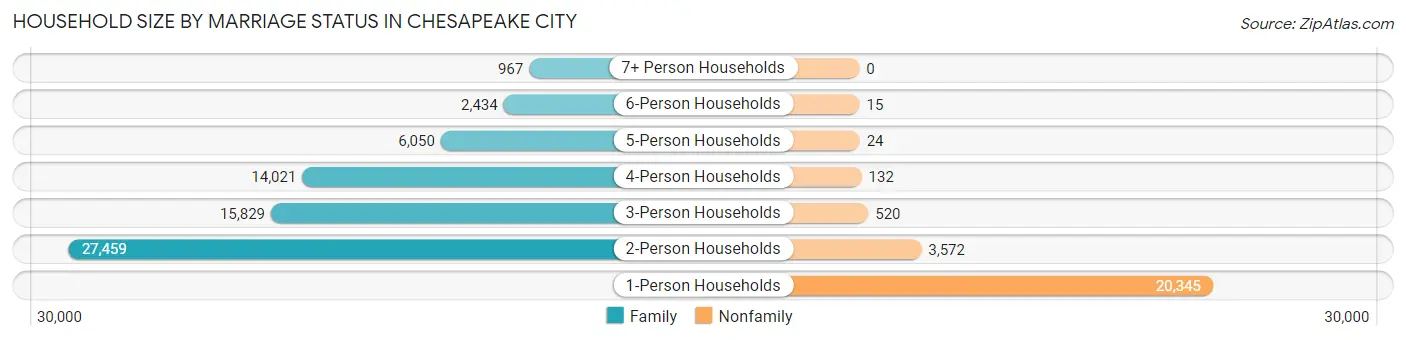
| Household Size | Family Households | Nonfamily Households |
| 1-Person Households | - | 20,345 (22.3%) |
| 2-Person Households | 27,459 (30.0%) | 3,572 (3.9%) |
| 3-Person Households | 15,829 (17.3%) | 520 (0.6%) |
| 4-Person Households | 14,021 (15.3%) | 132 (0.1%) |
| 5-Person Households | 6,050 (6.6%) | 24 (0.0%) |
| 6-Person Households | 2,434 (2.7%) | 15 (0.0%) |
| 7+ Person Households | 967 (1.1%) | 0 (0.0%) |
| Total | 66,760 (73.1%) | 24,608 (26.9%) |
Female Fertility in Chesapeake city
Fertility by Age in Chesapeake city
Average fertility rate in Chesapeake city is 54.0 births per 1,000 women. Women in the age bracket of 20 to 34 years have the highest fertility rate with 94.0 births per 1,000 women. Women in the age bracket of 20 to 34 years acount for 70.6% of all women with births.
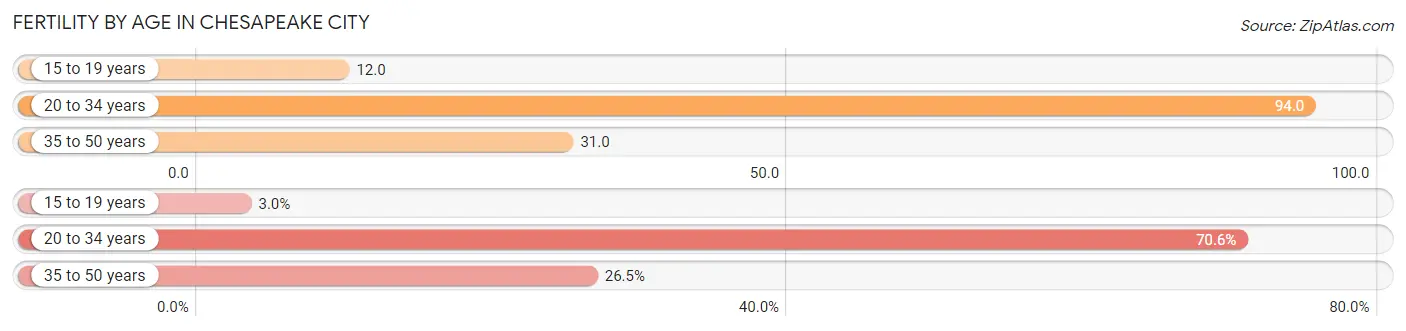
| Age Bracket | Women with Births | Births / 1,000 Women |
| 15 to 19 years | 96 (2.9%) | 12.0 |
| 20 to 34 years | 2,295 (70.6%) | 94.0 |
| 35 to 50 years | 860 (26.5%) | 31.0 |
| Total | 3,251 (100.0%) | 54.0 |
Fertility by Age by Marriage Status in Chesapeake city
77.9% of women with births (3,251) in Chesapeake city are married. The highest percentage of unmarried women with births falls into 15 to 19 years age bracket with 100.0% of them unmarried at the time of birth, while the lowest percentage of unmarried women with births belong to 20 to 34 years age bracket with 19.6% of them unmarried.
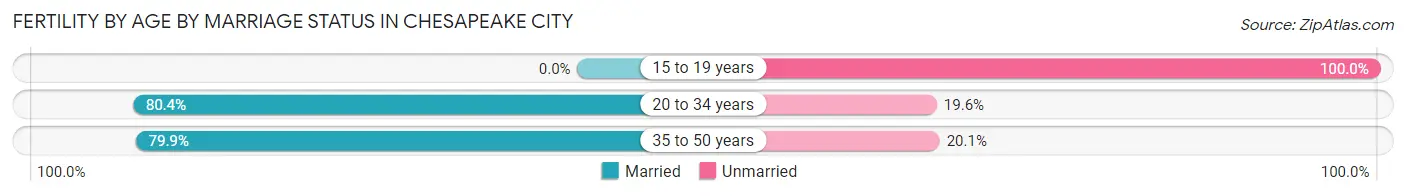
| Age Bracket | Married | Unmarried |
| 15 to 19 years | 0 (0.0%) | 96 (100.0%) |
| 20 to 34 years | 1,845 (80.4%) | 450 (19.6%) |
| 35 to 50 years | 687 (79.9%) | 173 (20.1%) |
| Total | 2,533 (77.9%) | 718 (22.1%) |
Fertility by Education in Chesapeake city
Average fertility rate in Chesapeake city is 54.0 births per 1,000 women. Women with the education attainment of bachelor's degree have the highest fertility rate of 70.0 births per 1,000 women, while women with the education attainment of less than high school have the lowest fertility at 28.0 births per 1,000 women. Women with the education attainment of college or associate's degree represent 34.1% of all women with births.
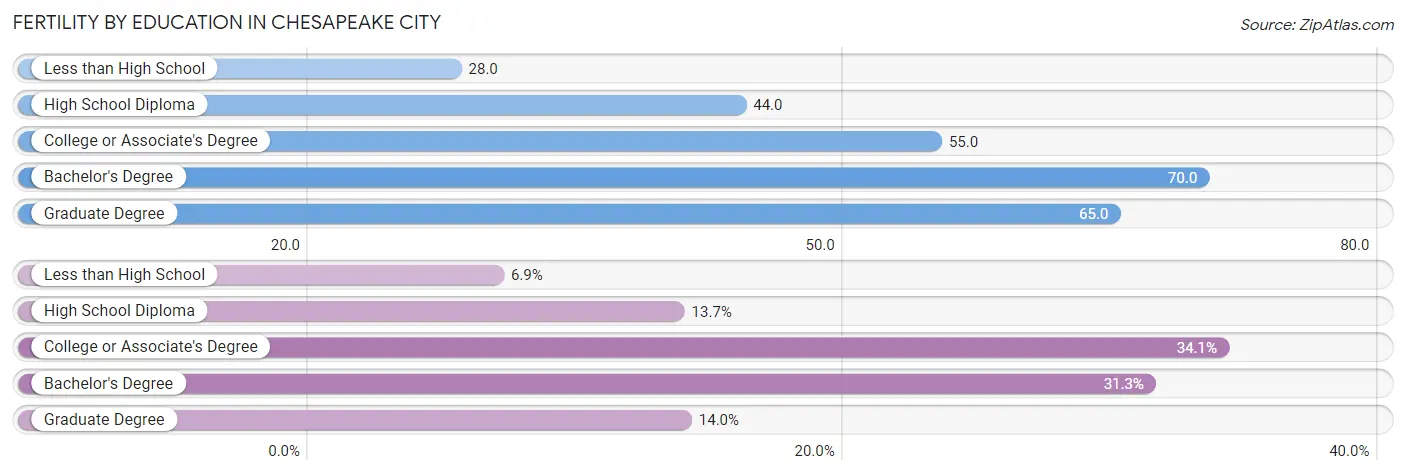
| Educational Attainment | Women with Births | Births / 1,000 Women |
| Less than High School | 225 (6.9%) | 28.0 |
| High School Diploma | 445 (13.7%) | 44.0 |
| College or Associate's Degree | 1,108 (34.1%) | 55.0 |
| Bachelor's Degree | 1,019 (31.3%) | 70.0 |
| Graduate Degree | 454 (14.0%) | 65.0 |
| Total | 3,251 (100.0%) | 54.0 |
Fertility by Education by Marriage Status in Chesapeake city
22.1% of women with births in Chesapeake city are unmarried. Women with the educational attainment of bachelor's degree are most likely to be married with 92.0% of them married at childbirth, while women with the educational attainment of less than high school are least likely to be married with 51.6% of them unmarried at childbirth.
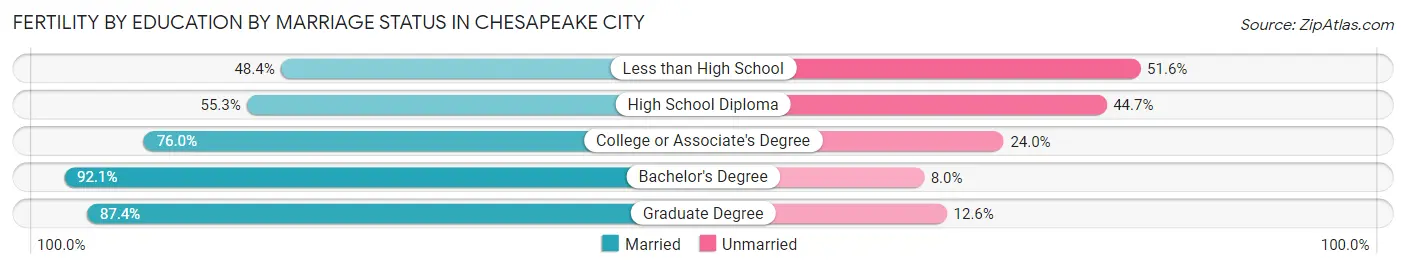
| Educational Attainment | Married | Unmarried |
| Less than High School | 109 (48.4%) | 116 (51.6%) |
| High School Diploma | 246 (55.3%) | 199 (44.7%) |
| College or Associate's Degree | 842 (76.0%) | 266 (24.0%) |
| Bachelor's Degree | 938 (92.0%) | 81 (8.0%) |
| Graduate Degree | 397 (87.4%) | 57 (12.6%) |
| Total | 2,533 (77.9%) | 718 (22.1%) |
Employment Characteristics in Chesapeake city
Employment by Class of Employer in Chesapeake city
Among the 123,540 employed individuals in Chesapeake city, private company employees (68,568 | 55.5%), federal government employees (21,121 | 17.1%), and local government employees (10,942 | 8.9%) make up the most common classes of employment.
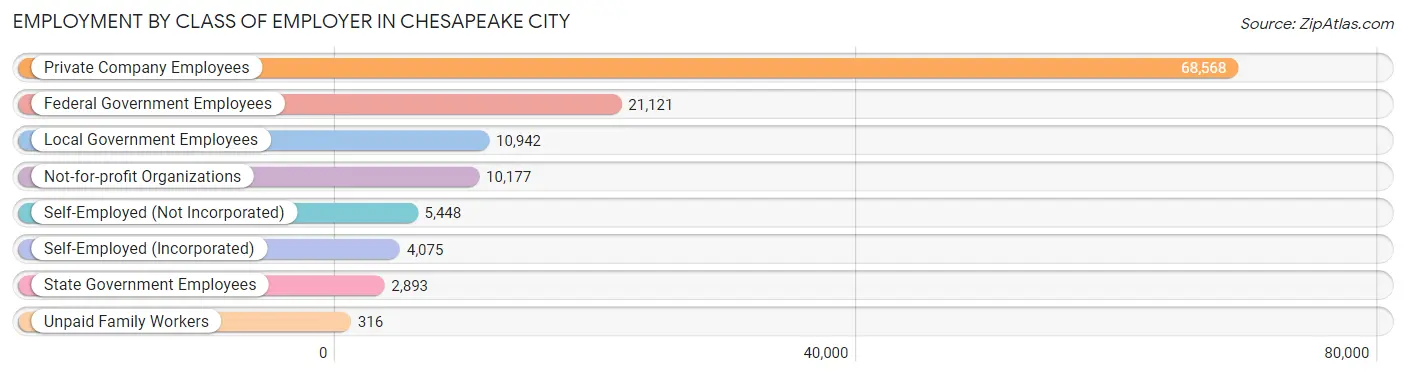
| Employer Class | # Employees | % Employees |
| Private Company Employees | 68,568 | 55.5% |
| Self-Employed (Incorporated) | 4,075 | 3.3% |
| Self-Employed (Not Incorporated) | 5,448 | 4.4% |
| Not-for-profit Organizations | 10,177 | 8.2% |
| Local Government Employees | 10,942 | 8.9% |
| State Government Employees | 2,893 | 2.3% |
| Federal Government Employees | 21,121 | 17.1% |
| Unpaid Family Workers | 316 | 0.3% |
| Total | 123,540 | 100.0% |
Employment Status by Age in Chesapeake city
According to the labor force statistics for Chesapeake city, out of the total population over 16 years of age (196,635), 67.2% or 132,139 individuals are in the labor force, with 5.0% or 6,607 of them unemployed. The age group with the highest labor force participation rate is 30 to 34 years, with 85.3% or 15,398 individuals in the labor force. Within the labor force, the 16 to 19 years age range has the highest percentage of unemployed individuals, with 14.9% or 807 of them being unemployed.
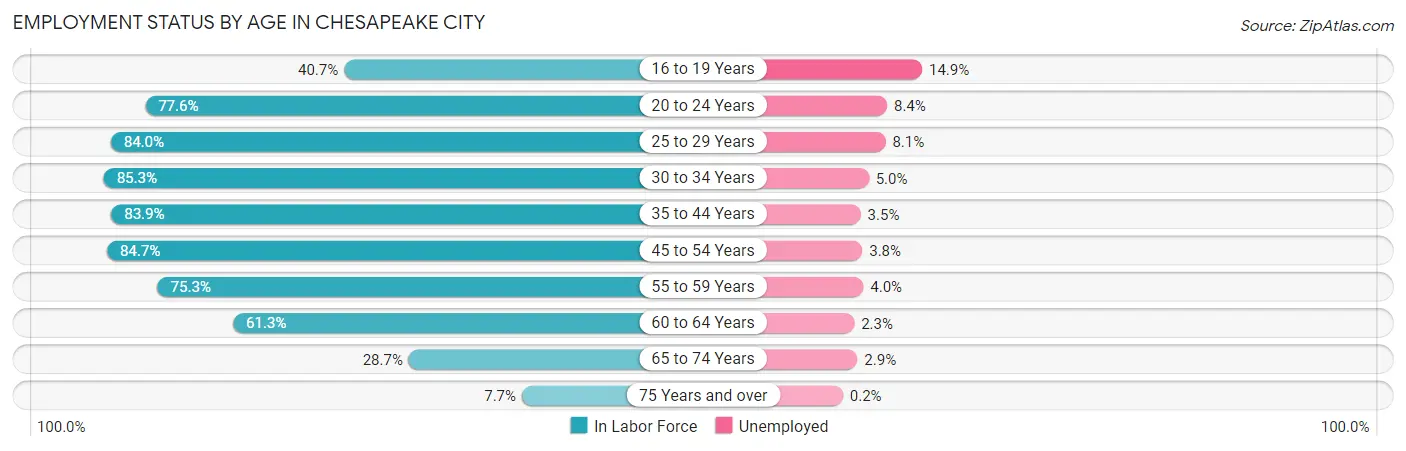
| Age Bracket | In Labor Force | Unemployed |
| 16 to 19 Years | 5,415 (40.7%) | 807 (14.9%) |
| 20 to 24 Years | 11,722 (77.6%) | 985 (8.4%) |
| 25 to 29 Years | 13,785 (84.0%) | 1,117 (8.1%) |
| 30 to 34 Years | 15,398 (85.3%) | 770 (5.0%) |
| 35 to 44 Years | 30,228 (83.9%) | 1,058 (3.5%) |
| 45 to 54 Years | 26,238 (84.7%) | 997 (3.8%) |
| 55 to 59 Years | 12,880 (75.3%) | 515 (4.0%) |
| 60 to 64 Years | 9,364 (61.3%) | 215 (2.3%) |
| 65 to 74 Years | 6,178 (28.7%) | 179 (2.9%) |
| 75 Years and over | 989 (7.7%) | 2 (0.2%) |
| Total | 132,139 (67.2%) | 6,607 (5.0%) |
Employment Status by Educational Attainment in Chesapeake city
According to labor force statistics for Chesapeake city, 80.6% of individuals (107,882) out of the total population between 25 and 64 years of age (133,849) are in the labor force, with 4.3% or 4,639 of them being unemployed. The group with the highest labor force participation rate are those with the educational attainment of bachelor's degree or higher, with 88.4% or 44,187 individuals in the labor force. Within the labor force, individuals with less than high school education have the highest percentage of unemployment, with 8.3% or 367 of them being unemployed.
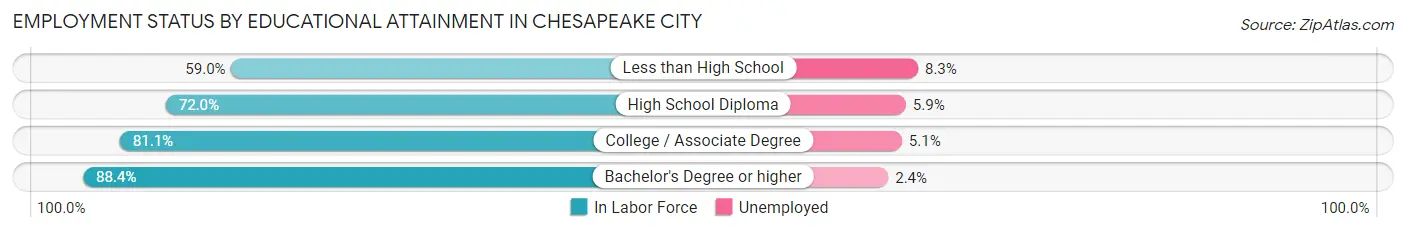
| Educational Attainment | In Labor Force | Unemployed |
| Less than High School | 4,419 (59.0%) | 622 (8.3%) |
| High School Diploma | 20,873 (72.0%) | 1,710 (5.9%) |
| College / Associate Degree | 38,428 (81.1%) | 2,417 (5.1%) |
| Bachelor's Degree or higher | 44,187 (88.4%) | 1,200 (2.4%) |
| Total | 107,882 (80.6%) | 5,756 (4.3%) |
Employment Occupations by Sex in Chesapeake city
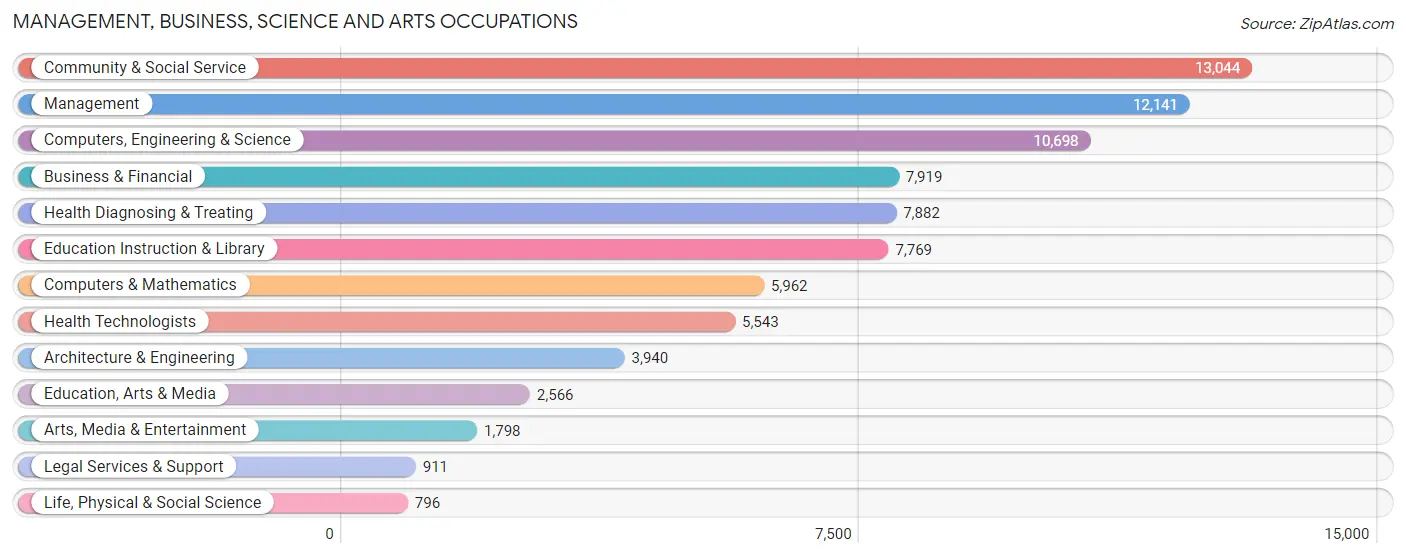
Management, Business, Science and Arts Occupations
The most common Management, Business, Science and Arts occupations in Chesapeake city are Community & Social Service (13,044 | 11.1%), Management (12,141 | 10.3%), Computers, Engineering & Science (10,698 | 9.1%), Business & Financial (7,919 | 6.7%), and Health Diagnosing & Treating (7,882 | 6.7%).
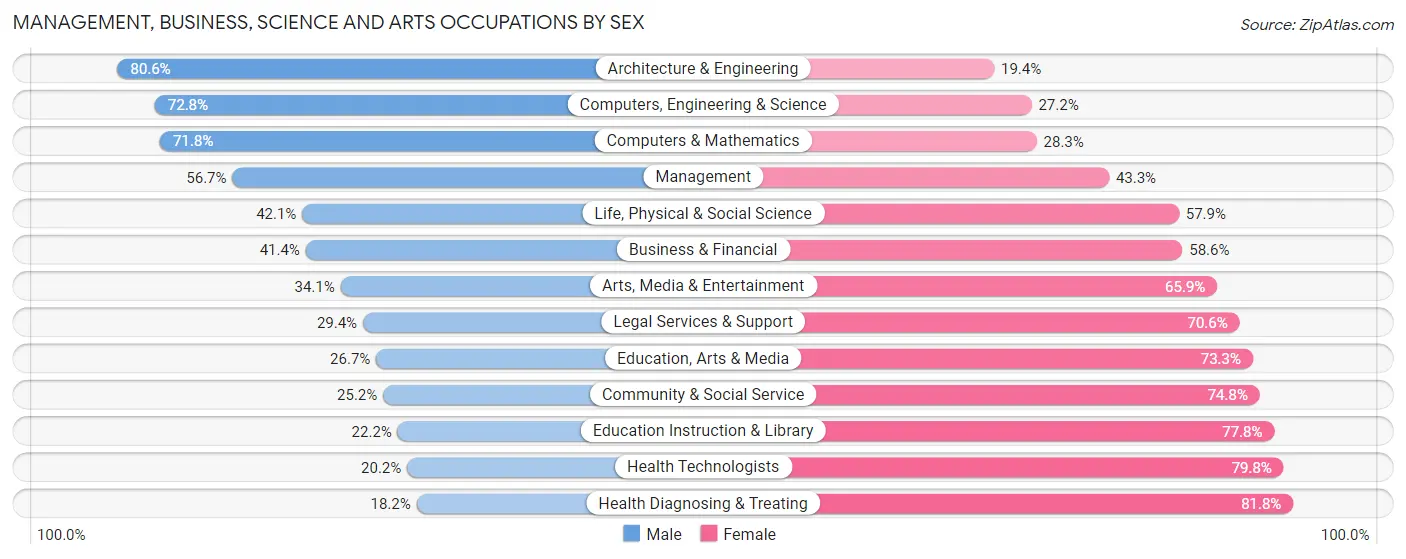
Management, Business, Science and Arts Occupations by Sex
Within the Management, Business, Science and Arts occupations in Chesapeake city, the most male-oriented occupations are Architecture & Engineering (80.6%), Computers, Engineering & Science (72.8%), and Computers & Mathematics (71.8%), while the most female-oriented occupations are Health Diagnosing & Treating (81.8%), Health Technologists (79.8%), and Education Instruction & Library (77.8%).
| Occupation | Male | Female |
| Management | 6,879 (56.7%) | 5,262 (43.3%) |
| Business & Financial | 3,275 (41.4%) | 4,644 (58.6%) |
| Computers, Engineering & Science | 7,790 (72.8%) | 2,908 (27.2%) |
| Computers & Mathematics | 4,278 (71.8%) | 1,684 (28.2%) |
| Architecture & Engineering | 3,177 (80.6%) | 763 (19.4%) |
| Life, Physical & Social Science | 335 (42.1%) | 461 (57.9%) |
| Community & Social Service | 3,288 (25.2%) | 9,756 (74.8%) |
| Education, Arts & Media | 684 (26.7%) | 1,882 (73.3%) |
| Legal Services & Support | 268 (29.4%) | 643 (70.6%) |
| Education Instruction & Library | 1,723 (22.2%) | 6,046 (77.8%) |
| Arts, Media & Entertainment | 613 (34.1%) | 1,185 (65.9%) |
| Health Diagnosing & Treating | 1,437 (18.2%) | 6,445 (81.8%) |
| Health Technologists | 1,120 (20.2%) | 4,423 (79.8%) |
| Total (Category) | 22,669 (43.9%) | 29,015 (56.1%) |
| Total (Overall) | 58,641 (49.8%) | 59,041 (50.2%) |
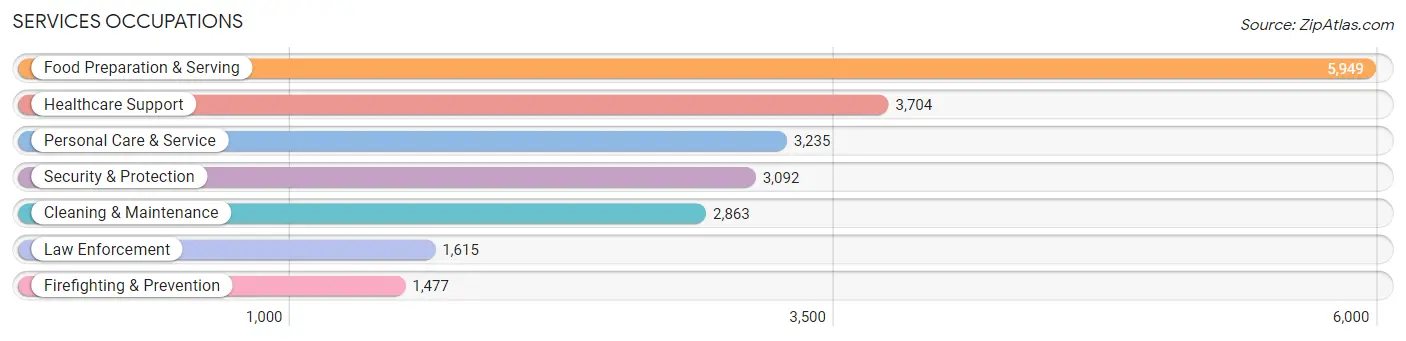
Services Occupations
The most common Services occupations in Chesapeake city are Food Preparation & Serving (5,949 | 5.1%), Healthcare Support (3,704 | 3.2%), Personal Care & Service (3,235 | 2.8%), Security & Protection (3,092 | 2.6%), and Cleaning & Maintenance (2,863 | 2.4%).
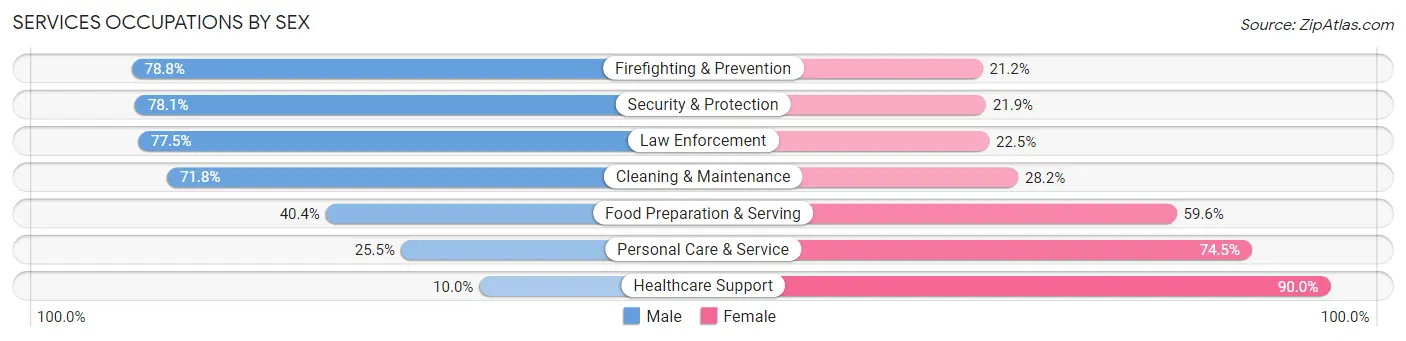
Services Occupations by Sex
Within the Services occupations in Chesapeake city, the most male-oriented occupations are Firefighting & Prevention (78.8%), Security & Protection (78.1%), and Law Enforcement (77.5%), while the most female-oriented occupations are Healthcare Support (90.0%), Personal Care & Service (74.5%), and Food Preparation & Serving (59.6%).
| Occupation | Male | Female |
| Healthcare Support | 370 (10.0%) | 3,334 (90.0%) |
| Security & Protection | 2,416 (78.1%) | 676 (21.9%) |
| Firefighting & Prevention | 1,164 (78.8%) | 313 (21.2%) |
| Law Enforcement | 1,252 (77.5%) | 363 (22.5%) |
| Food Preparation & Serving | 2,402 (40.4%) | 3,547 (59.6%) |
| Cleaning & Maintenance | 2,055 (71.8%) | 808 (28.2%) |
| Personal Care & Service | 825 (25.5%) | 2,410 (74.5%) |
| Total (Category) | 8,068 (42.8%) | 10,775 (57.2%) |
| Total (Overall) | 58,641 (49.8%) | 59,041 (50.2%) |
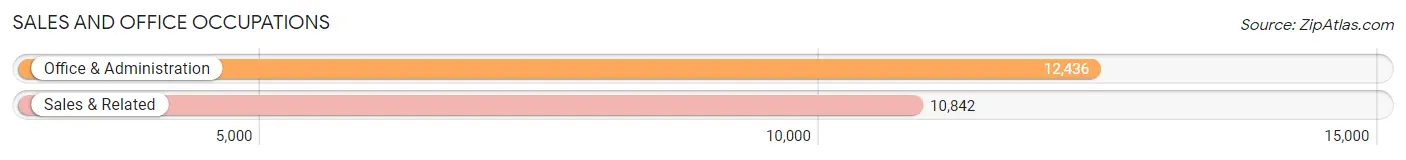
Sales and Office Occupations
The most common Sales and Office occupations in Chesapeake city are Office & Administration (12,436 | 10.6%), and Sales & Related (10,842 | 9.2%).
Sales and Office Occupations by Sex
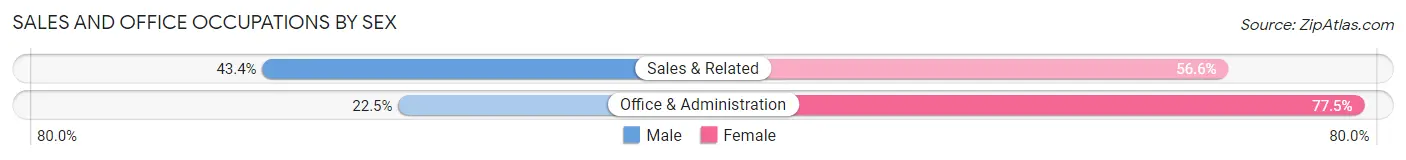
| Occupation | Male | Female |
| Sales & Related | 4,706 (43.4%) | 6,136 (56.6%) |
| Office & Administration | 2,798 (22.5%) | 9,638 (77.5%) |
| Total (Category) | 7,504 (32.2%) | 15,774 (67.8%) |
| Total (Overall) | 58,641 (49.8%) | 59,041 (50.2%) |
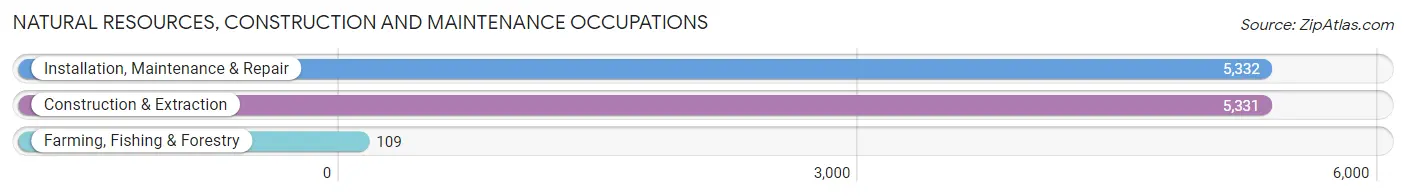
Natural Resources, Construction and Maintenance Occupations
The most common Natural Resources, Construction and Maintenance occupations in Chesapeake city are Installation, Maintenance & Repair (5,332 | 4.5%), Construction & Extraction (5,331 | 4.5%), and Farming, Fishing & Forestry (109 | 0.1%).
Natural Resources, Construction and Maintenance Occupations by Sex
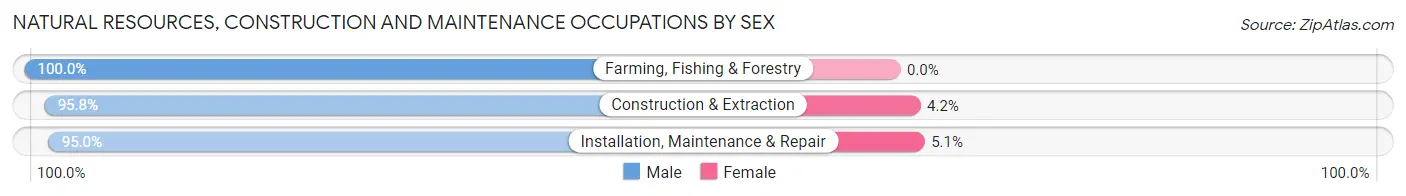
| Occupation | Male | Female |
| Farming, Fishing & Forestry | 109 (100.0%) | 0 (0.0%) |
| Construction & Extraction | 5,107 (95.8%) | 224 (4.2%) |
| Installation, Maintenance & Repair | 5,063 (95.0%) | 269 (5.1%) |
| Total (Category) | 10,279 (95.4%) | 493 (4.6%) |
| Total (Overall) | 58,641 (49.8%) | 59,041 (50.2%) |
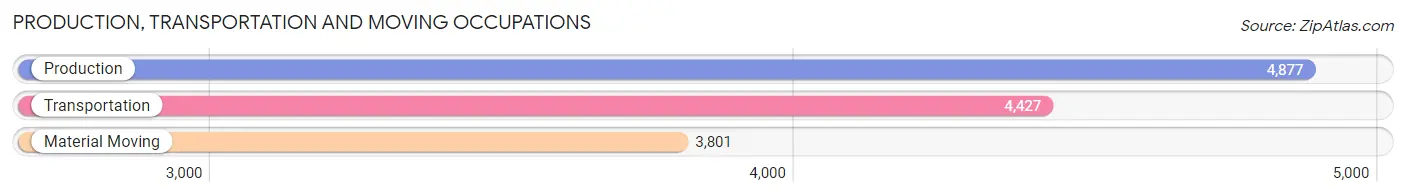
Production, Transportation and Moving Occupations
The most common Production, Transportation and Moving occupations in Chesapeake city are Production (4,877 | 4.1%), Transportation (4,427 | 3.8%), and Material Moving (3,801 | 3.2%).
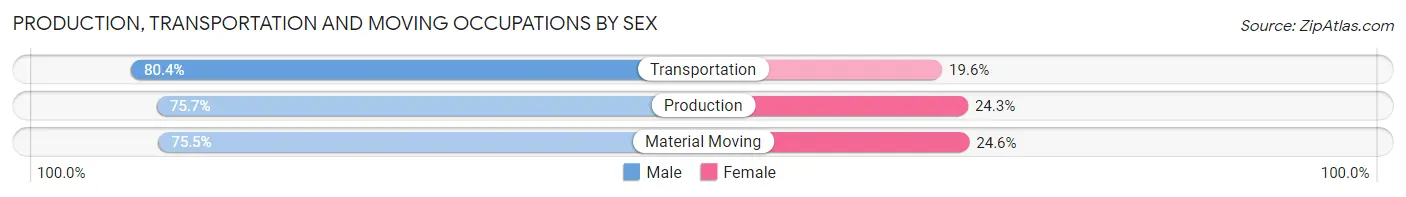
Production, Transportation and Moving Occupations by Sex
| Occupation | Male | Female |
| Production | 3,692 (75.7%) | 1,185 (24.3%) |
| Transportation | 3,561 (80.4%) | 866 (19.6%) |
| Material Moving | 2,868 (75.4%) | 933 (24.5%) |
| Total (Category) | 10,121 (77.2%) | 2,984 (22.8%) |
| Total (Overall) | 58,641 (49.8%) | 59,041 (50.2%) |
Employment Industries by Sex in Chesapeake city
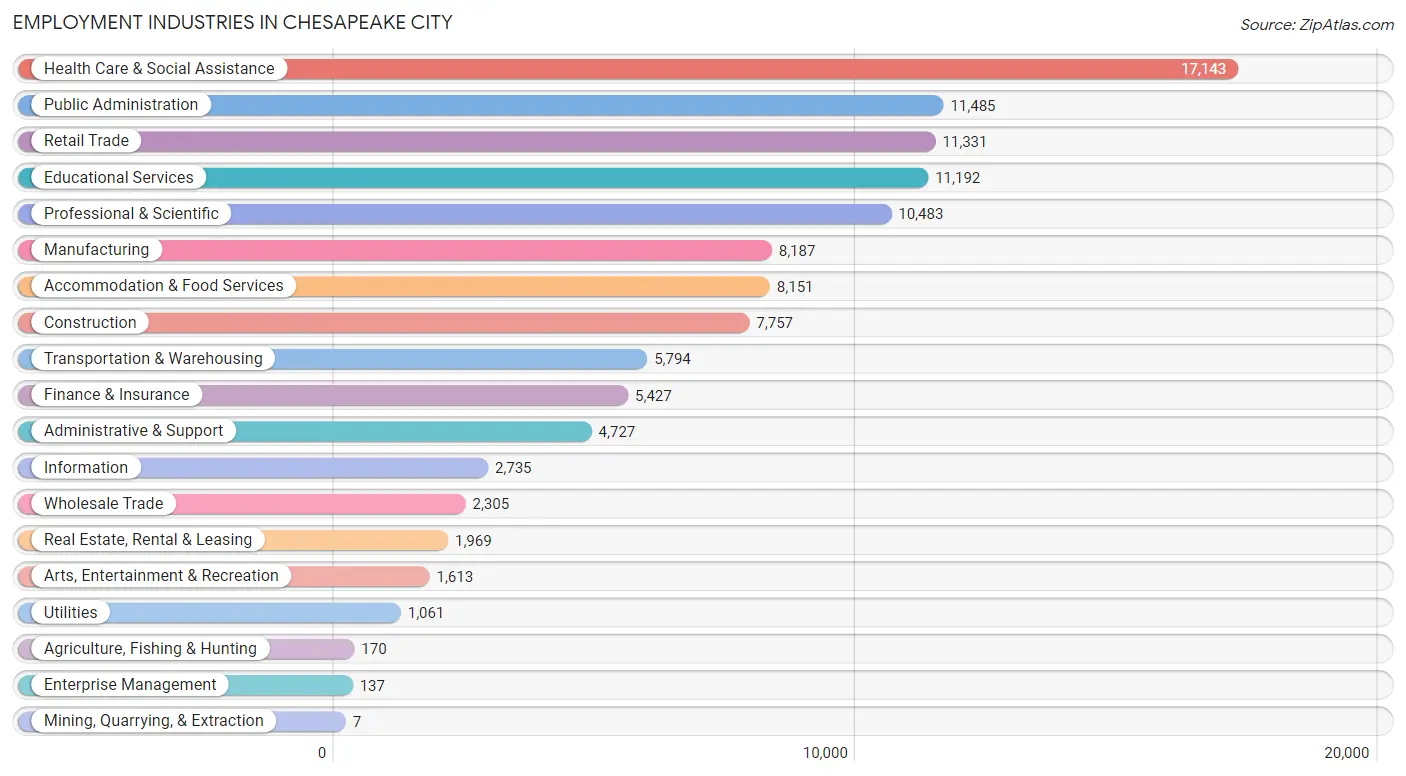
Employment Industries in Chesapeake city
The major employment industries in Chesapeake city include Health Care & Social Assistance (17,143 | 14.6%), Public Administration (11,485 | 9.8%), Retail Trade (11,331 | 9.6%), Educational Services (11,192 | 9.5%), and Professional & Scientific (10,483 | 8.9%).
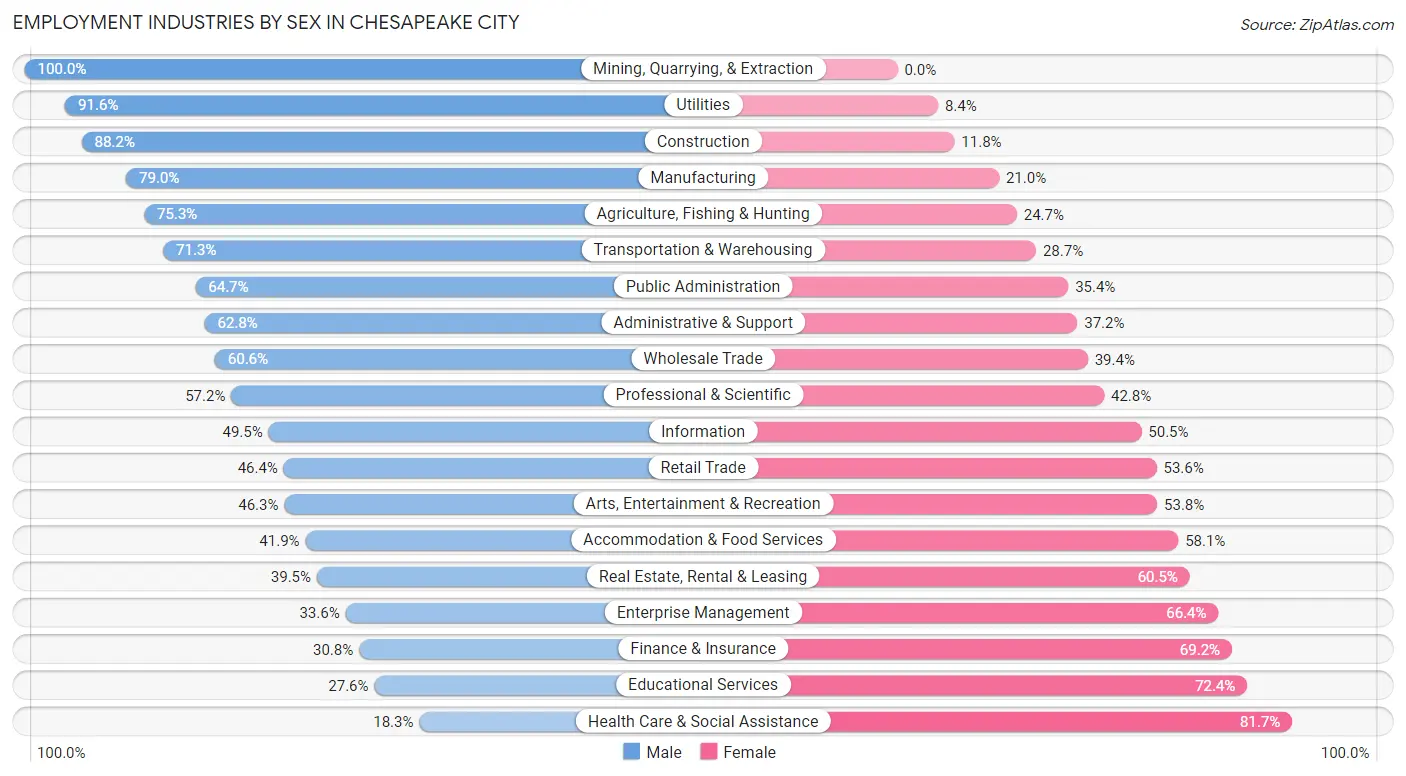
Employment Industries by Sex in Chesapeake city
The Chesapeake city industries that see more men than women are Mining, Quarrying, & Extraction (100.0%), Utilities (91.6%), and Construction (88.2%), whereas the industries that tend to have a higher number of women are Health Care & Social Assistance (81.7%), Educational Services (72.4%), and Finance & Insurance (69.2%).
| Industry | Male | Female |
| Agriculture, Fishing & Hunting | 128 (75.3%) | 42 (24.7%) |
| Mining, Quarrying, & Extraction | 7 (100.0%) | 0 (0.0%) |
| Construction | 6,842 (88.2%) | 915 (11.8%) |
| Manufacturing | 6,466 (79.0%) | 1,721 (21.0%) |
| Wholesale Trade | 1,397 (60.6%) | 908 (39.4%) |
| Retail Trade | 5,254 (46.4%) | 6,077 (53.6%) |
| Transportation & Warehousing | 4,132 (71.3%) | 1,662 (28.7%) |
| Utilities | 972 (91.6%) | 89 (8.4%) |
| Information | 1,354 (49.5%) | 1,381 (50.5%) |
| Finance & Insurance | 1,670 (30.8%) | 3,757 (69.2%) |
| Real Estate, Rental & Leasing | 778 (39.5%) | 1,191 (60.5%) |
| Professional & Scientific | 5,999 (57.2%) | 4,484 (42.8%) |
| Enterprise Management | 46 (33.6%) | 91 (66.4%) |
| Administrative & Support | 2,967 (62.8%) | 1,760 (37.2%) |
| Educational Services | 3,090 (27.6%) | 8,102 (72.4%) |
| Health Care & Social Assistance | 3,138 (18.3%) | 14,005 (81.7%) |
| Arts, Entertainment & Recreation | 746 (46.3%) | 867 (53.7%) |
| Accommodation & Food Services | 3,414 (41.9%) | 4,737 (58.1%) |
| Public Administration | 7,425 (64.6%) | 4,060 (35.3%) |
| Total | 58,641 (49.8%) | 59,041 (50.2%) |
Education in Chesapeake city
School Enrollment in Chesapeake city
The most common levels of schooling among the 63,858 students in Chesapeake city are high school (14,553 | 22.8%), middle school (13,512 | 21.2%), and elementary school (13,069 | 20.5%).
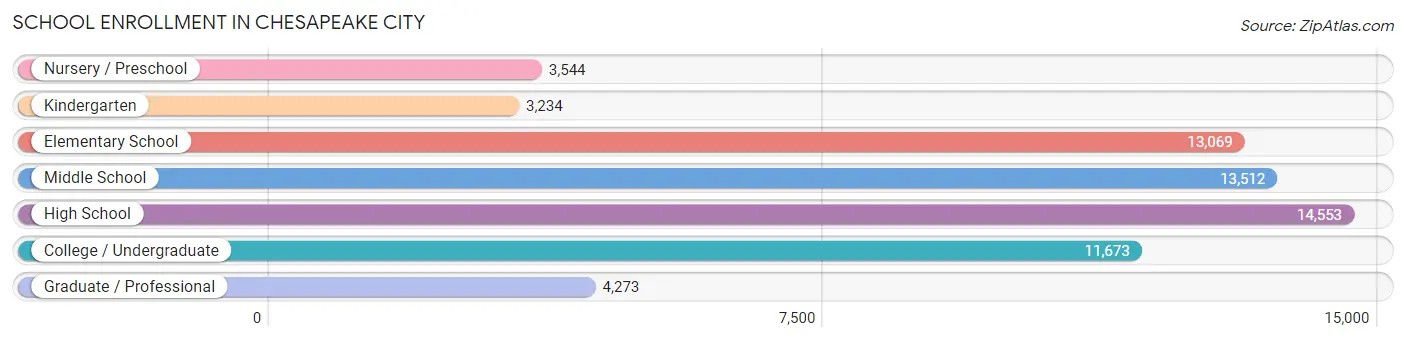
| School Level | # Students | % Students |
| Nursery / Preschool | 3,544 | 5.6% |
| Kindergarten | 3,234 | 5.1% |
| Elementary School | 13,069 | 20.5% |
| Middle School | 13,512 | 21.2% |
| High School | 14,553 | 22.8% |
| College / Undergraduate | 11,673 | 18.3% |
| Graduate / Professional | 4,273 | 6.7% |
| Total | 63,858 | 100.0% |
School Enrollment by Age by Funding Source in Chesapeake city
Out of a total of 63,858 students who are enrolled in schools in Chesapeake city, 11,622 (18.2%) attend a private institution, while the remaining 52,236 (81.8%) are enrolled in public schools. The age group of 3 to 4 year olds has the highest likelihood of being enrolled in private schools, with 1,644 (60.9% in the age bracket) enrolled. Conversely, the age group of 15 to 17 year olds has the lowest likelihood of being enrolled in a private school, with 9,697 (92.7% in the age bracket) attending a public institution.
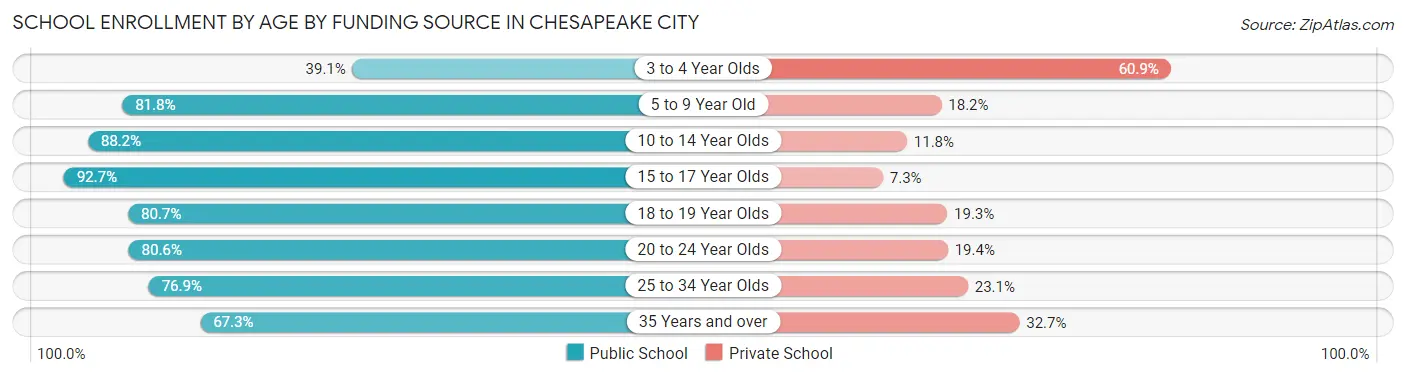
| Age Bracket | Public School | Private School |
| 3 to 4 Year Olds | 1,055 (39.1%) | 1,644 (60.9%) |
| 5 to 9 Year Old | 12,547 (81.8%) | 2,789 (18.2%) |
| 10 to 14 Year Olds | 14,902 (88.2%) | 1,988 (11.8%) |
| 15 to 17 Year Olds | 9,697 (92.7%) | 764 (7.3%) |
| 18 to 19 Year Olds | 3,314 (80.7%) | 791 (19.3%) |
| 20 to 24 Year Olds | 3,706 (80.6%) | 891 (19.4%) |
| 25 to 34 Year Olds | 3,734 (76.9%) | 1,123 (23.1%) |
| 35 Years and over | 3,306 (67.3%) | 1,607 (32.7%) |
| Total | 52,236 (81.8%) | 11,622 (18.2%) |
Educational Attainment by Field of Study in Chesapeake city
Business (12,572 | 19.4%), science & technology (6,932 | 10.7%), education (6,917 | 10.6%), arts & humanities (5,982 | 9.2%), and social sciences (4,359 | 6.7%) are the most common fields of study among 64,971 individuals in Chesapeake city who have obtained a bachelor's degree or higher.
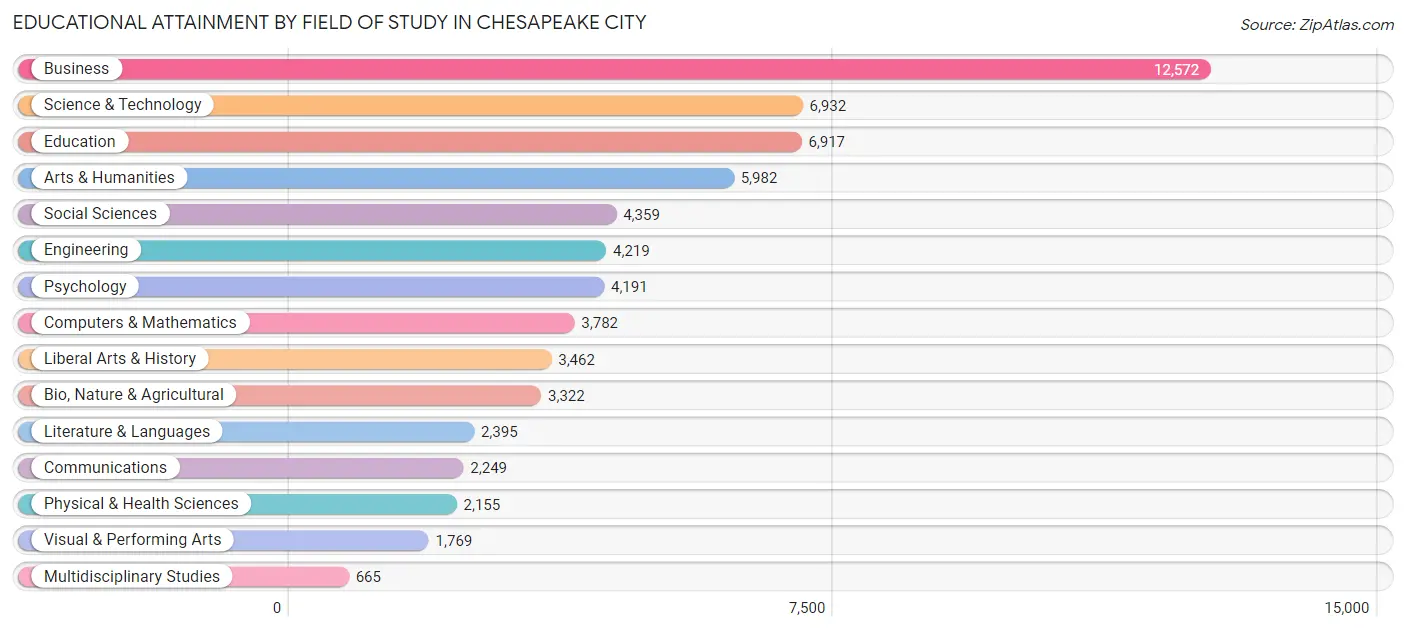
| Field of Study | # Graduates | % Graduates |
| Computers & Mathematics | 3,782 | 5.8% |
| Bio, Nature & Agricultural | 3,322 | 5.1% |
| Physical & Health Sciences | 2,155 | 3.3% |
| Psychology | 4,191 | 6.5% |
| Social Sciences | 4,359 | 6.7% |
| Engineering | 4,219 | 6.5% |
| Multidisciplinary Studies | 665 | 1.0% |
| Science & Technology | 6,932 | 10.7% |
| Business | 12,572 | 19.4% |
| Education | 6,917 | 10.6% |
| Literature & Languages | 2,395 | 3.7% |
| Liberal Arts & History | 3,462 | 5.3% |
| Visual & Performing Arts | 1,769 | 2.7% |
| Communications | 2,249 | 3.5% |
| Arts & Humanities | 5,982 | 9.2% |
| Total | 64,971 | 100.0% |
Transportation & Commute in Chesapeake city
Vehicle Availability by Sex in Chesapeake city
The most prevalent vehicle ownership categories in Chesapeake city are males with 2 vehicles (27,879, accounting for 43.6%) and females with 2 vehicles (23,780, making up 47.1%).
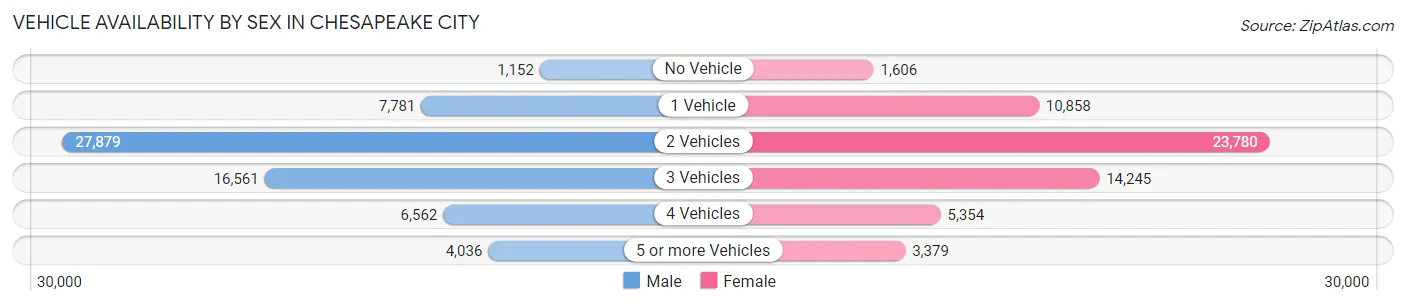
| Vehicles Available | Male | Female |
| No Vehicle | 1,152 (1.8%) | 1,606 (2.7%) |
| 1 Vehicle | 7,781 (12.2%) | 10,858 (18.3%) |
| 2 Vehicles | 27,879 (43.6%) | 23,780 (40.2%) |
| 3 Vehicles | 16,561 (25.9%) | 14,245 (24.0%) |
| 4 Vehicles | 6,562 (10.3%) | 5,354 (9.0%) |
| 5 or more Vehicles | 4,036 (6.3%) | 3,379 (5.7%) |
| Total | 63,971 (100.0%) | 59,222 (100.0%) |
Commute Time in Chesapeake city
The most frequently occuring commute durations in Chesapeake city are 30 to 34 minutes (19,186 commuters, 17.2%), 15 to 19 minutes (18,396 commuters, 16.5%), and 20 to 24 minutes (18,188 commuters, 16.3%).
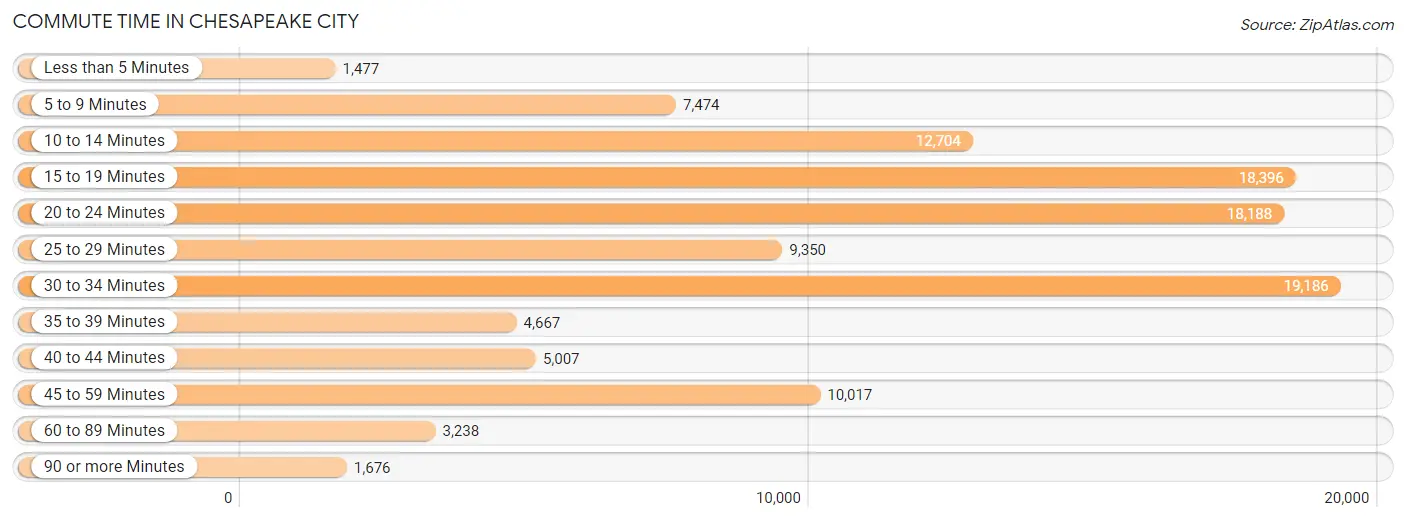
| Commute Time | # Commuters | % Commuters |
| Less than 5 Minutes | 1,477 | 1.3% |
| 5 to 9 Minutes | 7,474 | 6.7% |
| 10 to 14 Minutes | 12,704 | 11.4% |
| 15 to 19 Minutes | 18,396 | 16.5% |
| 20 to 24 Minutes | 18,188 | 16.3% |
| 25 to 29 Minutes | 9,350 | 8.4% |
| 30 to 34 Minutes | 19,186 | 17.2% |
| 35 to 39 Minutes | 4,667 | 4.2% |
| 40 to 44 Minutes | 5,007 | 4.5% |
| 45 to 59 Minutes | 10,017 | 9.0% |
| 60 to 89 Minutes | 3,238 | 2.9% |
| 90 or more Minutes | 1,676 | 1.5% |
Commute Time by Sex in Chesapeake city
The most common commute times in Chesapeake city are 30 to 34 minutes (11,346 commuters, 19.1%) for males and 20 to 24 minutes (9,672 commuters, 18.6%) for females.
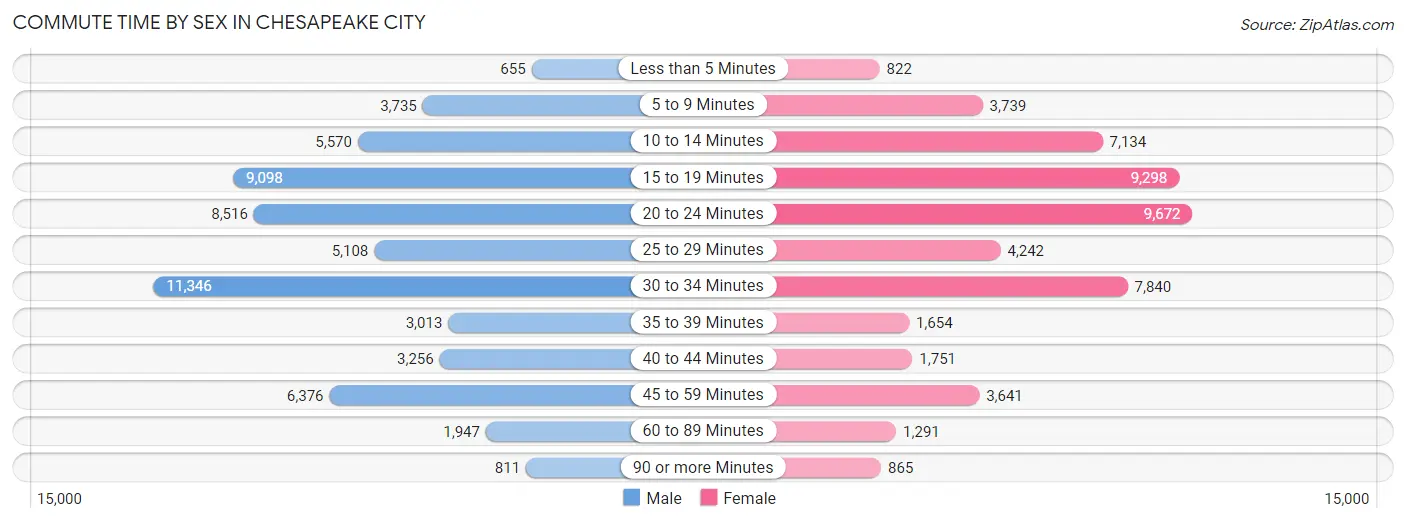
| Commute Time | Male | Female |
| Less than 5 Minutes | 655 (1.1%) | 822 (1.6%) |
| 5 to 9 Minutes | 3,735 (6.3%) | 3,739 (7.2%) |
| 10 to 14 Minutes | 5,570 (9.4%) | 7,134 (13.7%) |
| 15 to 19 Minutes | 9,098 (15.3%) | 9,298 (17.9%) |
| 20 to 24 Minutes | 8,516 (14.3%) | 9,672 (18.6%) |
| 25 to 29 Minutes | 5,108 (8.6%) | 4,242 (8.2%) |
| 30 to 34 Minutes | 11,346 (19.1%) | 7,840 (15.1%) |
| 35 to 39 Minutes | 3,013 (5.1%) | 1,654 (3.2%) |
| 40 to 44 Minutes | 3,256 (5.5%) | 1,751 (3.4%) |
| 45 to 59 Minutes | 6,376 (10.7%) | 3,641 (7.0%) |
| 60 to 89 Minutes | 1,947 (3.3%) | 1,291 (2.5%) |
| 90 or more Minutes | 811 (1.4%) | 865 (1.7%) |
Time of Departure to Work by Sex in Chesapeake city
The most frequent times of departure to work in Chesapeake city are 7:00 AM to 7:29 AM (8,655, 14.6%) for males and 7:00 AM to 7:29 AM (8,982, 17.3%) for females.
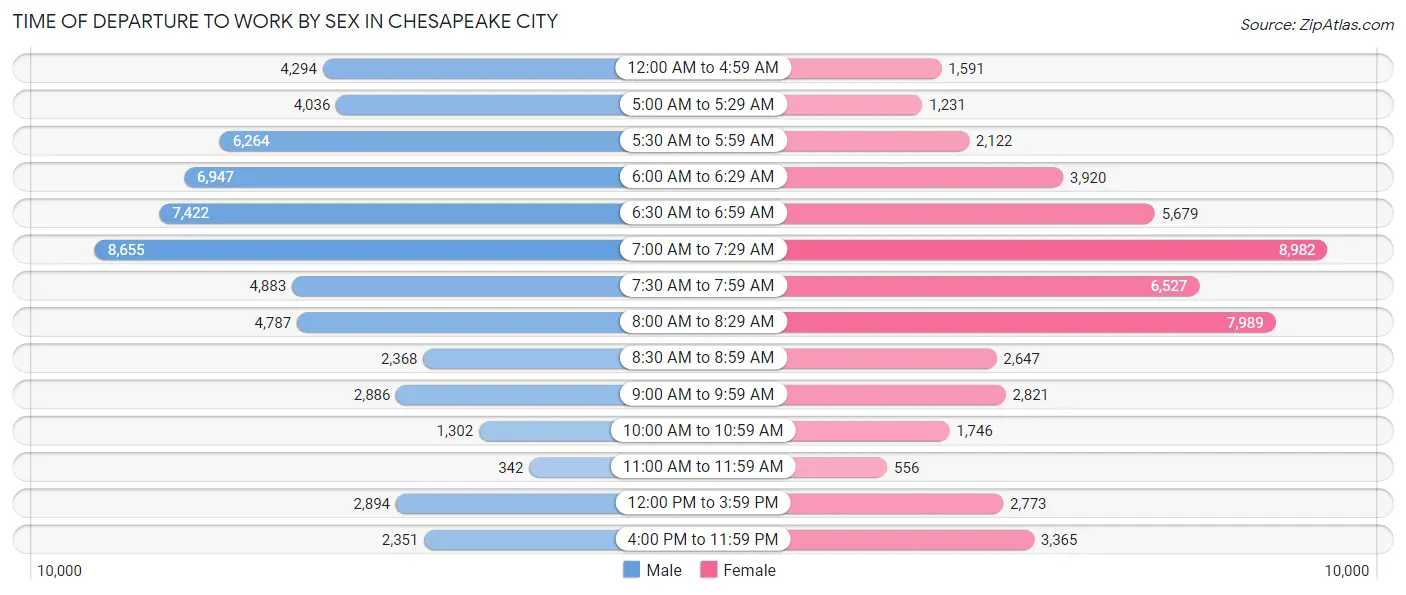
| Time of Departure | Male | Female |
| 12:00 AM to 4:59 AM | 4,294 (7.2%) | 1,591 (3.1%) |
| 5:00 AM to 5:29 AM | 4,036 (6.8%) | 1,231 (2.4%) |
| 5:30 AM to 5:59 AM | 6,264 (10.5%) | 2,122 (4.1%) |
| 6:00 AM to 6:29 AM | 6,947 (11.7%) | 3,920 (7.5%) |
| 6:30 AM to 6:59 AM | 7,422 (12.5%) | 5,679 (10.9%) |
| 7:00 AM to 7:29 AM | 8,655 (14.6%) | 8,982 (17.3%) |
| 7:30 AM to 7:59 AM | 4,883 (8.2%) | 6,527 (12.6%) |
| 8:00 AM to 8:29 AM | 4,787 (8.1%) | 7,989 (15.4%) |
| 8:30 AM to 8:59 AM | 2,368 (4.0%) | 2,647 (5.1%) |
| 9:00 AM to 9:59 AM | 2,886 (4.9%) | 2,821 (5.4%) |
| 10:00 AM to 10:59 AM | 1,302 (2.2%) | 1,746 (3.4%) |
| 11:00 AM to 11:59 AM | 342 (0.6%) | 556 (1.1%) |
| 12:00 PM to 3:59 PM | 2,894 (4.9%) | 2,773 (5.3%) |
| 4:00 PM to 11:59 PM | 2,351 (4.0%) | 3,365 (6.5%) |
| Total | 59,431 (100.0%) | 51,949 (100.0%) |
Housing Occupancy in Chesapeake city
Occupancy by Ownership in Chesapeake city
Of the total 91,368 dwellings in Chesapeake city, owner-occupied units account for 66,988 (73.3%), while renter-occupied units make up 24,380 (26.7%).
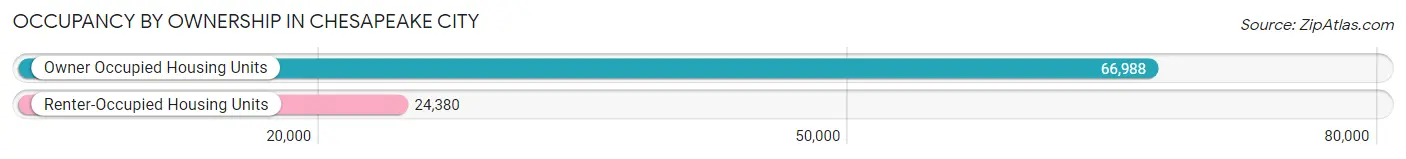
| Occupancy | # Housing Units | % Housing Units |
| Owner Occupied Housing Units | 66,988 | 73.3% |
| Renter-Occupied Housing Units | 24,380 | 26.7% |
| Total Occupied Housing Units | 91,368 | 100.0% |
Occupancy by Household Size in Chesapeake city
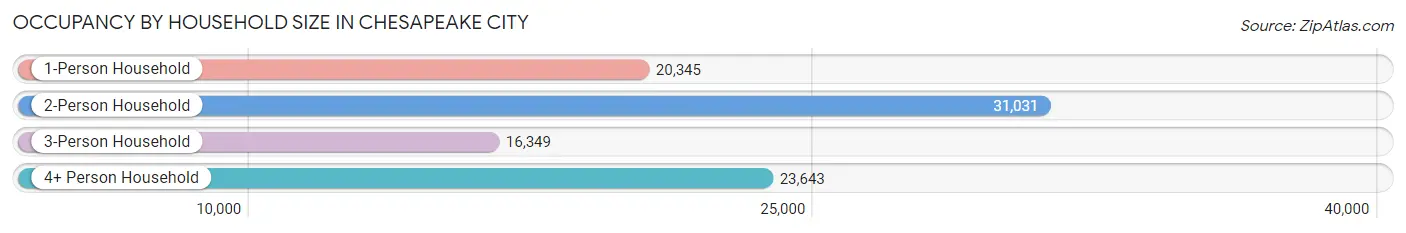
| Household Size | # Housing Units | % Housing Units |
| 1-Person Household | 20,345 | 22.3% |
| 2-Person Household | 31,031 | 34.0% |
| 3-Person Household | 16,349 | 17.9% |
| 4+ Person Household | 23,643 | 25.9% |
| Total Housing Units | 91,368 | 100.0% |
Occupancy by Ownership by Household Size in Chesapeake city
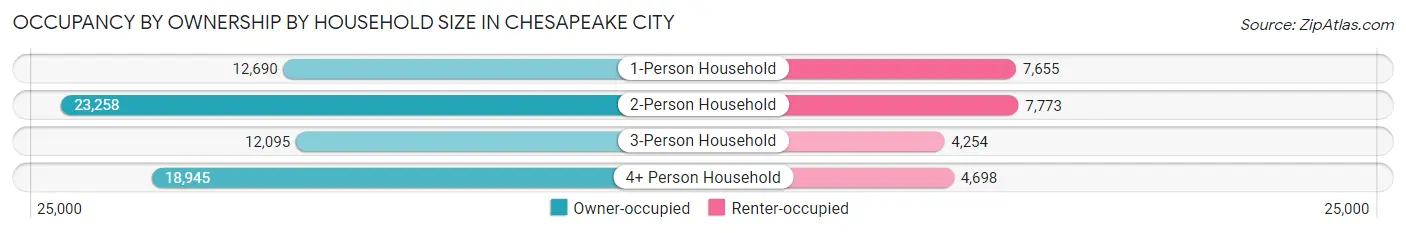
| Household Size | Owner-occupied | Renter-occupied |
| 1-Person Household | 12,690 (62.4%) | 7,655 (37.6%) |
| 2-Person Household | 23,258 (75.0%) | 7,773 (25.1%) |
| 3-Person Household | 12,095 (74.0%) | 4,254 (26.0%) |
| 4+ Person Household | 18,945 (80.1%) | 4,698 (19.9%) |
| Total Housing Units | 66,988 (73.3%) | 24,380 (26.7%) |
Occupancy by Educational Attainment in Chesapeake city
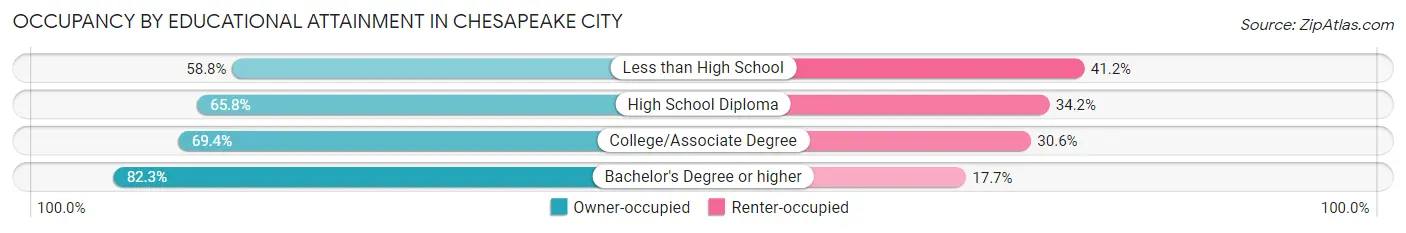
| Household Size | Owner-occupied | Renter-occupied |
| Less than High School | 2,546 (58.8%) | 1,783 (41.2%) |
| High School Diploma | 11,487 (65.8%) | 5,981 (34.2%) |
| College/Associate Degree | 23,207 (69.4%) | 10,225 (30.6%) |
| Bachelor's Degree or higher | 29,748 (82.3%) | 6,391 (17.7%) |
Occupancy by Age of Householder in Chesapeake city
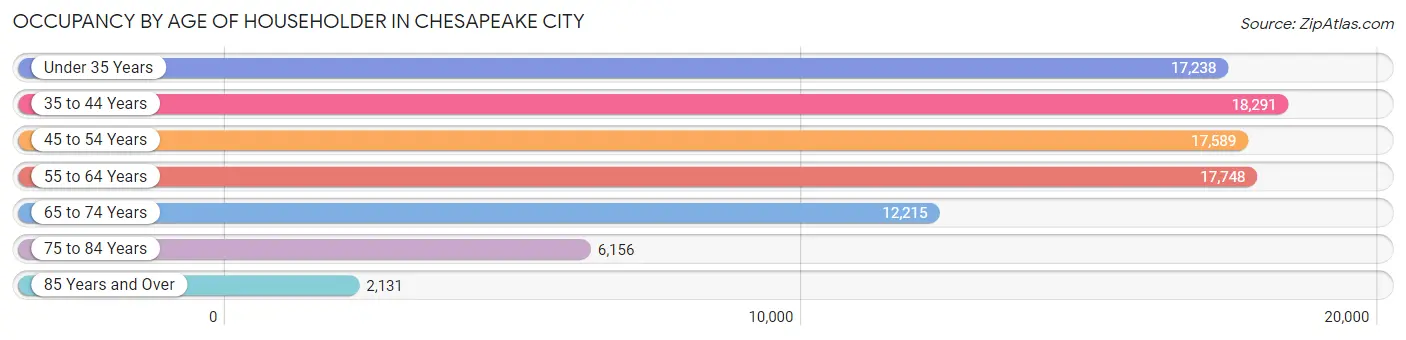
| Age Bracket | # Households | % Households |
| Under 35 Years | 17,238 | 18.9% |
| 35 to 44 Years | 18,291 | 20.0% |
| 45 to 54 Years | 17,589 | 19.3% |
| 55 to 64 Years | 17,748 | 19.4% |
| 65 to 74 Years | 12,215 | 13.4% |
| 75 to 84 Years | 6,156 | 6.7% |
| 85 Years and Over | 2,131 | 2.3% |
| Total | 91,368 | 100.0% |
Housing Finances in Chesapeake city
Median Income by Occupancy in Chesapeake city
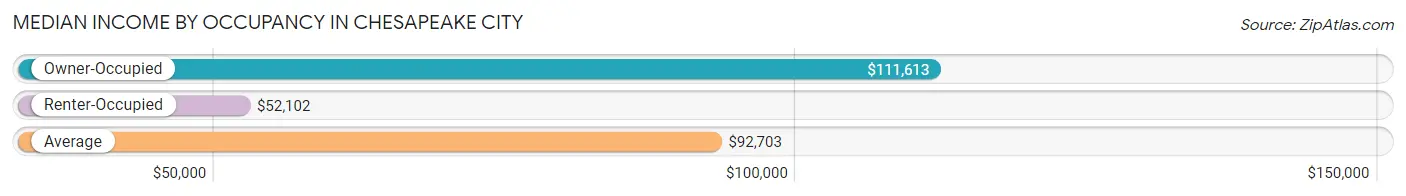
| Occupancy Type | # Households | Median Income |
| Owner-Occupied | 66,988 (73.3%) | $111,613 |
| Renter-Occupied | 24,380 (26.7%) | $52,102 |
| Average | 91,368 (100.0%) | $92,703 |
Occupancy by Householder Income Bracket in Chesapeake city
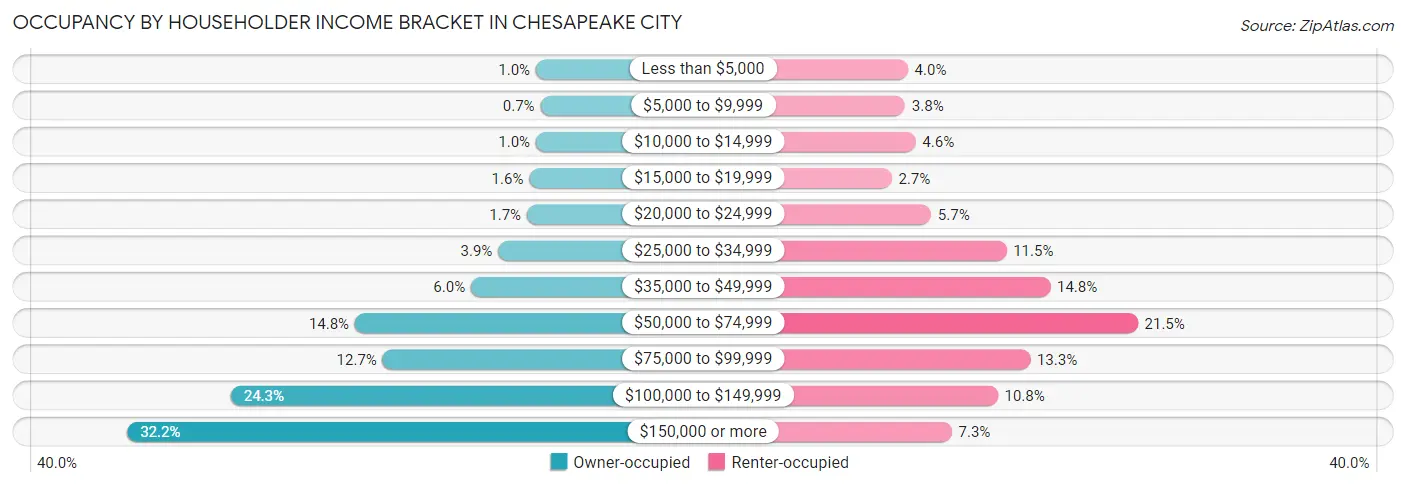
| Income Bracket | Owner-occupied | Renter-occupied |
| Less than $5,000 | 694 (1.0%) | 967 (4.0%) |
| $5,000 to $9,999 | 471 (0.7%) | 916 (3.8%) |
| $10,000 to $14,999 | 700 (1.0%) | 1,112 (4.6%) |
| $15,000 to $19,999 | 1,039 (1.5%) | 669 (2.7%) |
| $20,000 to $24,999 | 1,158 (1.7%) | 1,400 (5.7%) |
| $25,000 to $34,999 | 2,625 (3.9%) | 2,800 (11.5%) |
| $35,000 to $49,999 | 4,015 (6.0%) | 3,613 (14.8%) |
| $50,000 to $74,999 | 9,934 (14.8%) | 5,240 (21.5%) |
| $75,000 to $99,999 | 8,522 (12.7%) | 3,239 (13.3%) |
| $100,000 to $149,999 | 16,274 (24.3%) | 2,639 (10.8%) |
| $150,000 or more | 21,556 (32.2%) | 1,785 (7.3%) |
| Total | 66,988 (100.0%) | 24,380 (100.0%) |
Monthly Housing Cost Tiers in Chesapeake city
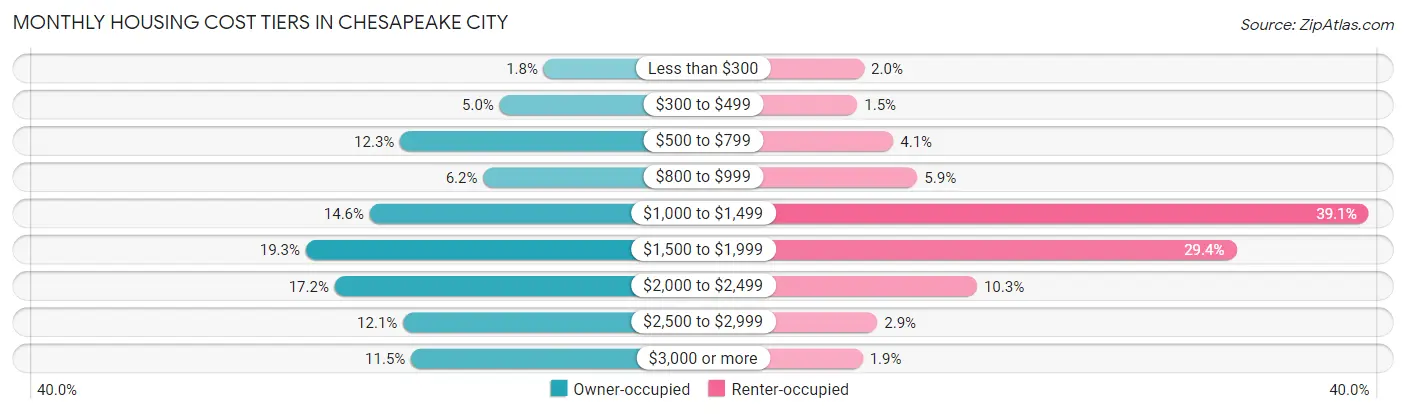
| Monthly Cost | Owner-occupied | Renter-occupied |
| Less than $300 | 1,179 (1.8%) | 481 (2.0%) |
| $300 to $499 | 3,357 (5.0%) | 359 (1.5%) |
| $500 to $799 | 8,265 (12.3%) | 1,004 (4.1%) |
| $800 to $999 | 4,167 (6.2%) | 1,437 (5.9%) |
| $1,000 to $1,499 | 9,760 (14.6%) | 9,534 (39.1%) |
| $1,500 to $1,999 | 12,921 (19.3%) | 7,161 (29.4%) |
| $2,000 to $2,499 | 11,497 (17.2%) | 2,506 (10.3%) |
| $2,500 to $2,999 | 8,121 (12.1%) | 717 (2.9%) |
| $3,000 or more | 7,721 (11.5%) | 454 (1.9%) |
| Total | 66,988 (100.0%) | 24,380 (100.0%) |
Physical Housing Characteristics in Chesapeake city
Housing Structures in Chesapeake city
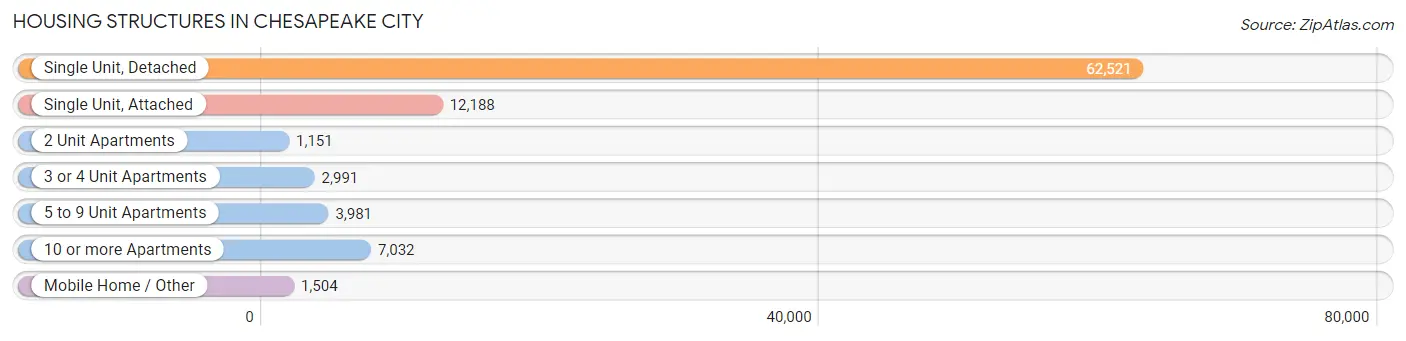
| Structure Type | # Housing Units | % Housing Units |
| Single Unit, Detached | 62,521 | 68.4% |
| Single Unit, Attached | 12,188 | 13.3% |
| 2 Unit Apartments | 1,151 | 1.3% |
| 3 or 4 Unit Apartments | 2,991 | 3.3% |
| 5 to 9 Unit Apartments | 3,981 | 4.4% |
| 10 or more Apartments | 7,032 | 7.7% |
| Mobile Home / Other | 1,504 | 1.7% |
| Total | 91,368 | 100.0% |
Housing Structures by Occupancy in Chesapeake city
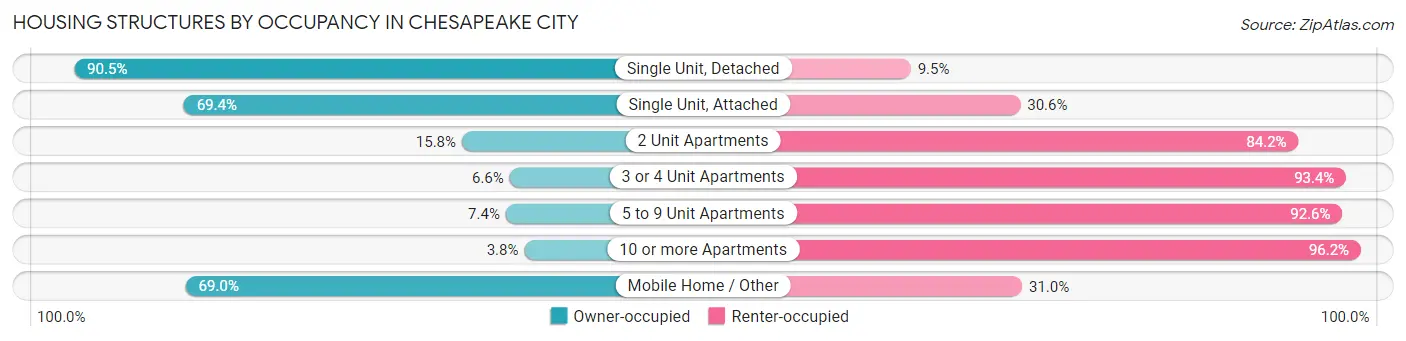
| Structure Type | Owner-occupied | Renter-occupied |
| Single Unit, Detached | 56,557 (90.5%) | 5,964 (9.5%) |
| Single Unit, Attached | 8,454 (69.4%) | 3,734 (30.6%) |
| 2 Unit Apartments | 182 (15.8%) | 969 (84.2%) |
| 3 or 4 Unit Apartments | 198 (6.6%) | 2,793 (93.4%) |
| 5 to 9 Unit Apartments | 293 (7.4%) | 3,688 (92.6%) |
| 10 or more Apartments | 266 (3.8%) | 6,766 (96.2%) |
| Mobile Home / Other | 1,038 (69.0%) | 466 (31.0%) |
| Total | 66,988 (73.3%) | 24,380 (26.7%) |
Housing Structures by Number of Rooms in Chesapeake city
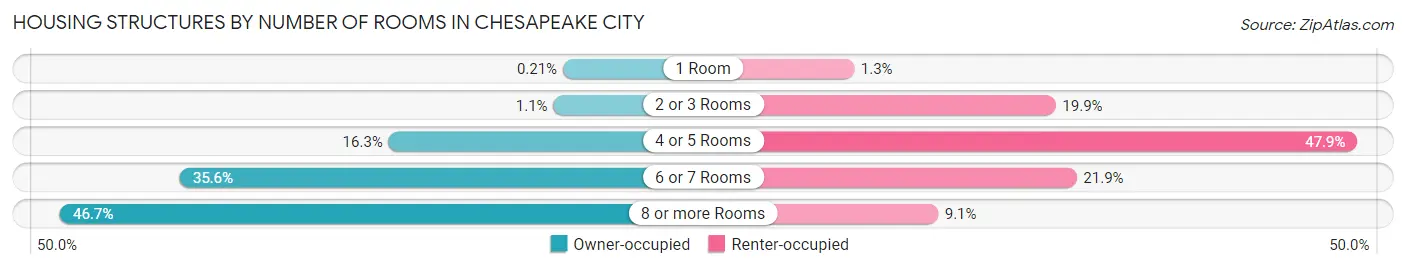
| Number of Rooms | Owner-occupied | Renter-occupied |
| 1 Room | 143 (0.2%) | 315 (1.3%) |
| 2 or 3 Rooms | 732 (1.1%) | 4,860 (19.9%) |
| 4 or 5 Rooms | 10,937 (16.3%) | 11,667 (47.8%) |
| 6 or 7 Rooms | 23,877 (35.6%) | 5,331 (21.9%) |
| 8 or more Rooms | 31,299 (46.7%) | 2,207 (9.0%) |
| Total | 66,988 (100.0%) | 24,380 (100.0%) |
Housing Structure by Heating Type in Chesapeake city
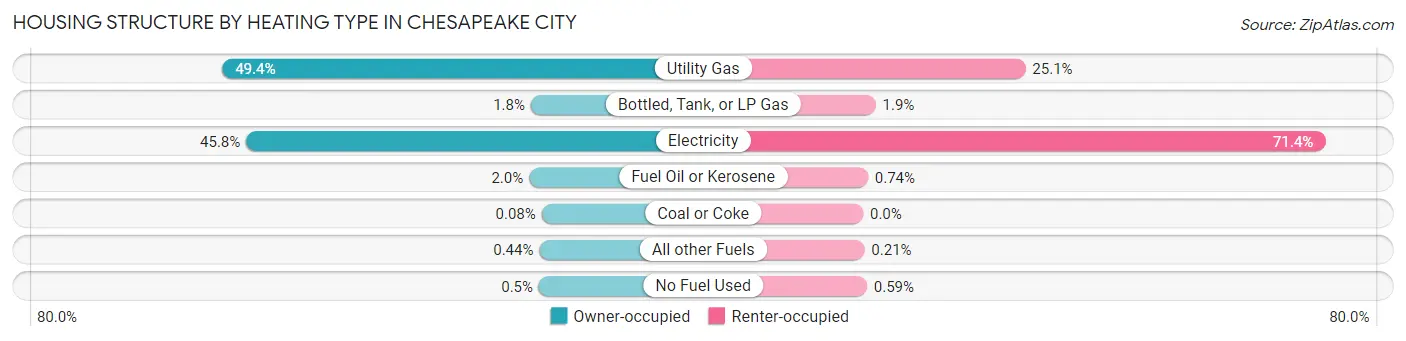
| Heating Type | Owner-occupied | Renter-occupied |
| Utility Gas | 33,116 (49.4%) | 6,119 (25.1%) |
| Bottled, Tank, or LP Gas | 1,175 (1.8%) | 472 (1.9%) |
| Electricity | 30,654 (45.8%) | 17,414 (71.4%) |
| Fuel Oil or Kerosene | 1,354 (2.0%) | 181 (0.7%) |
| Coal or Coke | 55 (0.1%) | 0 (0.0%) |
| All other Fuels | 297 (0.4%) | 50 (0.2%) |
| No Fuel Used | 337 (0.5%) | 144 (0.6%) |
| Total | 66,988 (100.0%) | 24,380 (100.0%) |
Household Vehicle Usage in Chesapeake city
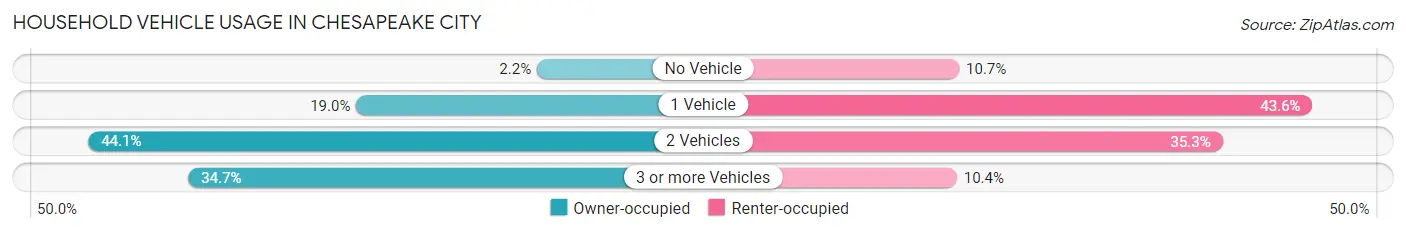
| Vehicles per Household | Owner-occupied | Renter-occupied |
| No Vehicle | 1,453 (2.2%) | 2,600 (10.7%) |
| 1 Vehicle | 12,755 (19.0%) | 10,640 (43.6%) |
| 2 Vehicles | 29,514 (44.1%) | 8,594 (35.2%) |
| 3 or more Vehicles | 23,266 (34.7%) | 2,546 (10.4%) |
| Total | 66,988 (100.0%) | 24,380 (100.0%) |
Real Estate & Mortgages in Chesapeake city
Real Estate and Mortgage Overview in Chesapeake city
| Characteristic | Without Mortgage | With Mortgage |
| Housing Units | 16,556 | 50,432 |
| Median Property Value | $313,700 | $348,000 |
| Median Household Income | $81,174 | $17,903 |
| Monthly Housing Costs | $647 | $7,643 |
| Real Estate Taxes | $2,855 | $2,488 |
Property Value by Mortgage Status in Chesapeake city
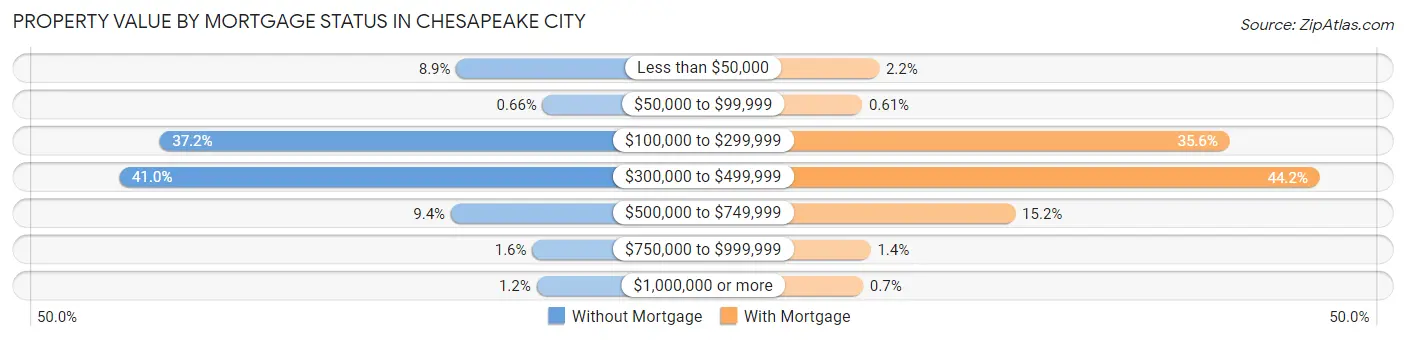
| Property Value | Without Mortgage | With Mortgage |
| Less than $50,000 | 1,470 (8.9%) | 1,124 (2.2%) |
| $50,000 to $99,999 | 110 (0.7%) | 307 (0.6%) |
| $100,000 to $299,999 | 6,154 (37.2%) | 17,972 (35.6%) |
| $300,000 to $499,999 | 6,789 (41.0%) | 22,294 (44.2%) |
| $500,000 to $749,999 | 1,556 (9.4%) | 7,664 (15.2%) |
| $750,000 to $999,999 | 272 (1.6%) | 718 (1.4%) |
| $1,000,000 or more | 205 (1.2%) | 353 (0.7%) |
| Total | 16,556 (100.0%) | 50,432 (100.0%) |
Household Income by Mortgage Status in Chesapeake city
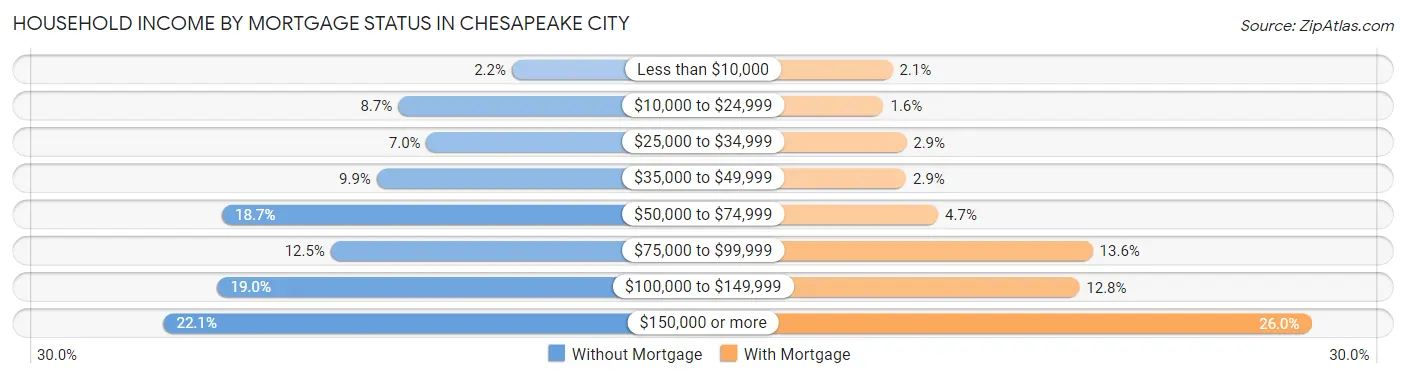
| Household Income | Without Mortgage | With Mortgage |
| Less than $10,000 | 358 (2.2%) | 1,066 (2.1%) |
| $10,000 to $24,999 | 1,434 (8.7%) | 807 (1.6%) |
| $25,000 to $34,999 | 1,166 (7.0%) | 1,463 (2.9%) |
| $35,000 to $49,999 | 1,636 (9.9%) | 1,459 (2.9%) |
| $50,000 to $74,999 | 3,098 (18.7%) | 2,379 (4.7%) |
| $75,000 to $99,999 | 2,071 (12.5%) | 6,836 (13.6%) |
| $100,000 to $149,999 | 3,140 (19.0%) | 6,451 (12.8%) |
| $150,000 or more | 3,653 (22.1%) | 13,134 (26.0%) |
| Total | 16,556 (100.0%) | 50,432 (100.0%) |
Property Value to Household Income Ratio in Chesapeake city
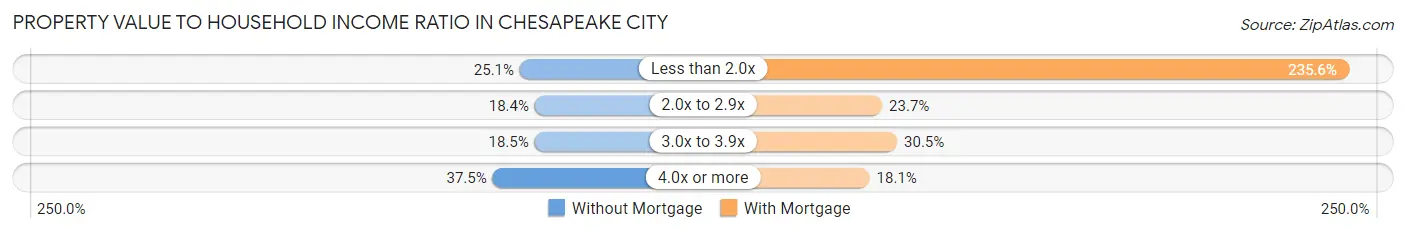
| Value-to-Income Ratio | Without Mortgage | With Mortgage |
| Less than 2.0x | 4,160 (25.1%) | 118,791 (235.6%) |
| 2.0x to 2.9x | 3,042 (18.4%) | 11,960 (23.7%) |
| 3.0x to 3.9x | 3,056 (18.5%) | 15,388 (30.5%) |
| 4.0x or more | 6,211 (37.5%) | 9,103 (18.0%) |
| Total | 16,556 (100.0%) | 50,432 (100.0%) |
Real Estate Taxes by Mortgage Status in Chesapeake city
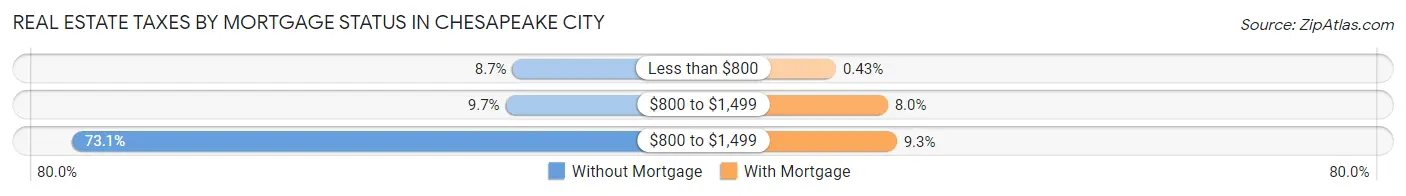
| Property Taxes | Without Mortgage | With Mortgage |
| Less than $800 | 1,444 (8.7%) | 218 (0.4%) |
| $800 to $1,499 | 1,613 (9.7%) | 4,027 (8.0%) |
| $800 to $1,499 | 12,101 (73.1%) | 4,688 (9.3%) |
| Total | 16,556 (100.0%) | 50,432 (100.0%) |
Health & Disability in Chesapeake city
Health Insurance Coverage by Age in Chesapeake city
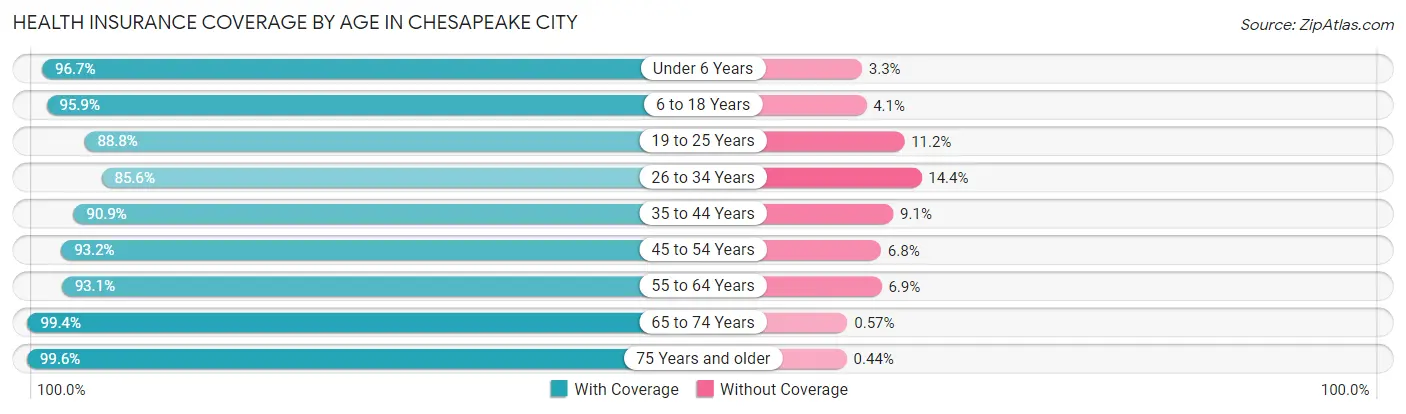
| Age Bracket | With Coverage | Without Coverage |
| Under 6 Years | 17,870 (96.7%) | 605 (3.3%) |
| 6 to 18 Years | 42,785 (95.9%) | 1,825 (4.1%) |
| 19 to 25 Years | 17,036 (88.8%) | 2,142 (11.2%) |
| 26 to 34 Years | 23,518 (85.6%) | 3,943 (14.4%) |
| 35 to 44 Years | 28,976 (90.9%) | 2,906 (9.1%) |
| 45 to 54 Years | 27,885 (93.2%) | 2,045 (6.8%) |
| 55 to 64 Years | 29,653 (93.1%) | 2,209 (6.9%) |
| 65 to 74 Years | 21,102 (99.4%) | 122 (0.6%) |
| 75 Years and older | 12,340 (99.6%) | 54 (0.4%) |
| Total | 221,165 (93.3%) | 15,851 (6.7%) |
Health Insurance Coverage by Citizenship Status in Chesapeake city
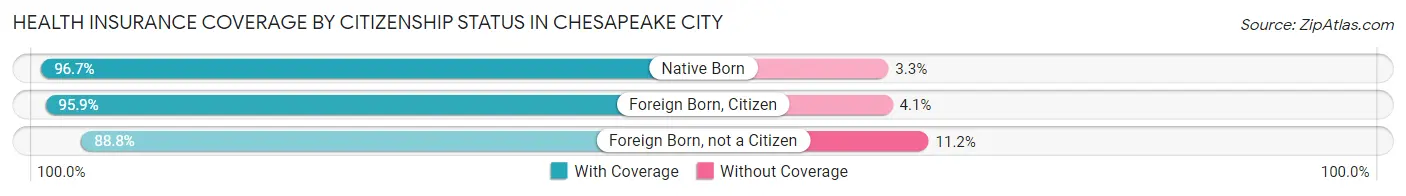
| Citizenship Status | With Coverage | Without Coverage |
| Native Born | 17,870 (96.7%) | 605 (3.3%) |
| Foreign Born, Citizen | 42,785 (95.9%) | 1,825 (4.1%) |
| Foreign Born, not a Citizen | 17,036 (88.8%) | 2,142 (11.2%) |
Health Insurance Coverage by Household Income in Chesapeake city
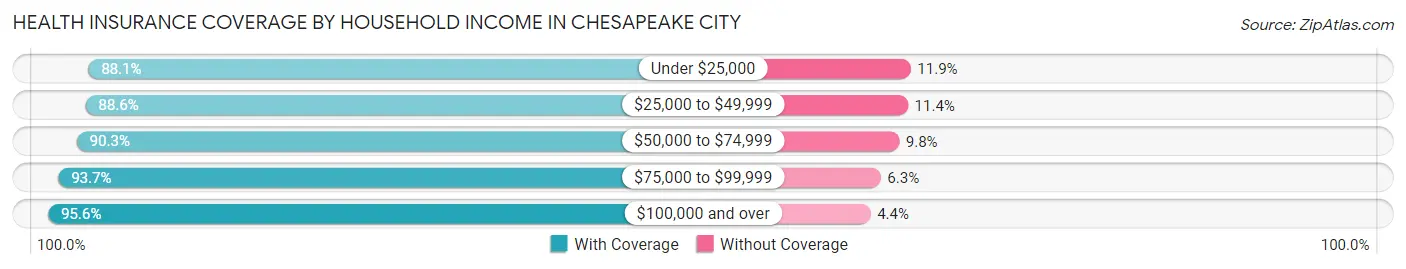
| Household Income | With Coverage | Without Coverage |
| Under $25,000 | 14,976 (88.1%) | 2,027 (11.9%) |
| $25,000 to $49,999 | 23,182 (88.6%) | 2,982 (11.4%) |
| $50,000 to $74,999 | 29,959 (90.2%) | 3,235 (9.8%) |
| $75,000 to $99,999 | 28,022 (93.7%) | 1,885 (6.3%) |
| $100,000 and over | 124,701 (95.6%) | 5,720 (4.4%) |
Public vs Private Health Insurance Coverage by Age in Chesapeake city
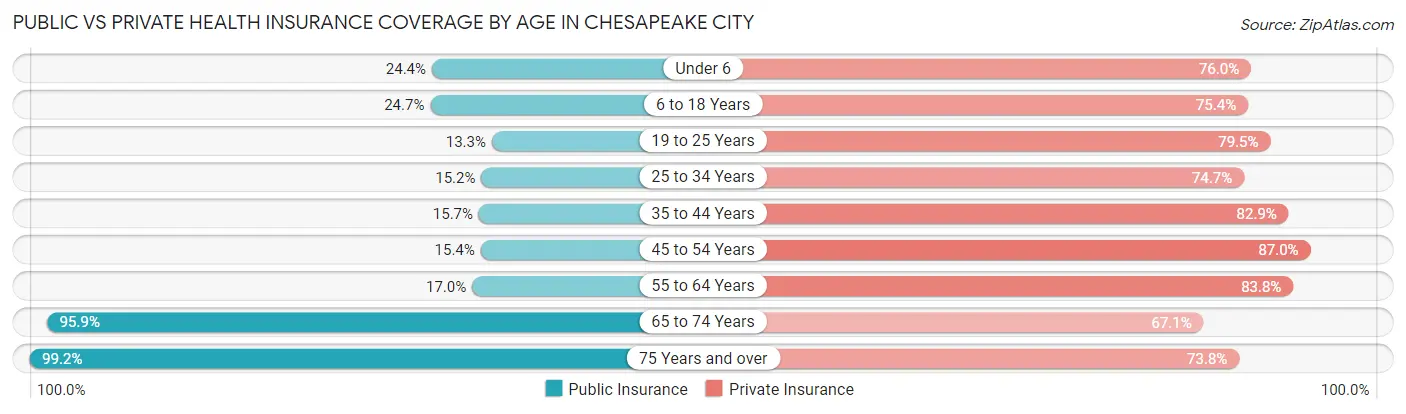
| Age Bracket | Public Insurance | Private Insurance |
| Under 6 | 4,510 (24.4%) | 14,032 (75.9%) |
| 6 to 18 Years | 11,022 (24.7%) | 33,632 (75.4%) |
| 19 to 25 Years | 2,548 (13.3%) | 15,255 (79.5%) |
| 25 to 34 Years | 4,182 (15.2%) | 20,504 (74.7%) |
| 35 to 44 Years | 5,000 (15.7%) | 26,443 (82.9%) |
| 45 to 54 Years | 4,596 (15.4%) | 26,034 (87.0%) |
| 55 to 64 Years | 5,402 (17.0%) | 26,694 (83.8%) |
| 65 to 74 Years | 20,361 (95.9%) | 14,250 (67.1%) |
| 75 Years and over | 12,290 (99.2%) | 9,140 (73.8%) |
| Total | 69,911 (29.5%) | 185,984 (78.5%) |
Disability Status by Sex by Age in Chesapeake city
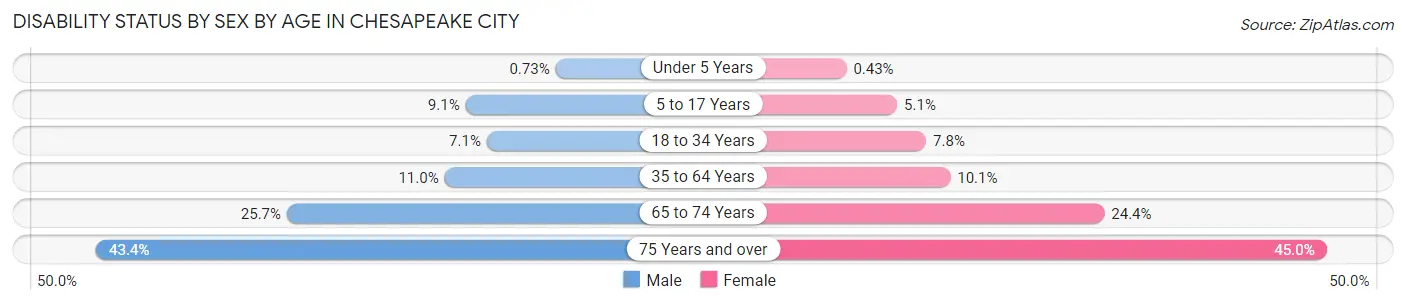
| Age Bracket | Male | Female |
| Under 5 Years | 57 (0.7%) | 32 (0.4%) |
| 5 to 17 Years | 2,084 (9.1%) | 1,125 (5.1%) |
| 18 to 34 Years | 1,686 (7.1%) | 2,030 (7.8%) |
| 35 to 64 Years | 4,824 (11.0%) | 5,029 (10.1%) |
| 65 to 74 Years | 2,456 (25.7%) | 2,840 (24.4%) |
| 75 Years and over | 2,142 (43.4%) | 3,353 (45.0%) |
Disability Class by Sex by Age in Chesapeake city
Disability Class: Hearing Difficulty
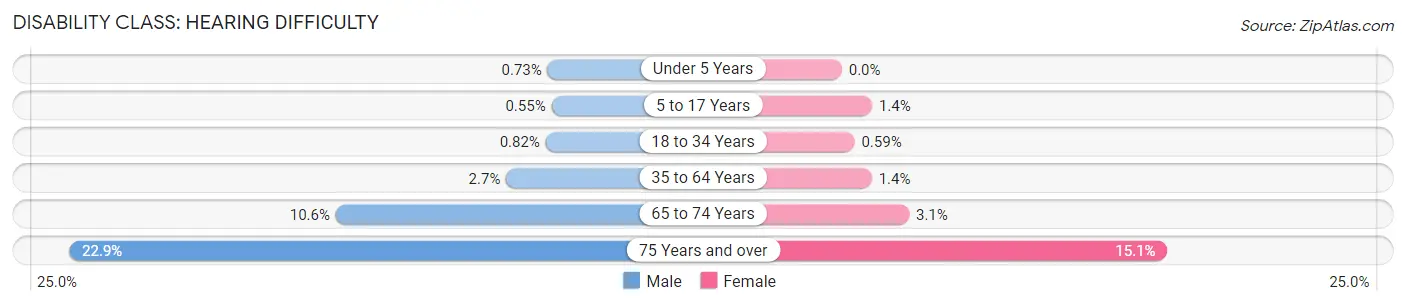
| Age Bracket | Male | Female |
| Under 5 Years | 57 (0.7%) | 0 (0.0%) |
| 5 to 17 Years | 126 (0.5%) | 306 (1.4%) |
| 18 to 34 Years | 194 (0.8%) | 153 (0.6%) |
| 35 to 64 Years | 1,161 (2.6%) | 694 (1.4%) |
| 65 to 74 Years | 1,011 (10.6%) | 364 (3.1%) |
| 75 Years and over | 1,133 (22.9%) | 1,126 (15.1%) |
Disability Class: Vision Difficulty
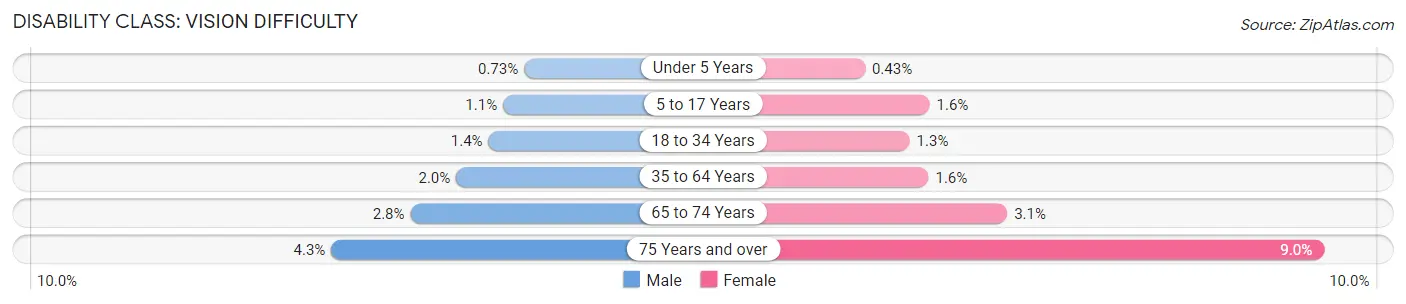
| Age Bracket | Male | Female |
| Under 5 Years | 57 (0.7%) | 32 (0.4%) |
| 5 to 17 Years | 258 (1.1%) | 358 (1.6%) |
| 18 to 34 Years | 330 (1.4%) | 327 (1.3%) |
| 35 to 64 Years | 870 (2.0%) | 805 (1.6%) |
| 65 to 74 Years | 272 (2.8%) | 358 (3.1%) |
| 75 Years and over | 213 (4.3%) | 667 (8.9%) |
Disability Class: Cognitive Difficulty
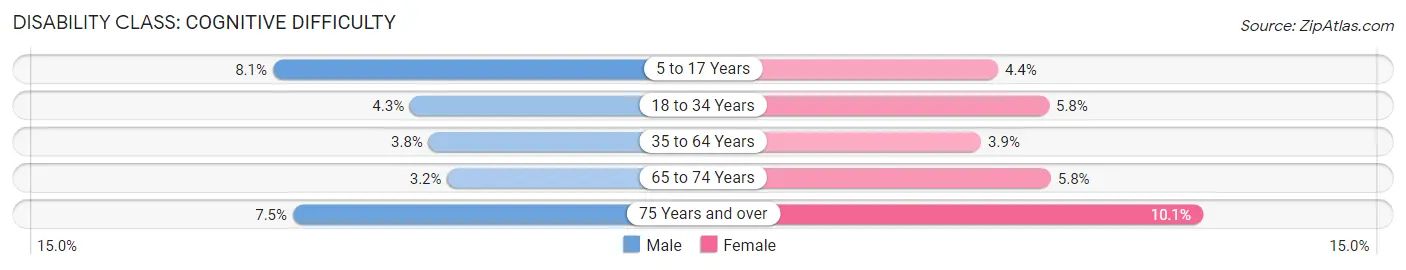
| Age Bracket | Male | Female |
| 5 to 17 Years | 1,857 (8.1%) | 952 (4.3%) |
| 18 to 34 Years | 1,014 (4.3%) | 1,495 (5.8%) |
| 35 to 64 Years | 1,639 (3.7%) | 1,936 (3.9%) |
| 65 to 74 Years | 309 (3.2%) | 678 (5.8%) |
| 75 Years and over | 372 (7.5%) | 749 (10.1%) |
Disability Class: Ambulatory Difficulty
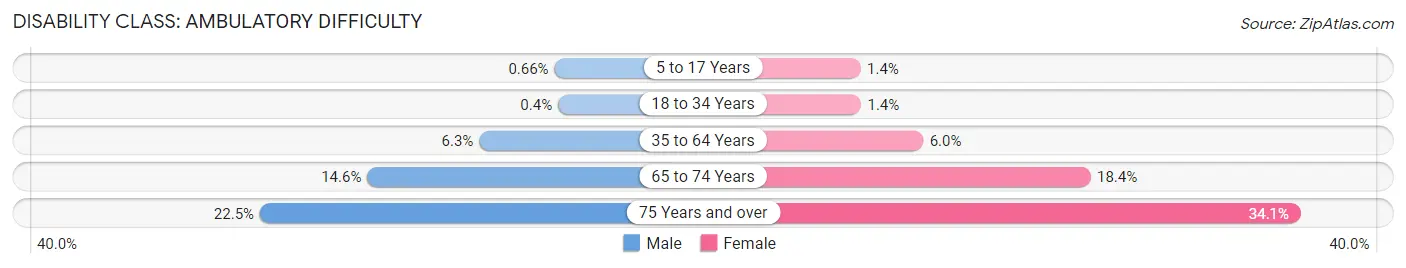
| Age Bracket | Male | Female |
| 5 to 17 Years | 151 (0.7%) | 298 (1.4%) |
| 18 to 34 Years | 96 (0.4%) | 360 (1.4%) |
| 35 to 64 Years | 2,735 (6.2%) | 3,003 (6.0%) |
| 65 to 74 Years | 1,394 (14.6%) | 2,147 (18.4%) |
| 75 Years and over | 1,113 (22.5%) | 2,540 (34.1%) |
Disability Class: Self-Care Difficulty
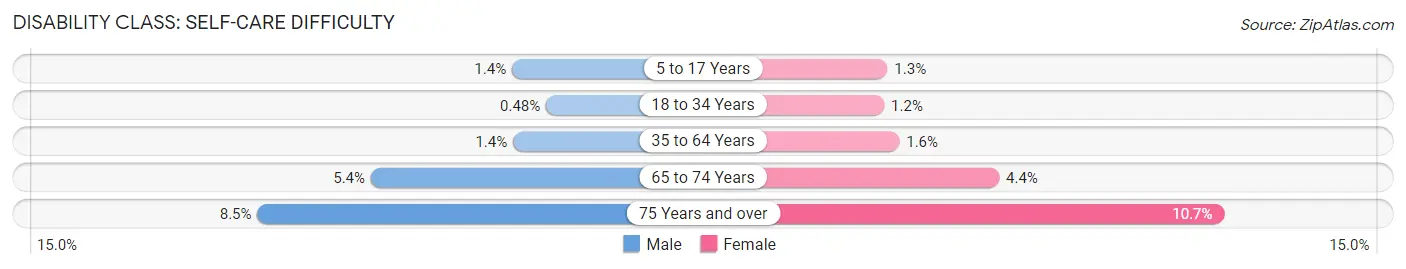
| Age Bracket | Male | Female |
| 5 to 17 Years | 329 (1.4%) | 278 (1.3%) |
| 18 to 34 Years | 114 (0.5%) | 305 (1.2%) |
| 35 to 64 Years | 613 (1.4%) | 801 (1.6%) |
| 65 to 74 Years | 513 (5.4%) | 510 (4.4%) |
| 75 Years and over | 421 (8.5%) | 794 (10.6%) |
Technology Access in Chesapeake city
Computing Device Access in Chesapeake city
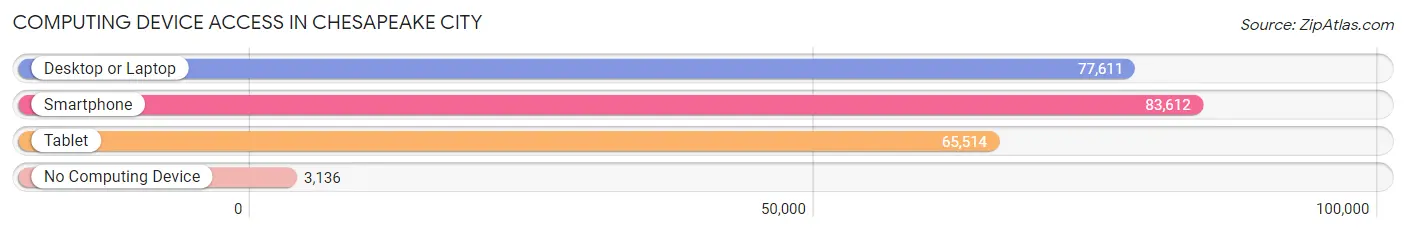
| Device Type | # Households | % Households |
| Desktop or Laptop | 77,611 | 84.9% |
| Smartphone | 83,612 | 91.5% |
| Tablet | 65,514 | 71.7% |
| No Computing Device | 3,136 | 3.4% |
| Total | 91,368 | 100.0% |
Internet Access in Chesapeake city
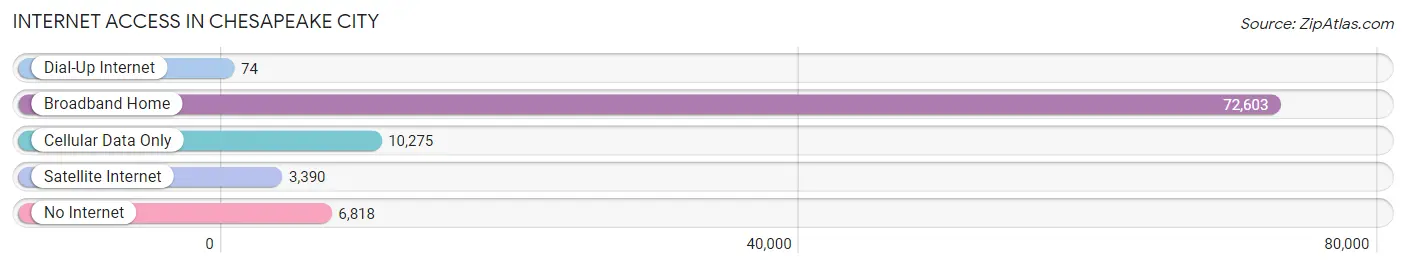
| Internet Type | # Households | % Households |
| Dial-Up Internet | 74 | 0.1% |
| Broadband Home | 72,603 | 79.5% |
| Cellular Data Only | 10,275 | 11.3% |
| Satellite Internet | 3,390 | 3.7% |
| No Internet | 6,818 | 7.5% |
| Total | 91,368 | 100.0% |
Chesapeake city Summary
Chesapeake City, Virginia is a small town located in the southeastern corner of the state, in the Hampton Roads region. It is bordered by the Elizabeth River to the north, the Chesapeake Bay to the east, and the Atlantic Ocean to the south. The city is part of the Virginia Beach-Norfolk-Newport News metropolitan area, and is home to a population of approximately 8,000 people.
History
Chesapeake City was first settled in 1620 by English colonists, who named it after the Chesapeake Bay. The area was initially used for farming and fishing, and the town was officially incorporated in 1792. During the American Civil War, the city was occupied by Union forces, and the town was destroyed by a fire in 1866.
In the late 19th century, the city began to experience a period of growth and development, as the railroad and the Chesapeake and Ohio Canal were built. This allowed for the transportation of goods and people, and the city became a popular tourist destination.
In the early 20th century, the city experienced a period of decline, as the railroad and canal were abandoned. However, in the late 20th century, the city experienced a resurgence, as the city was revitalized and new businesses and attractions were established.
Geography
Chesapeake City is located in the southeastern corner of Virginia, in the Hampton Roads region. It is bordered by the Elizabeth River to the north, the Chesapeake Bay to the east, and the Atlantic Ocean to the south. The city is located on the Atlantic Coastal Plain, and is characterized by flat terrain and low-lying land.
The city has a humid subtropical climate, with hot, humid summers and mild winters. The average annual temperature is around 60°F (15°C), and the average annual precipitation is around 45 inches (114 cm).
Economy
Chesapeake City’s economy is largely based on tourism, as the city is a popular destination for visitors from around the world. The city is home to a number of attractions, including the Chesapeake Bay Bridge-Tunnel, the Chesapeake Bay Maritime Museum, and the Chesapeake Bay Aquarium.
The city is also home to a number of businesses, including retail stores, restaurants, and hotels. The city is also home to a number of manufacturing companies, including shipbuilding, electronics, and food processing.
Demographics
As of the 2010 census, the population of Chesapeake City was 8,096. The racial makeup of the city was 79.3% White, 14.2% African American, 0.7% Native American, 1.2% Asian, 0.1% Pacific Islander, and 4.5% from other races. The median household income was $45,945, and the median family income was $54,945.
The city is home to a number of religious denominations, including Baptist, Methodist, Presbyterian, and Catholic. The city is also home to a number of educational institutions, including Chesapeake City Public Schools, Tidewater Community College, and Old Dominion University.
Common Questions
What is Per Capita Income in Chesapeake city?
Per Capita income in Chesapeake city is $42,753.
What is the Median Family Income in Chesapeake city?
Median Family Income in Chesapeake city is $109,923.
What is the Median Household income in Chesapeake city?
Median Household Income in Chesapeake city is $92,703.
What is Income or Wage Gap in Chesapeake city?
Income or Wage Gap in Chesapeake city is 35.2%.
Women in Chesapeake city earn 64.8 cents for every dollar earned by a man.
What is Family Income Deficit in Chesapeake city?
Family Income Deficit in Chesapeake city is $11,162.
Families that are below poverty line in Chesapeake city earn $11,162 less on average than the poverty threshold level.
What is Inequality or Gini Index in Chesapeake city?
Inequality or Gini Index in Chesapeake city is 0.42.
What is the Total Population of Chesapeake city?
Total Population of Chesapeake city is 249,377.
What is the Total Male Population of Chesapeake city?
Total Male Population of Chesapeake city is 122,672.
What is the Total Female Population of Chesapeake city?
Total Female Population of Chesapeake city is 126,705.
What is the Ratio of Males per 100 Females in Chesapeake city?
There are 96.82 Males per 100 Females in Chesapeake city.
What is the Ratio of Females per 100 Males in Chesapeake city?
There are 103.29 Females per 100 Males in Chesapeake city.
What is the Median Population Age in Chesapeake city?
Median Population Age in Chesapeake city is 37.4 Years.
What is the Average Family Size in Chesapeake city
Average Family Size in Chesapeake city is 3.1 People.
What is the Average Household Size in Chesapeake city
Average Household Size in Chesapeake city is 2.7 People.
How Large is the Labor Force in Chesapeake city?
There are 132,139 People in the Labor Forcein in Chesapeake city.
What is the Percentage of People in the Labor Force in Chesapeake city?
67.2% of People are in the Labor Force in Chesapeake city.
What is the Unemployment Rate in Chesapeake city?
Unemployment Rate in Chesapeake city is 5.0%.