Buena Vista, VA Map & Demographics
Buena Vista Map
Buena Vista Overview
$32,925
PER CAPITA INCOME
$55,717
AVG FAMILY INCOME
$48,783
AVG HOUSEHOLD INCOME
22.0%
WAGE / INCOME GAP [ % ]
78.0¢/ $1
WAGE / INCOME GAP [ $ ]
0.56
INEQUALITY / GINI INDEX
6,639
TOTAL POPULATION
3,128
MALE POPULATION
3,511
FEMALE POPULATION
89.09
MALES / 100 FEMALES
112.24
FEMALES / 100 MALES
35.3
MEDIAN AGE
2.7
AVG FAMILY SIZE
2.3
AVG HOUSEHOLD SIZE
3,160
LABOR FORCE [ PEOPLE ]
58.2%
PERCENT IN LABOR FORCE
1.3%
UNEMPLOYMENT RATE
Buena Vista Zip Codes
Income in Buena Vista
Income Overview in Buena Vista
Per Capita Income in Buena Vista is $32,925, while median incomes of families and households are $55,717 and $48,783 respectively.
| Characteristic | Number | Measure |
| Per Capita Income | 6,639 | $32,925 |
| Median Family Income | 1,881 | $55,717 |
| Mean Family Income | 1,881 | $69,804 |
| Median Household Income | 2,655 | $48,783 |
| Mean Household Income | 2,655 | $81,044 |
| Income Deficit | 1,881 | $0 |
| Wage / Income Gap (%) | 6,639 | 22.02% |
| Wage / Income Gap ($) | 6,639 | 77.98¢ per $1 |
| Gini / Inequality Index | 6,639 | 0.56 |
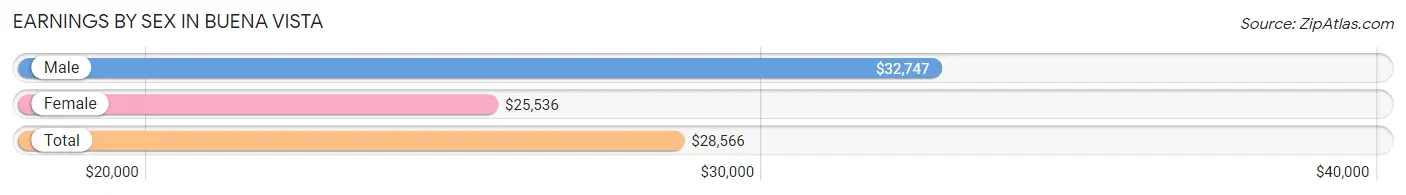
Earnings by Sex in Buena Vista
Average Earnings in Buena Vista are $28,566, $32,747 for men and $25,536 for women, a difference of 22.0%.
| Sex | Number | Average Earnings |
| Male | 1,851 (53.3%) | $32,747 |
| Female | 1,623 (46.7%) | $25,536 |
| Total | 3,474 (100.0%) | $28,566 |
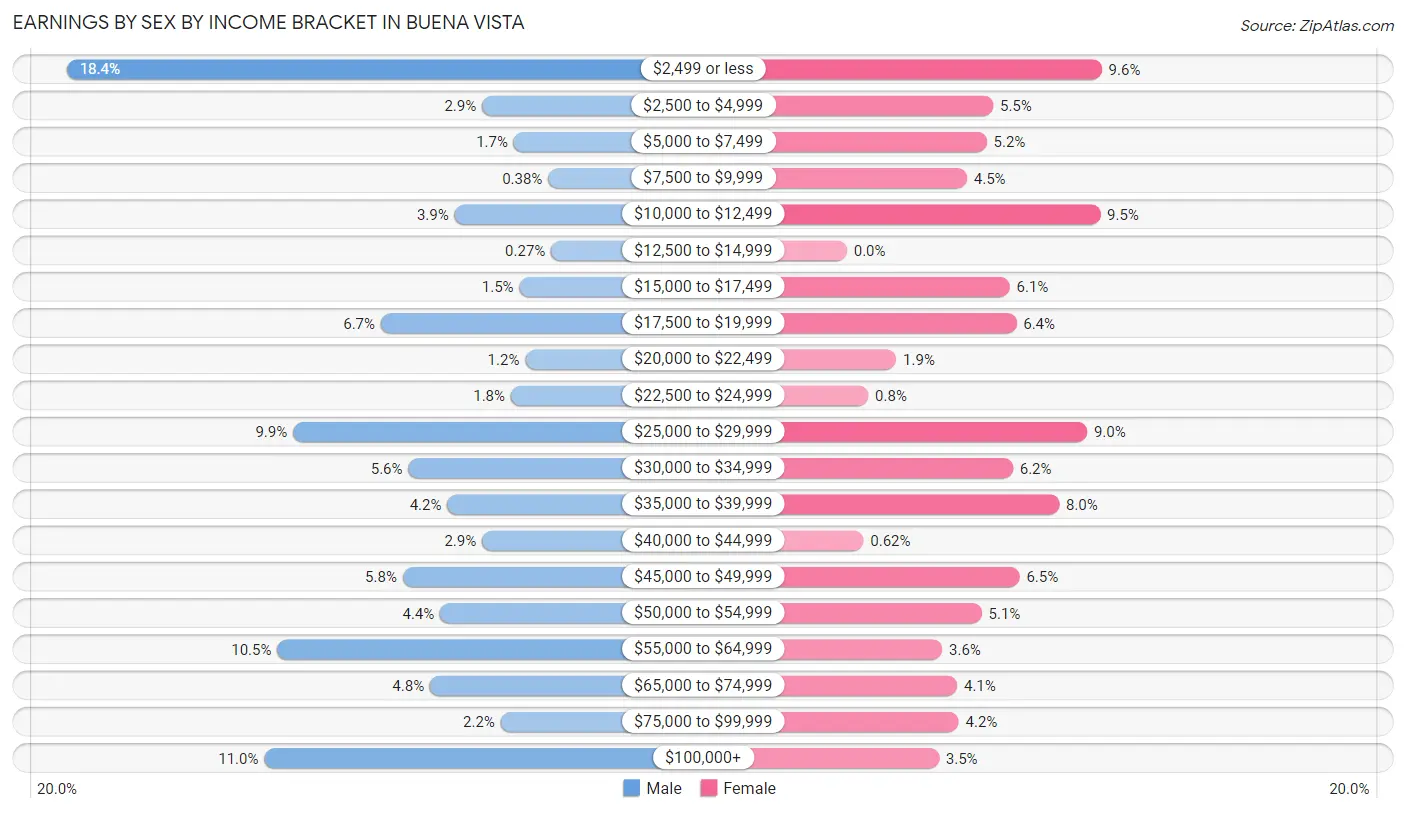
Earnings by Sex by Income Bracket in Buena Vista
The most common earnings brackets in Buena Vista are $2,499 or less for men (341 | 18.4%) and $2,499 or less for women (155 | 9.6%).
| Income | Male | Female |
| $2,499 or less | 341 (18.4%) | 155 (9.6%) |
| $2,500 to $4,999 | 53 (2.9%) | 89 (5.5%) |
| $5,000 to $7,499 | 31 (1.7%) | 85 (5.2%) |
| $7,500 to $9,999 | 7 (0.4%) | 73 (4.5%) |
| $10,000 to $12,499 | 72 (3.9%) | 154 (9.5%) |
| $12,500 to $14,999 | 5 (0.3%) | 0 (0.0%) |
| $15,000 to $17,499 | 27 (1.5%) | 99 (6.1%) |
| $17,500 to $19,999 | 123 (6.7%) | 103 (6.4%) |
| $20,000 to $22,499 | 23 (1.2%) | 30 (1.8%) |
| $22,500 to $24,999 | 33 (1.8%) | 13 (0.8%) |
| $25,000 to $29,999 | 184 (9.9%) | 146 (9.0%) |
| $30,000 to $34,999 | 104 (5.6%) | 101 (6.2%) |
| $35,000 to $39,999 | 77 (4.2%) | 129 (8.0%) |
| $40,000 to $44,999 | 53 (2.9%) | 10 (0.6%) |
| $45,000 to $49,999 | 108 (5.8%) | 105 (6.5%) |
| $50,000 to $54,999 | 82 (4.4%) | 82 (5.1%) |
| $55,000 to $64,999 | 195 (10.5%) | 58 (3.6%) |
| $65,000 to $74,999 | 89 (4.8%) | 67 (4.1%) |
| $75,000 to $99,999 | 40 (2.2%) | 68 (4.2%) |
| $100,000+ | 204 (11.0%) | 56 (3.5%) |
| Total | 1,851 (100.0%) | 1,623 (100.0%) |
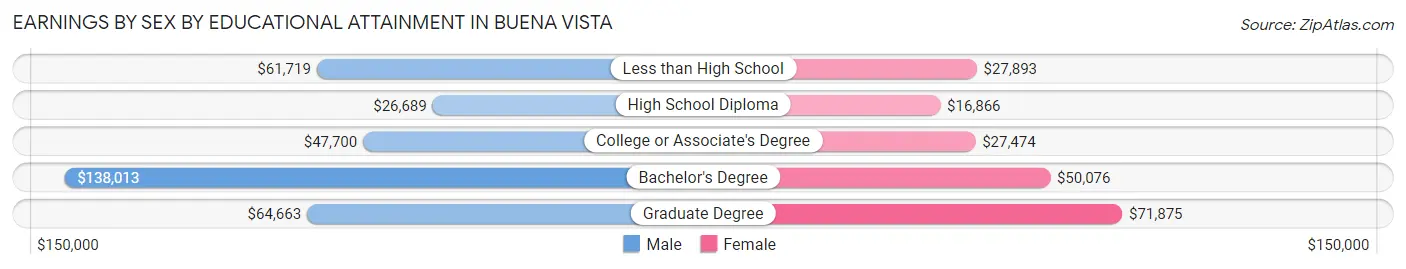
Earnings by Sex by Educational Attainment in Buena Vista
Average earnings in Buena Vista are $48,250 for men and $29,270 for women, a difference of 39.3%. Men with an educational attainment of bachelor's degree enjoy the highest average annual earnings of $138,013, while those with high school diploma education earn the least with $26,689. Women with an educational attainment of graduate degree earn the most with the average annual earnings of $71,875, while those with high school diploma education have the smallest earnings of $16,866.
| Educational Attainment | Male Income | Female Income |
| Less than High School | $61,719 | $27,893 |
| High School Diploma | $26,689 | $16,866 |
| College or Associate's Degree | $47,700 | $27,474 |
| Bachelor's Degree | $138,013 | $50,076 |
| Graduate Degree | $64,663 | $71,875 |
| Total | $48,250 | $29,270 |
Family Income in Buena Vista
Family Income Brackets in Buena Vista
According to the Buena Vista family income data, there are 472 families falling into the $50,000 to $74,999 income range, which is the most common income bracket and makes up 25.1% of all families. Conversely, the $150,000 to $199,999 income bracket is the least frequent group with only 21 families (1.1%) belonging to this category.
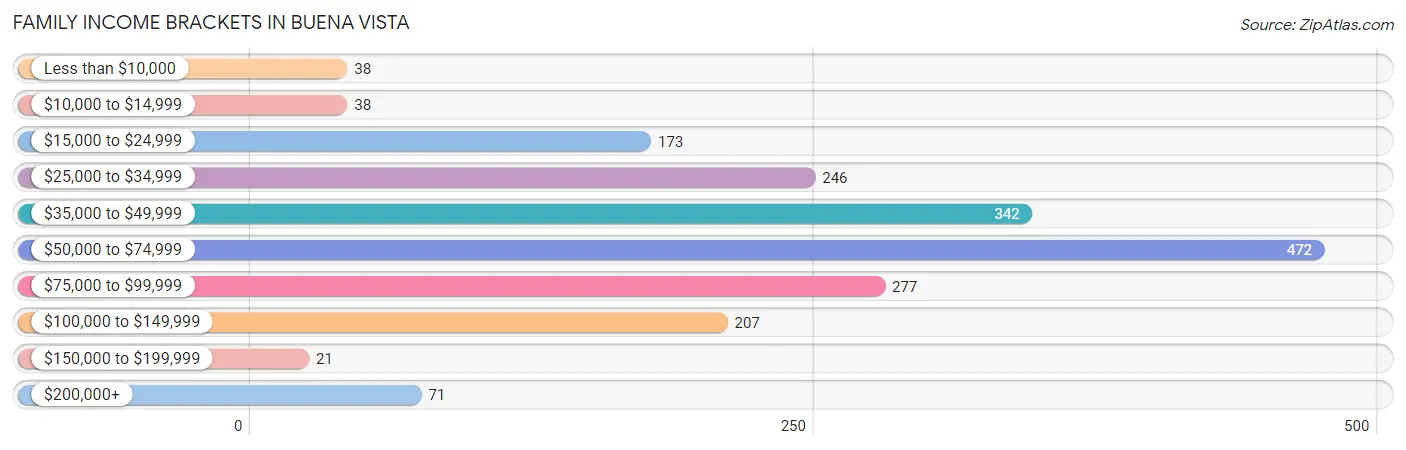
| Income Bracket | # Families | % Families |
| Less than $10,000 | 38 | 2.0% |
| $10,000 to $14,999 | 38 | 2.0% |
| $15,000 to $24,999 | 173 | 9.2% |
| $25,000 to $34,999 | 246 | 13.1% |
| $35,000 to $49,999 | 342 | 18.2% |
| $50,000 to $74,999 | 472 | 25.1% |
| $75,000 to $99,999 | 277 | 14.7% |
| $100,000 to $149,999 | 207 | 11.0% |
| $150,000 to $199,999 | 21 | 1.1% |
| $200,000+ | 71 | 3.8% |
Family Income by Famaliy Size in Buena Vista
5-person families (97 | 5.2%) account for the highest median family income in Buena Vista with $68,150 per family, while 2-person families (957 | 50.9%) have the highest median income of $27,792 per family member.
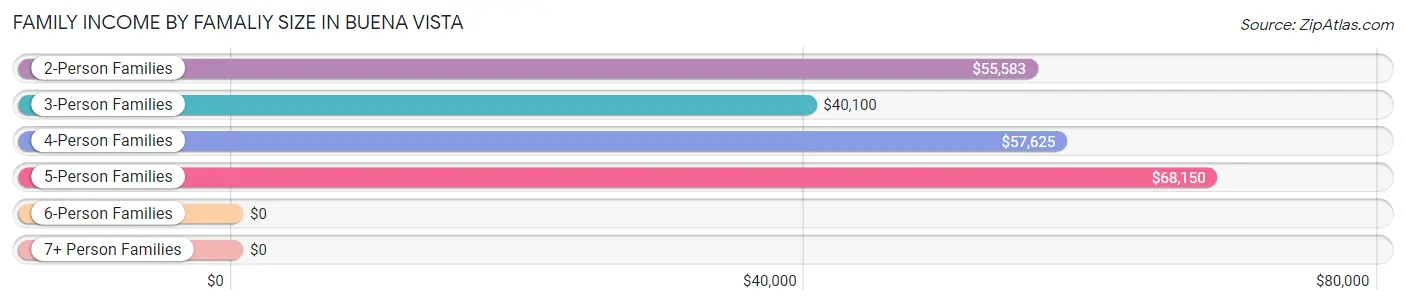
| Income Bracket | # Families | Median Income |
| 2-Person Families | 957 (50.9%) | $55,583 |
| 3-Person Families | 516 (27.4%) | $40,100 |
| 4-Person Families | 260 (13.8%) | $57,625 |
| 5-Person Families | 97 (5.2%) | $68,150 |
| 6-Person Families | 26 (1.4%) | $0 |
| 7+ Person Families | 25 (1.3%) | $0 |
| Total | 1,881 (100.0%) | $55,717 |
Family Income by Number of Earners in Buena Vista
The median family income in Buena Vista is $55,717, with families comprising 3+ earners (133) having the highest median family income of $105,450, while families with no earners (221) have the lowest median family income of $26,042, accounting for 7.1% and 11.7% of families, respectively.
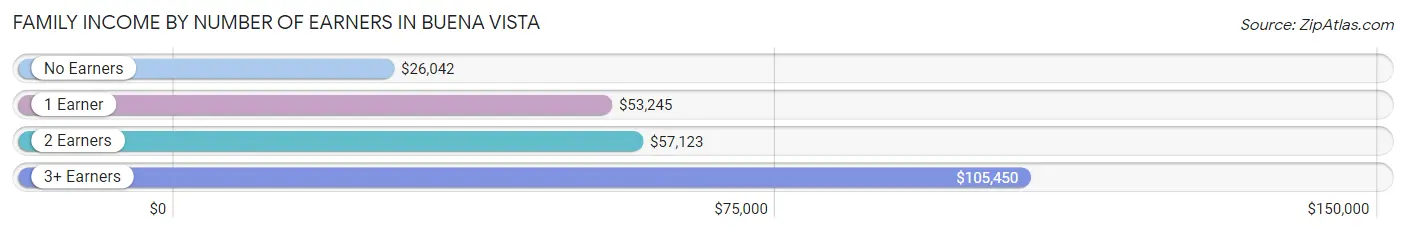
| Number of Earners | # Families | Median Income |
| No Earners | 221 (11.7%) | $26,042 |
| 1 Earner | 695 (36.9%) | $53,245 |
| 2 Earners | 832 (44.2%) | $57,123 |
| 3+ Earners | 133 (7.1%) | $105,450 |
| Total | 1,881 (100.0%) | $55,717 |
Household Income in Buena Vista
Household Income Brackets in Buena Vista
With 483 households falling in the category, the $35,000 to $49,999 income range is the most frequent in Buena Vista, accounting for 18.2% of all households. In contrast, only 21 households (0.8%) fall into the $150,000 to $199,999 income bracket, making it the least populous group.
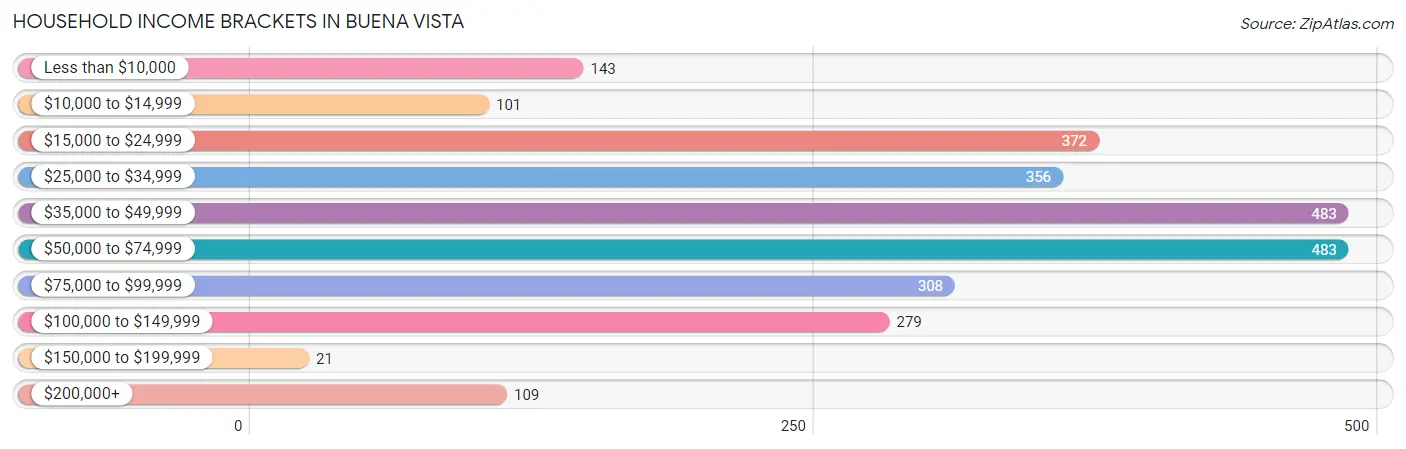
| Income Bracket | # Households | % Households |
| Less than $10,000 | 143 | 5.4% |
| $10,000 to $14,999 | 101 | 3.8% |
| $15,000 to $24,999 | 372 | 14.0% |
| $25,000 to $34,999 | 356 | 13.4% |
| $35,000 to $49,999 | 483 | 18.2% |
| $50,000 to $74,999 | 483 | 18.2% |
| $75,000 to $99,999 | 308 | 11.6% |
| $100,000 to $149,999 | 279 | 10.5% |
| $150,000 to $199,999 | 21 | 0.8% |
| $200,000+ | 109 | 4.1% |
Household Income by Householder Age in Buena Vista
The median household income in Buena Vista is $48,783, with the highest median household income of $57,363 found in the 45 to 64 years age bracket for the primary householder. A total of 987 households (37.2%) fall into this category. Meanwhile, the 65+ years age bracket for the primary householder has the lowest median household income of $33,385, with 696 households (26.2%) in this group.
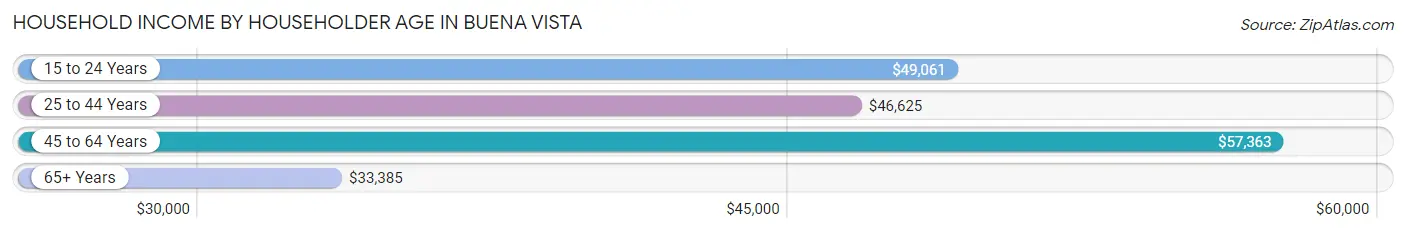
| Income Bracket | # Households | Median Income |
| 15 to 24 Years | 257 (9.7%) | $49,061 |
| 25 to 44 Years | 715 (26.9%) | $46,625 |
| 45 to 64 Years | 987 (37.2%) | $57,363 |
| 65+ Years | 696 (26.2%) | $33,385 |
| Total | 2,655 (100.0%) | $48,783 |
Poverty in Buena Vista
Income Below Poverty by Sex and Age in Buena Vista
With 15.1% poverty level for males and 28.3% for females among the residents of Buena Vista, 15 year old males and 6 to 11 year old females are the most vulnerable to poverty, with 54 males (80.6%) and 202 females (60.5%) in their respective age groups living below the poverty level.
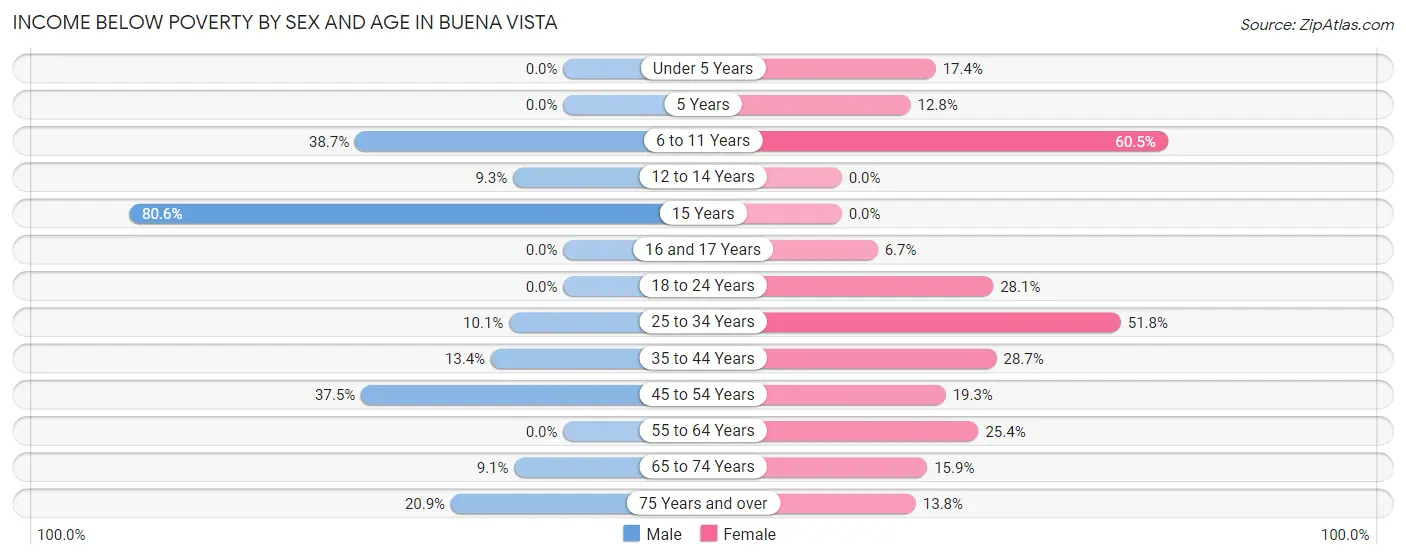
| Age Bracket | Male | Female |
| Under 5 Years | 0 (0.0%) | 45 (17.4%) |
| 5 Years | 0 (0.0%) | 6 (12.8%) |
| 6 to 11 Years | 92 (38.7%) | 202 (60.5%) |
| 12 to 14 Years | 14 (9.3%) | 0 (0.0%) |
| 15 Years | 54 (80.6%) | 0 (0.0%) |
| 16 and 17 Years | 0 (0.0%) | 3 (6.7%) |
| 18 to 24 Years | 0 (0.0%) | 95 (28.1%) |
| 25 to 34 Years | 31 (10.1%) | 188 (51.8%) |
| 35 to 44 Years | 50 (13.4%) | 79 (28.7%) |
| 45 to 54 Years | 140 (37.5%) | 71 (19.3%) |
| 55 to 64 Years | 0 (0.0%) | 103 (25.4%) |
| 65 to 74 Years | 23 (9.1%) | 59 (15.9%) |
| 75 Years and over | 39 (20.9%) | 40 (13.8%) |
| Total | 443 (15.1%) | 891 (28.3%) |
Income Above Poverty by Sex and Age in Buena Vista
According to the poverty statistics in Buena Vista, males aged under 5 years and females aged 12 to 14 years are the age groups that are most secure financially, with 100.0% of males and 100.0% of females in these age groups living above the poverty line.
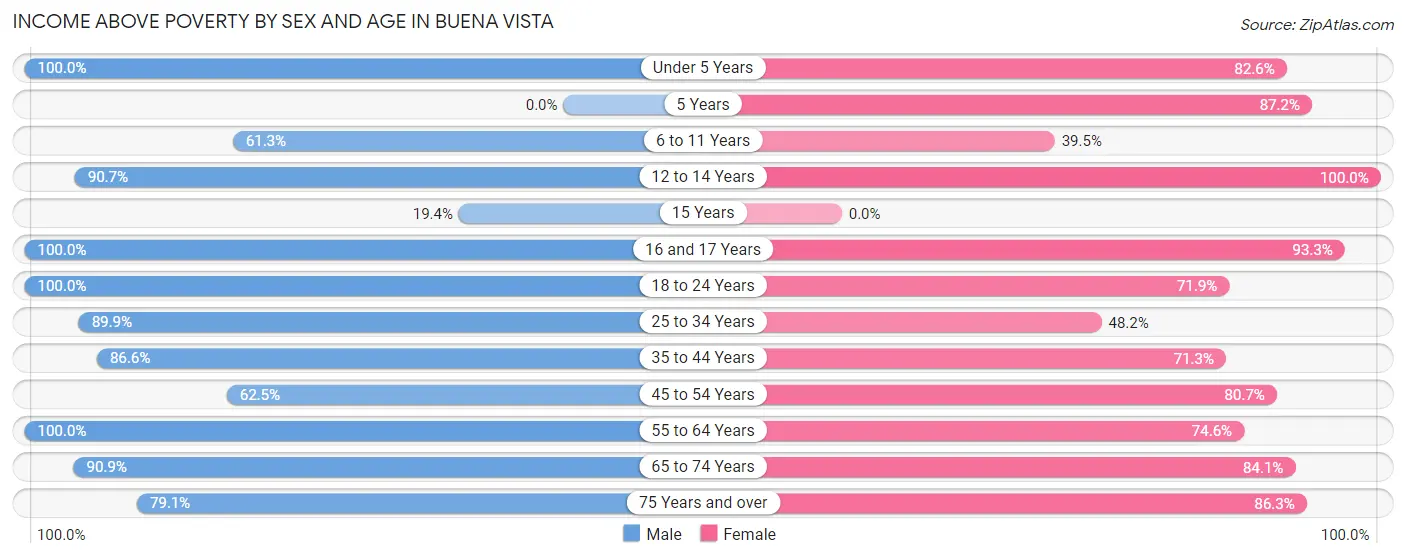
| Age Bracket | Male | Female |
| Under 5 Years | 69 (100.0%) | 213 (82.6%) |
| 5 Years | 0 (0.0%) | 41 (87.2%) |
| 6 to 11 Years | 146 (61.3%) | 132 (39.5%) |
| 12 to 14 Years | 136 (90.7%) | 46 (100.0%) |
| 15 Years | 13 (19.4%) | 0 (0.0%) |
| 16 and 17 Years | 159 (100.0%) | 42 (93.3%) |
| 18 to 24 Years | 415 (100.0%) | 243 (71.9%) |
| 25 to 34 Years | 277 (89.9%) | 175 (48.2%) |
| 35 to 44 Years | 322 (86.6%) | 196 (71.3%) |
| 45 to 54 Years | 233 (62.5%) | 297 (80.7%) |
| 55 to 64 Years | 347 (100.0%) | 303 (74.6%) |
| 65 to 74 Years | 230 (90.9%) | 313 (84.1%) |
| 75 Years and over | 148 (79.1%) | 251 (86.3%) |
| Total | 2,495 (84.9%) | 2,252 (71.7%) |
Income Below Poverty Among Married-Couple Families in Buena Vista
The poverty statistics for married-couple families in Buena Vista show that 7.0% or 84 of the total 1,192 families live below the poverty line. Families with 1 or 2 children have the highest poverty rate of 10.3%, comprising of 25 families. On the other hand, families with 3 or 4 children have the lowest poverty rate of 0.0%, which includes 0 families.
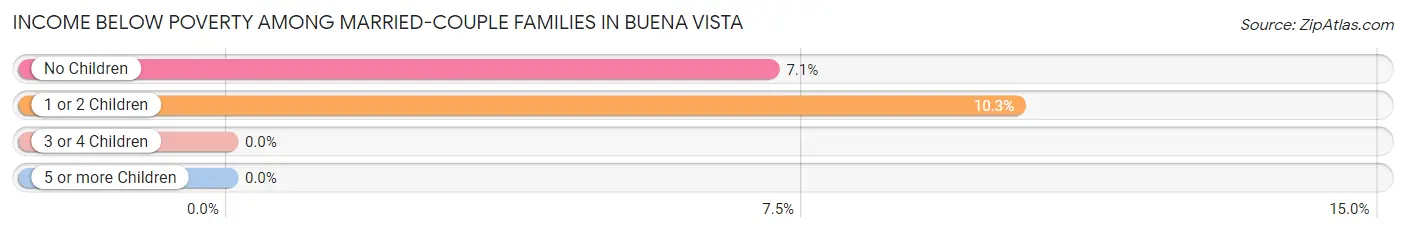
| Children | Above Poverty | Below Poverty |
| No Children | 776 (92.9%) | 59 (7.1%) |
| 1 or 2 Children | 218 (89.7%) | 25 (10.3%) |
| 3 or 4 Children | 89 (100.0%) | 0 (0.0%) |
| 5 or more Children | 25 (100.0%) | 0 (0.0%) |
| Total | 1,108 (92.9%) | 84 (7.0%) |
Income Below Poverty Among Single-Parent Households in Buena Vista
According to the poverty data in Buena Vista, 5.1% or 8 single-father households and 42.8% or 228 single-mother households are living below the poverty line. Among single-father households, those with 1 or 2 children have the highest poverty rate, with 8 households (8.1%) experiencing poverty. Likewise, among single-mother households, those with 3 or 4 children have the highest poverty rate, with 113 households (100.0%) falling below the poverty line.
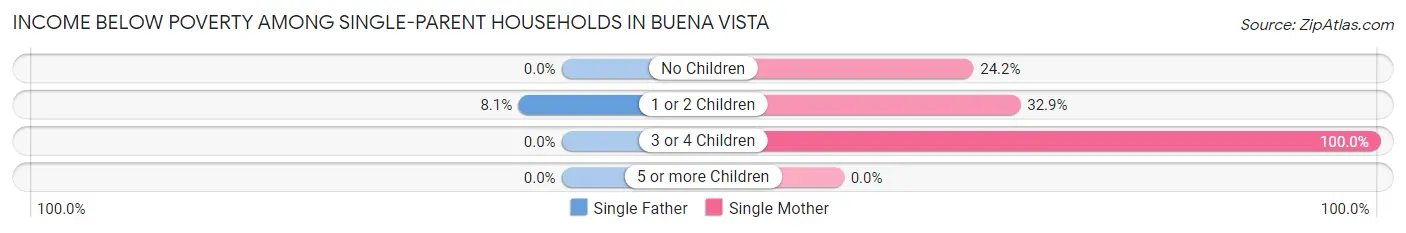
| Children | Single Father | Single Mother |
| No Children | 0 (0.0%) | 64 (24.1%) |
| 1 or 2 Children | 8 (8.1%) | 51 (32.9%) |
| 3 or 4 Children | 0 (0.0%) | 113 (100.0%) |
| 5 or more Children | 0 (0.0%) | 0 (0.0%) |
| Total | 8 (5.1%) | 228 (42.8%) |
Income Below Poverty Among Married-Couple vs Single-Parent Households in Buena Vista
The poverty data for Buena Vista shows that 84 of the married-couple family households (7.0%) and 236 of the single-parent households (34.3%) are living below the poverty level. Within the married-couple family households, those with 1 or 2 children have the highest poverty rate, with 25 households (10.3%) falling below the poverty line. Among the single-parent households, those with 3 or 4 children have the highest poverty rate, with 113 household (100.0%) living below poverty.
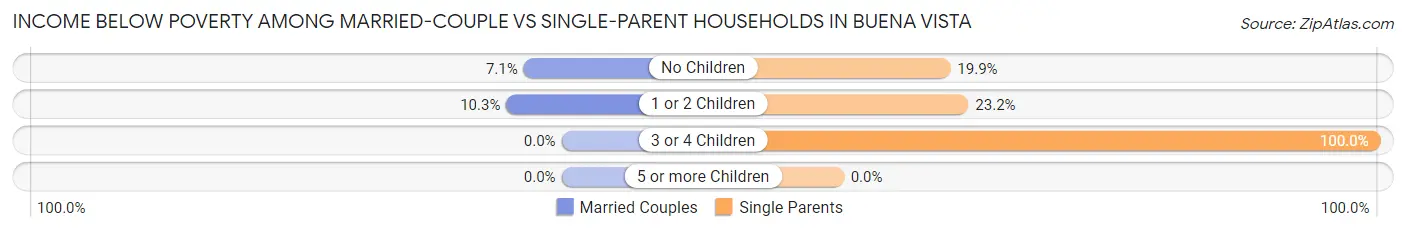
| Children | Married-Couple Families | Single-Parent Households |
| No Children | 59 (7.1%) | 64 (19.9%) |
| 1 or 2 Children | 25 (10.3%) | 59 (23.2%) |
| 3 or 4 Children | 0 (0.0%) | 113 (100.0%) |
| 5 or more Children | 0 (0.0%) | 0 (0.0%) |
| Total | 84 (7.0%) | 236 (34.3%) |
Race in Buena Vista
The most populous races in Buena Vista are White / Caucasian (5,771 | 86.9%), Two or more Races (464 | 7.0%), and Black / African American (275 | 4.1%).
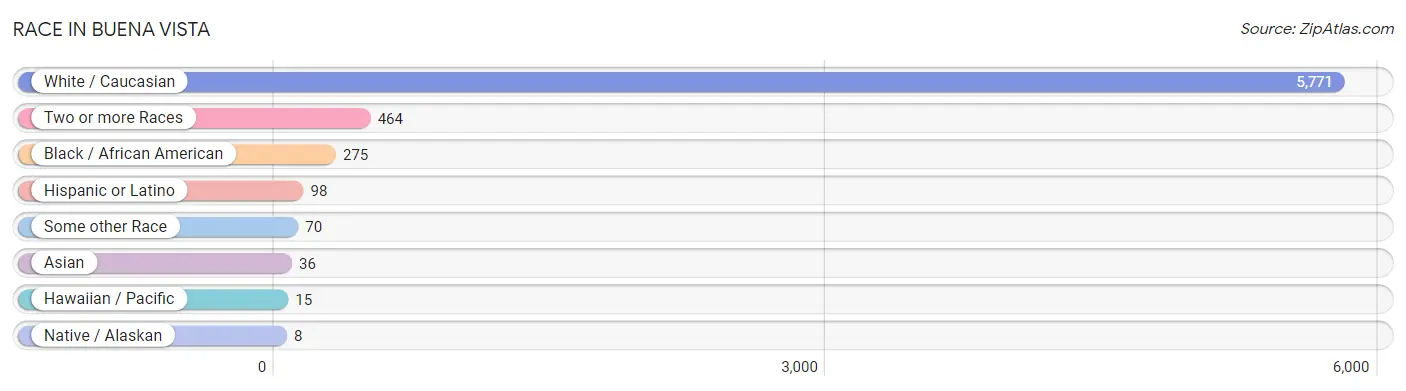
| Race | # Population | % Population |
| Asian | 36 | 0.5% |
| Black / African American | 275 | 4.1% |
| Hawaiian / Pacific | 15 | 0.2% |
| Hispanic or Latino | 98 | 1.5% |
| Native / Alaskan | 8 | 0.1% |
| White / Caucasian | 5,771 | 86.9% |
| Two or more Races | 464 | 7.0% |
| Some other Race | 70 | 1.1% |
| Total | 6,639 | 100.0% |
Ancestry in Buena Vista
The most populous ancestries reported in Buena Vista are American (2,016 | 30.4%), English (398 | 6.0%), Irish (354 | 5.3%), German (327 | 4.9%), and European (260 | 3.9%), together accounting for 50.5% of all Buena Vista residents.
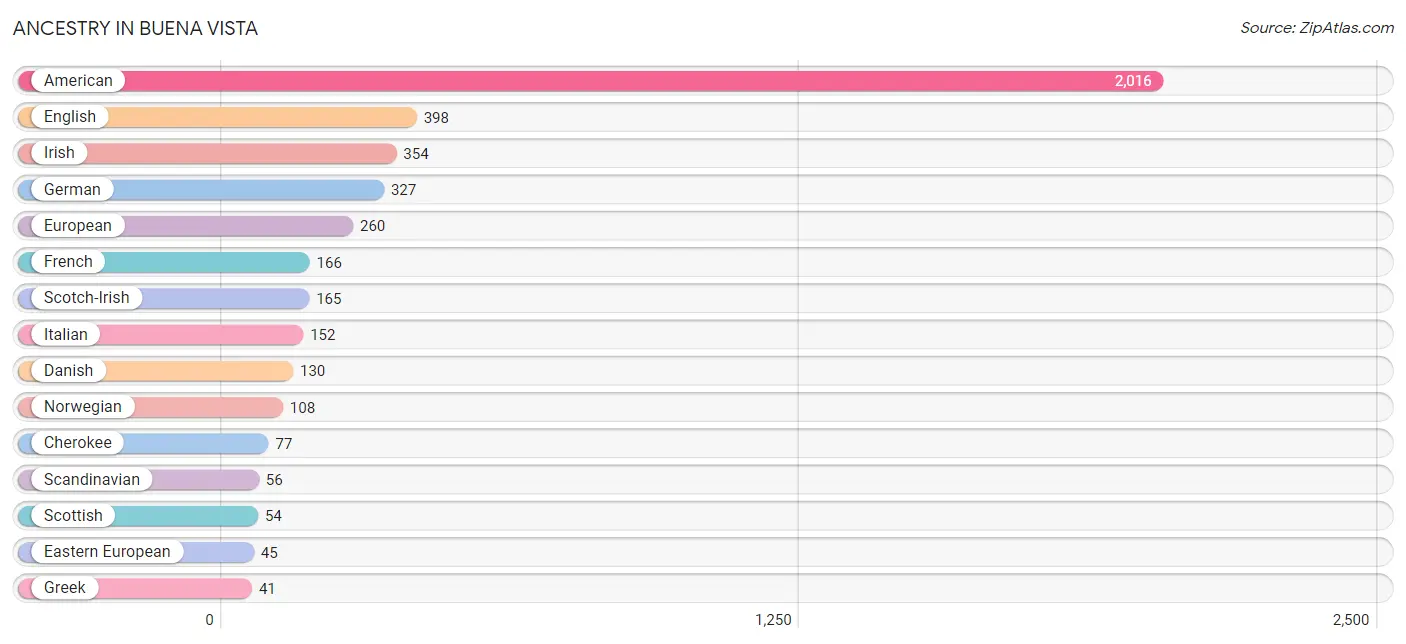
| Ancestry | # Population | % Population |
| American | 2,016 | 30.4% |
| British | 7 | 0.1% |
| Burmese | 6 | 0.1% |
| Celtic | 16 | 0.2% |
| Central American | 30 | 0.4% |
| Cherokee | 77 | 1.2% |
| Colombian | 6 | 0.1% |
| Danish | 130 | 2.0% |
| Eastern European | 45 | 0.7% |
| English | 398 | 6.0% |
| European | 260 | 3.9% |
| French | 166 | 2.5% |
| French American Indian | 38 | 0.6% |
| German | 327 | 4.9% |
| Greek | 41 | 0.6% |
| Honduran | 30 | 0.4% |
| Indian (Asian) | 6 | 0.1% |
| Irish | 354 | 5.3% |
| Italian | 152 | 2.3% |
| Korean | 6 | 0.1% |
| Mexican | 39 | 0.6% |
| Native Hawaiian | 15 | 0.2% |
| Northern European | 35 | 0.5% |
| Norwegian | 108 | 1.6% |
| Peruvian | 17 | 0.3% |
| Polish | 6 | 0.1% |
| Russian | 6 | 0.1% |
| Scandinavian | 56 | 0.8% |
| Scotch-Irish | 165 | 2.5% |
| Scottish | 54 | 0.8% |
| South American | 23 | 0.4% |
| Spanish | 6 | 0.1% |
| Sri Lankan | 27 | 0.4% |
| Swedish | 33 | 0.5% |
| Thai | 13 | 0.2% |
| Welsh | 26 | 0.4% | View All 36 Rows |
Immigrants in Buena Vista
The most numerous immigrant groups reported in Buena Vista came from Eastern Europe (18 | 0.3%), Europe (18 | 0.3%), Latin America (17 | 0.3%), Peru (17 | 0.3%), and South America (17 | 0.3%), together accounting for 1.3% of all Buena Vista residents.
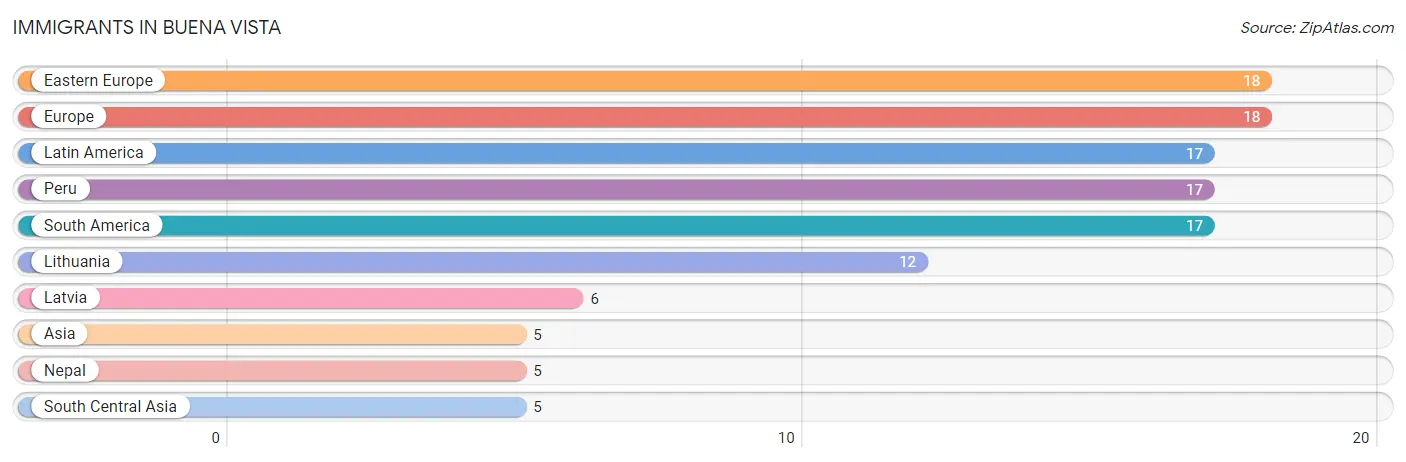
| Immigration Origin | # Population | % Population |
| Asia | 5 | 0.1% |
| Eastern Europe | 18 | 0.3% |
| Europe | 18 | 0.3% |
| Latin America | 17 | 0.3% |
| Latvia | 6 | 0.1% |
| Lithuania | 12 | 0.2% |
| Nepal | 5 | 0.1% |
| Peru | 17 | 0.3% |
| South America | 17 | 0.3% |
| South Central Asia | 5 | 0.1% | View All 10 Rows |
Sex and Age in Buena Vista
Sex and Age in Buena Vista
The most populous age groups in Buena Vista are 15 to 19 Years (394 | 12.6%) for men and 20 to 24 Years (360 | 10.2%) for women.
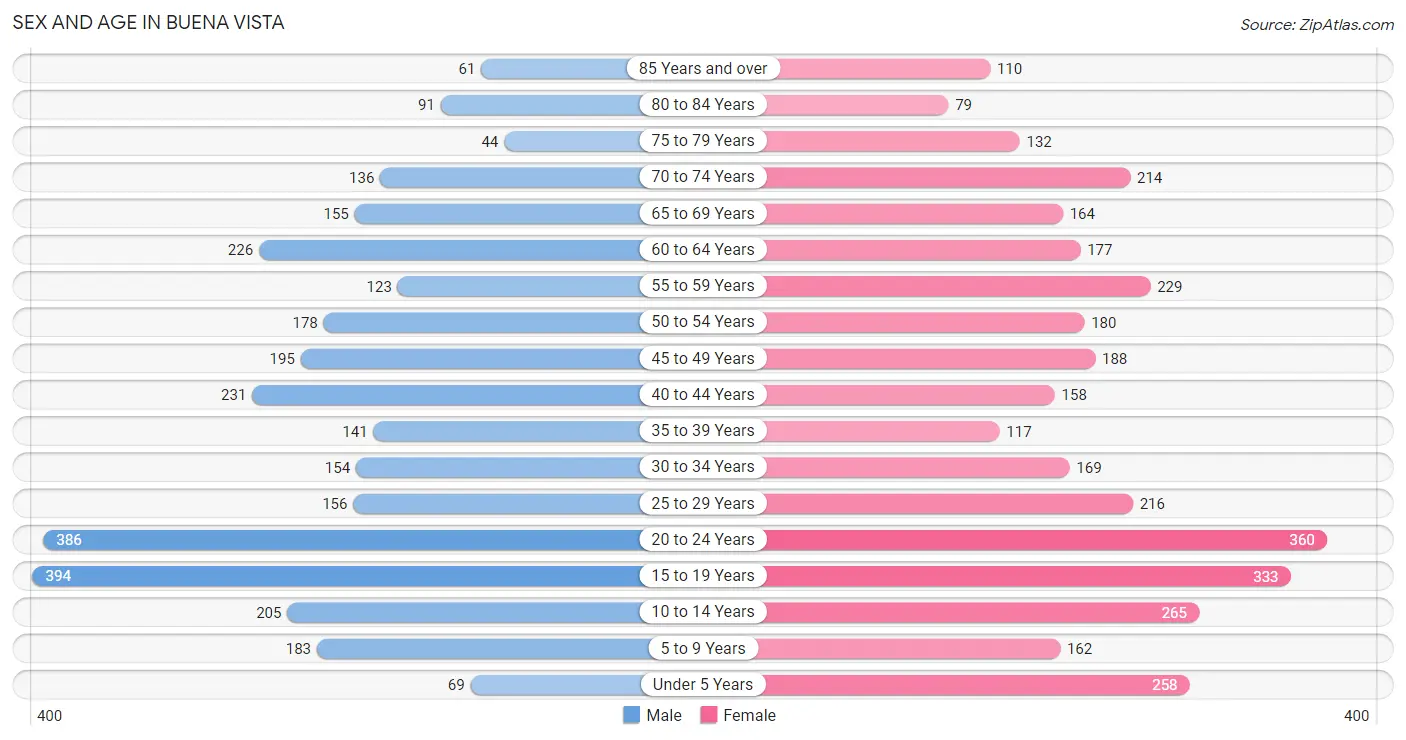
| Age Bracket | Male | Female |
| Under 5 Years | 69 (2.2%) | 258 (7.3%) |
| 5 to 9 Years | 183 (5.9%) | 162 (4.6%) |
| 10 to 14 Years | 205 (6.6%) | 265 (7.5%) |
| 15 to 19 Years | 394 (12.6%) | 333 (9.5%) |
| 20 to 24 Years | 386 (12.3%) | 360 (10.2%) |
| 25 to 29 Years | 156 (5.0%) | 216 (6.1%) |
| 30 to 34 Years | 154 (4.9%) | 169 (4.8%) |
| 35 to 39 Years | 141 (4.5%) | 117 (3.3%) |
| 40 to 44 Years | 231 (7.4%) | 158 (4.5%) |
| 45 to 49 Years | 195 (6.2%) | 188 (5.3%) |
| 50 to 54 Years | 178 (5.7%) | 180 (5.1%) |
| 55 to 59 Years | 123 (3.9%) | 229 (6.5%) |
| 60 to 64 Years | 226 (7.2%) | 177 (5.0%) |
| 65 to 69 Years | 155 (5.0%) | 164 (4.7%) |
| 70 to 74 Years | 136 (4.3%) | 214 (6.1%) |
| 75 to 79 Years | 44 (1.4%) | 132 (3.8%) |
| 80 to 84 Years | 91 (2.9%) | 79 (2.2%) |
| 85 Years and over | 61 (1.9%) | 110 (3.1%) |
| Total | 3,128 (100.0%) | 3,511 (100.0%) |
Families and Households in Buena Vista
Median Family Size in Buena Vista
The median family size in Buena Vista is 2.67 persons per family, with married-couple families (1,192 | 63.4%) accounting for the largest median family size of 2.83 persons per family. On the other hand, single male/father families (156 | 8.3%) represent the smallest median family size with 2.28 persons per family.
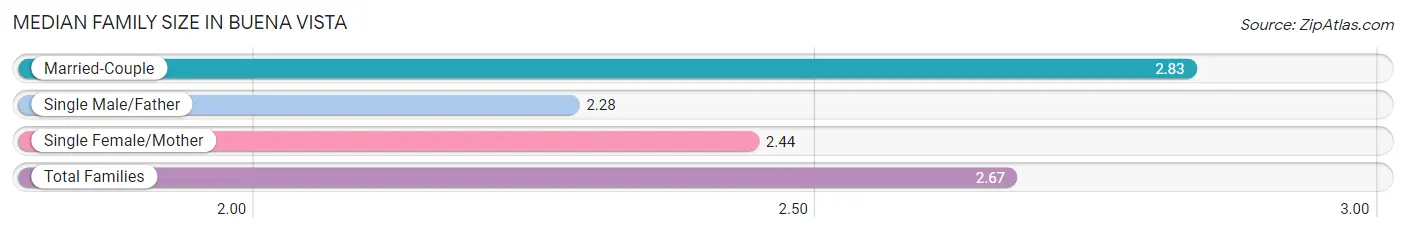
| Family Type | # Families | Family Size |
| Married-Couple | 1,192 (63.4%) | 2.83 |
| Single Male/Father | 156 (8.3%) | 2.28 |
| Single Female/Mother | 533 (28.3%) | 2.44 |
| Total Families | 1,881 (100.0%) | 2.67 |
Median Household Size in Buena Vista
The median household size in Buena Vista is 2.29 persons per household, with married-couple households (1,192 | 44.9%) accounting for the largest median household size of 2.89 persons per household. non-family households (774 | 29.1%) represent the smallest median household size with 1.12 persons per household.
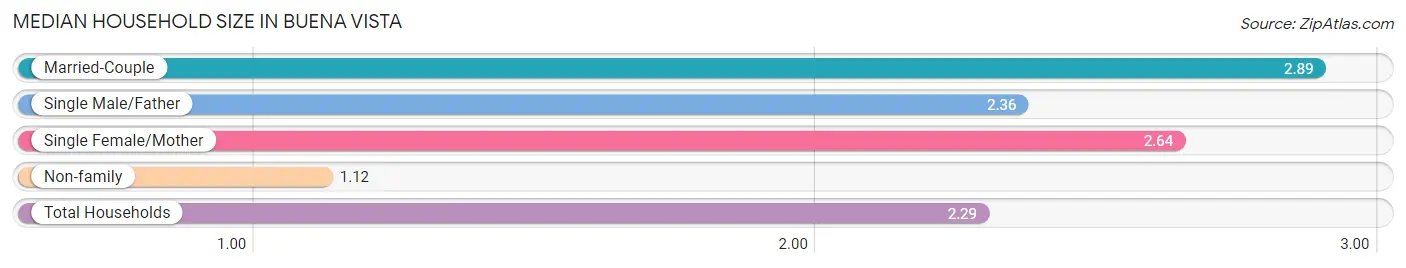
| Household Type | # Households | Household Size |
| Married-Couple | 1,192 (44.9%) | 2.89 |
| Single Male/Father | 156 (5.9%) | 2.36 |
| Single Female/Mother | 533 (20.1%) | 2.64 |
| Non-family | 774 (29.1%) | 1.12 |
| Total Households | 2,655 (100.0%) | 2.29 |
Household Size by Marriage Status in Buena Vista
Out of a total of 2,655 households in Buena Vista, 1,881 (70.9%) are family households, while 774 (29.1%) are nonfamily households. The most numerous type of family households are 2-person households, comprising 875, and the most common type of nonfamily households are 1-person households, comprising 690.
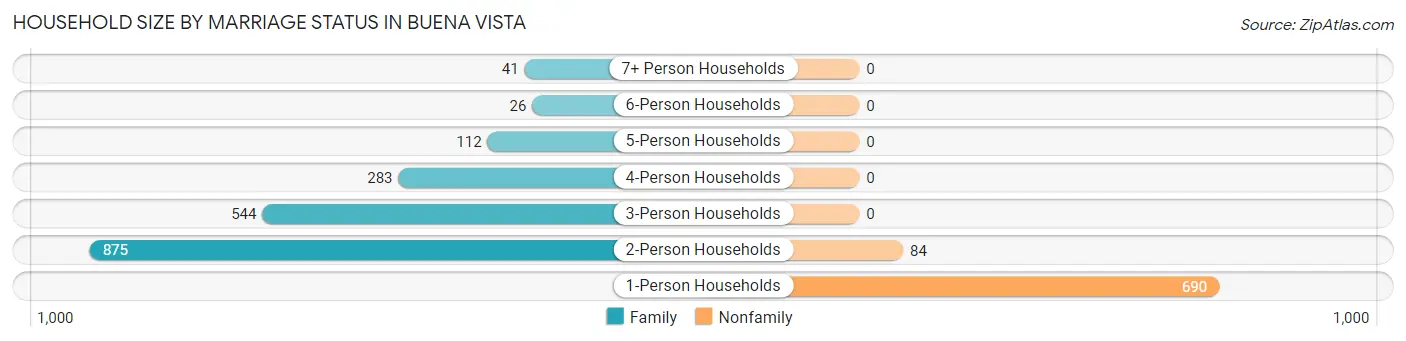
| Household Size | Family Households | Nonfamily Households |
| 1-Person Households | - | 690 (26.0%) |
| 2-Person Households | 875 (33.0%) | 84 (3.2%) |
| 3-Person Households | 544 (20.5%) | 0 (0.0%) |
| 4-Person Households | 283 (10.7%) | 0 (0.0%) |
| 5-Person Households | 112 (4.2%) | 0 (0.0%) |
| 6-Person Households | 26 (1.0%) | 0 (0.0%) |
| 7+ Person Households | 41 (1.5%) | 0 (0.0%) |
| Total | 1,881 (70.9%) | 774 (29.1%) |
Female Fertility in Buena Vista
Fertility by Age in Buena Vista
Average fertility rate in Buena Vista is 46.0 births per 1,000 women. Women in the age bracket of 20 to 34 years have the highest fertility rate with 99.0 births per 1,000 women. Women in the age bracket of 20 to 34 years acount for 100.0% of all women with births.
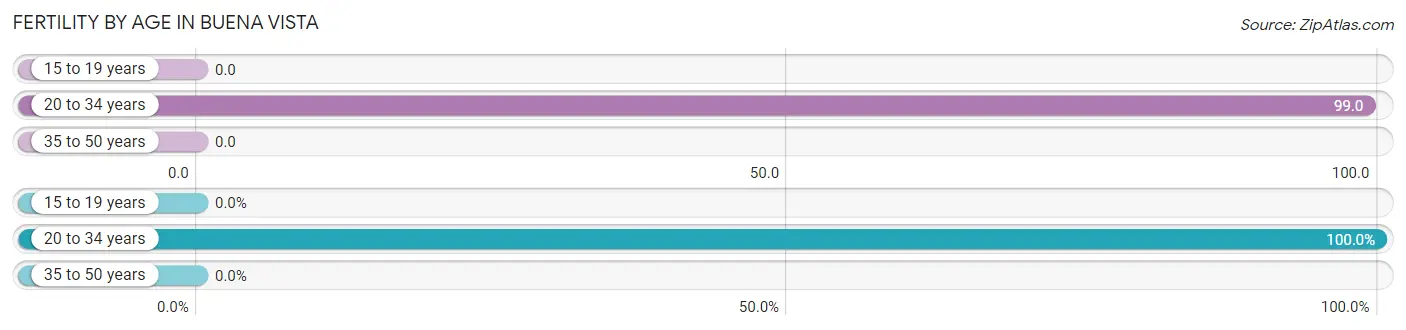
| Age Bracket | Women with Births | Births / 1,000 Women |
| 15 to 19 years | 0 (0.0%) | 0.0 |
| 20 to 34 years | 74 (100.0%) | 99.0 |
| 35 to 50 years | 0 (0.0%) | 0.0 |
| Total | 74 (100.0%) | 46.0 |
Fertility by Age by Marriage Status in Buena Vista
64.9% of women with births (74) in Buena Vista are married. The highest percentage of unmarried women with births falls into 20 to 34 years age bracket with 35.1% of them unmarried at the time of birth, while the lowest percentage of unmarried women with births belong to 20 to 34 years age bracket with 35.1% of them unmarried.
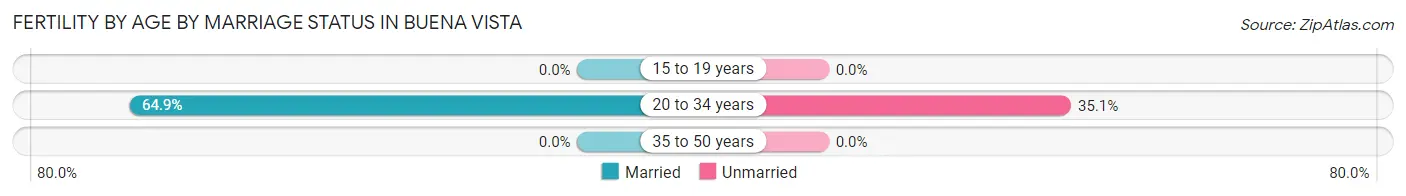
| Age Bracket | Married | Unmarried |
| 15 to 19 years | 0 (0.0%) | 0 (0.0%) |
| 20 to 34 years | 48 (64.9%) | 26 (35.1%) |
| 35 to 50 years | 0 (0.0%) | 0 (0.0%) |
| Total | 48 (64.9%) | 26 (35.1%) |
Fertility by Education in Buena Vista
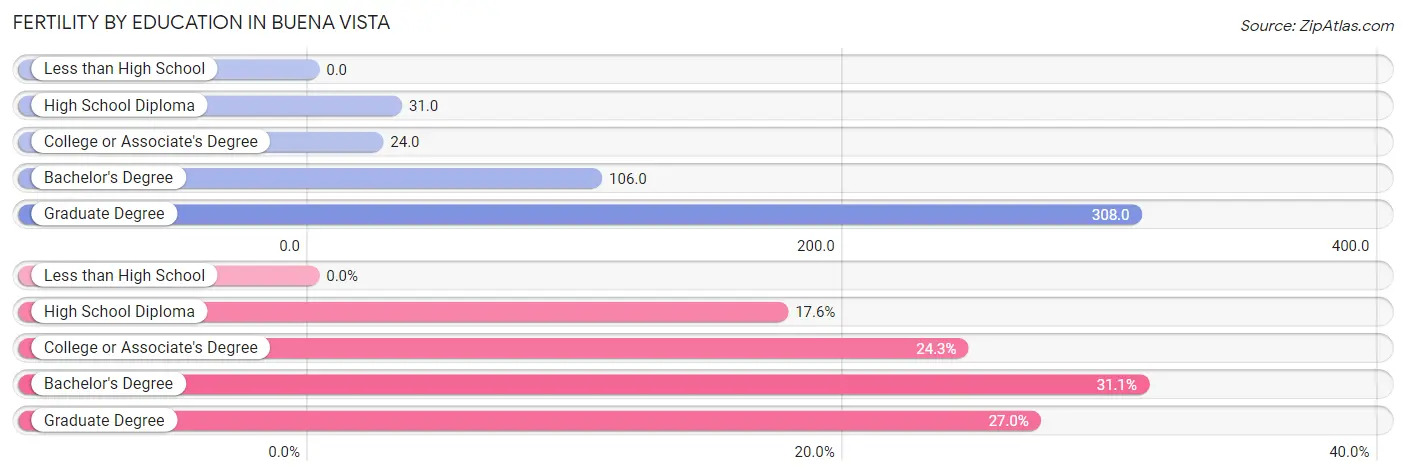
| Educational Attainment | Women with Births | Births / 1,000 Women |
| Less than High School | 0 (0.0%) | 0.0 |
| High School Diploma | 13 (17.6%) | 31.0 |
| College or Associate's Degree | 18 (24.3%) | 24.0 |
| Bachelor's Degree | 23 (31.1%) | 106.0 |
| Graduate Degree | 20 (27.0%) | 308.0 |
| Total | 74 (100.0%) | 46.0 |
Fertility by Education by Marriage Status in Buena Vista
35.1% of women with births in Buena Vista are unmarried. Women with the educational attainment of college or associate's degree are most likely to be married with 100.0% of them married at childbirth, while women with the educational attainment of high school diploma are least likely to be married with 100.0% of them unmarried at childbirth.
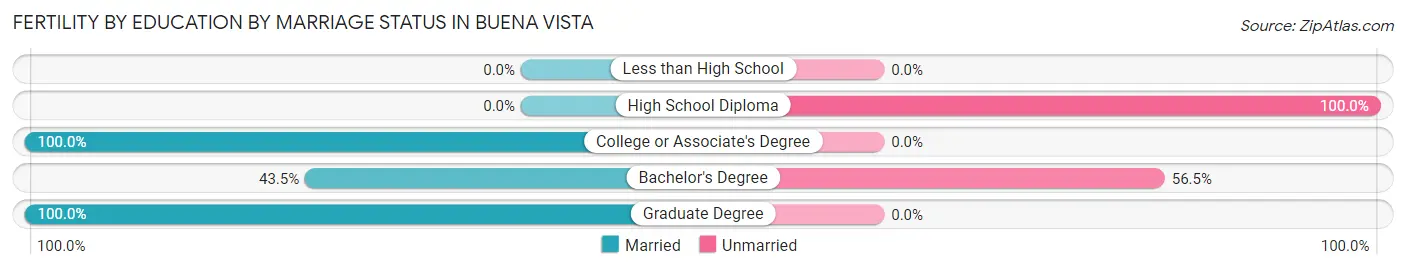
| Educational Attainment | Married | Unmarried |
| Less than High School | 0 (0.0%) | 0 (0.0%) |
| High School Diploma | 0 (0.0%) | 13 (100.0%) |
| College or Associate's Degree | 18 (100.0%) | 0 (0.0%) |
| Bachelor's Degree | 10 (43.5%) | 13 (56.5%) |
| Graduate Degree | 20 (100.0%) | 0 (0.0%) |
| Total | 48 (64.9%) | 26 (35.1%) |
Employment Characteristics in Buena Vista
Employment by Class of Employer in Buena Vista
Among the 3,056 employed individuals in Buena Vista, private company employees (1,994 | 65.2%), not-for-profit organizations (373 | 12.2%), and local government employees (305 | 10.0%) make up the most common classes of employment.
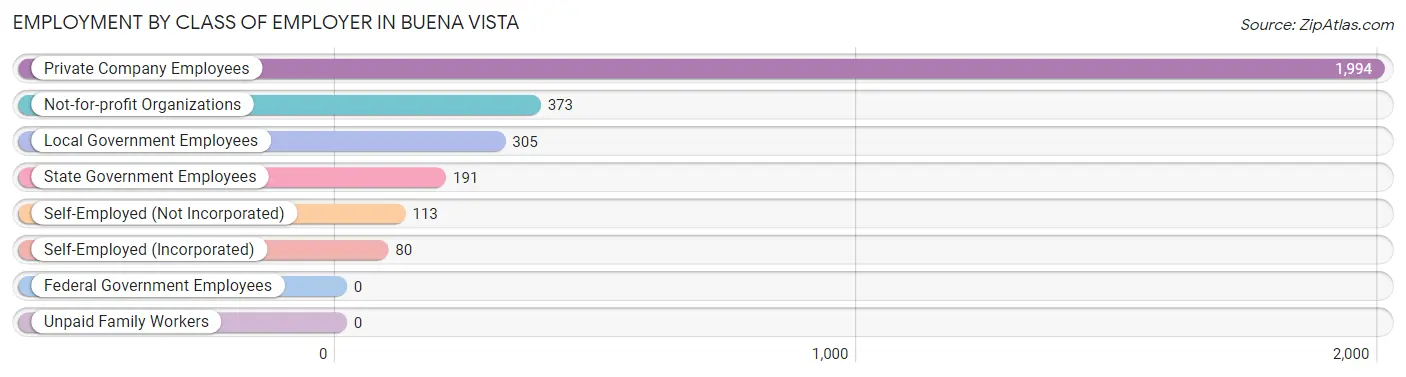
| Employer Class | # Employees | % Employees |
| Private Company Employees | 1,994 | 65.2% |
| Self-Employed (Incorporated) | 80 | 2.6% |
| Self-Employed (Not Incorporated) | 113 | 3.7% |
| Not-for-profit Organizations | 373 | 12.2% |
| Local Government Employees | 305 | 10.0% |
| State Government Employees | 191 | 6.2% |
| Federal Government Employees | 0 | 0.0% |
| Unpaid Family Workers | 0 | 0.0% |
| Total | 3,056 | 100.0% |
Employment Status by Age in Buena Vista
According to the labor force statistics for Buena Vista, out of the total population over 16 years of age (5,430), 58.2% or 3,160 individuals are in the labor force, with 1.3% or 41 of them unemployed. The age group with the highest labor force participation rate is 25 to 29 years, with 87.4% or 325 individuals in the labor force. Within the labor force, the 45 to 54 years age range has the highest percentage of unemployed individuals, with 4.3% or 24 of them being unemployed.
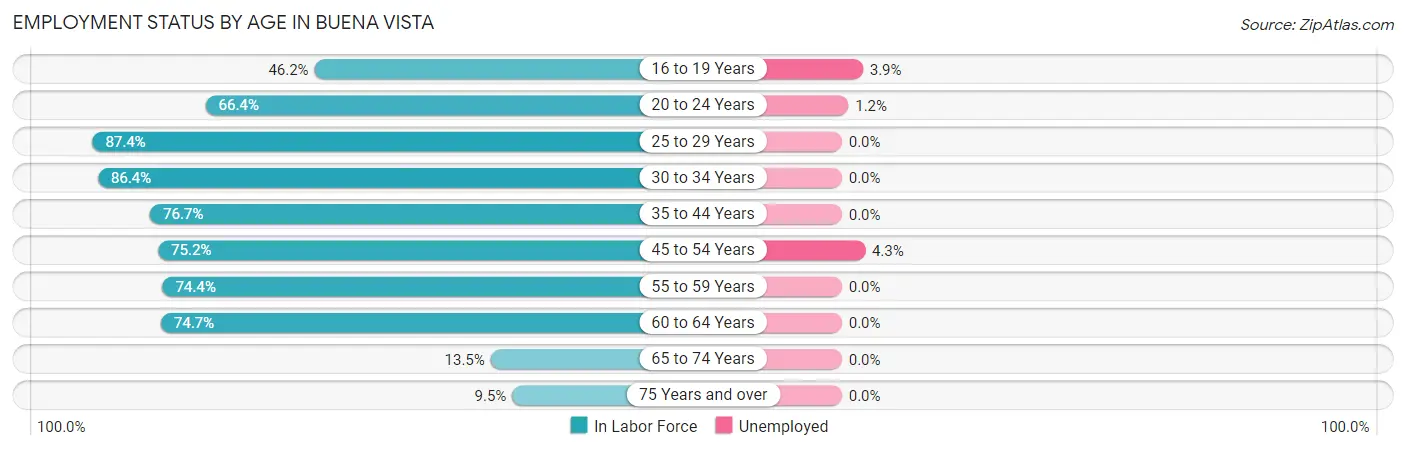
| Age Bracket | In Labor Force | Unemployed |
| 16 to 19 Years | 305 (46.2%) | 12 (3.9%) |
| 20 to 24 Years | 495 (66.4%) | 6 (1.2%) |
| 25 to 29 Years | 325 (87.4%) | 0 (0.0%) |
| 30 to 34 Years | 279 (86.4%) | 0 (0.0%) |
| 35 to 44 Years | 496 (76.7%) | 0 (0.0%) |
| 45 to 54 Years | 557 (75.2%) | 24 (4.3%) |
| 55 to 59 Years | 262 (74.4%) | 0 (0.0%) |
| 60 to 64 Years | 301 (74.7%) | 0 (0.0%) |
| 65 to 74 Years | 90 (13.5%) | 0 (0.0%) |
| 75 Years and over | 49 (9.5%) | 0 (0.0%) |
| Total | 3,160 (58.2%) | 41 (1.3%) |
Employment Status by Educational Attainment in Buena Vista
According to labor force statistics for Buena Vista, 78.2% of individuals (2,219) out of the total population between 25 and 64 years of age (2,838) are in the labor force, with 1.1% or 24 of them being unemployed. The group with the highest labor force participation rate are those with the educational attainment of bachelor's degree or higher, with 87.9% or 631 individuals in the labor force. Within the labor force, individuals with college / associate degree education have the highest percentage of unemployment, with 3.8% or 24 of them being unemployed.
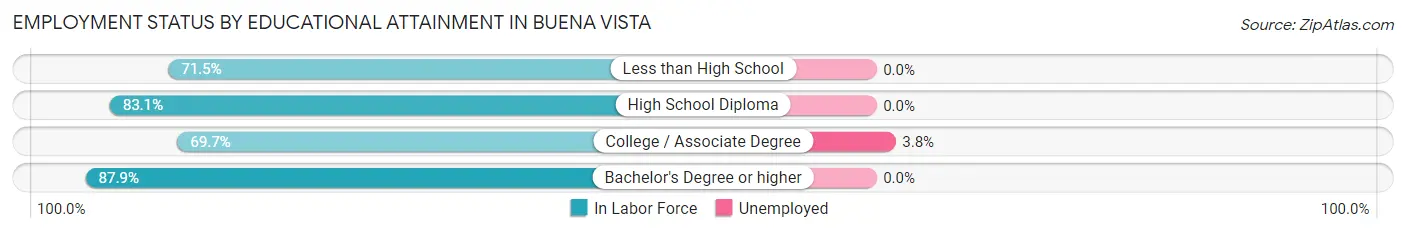
| Educational Attainment | In Labor Force | Unemployed |
| Less than High School | 314 (71.5%) | 0 (0.0%) |
| High School Diploma | 640 (83.1%) | 0 (0.0%) |
| College / Associate Degree | 635 (69.7%) | 35 (3.8%) |
| Bachelor's Degree or higher | 631 (87.9%) | 0 (0.0%) |
| Total | 2,219 (78.2%) | 31 (1.1%) |
Employment Occupations by Sex in Buena Vista
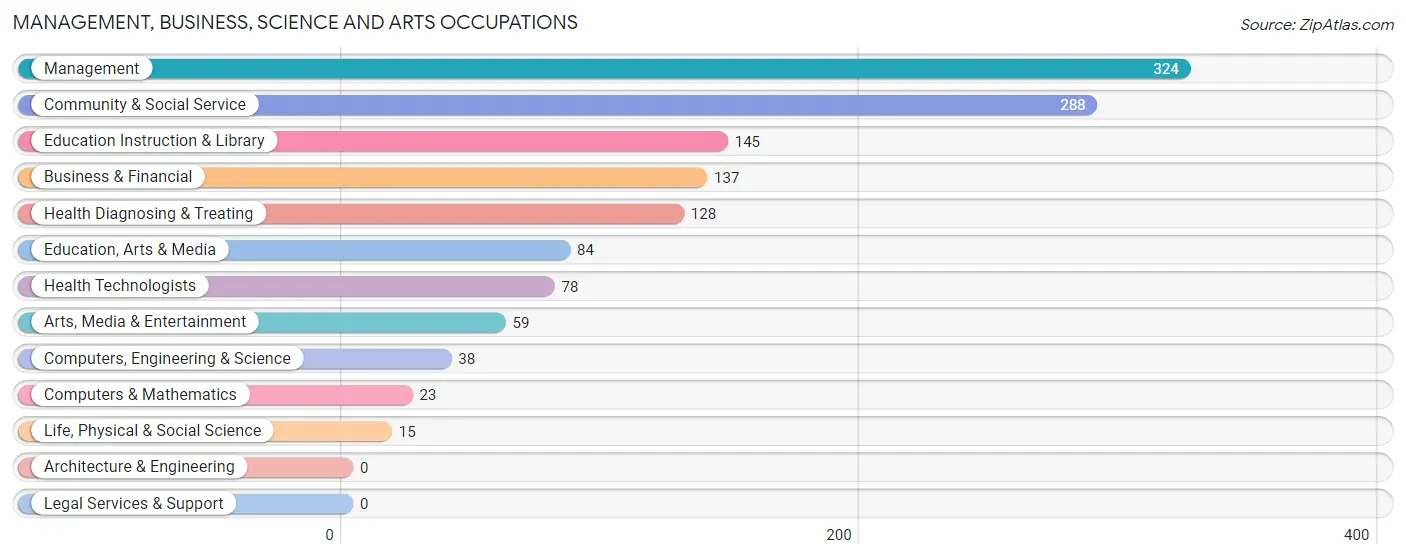
Management, Business, Science and Arts Occupations
The most common Management, Business, Science and Arts occupations in Buena Vista are Management (324 | 10.4%), Community & Social Service (288 | 9.2%), Education Instruction & Library (145 | 4.6%), Business & Financial (137 | 4.4%), and Health Diagnosing & Treating (128 | 4.1%).
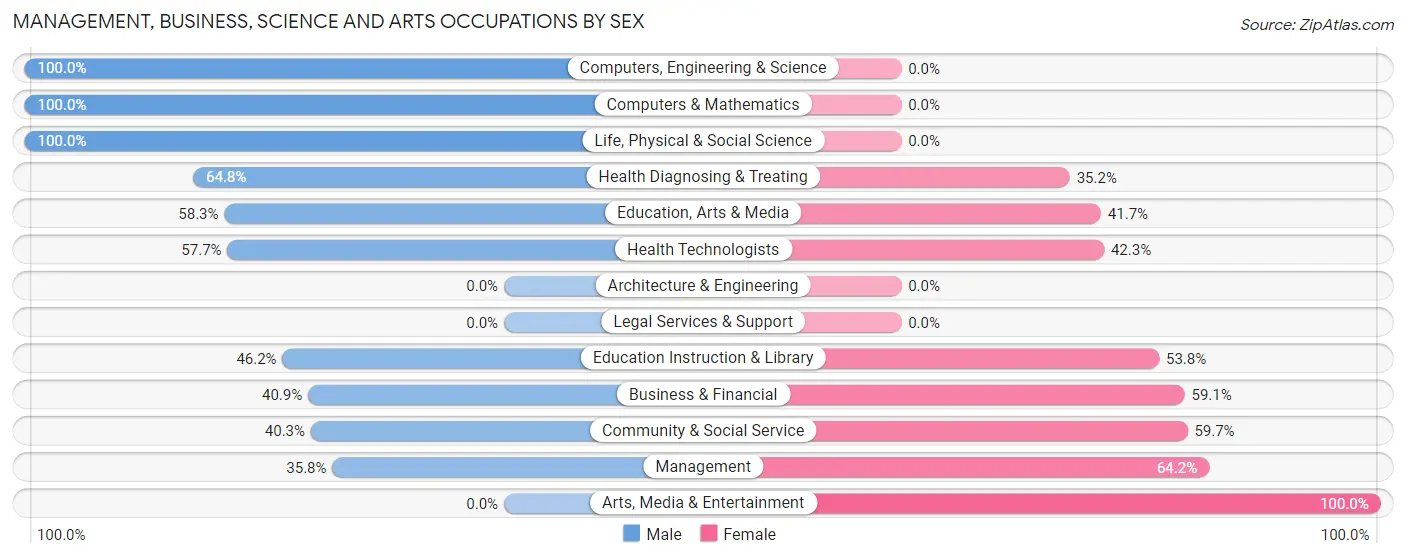
Management, Business, Science and Arts Occupations by Sex
Within the Management, Business, Science and Arts occupations in Buena Vista, the most male-oriented occupations are Computers, Engineering & Science (100.0%), Computers & Mathematics (100.0%), and Life, Physical & Social Science (100.0%), while the most female-oriented occupations are Arts, Media & Entertainment (100.0%), Management (64.2%), and Community & Social Service (59.7%).
| Occupation | Male | Female |
| Management | 116 (35.8%) | 208 (64.2%) |
| Business & Financial | 56 (40.9%) | 81 (59.1%) |
| Computers, Engineering & Science | 38 (100.0%) | 0 (0.0%) |
| Computers & Mathematics | 23 (100.0%) | 0 (0.0%) |
| Architecture & Engineering | 0 (0.0%) | 0 (0.0%) |
| Life, Physical & Social Science | 15 (100.0%) | 0 (0.0%) |
| Community & Social Service | 116 (40.3%) | 172 (59.7%) |
| Education, Arts & Media | 49 (58.3%) | 35 (41.7%) |
| Legal Services & Support | 0 (0.0%) | 0 (0.0%) |
| Education Instruction & Library | 67 (46.2%) | 78 (53.8%) |
| Arts, Media & Entertainment | 0 (0.0%) | 59 (100.0%) |
| Health Diagnosing & Treating | 83 (64.8%) | 45 (35.2%) |
| Health Technologists | 45 (57.7%) | 33 (42.3%) |
| Total (Category) | 409 (44.7%) | 506 (55.3%) |
| Total (Overall) | 1,799 (57.7%) | 1,318 (42.3%) |
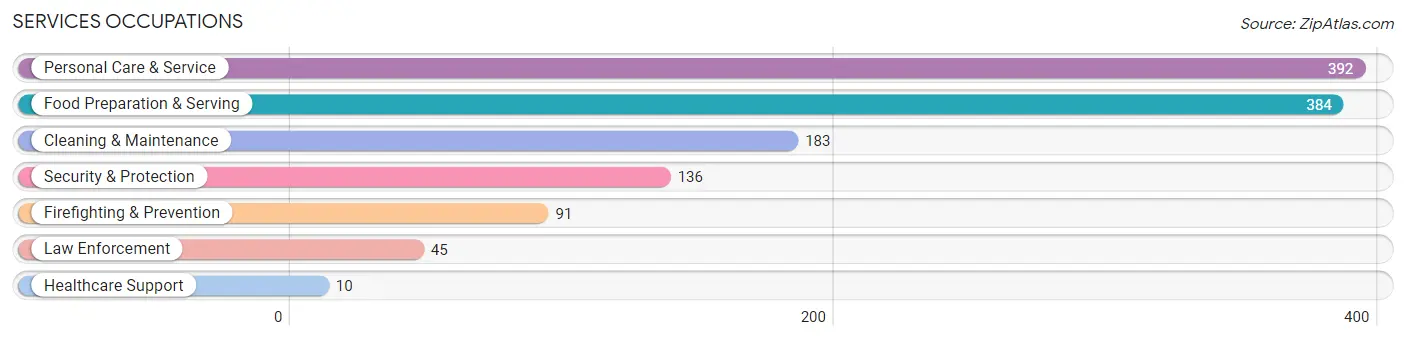
Services Occupations
The most common Services occupations in Buena Vista are Personal Care & Service (392 | 12.6%), Food Preparation & Serving (384 | 12.3%), Cleaning & Maintenance (183 | 5.9%), Security & Protection (136 | 4.4%), and Firefighting & Prevention (91 | 2.9%).
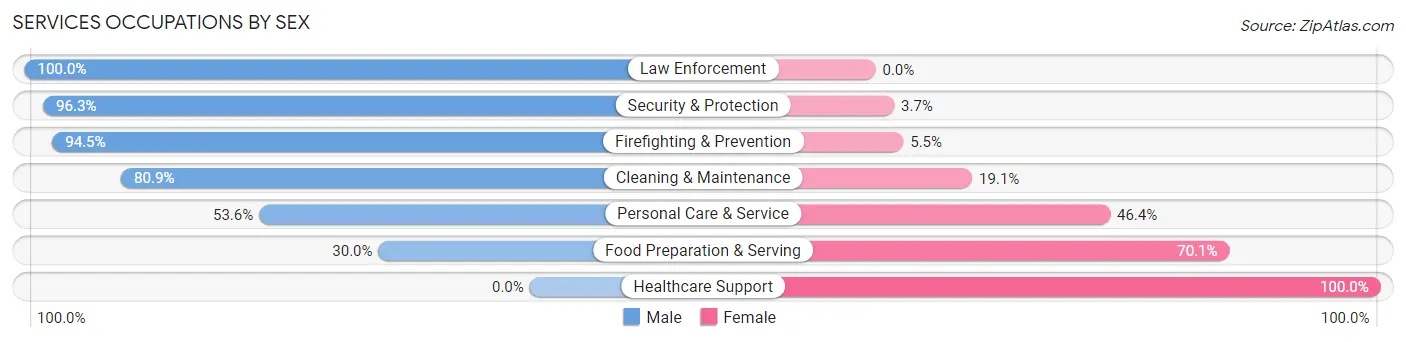
Services Occupations by Sex
Within the Services occupations in Buena Vista, the most male-oriented occupations are Law Enforcement (100.0%), Security & Protection (96.3%), and Firefighting & Prevention (94.5%), while the most female-oriented occupations are Healthcare Support (100.0%), Food Preparation & Serving (70.1%), and Personal Care & Service (46.4%).
| Occupation | Male | Female |
| Healthcare Support | 0 (0.0%) | 10 (100.0%) |
| Security & Protection | 131 (96.3%) | 5 (3.7%) |
| Firefighting & Prevention | 86 (94.5%) | 5 (5.5%) |
| Law Enforcement | 45 (100.0%) | 0 (0.0%) |
| Food Preparation & Serving | 115 (29.9%) | 269 (70.1%) |
| Cleaning & Maintenance | 148 (80.9%) | 35 (19.1%) |
| Personal Care & Service | 210 (53.6%) | 182 (46.4%) |
| Total (Category) | 604 (54.7%) | 501 (45.3%) |
| Total (Overall) | 1,799 (57.7%) | 1,318 (42.3%) |
Sales and Office Occupations
The most common Sales and Office occupations in Buena Vista are Office & Administration (287 | 9.2%), and Sales & Related (211 | 6.8%).
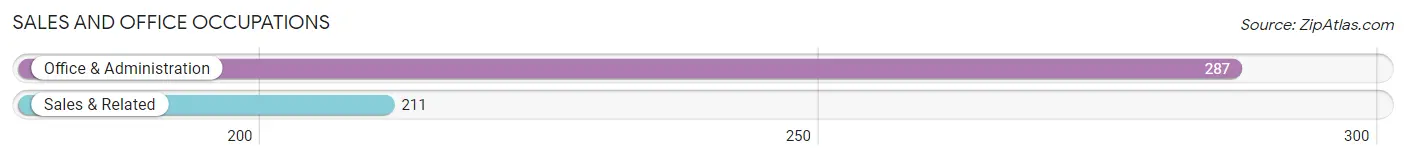
Sales and Office Occupations by Sex

| Occupation | Male | Female |
| Sales & Related | 176 (83.4%) | 35 (16.6%) |
| Office & Administration | 97 (33.8%) | 190 (66.2%) |
| Total (Category) | 273 (54.8%) | 225 (45.2%) |
| Total (Overall) | 1,799 (57.7%) | 1,318 (42.3%) |
Natural Resources, Construction and Maintenance Occupations
The most common Natural Resources, Construction and Maintenance occupations in Buena Vista are Construction & Extraction (171 | 5.5%), Farming, Fishing & Forestry (53 | 1.7%), and Installation, Maintenance & Repair (21 | 0.7%).
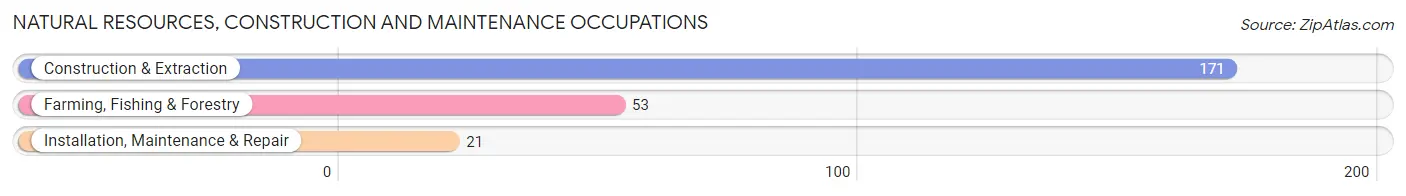
Natural Resources, Construction and Maintenance Occupations by Sex
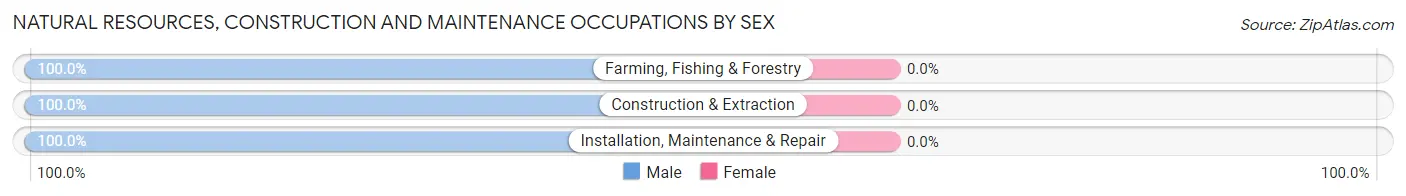
| Occupation | Male | Female |
| Farming, Fishing & Forestry | 53 (100.0%) | 0 (0.0%) |
| Construction & Extraction | 171 (100.0%) | 0 (0.0%) |
| Installation, Maintenance & Repair | 21 (100.0%) | 0 (0.0%) |
| Total (Category) | 245 (100.0%) | 0 (0.0%) |
| Total (Overall) | 1,799 (57.7%) | 1,318 (42.3%) |
Production, Transportation and Moving Occupations
The most common Production, Transportation and Moving occupations in Buena Vista are Production (202 | 6.5%), Material Moving (103 | 3.3%), and Transportation (49 | 1.6%).
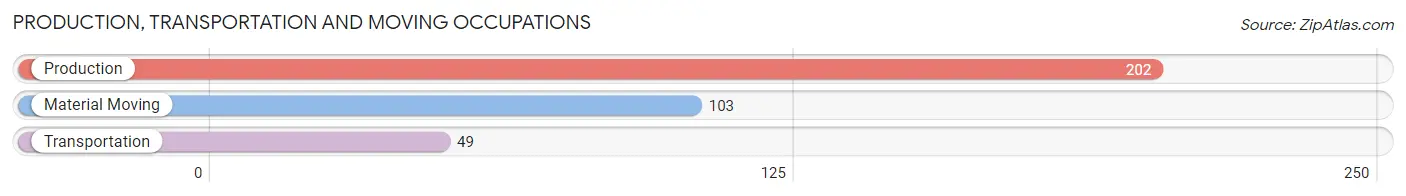
Production, Transportation and Moving Occupations by Sex
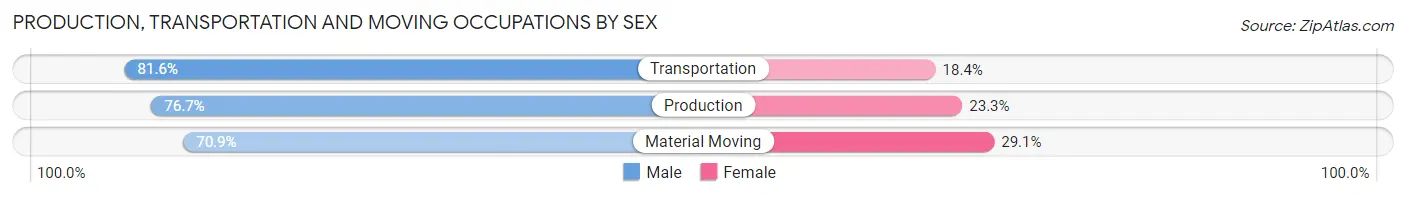
| Occupation | Male | Female |
| Production | 155 (76.7%) | 47 (23.3%) |
| Transportation | 40 (81.6%) | 9 (18.4%) |
| Material Moving | 73 (70.9%) | 30 (29.1%) |
| Total (Category) | 268 (75.7%) | 86 (24.3%) |
| Total (Overall) | 1,799 (57.7%) | 1,318 (42.3%) |
Employment Industries by Sex in Buena Vista
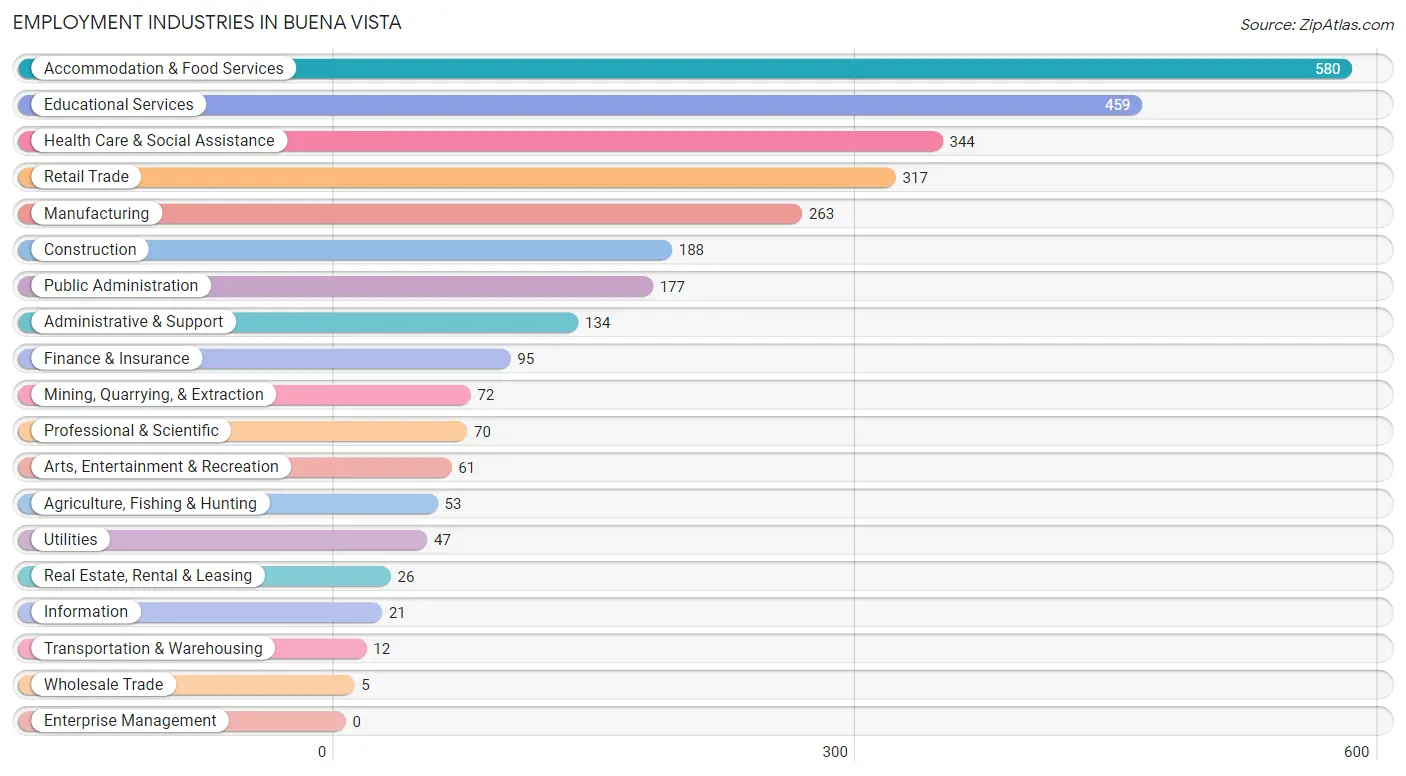
Employment Industries in Buena Vista
The major employment industries in Buena Vista include Accommodation & Food Services (580 | 18.6%), Educational Services (459 | 14.7%), Health Care & Social Assistance (344 | 11.0%), Retail Trade (317 | 10.2%), and Manufacturing (263 | 8.4%).
Employment Industries by Sex in Buena Vista
The Buena Vista industries that see more men than women are Agriculture, Fishing & Hunting (100.0%), Mining, Quarrying, & Extraction (100.0%), and Wholesale Trade (100.0%), whereas the industries that tend to have a higher number of women are Information (100.0%), Health Care & Social Assistance (90.4%), and Professional & Scientific (88.6%).
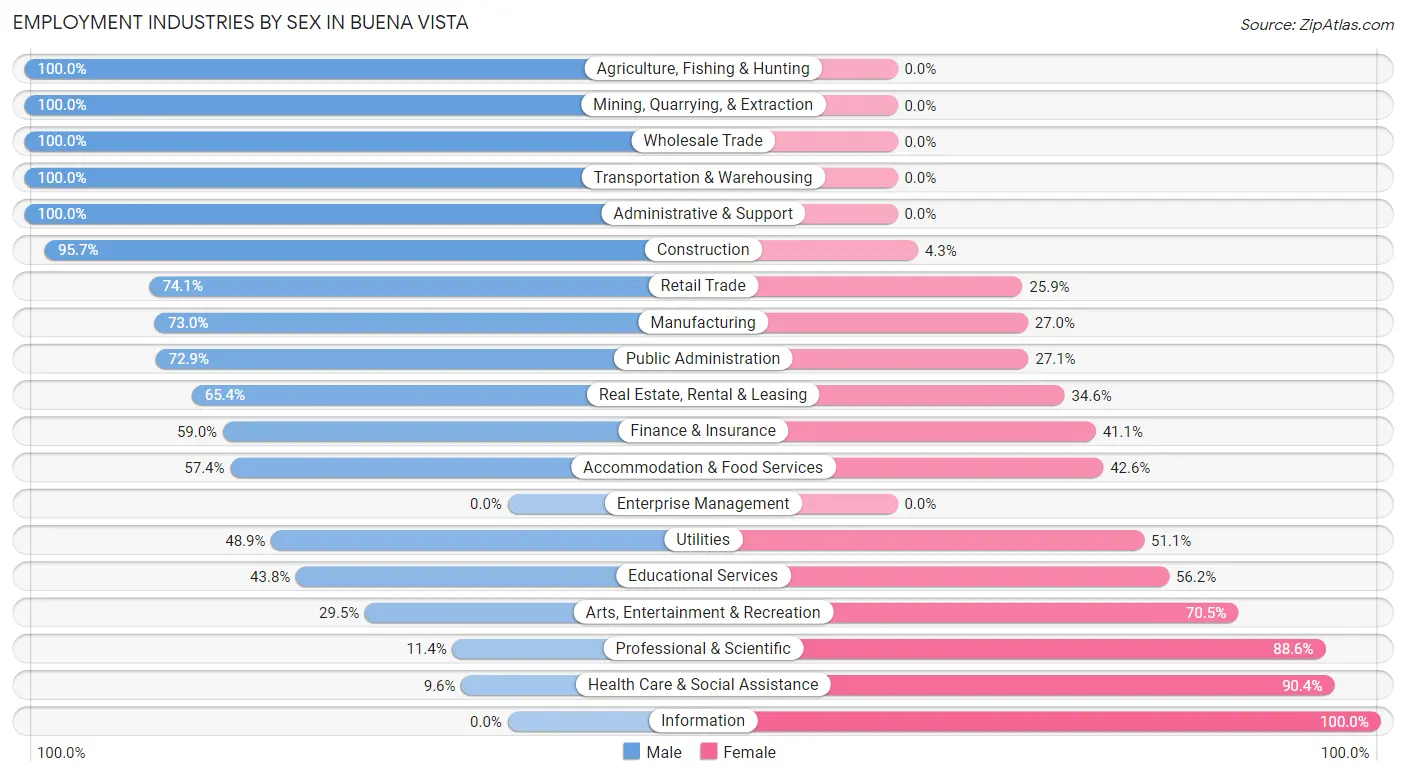
| Industry | Male | Female |
| Agriculture, Fishing & Hunting | 53 (100.0%) | 0 (0.0%) |
| Mining, Quarrying, & Extraction | 72 (100.0%) | 0 (0.0%) |
| Construction | 180 (95.7%) | 8 (4.3%) |
| Manufacturing | 192 (73.0%) | 71 (27.0%) |
| Wholesale Trade | 5 (100.0%) | 0 (0.0%) |
| Retail Trade | 235 (74.1%) | 82 (25.9%) |
| Transportation & Warehousing | 12 (100.0%) | 0 (0.0%) |
| Utilities | 23 (48.9%) | 24 (51.1%) |
| Information | 0 (0.0%) | 21 (100.0%) |
| Finance & Insurance | 56 (59.0%) | 39 (41.0%) |
| Real Estate, Rental & Leasing | 17 (65.4%) | 9 (34.6%) |
| Professional & Scientific | 8 (11.4%) | 62 (88.6%) |
| Enterprise Management | 0 (0.0%) | 0 (0.0%) |
| Administrative & Support | 134 (100.0%) | 0 (0.0%) |
| Educational Services | 201 (43.8%) | 258 (56.2%) |
| Health Care & Social Assistance | 33 (9.6%) | 311 (90.4%) |
| Arts, Entertainment & Recreation | 18 (29.5%) | 43 (70.5%) |
| Accommodation & Food Services | 333 (57.4%) | 247 (42.6%) |
| Public Administration | 129 (72.9%) | 48 (27.1%) |
| Total | 1,799 (57.7%) | 1,318 (42.3%) |
Education in Buena Vista
School Enrollment in Buena Vista
The most common levels of schooling among the 2,262 students in Buena Vista are college / undergraduate (1,051 | 46.5%), middle school (361 | 16.0%), and high school (356 | 15.7%).
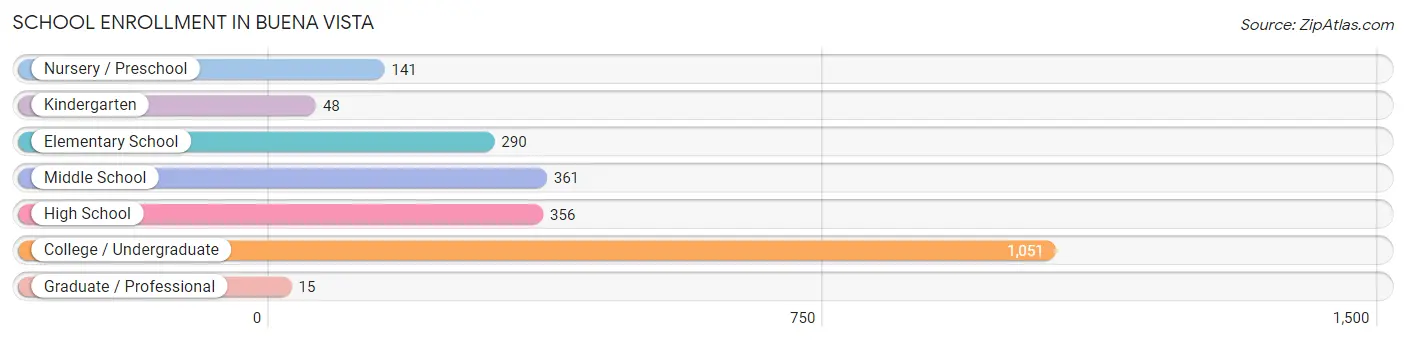
| School Level | # Students | % Students |
| Nursery / Preschool | 141 | 6.2% |
| Kindergarten | 48 | 2.1% |
| Elementary School | 290 | 12.8% |
| Middle School | 361 | 16.0% |
| High School | 356 | 15.7% |
| College / Undergraduate | 1,051 | 46.5% |
| Graduate / Professional | 15 | 0.7% |
| Total | 2,262 | 100.0% |
School Enrollment by Age by Funding Source in Buena Vista
Out of a total of 2,262 students who are enrolled in schools in Buena Vista, 1,027 (45.4%) attend a private institution, while the remaining 1,235 (54.6%) are enrolled in public schools. The age group of 20 to 24 year olds has the highest likelihood of being enrolled in private schools, with 458 (83.9% in the age bracket) enrolled. Conversely, the age group of 10 to 14 year olds has the lowest likelihood of being enrolled in a private school, with 455 (98.3% in the age bracket) attending a public institution.
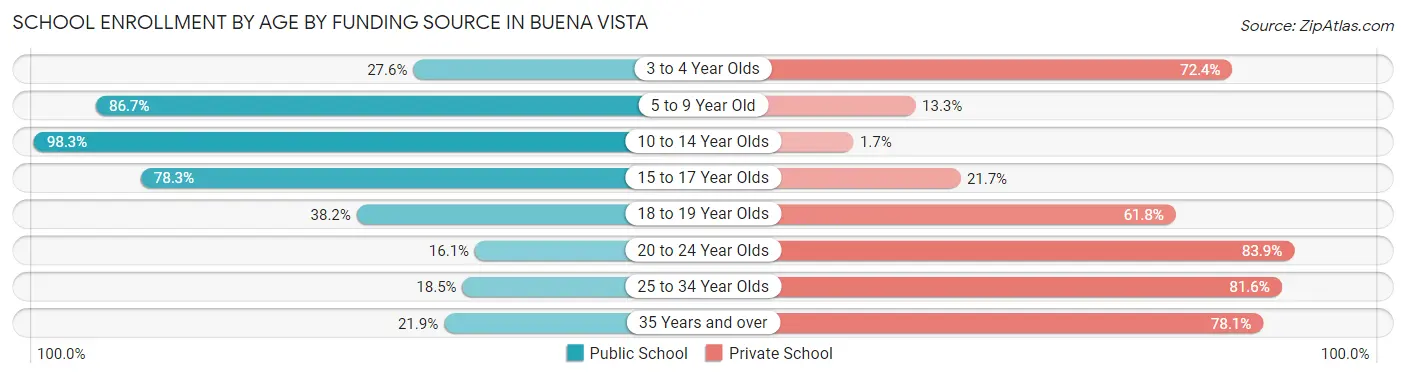
| Age Bracket | Public School | Private School |
| 3 to 4 Year Olds | 37 (27.6%) | 97 (72.4%) |
| 5 to 9 Year Old | 254 (86.7%) | 39 (13.3%) |
| 10 to 14 Year Olds | 455 (98.3%) | 8 (1.7%) |
| 15 to 17 Year Olds | 217 (78.3%) | 60 (21.7%) |
| 18 to 19 Year Olds | 158 (38.2%) | 256 (61.8%) |
| 20 to 24 Year Olds | 88 (16.1%) | 458 (83.9%) |
| 25 to 34 Year Olds | 19 (18.4%) | 84 (81.6%) |
| 35 Years and over | 7 (21.9%) | 25 (78.1%) |
| Total | 1,235 (54.6%) | 1,027 (45.4%) |
Educational Attainment by Field of Study in Buena Vista
Bio, nature & agricultural (169 | 18.4%), education (126 | 13.7%), arts & humanities (106 | 11.6%), liberal arts & history (97 | 10.6%), and social sciences (74 | 8.1%) are the most common fields of study among 918 individuals in Buena Vista who have obtained a bachelor's degree or higher.
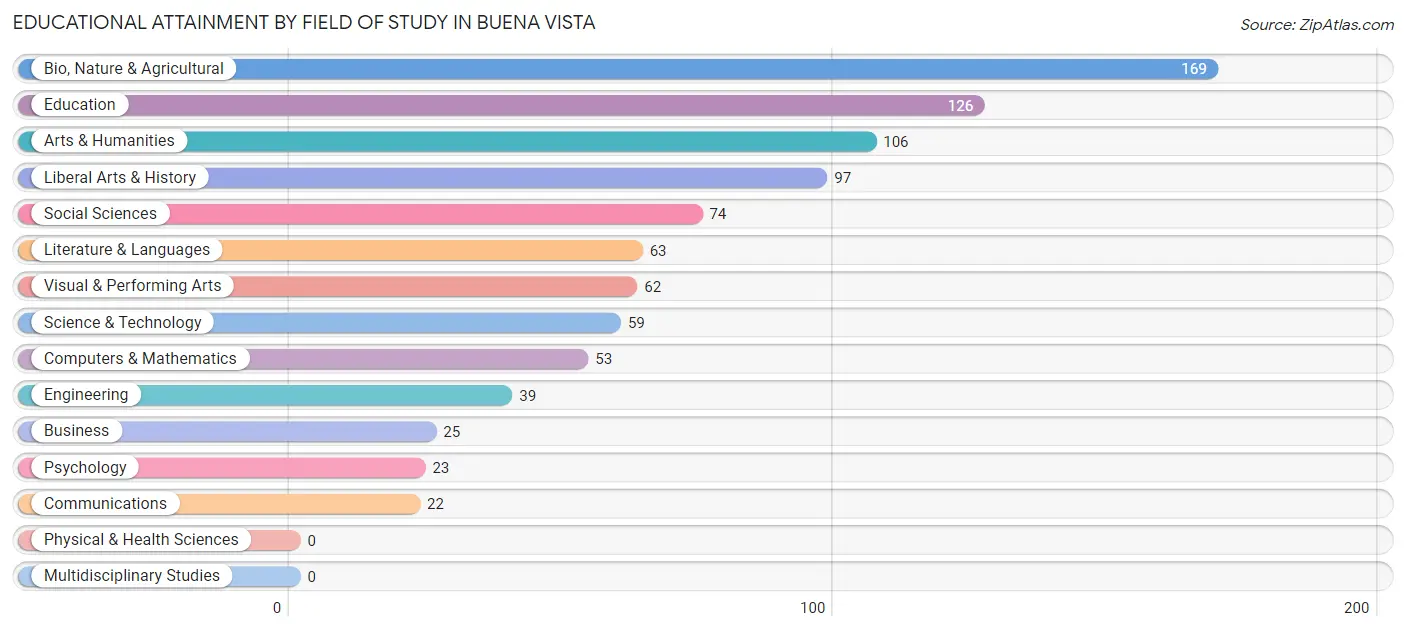
| Field of Study | # Graduates | % Graduates |
| Computers & Mathematics | 53 | 5.8% |
| Bio, Nature & Agricultural | 169 | 18.4% |
| Physical & Health Sciences | 0 | 0.0% |
| Psychology | 23 | 2.5% |
| Social Sciences | 74 | 8.1% |
| Engineering | 39 | 4.3% |
| Multidisciplinary Studies | 0 | 0.0% |
| Science & Technology | 59 | 6.4% |
| Business | 25 | 2.7% |
| Education | 126 | 13.7% |
| Literature & Languages | 63 | 6.9% |
| Liberal Arts & History | 97 | 10.6% |
| Visual & Performing Arts | 62 | 6.8% |
| Communications | 22 | 2.4% |
| Arts & Humanities | 106 | 11.6% |
| Total | 918 | 100.0% |
Transportation & Commute in Buena Vista
Vehicle Availability by Sex in Buena Vista
The most prevalent vehicle ownership categories in Buena Vista are males with 2 vehicles (881, accounting for 50.3%) and females with 2 vehicles (291, making up 76.5%).
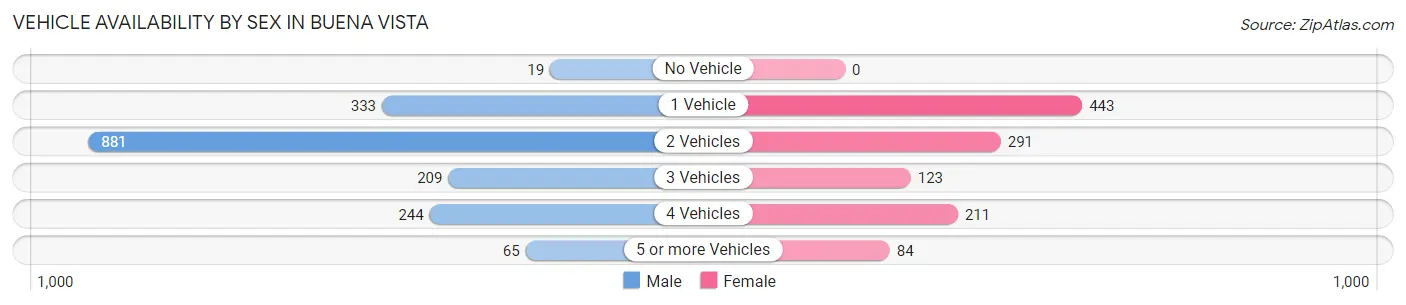
| Vehicles Available | Male | Female |
| No Vehicle | 19 (1.1%) | 0 (0.0%) |
| 1 Vehicle | 333 (19.0%) | 443 (38.5%) |
| 2 Vehicles | 881 (50.3%) | 291 (25.3%) |
| 3 Vehicles | 209 (11.9%) | 123 (10.7%) |
| 4 Vehicles | 244 (13.9%) | 211 (18.3%) |
| 5 or more Vehicles | 65 (3.7%) | 84 (7.3%) |
| Total | 1,751 (100.0%) | 1,152 (100.0%) |
Commute Time in Buena Vista
The most frequently occuring commute durations in Buena Vista are 15 to 19 minutes (763 commuters, 25.9%), 5 to 9 minutes (631 commuters, 21.4%), and 10 to 14 minutes (576 commuters, 19.6%).
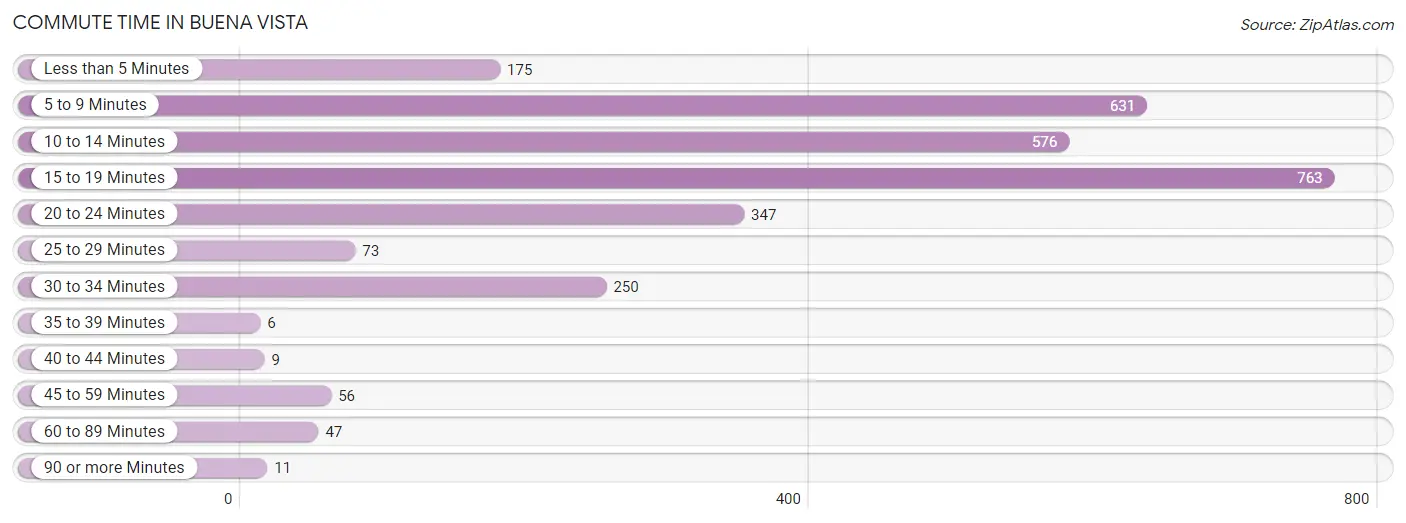
| Commute Time | # Commuters | % Commuters |
| Less than 5 Minutes | 175 | 5.9% |
| 5 to 9 Minutes | 631 | 21.4% |
| 10 to 14 Minutes | 576 | 19.6% |
| 15 to 19 Minutes | 763 | 25.9% |
| 20 to 24 Minutes | 347 | 11.8% |
| 25 to 29 Minutes | 73 | 2.5% |
| 30 to 34 Minutes | 250 | 8.5% |
| 35 to 39 Minutes | 6 | 0.2% |
| 40 to 44 Minutes | 9 | 0.3% |
| 45 to 59 Minutes | 56 | 1.9% |
| 60 to 89 Minutes | 47 | 1.6% |
| 90 or more Minutes | 11 | 0.4% |
Commute Time by Sex in Buena Vista
The most common commute times in Buena Vista are 15 to 19 minutes (440 commuters, 25.1%) for males and 15 to 19 minutes (323 commuters, 27.2%) for females.
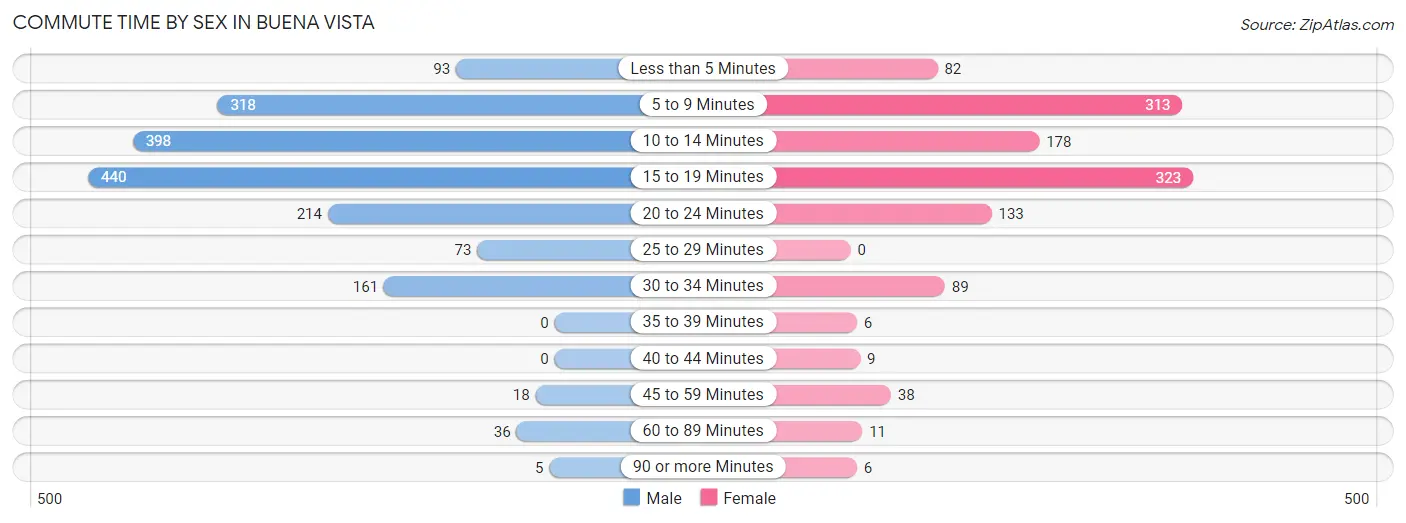
| Commute Time | Male | Female |
| Less than 5 Minutes | 93 (5.3%) | 82 (6.9%) |
| 5 to 9 Minutes | 318 (18.1%) | 313 (26.4%) |
| 10 to 14 Minutes | 398 (22.7%) | 178 (15.0%) |
| 15 to 19 Minutes | 440 (25.1%) | 323 (27.2%) |
| 20 to 24 Minutes | 214 (12.2%) | 133 (11.2%) |
| 25 to 29 Minutes | 73 (4.2%) | 0 (0.0%) |
| 30 to 34 Minutes | 161 (9.2%) | 89 (7.5%) |
| 35 to 39 Minutes | 0 (0.0%) | 6 (0.5%) |
| 40 to 44 Minutes | 0 (0.0%) | 9 (0.8%) |
| 45 to 59 Minutes | 18 (1.0%) | 38 (3.2%) |
| 60 to 89 Minutes | 36 (2.1%) | 11 (0.9%) |
| 90 or more Minutes | 5 (0.3%) | 6 (0.5%) |
Time of Departure to Work by Sex in Buena Vista
The most frequent times of departure to work in Buena Vista are 4:00 PM to 11:59 PM (476, 27.1%) for males and 7:30 AM to 7:59 AM (232, 19.5%) for females.
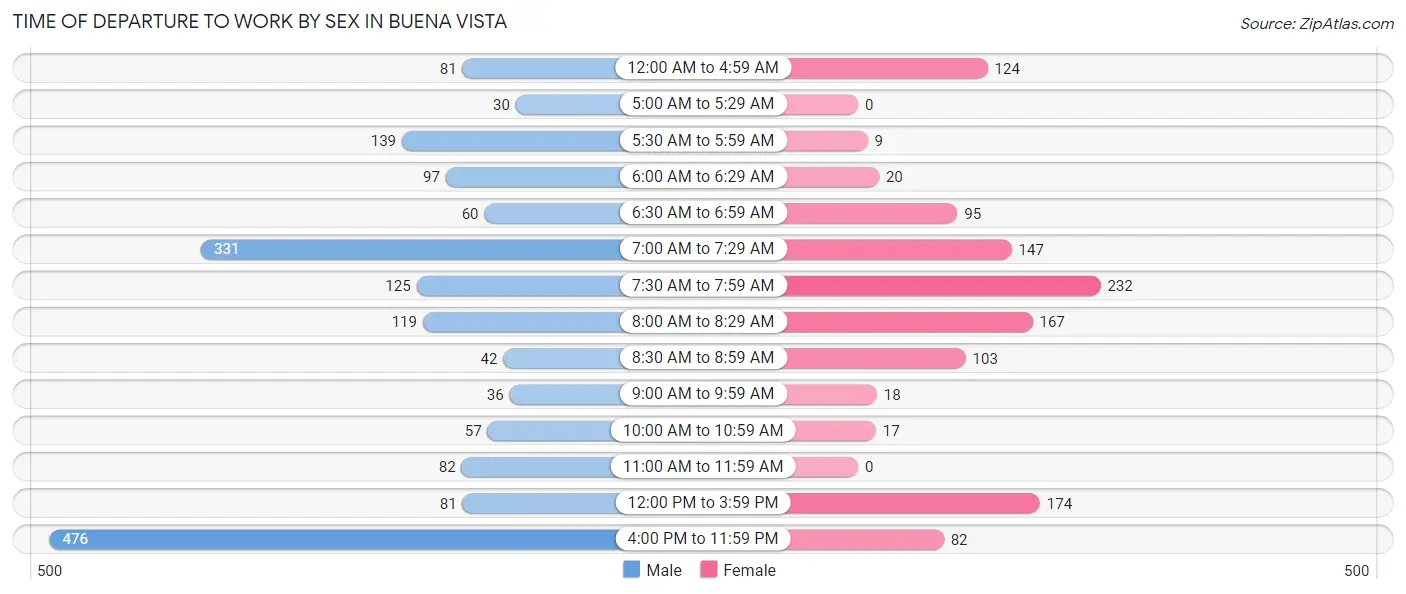
| Time of Departure | Male | Female |
| 12:00 AM to 4:59 AM | 81 (4.6%) | 124 (10.4%) |
| 5:00 AM to 5:29 AM | 30 (1.7%) | 0 (0.0%) |
| 5:30 AM to 5:59 AM | 139 (7.9%) | 9 (0.8%) |
| 6:00 AM to 6:29 AM | 97 (5.5%) | 20 (1.7%) |
| 6:30 AM to 6:59 AM | 60 (3.4%) | 95 (8.0%) |
| 7:00 AM to 7:29 AM | 331 (18.9%) | 147 (12.4%) |
| 7:30 AM to 7:59 AM | 125 (7.1%) | 232 (19.5%) |
| 8:00 AM to 8:29 AM | 119 (6.8%) | 167 (14.1%) |
| 8:30 AM to 8:59 AM | 42 (2.4%) | 103 (8.7%) |
| 9:00 AM to 9:59 AM | 36 (2.1%) | 18 (1.5%) |
| 10:00 AM to 10:59 AM | 57 (3.3%) | 17 (1.4%) |
| 11:00 AM to 11:59 AM | 82 (4.7%) | 0 (0.0%) |
| 12:00 PM to 3:59 PM | 81 (4.6%) | 174 (14.6%) |
| 4:00 PM to 11:59 PM | 476 (27.1%) | 82 (6.9%) |
| Total | 1,756 (100.0%) | 1,188 (100.0%) |
Housing Occupancy in Buena Vista
Occupancy by Ownership in Buena Vista
Of the total 2,655 dwellings in Buena Vista, owner-occupied units account for 1,533 (57.7%), while renter-occupied units make up 1,122 (42.3%).
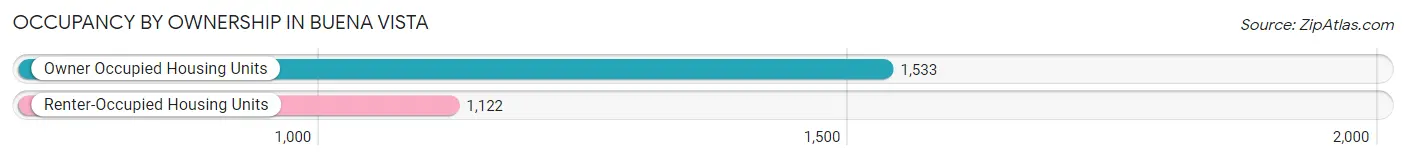
| Occupancy | # Housing Units | % Housing Units |
| Owner Occupied Housing Units | 1,533 | 57.7% |
| Renter-Occupied Housing Units | 1,122 | 42.3% |
| Total Occupied Housing Units | 2,655 | 100.0% |
Occupancy by Household Size in Buena Vista
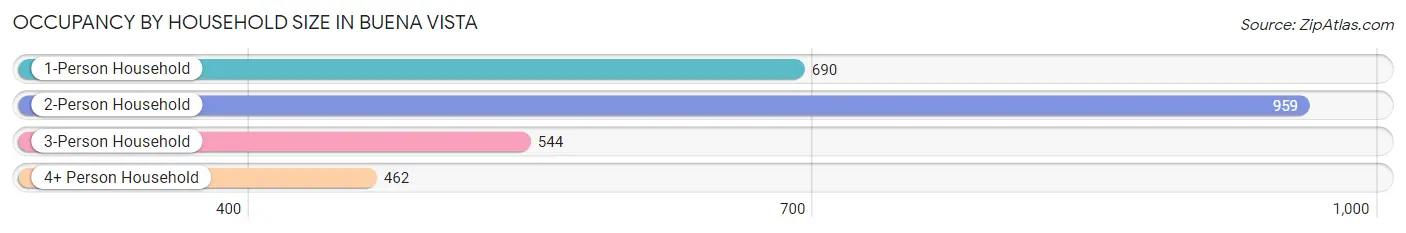
| Household Size | # Housing Units | % Housing Units |
| 1-Person Household | 690 | 26.0% |
| 2-Person Household | 959 | 36.1% |
| 3-Person Household | 544 | 20.5% |
| 4+ Person Household | 462 | 17.4% |
| Total Housing Units | 2,655 | 100.0% |
Occupancy by Ownership by Household Size in Buena Vista
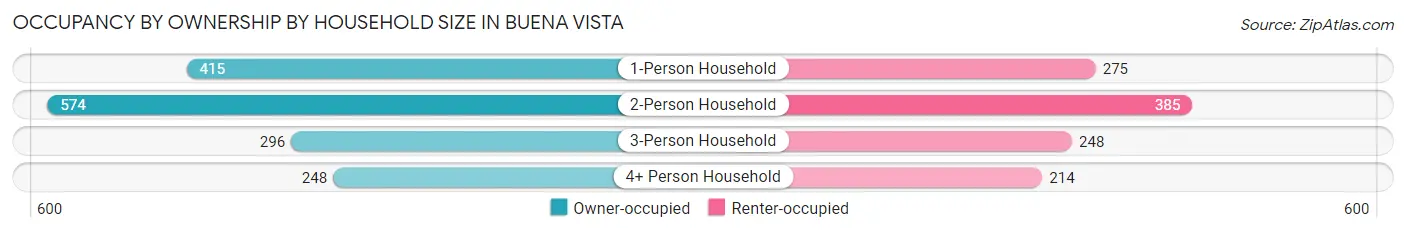
| Household Size | Owner-occupied | Renter-occupied |
| 1-Person Household | 415 (60.1%) | 275 (39.9%) |
| 2-Person Household | 574 (59.9%) | 385 (40.2%) |
| 3-Person Household | 296 (54.4%) | 248 (45.6%) |
| 4+ Person Household | 248 (53.7%) | 214 (46.3%) |
| Total Housing Units | 1,533 (57.7%) | 1,122 (42.3%) |
Occupancy by Educational Attainment in Buena Vista
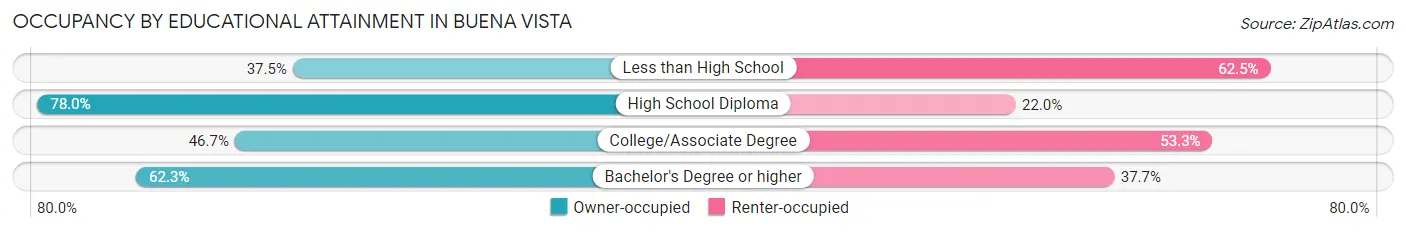
| Household Size | Owner-occupied | Renter-occupied |
| Less than High School | 151 (37.5%) | 252 (62.5%) |
| High School Diploma | 595 (78.0%) | 168 (22.0%) |
| College/Associate Degree | 420 (46.7%) | 480 (53.3%) |
| Bachelor's Degree or higher | 367 (62.3%) | 222 (37.7%) |
Occupancy by Age of Householder in Buena Vista
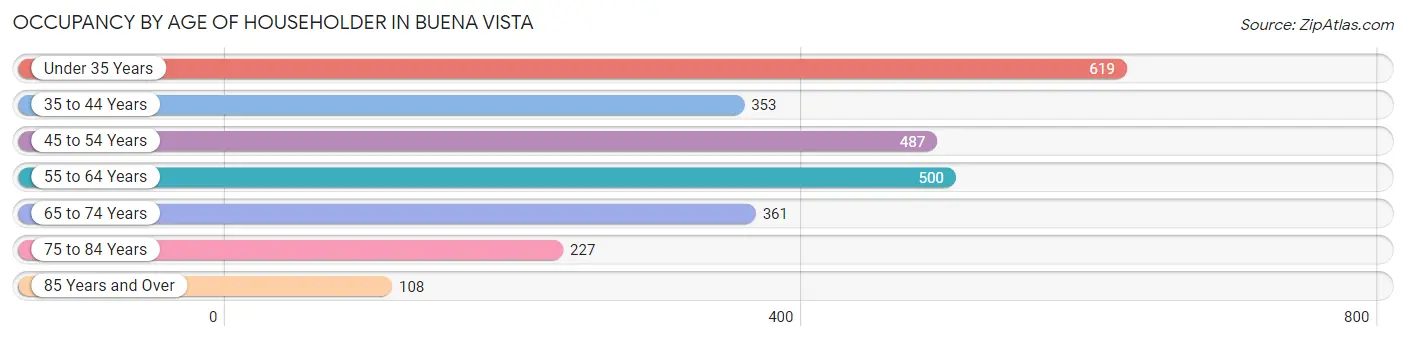
| Age Bracket | # Households | % Households |
| Under 35 Years | 619 | 23.3% |
| 35 to 44 Years | 353 | 13.3% |
| 45 to 54 Years | 487 | 18.3% |
| 55 to 64 Years | 500 | 18.8% |
| 65 to 74 Years | 361 | 13.6% |
| 75 to 84 Years | 227 | 8.6% |
| 85 Years and Over | 108 | 4.1% |
| Total | 2,655 | 100.0% |
Housing Finances in Buena Vista
Median Income by Occupancy in Buena Vista
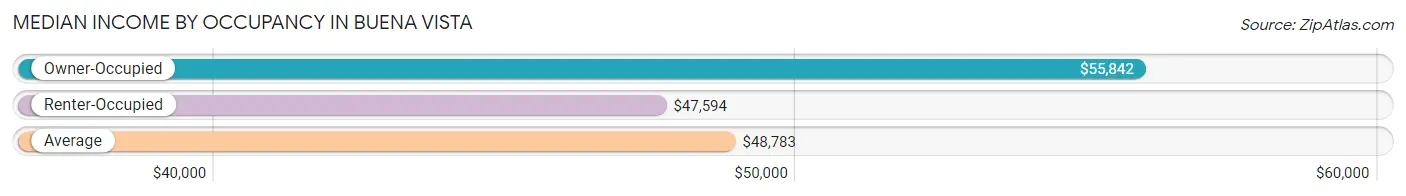
| Occupancy Type | # Households | Median Income |
| Owner-Occupied | 1,533 (57.7%) | $55,842 |
| Renter-Occupied | 1,122 (42.3%) | $47,594 |
| Average | 2,655 (100.0%) | $48,783 |
Occupancy by Householder Income Bracket in Buena Vista
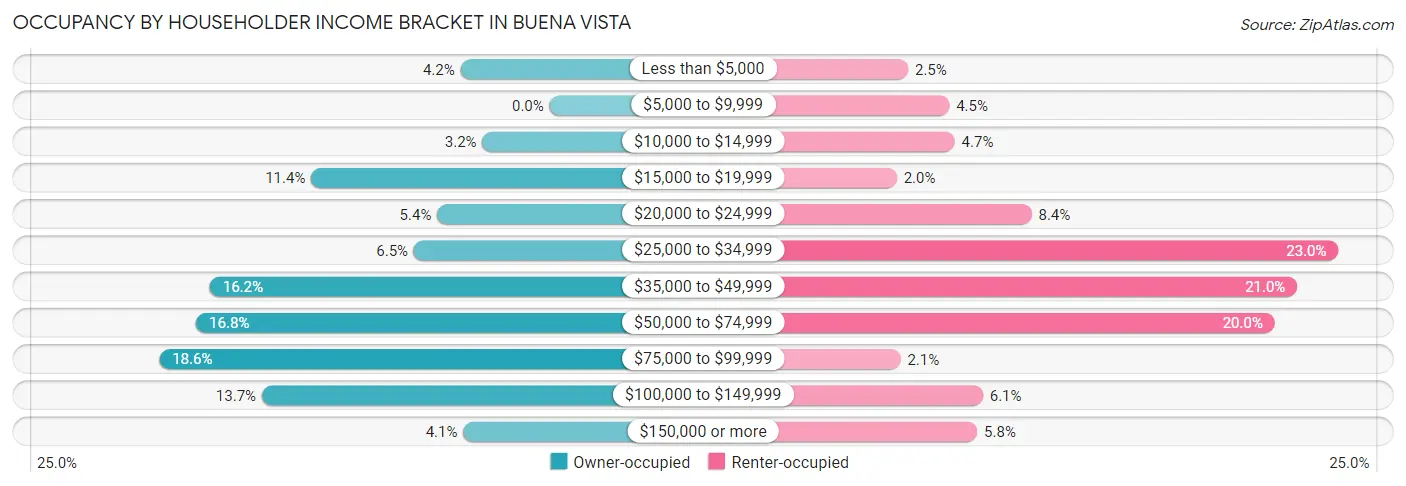
| Income Bracket | Owner-occupied | Renter-occupied |
| Less than $5,000 | 65 (4.2%) | 28 (2.5%) |
| $5,000 to $9,999 | 0 (0.0%) | 50 (4.5%) |
| $10,000 to $14,999 | 49 (3.2%) | 53 (4.7%) |
| $15,000 to $19,999 | 174 (11.4%) | 22 (2.0%) |
| $20,000 to $24,999 | 82 (5.3%) | 94 (8.4%) |
| $25,000 to $34,999 | 99 (6.5%) | 258 (23.0%) |
| $35,000 to $49,999 | 248 (16.2%) | 236 (21.0%) |
| $50,000 to $74,999 | 258 (16.8%) | 224 (20.0%) |
| $75,000 to $99,999 | 285 (18.6%) | 24 (2.1%) |
| $100,000 to $149,999 | 210 (13.7%) | 68 (6.1%) |
| $150,000 or more | 63 (4.1%) | 65 (5.8%) |
| Total | 1,533 (100.0%) | 1,122 (100.0%) |
Monthly Housing Cost Tiers in Buena Vista
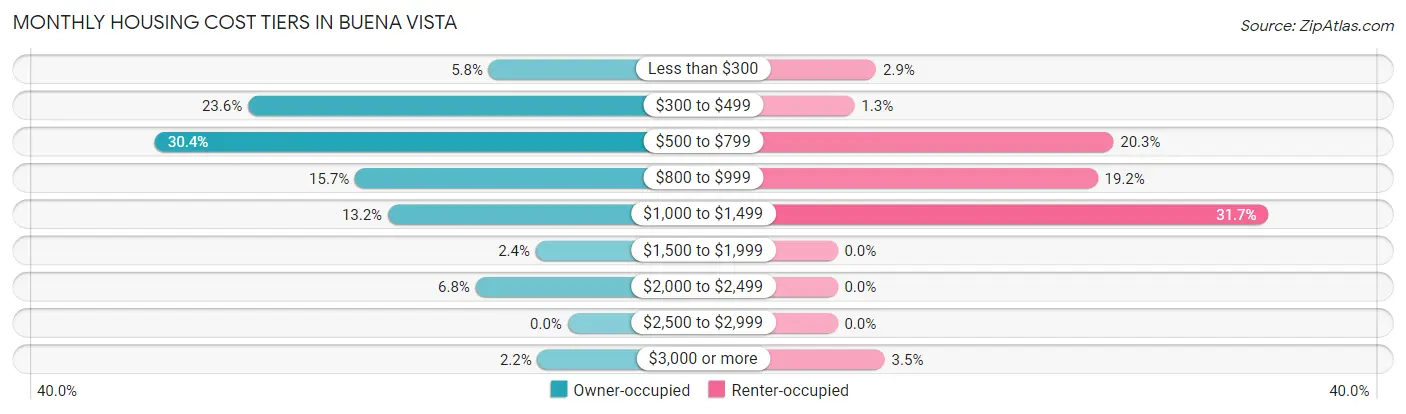
| Monthly Cost | Owner-occupied | Renter-occupied |
| Less than $300 | 89 (5.8%) | 32 (2.9%) |
| $300 to $499 | 361 (23.5%) | 14 (1.3%) |
| $500 to $799 | 466 (30.4%) | 228 (20.3%) |
| $800 to $999 | 240 (15.7%) | 215 (19.2%) |
| $1,000 to $1,499 | 203 (13.2%) | 356 (31.7%) |
| $1,500 to $1,999 | 36 (2.4%) | 0 (0.0%) |
| $2,000 to $2,499 | 104 (6.8%) | 0 (0.0%) |
| $2,500 to $2,999 | 0 (0.0%) | 0 (0.0%) |
| $3,000 or more | 34 (2.2%) | 39 (3.5%) |
| Total | 1,533 (100.0%) | 1,122 (100.0%) |
Physical Housing Characteristics in Buena Vista
Housing Structures in Buena Vista
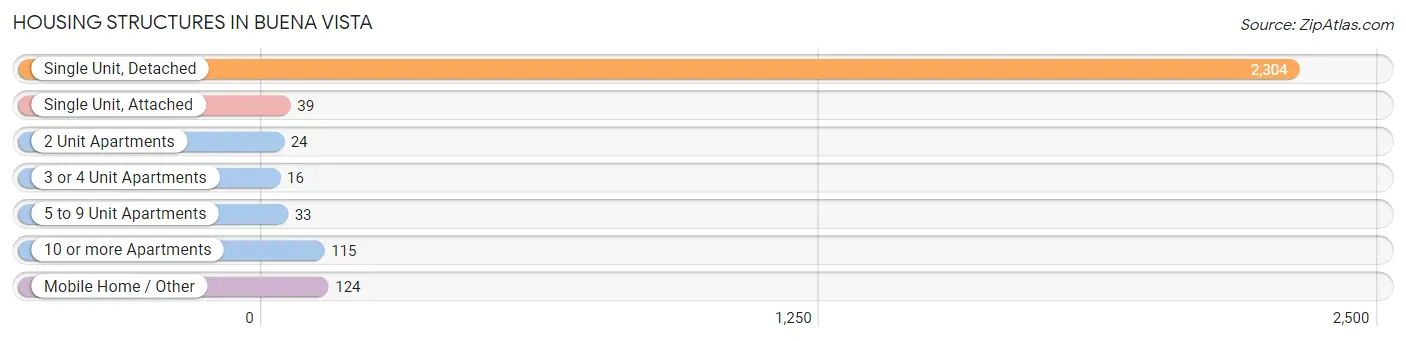
| Structure Type | # Housing Units | % Housing Units |
| Single Unit, Detached | 2,304 | 86.8% |
| Single Unit, Attached | 39 | 1.5% |
| 2 Unit Apartments | 24 | 0.9% |
| 3 or 4 Unit Apartments | 16 | 0.6% |
| 5 to 9 Unit Apartments | 33 | 1.2% |
| 10 or more Apartments | 115 | 4.3% |
| Mobile Home / Other | 124 | 4.7% |
| Total | 2,655 | 100.0% |
Housing Structures by Occupancy in Buena Vista
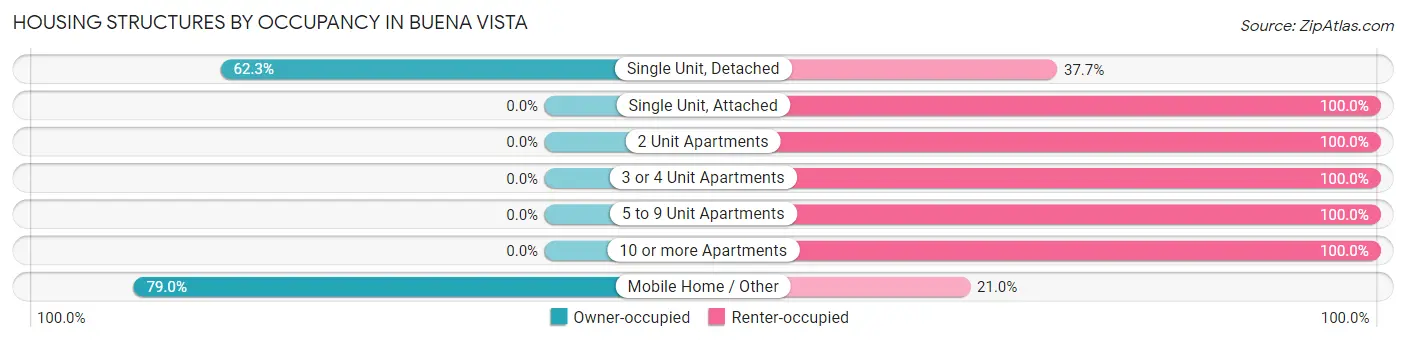
| Structure Type | Owner-occupied | Renter-occupied |
| Single Unit, Detached | 1,435 (62.3%) | 869 (37.7%) |
| Single Unit, Attached | 0 (0.0%) | 39 (100.0%) |
| 2 Unit Apartments | 0 (0.0%) | 24 (100.0%) |
| 3 or 4 Unit Apartments | 0 (0.0%) | 16 (100.0%) |
| 5 to 9 Unit Apartments | 0 (0.0%) | 33 (100.0%) |
| 10 or more Apartments | 0 (0.0%) | 115 (100.0%) |
| Mobile Home / Other | 98 (79.0%) | 26 (21.0%) |
| Total | 1,533 (57.7%) | 1,122 (42.3%) |
Housing Structures by Number of Rooms in Buena Vista
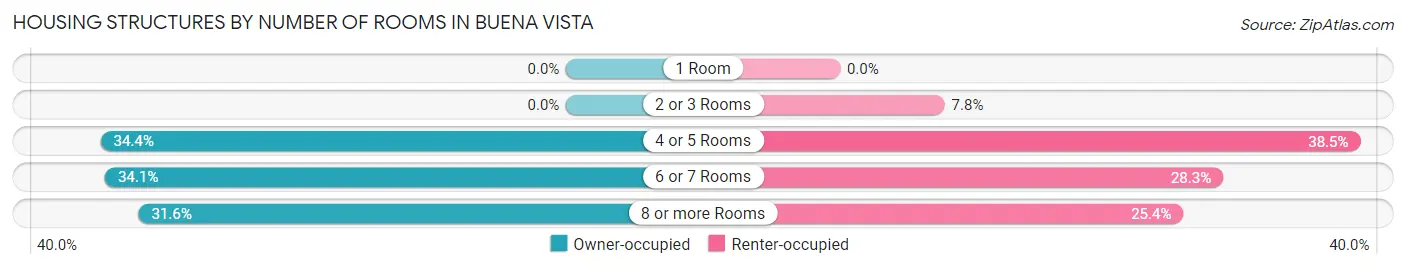
| Number of Rooms | Owner-occupied | Renter-occupied |
| 1 Room | 0 (0.0%) | 0 (0.0%) |
| 2 or 3 Rooms | 0 (0.0%) | 87 (7.7%) |
| 4 or 5 Rooms | 527 (34.4%) | 432 (38.5%) |
| 6 or 7 Rooms | 522 (34.1%) | 318 (28.3%) |
| 8 or more Rooms | 484 (31.6%) | 285 (25.4%) |
| Total | 1,533 (100.0%) | 1,122 (100.0%) |
Housing Structure by Heating Type in Buena Vista
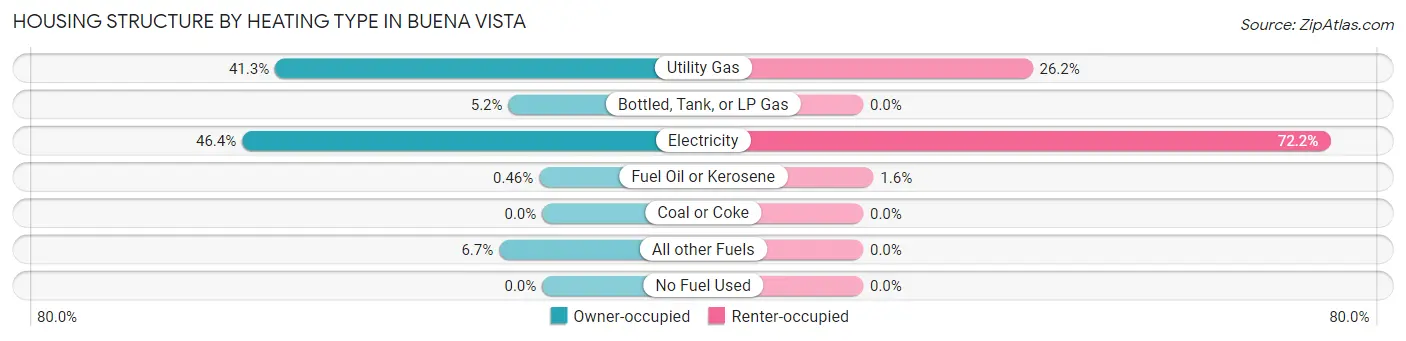
| Heating Type | Owner-occupied | Renter-occupied |
| Utility Gas | 633 (41.3%) | 294 (26.2%) |
| Bottled, Tank, or LP Gas | 80 (5.2%) | 0 (0.0%) |
| Electricity | 711 (46.4%) | 810 (72.2%) |
| Fuel Oil or Kerosene | 7 (0.5%) | 18 (1.6%) |
| Coal or Coke | 0 (0.0%) | 0 (0.0%) |
| All other Fuels | 102 (6.7%) | 0 (0.0%) |
| No Fuel Used | 0 (0.0%) | 0 (0.0%) |
| Total | 1,533 (100.0%) | 1,122 (100.0%) |
Household Vehicle Usage in Buena Vista
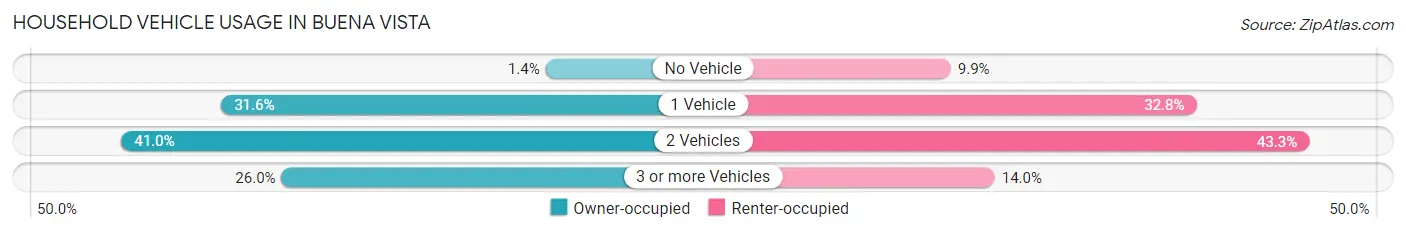
| Vehicles per Household | Owner-occupied | Renter-occupied |
| No Vehicle | 21 (1.4%) | 111 (9.9%) |
| 1 Vehicle | 485 (31.6%) | 368 (32.8%) |
| 2 Vehicles | 628 (41.0%) | 486 (43.3%) |
| 3 or more Vehicles | 399 (26.0%) | 157 (14.0%) |
| Total | 1,533 (100.0%) | 1,122 (100.0%) |
Real Estate & Mortgages in Buena Vista
Real Estate and Mortgage Overview in Buena Vista
| Characteristic | Without Mortgage | With Mortgage |
| Housing Units | 695 | 838 |
| Median Property Value | $133,000 | $163,700 |
| Median Household Income | $36,671 | $29 |
| Monthly Housing Costs | $438 | $34 |
| Real Estate Taxes | $1,533 | $21 |
Property Value by Mortgage Status in Buena Vista
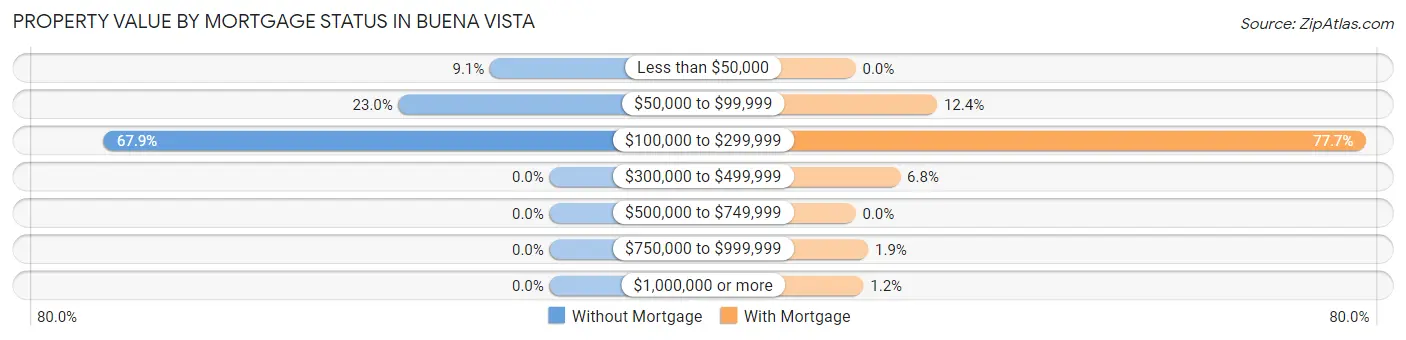
| Property Value | Without Mortgage | With Mortgage |
| Less than $50,000 | 63 (9.1%) | 0 (0.0%) |
| $50,000 to $99,999 | 160 (23.0%) | 104 (12.4%) |
| $100,000 to $299,999 | 472 (67.9%) | 651 (77.7%) |
| $300,000 to $499,999 | 0 (0.0%) | 57 (6.8%) |
| $500,000 to $749,999 | 0 (0.0%) | 0 (0.0%) |
| $750,000 to $999,999 | 0 (0.0%) | 16 (1.9%) |
| $1,000,000 or more | 0 (0.0%) | 10 (1.2%) |
| Total | 695 (100.0%) | 838 (100.0%) |
Household Income by Mortgage Status in Buena Vista
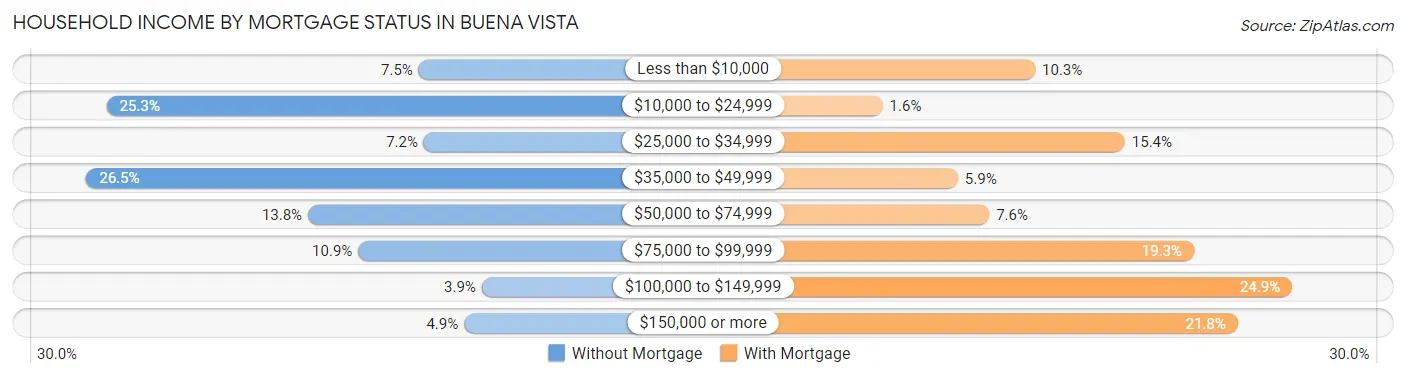
| Household Income | Without Mortgage | With Mortgage |
| Less than $10,000 | 52 (7.5%) | 86 (10.3%) |
| $10,000 to $24,999 | 176 (25.3%) | 13 (1.5%) |
| $25,000 to $34,999 | 50 (7.2%) | 129 (15.4%) |
| $35,000 to $49,999 | 184 (26.5%) | 49 (5.9%) |
| $50,000 to $74,999 | 96 (13.8%) | 64 (7.6%) |
| $75,000 to $99,999 | 76 (10.9%) | 162 (19.3%) |
| $100,000 to $149,999 | 27 (3.9%) | 209 (24.9%) |
| $150,000 or more | 34 (4.9%) | 183 (21.8%) |
| Total | 695 (100.0%) | 838 (100.0%) |
Property Value to Household Income Ratio in Buena Vista
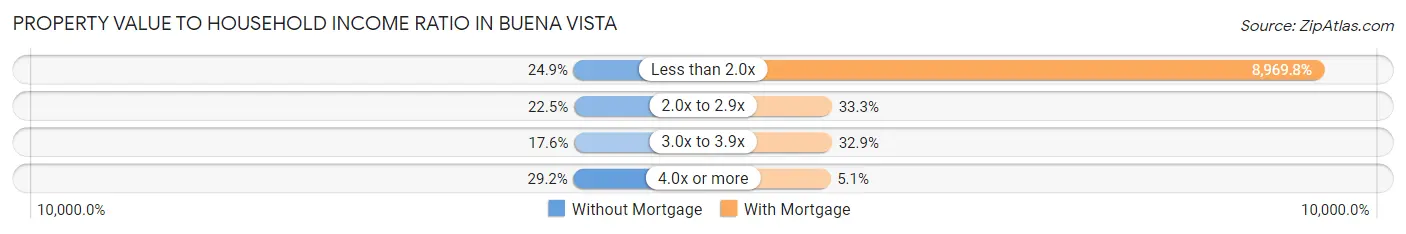
| Value-to-Income Ratio | Without Mortgage | With Mortgage |
| Less than 2.0x | 173 (24.9%) | 75,167 (8,969.8%) |
| 2.0x to 2.9x | 156 (22.5%) | 279 (33.3%) |
| 3.0x to 3.9x | 122 (17.5%) | 276 (32.9%) |
| 4.0x or more | 203 (29.2%) | 43 (5.1%) |
| Total | 695 (100.0%) | 838 (100.0%) |
Real Estate Taxes by Mortgage Status in Buena Vista
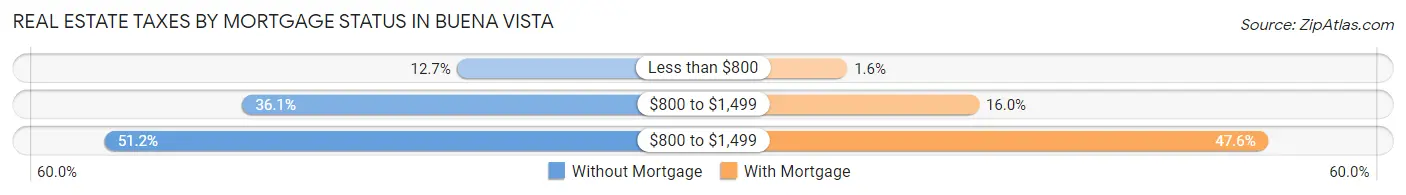
| Property Taxes | Without Mortgage | With Mortgage |
| Less than $800 | 88 (12.7%) | 13 (1.5%) |
| $800 to $1,499 | 251 (36.1%) | 134 (16.0%) |
| $800 to $1,499 | 356 (51.2%) | 399 (47.6%) |
| Total | 695 (100.0%) | 838 (100.0%) |
Health & Disability in Buena Vista
Health Insurance Coverage by Age in Buena Vista
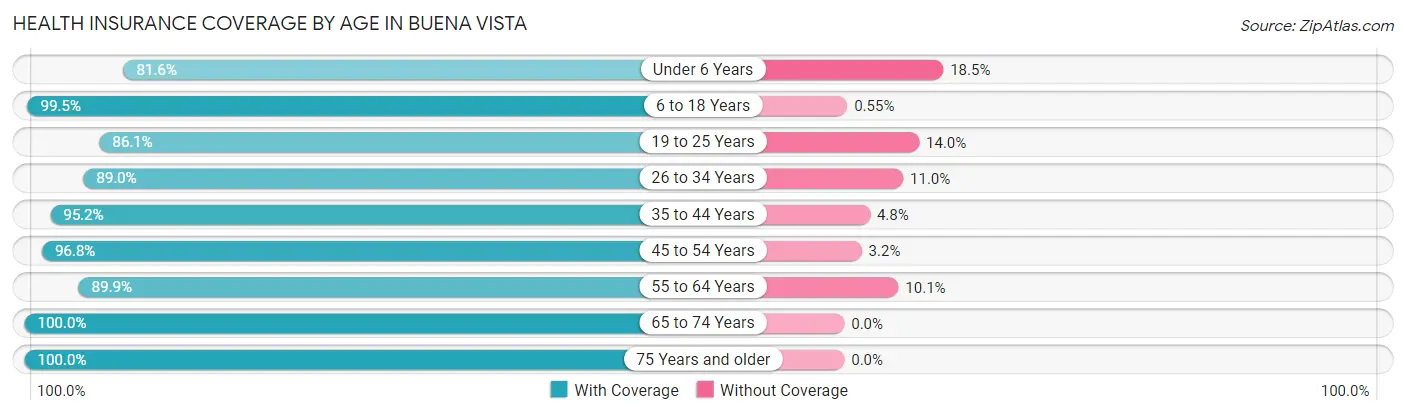
| Age Bracket | With Coverage | Without Coverage |
| Under 6 Years | 305 (81.6%) | 69 (18.4%) |
| 6 to 18 Years | 1,274 (99.5%) | 7 (0.5%) |
| 19 to 25 Years | 944 (86.1%) | 153 (14.0%) |
| 26 to 34 Years | 495 (89.0%) | 61 (11.0%) |
| 35 to 44 Years | 616 (95.2%) | 31 (4.8%) |
| 45 to 54 Years | 717 (96.8%) | 24 (3.2%) |
| 55 to 64 Years | 677 (89.9%) | 76 (10.1%) |
| 65 to 74 Years | 625 (100.0%) | 0 (0.0%) |
| 75 Years and older | 478 (100.0%) | 0 (0.0%) |
| Total | 6,131 (93.6%) | 421 (6.4%) |
Health Insurance Coverage by Citizenship Status in Buena Vista
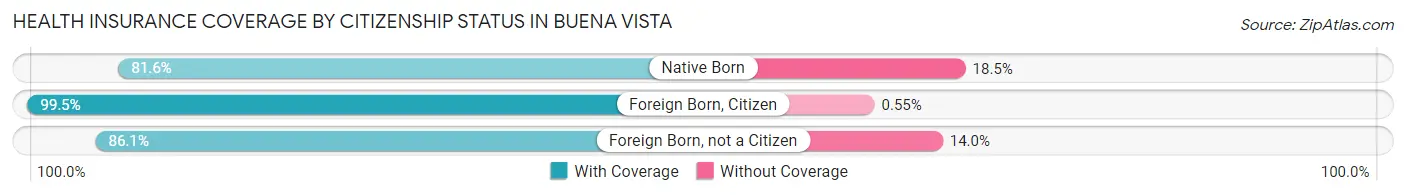
| Citizenship Status | With Coverage | Without Coverage |
| Native Born | 305 (81.6%) | 69 (18.4%) |
| Foreign Born, Citizen | 1,274 (99.5%) | 7 (0.5%) |
| Foreign Born, not a Citizen | 944 (86.1%) | 153 (14.0%) |
Health Insurance Coverage by Household Income in Buena Vista
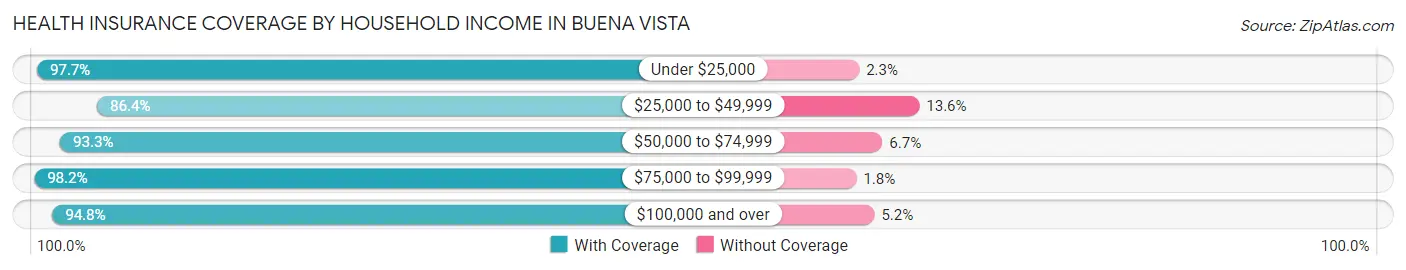
| Household Income | With Coverage | Without Coverage |
| Under $25,000 | 968 (97.7%) | 23 (2.3%) |
| $25,000 to $49,999 | 1,391 (86.4%) | 219 (13.6%) |
| $50,000 to $74,999 | 1,231 (93.3%) | 88 (6.7%) |
| $75,000 to $99,999 | 815 (98.2%) | 15 (1.8%) |
| $100,000 and over | 1,261 (94.8%) | 69 (5.2%) |
Public vs Private Health Insurance Coverage by Age in Buena Vista
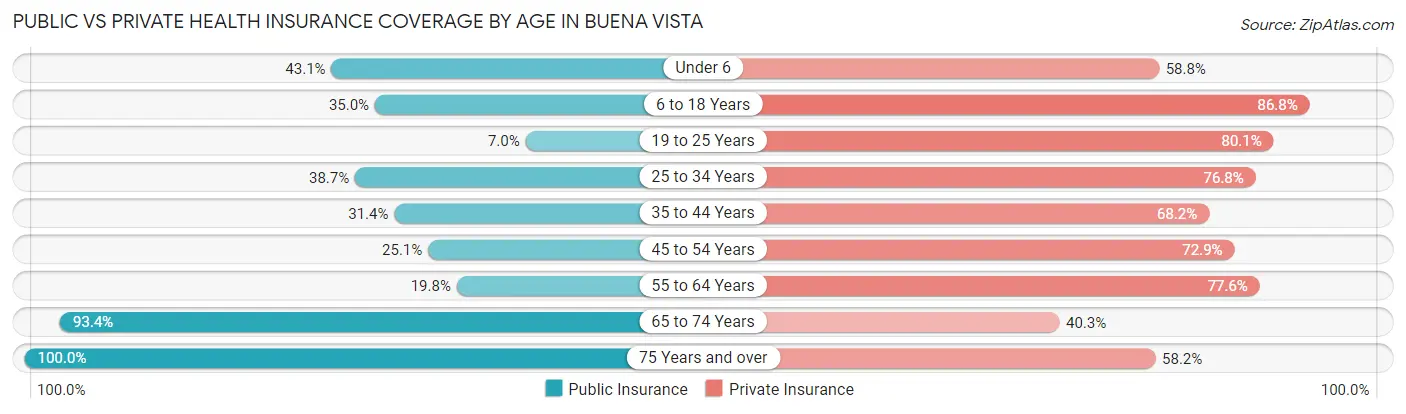
| Age Bracket | Public Insurance | Private Insurance |
| Under 6 | 161 (43.0%) | 220 (58.8%) |
| 6 to 18 Years | 448 (35.0%) | 1,112 (86.8%) |
| 19 to 25 Years | 77 (7.0%) | 879 (80.1%) |
| 25 to 34 Years | 215 (38.7%) | 427 (76.8%) |
| 35 to 44 Years | 203 (31.4%) | 441 (68.2%) |
| 45 to 54 Years | 186 (25.1%) | 540 (72.9%) |
| 55 to 64 Years | 149 (19.8%) | 584 (77.6%) |
| 65 to 74 Years | 584 (93.4%) | 252 (40.3%) |
| 75 Years and over | 478 (100.0%) | 278 (58.2%) |
| Total | 2,501 (38.2%) | 4,733 (72.2%) |
Disability Status by Sex by Age in Buena Vista
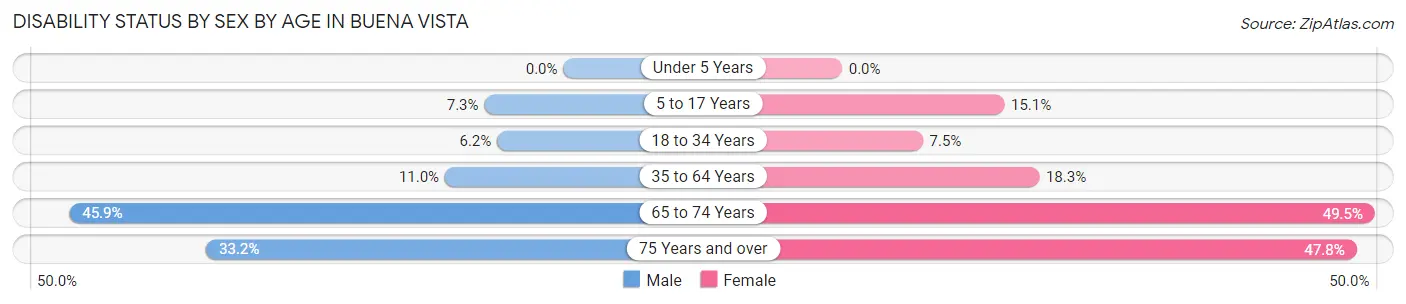
| Age Bracket | Male | Female |
| Under 5 Years | 0 (0.0%) | 0 (0.0%) |
| 5 to 17 Years | 45 (7.3%) | 72 (15.1%) |
| 18 to 34 Years | 53 (6.1%) | 77 (7.5%) |
| 35 to 64 Years | 120 (11.0%) | 192 (18.3%) |
| 65 to 74 Years | 116 (45.9%) | 184 (49.5%) |
| 75 Years and over | 62 (33.2%) | 139 (47.8%) |
Disability Class by Sex by Age in Buena Vista
Disability Class: Hearing Difficulty
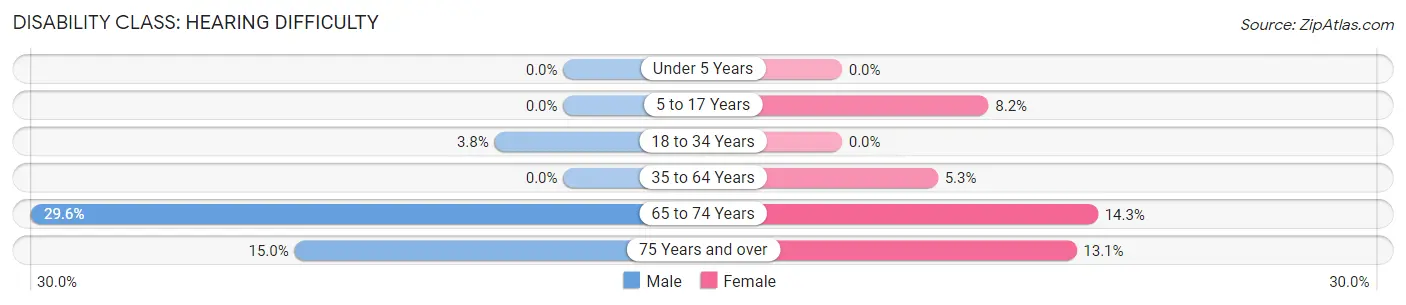
| Age Bracket | Male | Female |
| Under 5 Years | 0 (0.0%) | 0 (0.0%) |
| 5 to 17 Years | 0 (0.0%) | 39 (8.2%) |
| 18 to 34 Years | 33 (3.8%) | 0 (0.0%) |
| 35 to 64 Years | 0 (0.0%) | 56 (5.3%) |
| 65 to 74 Years | 75 (29.6%) | 53 (14.2%) |
| 75 Years and over | 28 (15.0%) | 38 (13.1%) |
Disability Class: Vision Difficulty
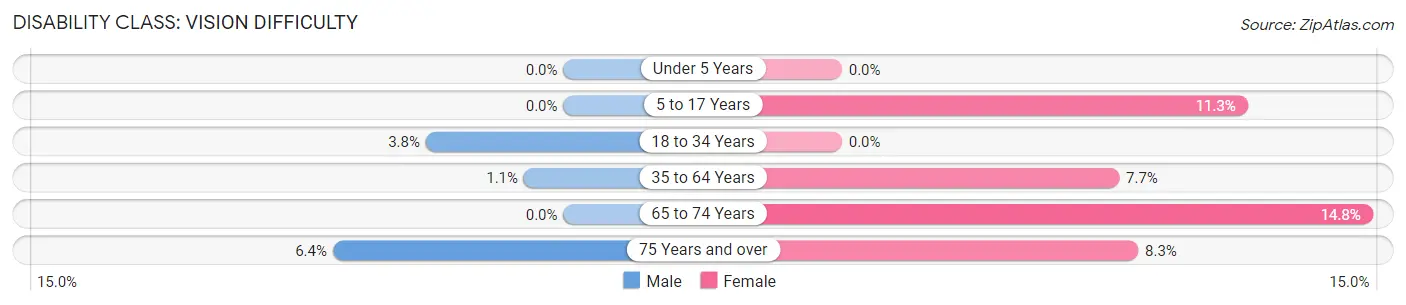
| Age Bracket | Male | Female |
| Under 5 Years | 0 (0.0%) | 0 (0.0%) |
| 5 to 17 Years | 0 (0.0%) | 54 (11.3%) |
| 18 to 34 Years | 33 (3.8%) | 0 (0.0%) |
| 35 to 64 Years | 12 (1.1%) | 81 (7.7%) |
| 65 to 74 Years | 0 (0.0%) | 55 (14.8%) |
| 75 Years and over | 12 (6.4%) | 24 (8.3%) |
Disability Class: Cognitive Difficulty
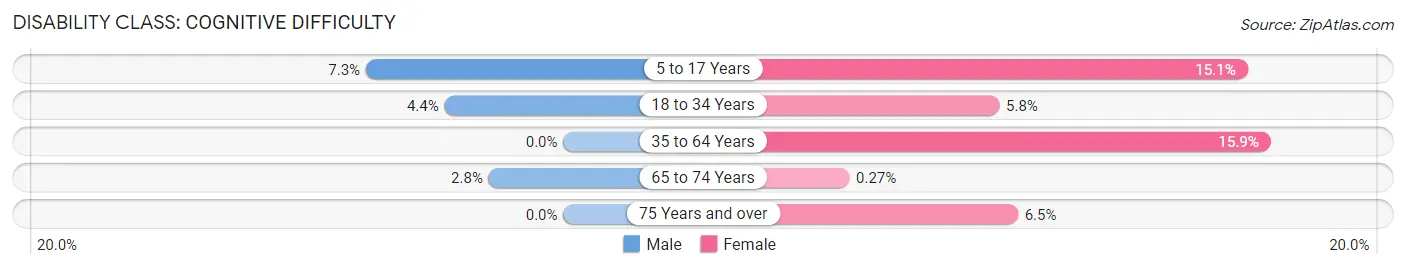
| Age Bracket | Male | Female |
| 5 to 17 Years | 45 (7.3%) | 72 (15.1%) |
| 18 to 34 Years | 38 (4.4%) | 60 (5.8%) |
| 35 to 64 Years | 0 (0.0%) | 167 (15.9%) |
| 65 to 74 Years | 7 (2.8%) | 1 (0.3%) |
| 75 Years and over | 0 (0.0%) | 19 (6.5%) |
Disability Class: Ambulatory Difficulty
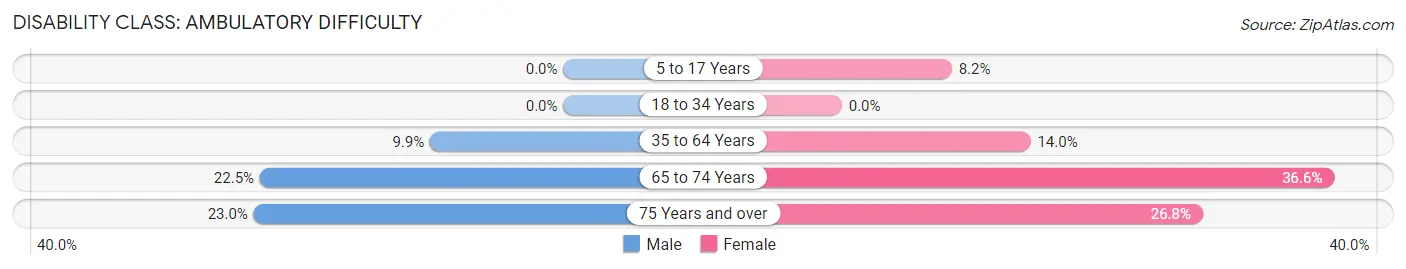
| Age Bracket | Male | Female |
| 5 to 17 Years | 0 (0.0%) | 39 (8.2%) |
| 18 to 34 Years | 0 (0.0%) | 0 (0.0%) |
| 35 to 64 Years | 108 (9.9%) | 147 (14.0%) |
| 65 to 74 Years | 57 (22.5%) | 136 (36.6%) |
| 75 Years and over | 43 (23.0%) | 78 (26.8%) |
Disability Class: Self-Care Difficulty
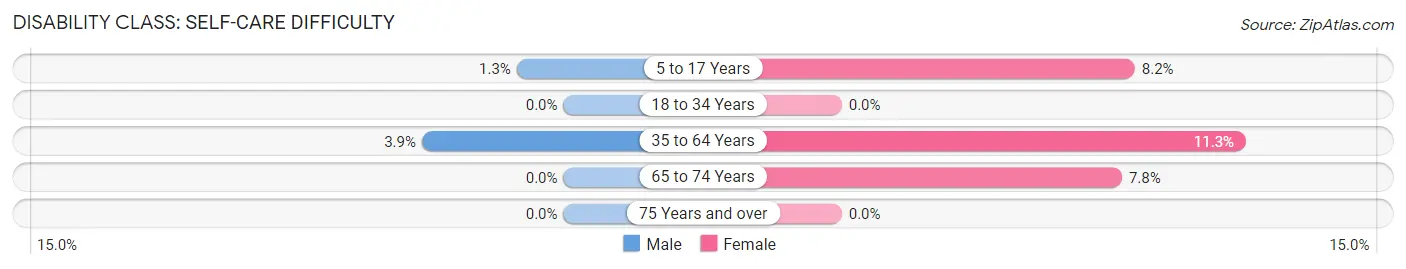
| Age Bracket | Male | Female |
| 5 to 17 Years | 8 (1.3%) | 39 (8.2%) |
| 18 to 34 Years | 0 (0.0%) | 0 (0.0%) |
| 35 to 64 Years | 43 (3.9%) | 118 (11.3%) |
| 65 to 74 Years | 0 (0.0%) | 29 (7.8%) |
| 75 Years and over | 0 (0.0%) | 0 (0.0%) |
Technology Access in Buena Vista
Computing Device Access in Buena Vista
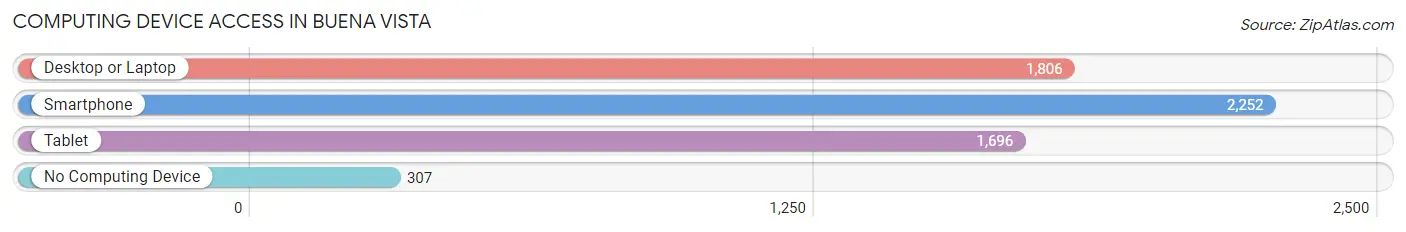
| Device Type | # Households | % Households |
| Desktop or Laptop | 1,806 | 68.0% |
| Smartphone | 2,252 | 84.8% |
| Tablet | 1,696 | 63.9% |
| No Computing Device | 307 | 11.6% |
| Total | 2,655 | 100.0% |
Internet Access in Buena Vista
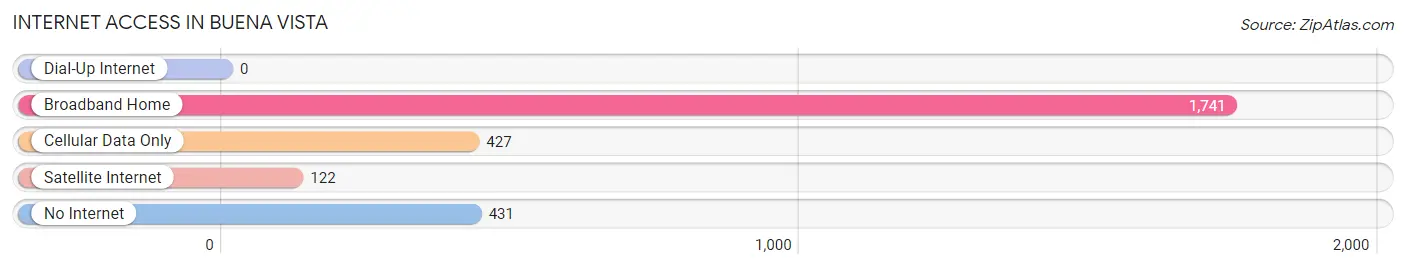
| Internet Type | # Households | % Households |
| Dial-Up Internet | 0 | 0.0% |
| Broadband Home | 1,741 | 65.6% |
| Cellular Data Only | 427 | 16.1% |
| Satellite Internet | 122 | 4.6% |
| No Internet | 431 | 16.2% |
| Total | 2,655 | 100.0% |
Buena Vista Summary
Buena Vista is a city located in the Shenandoah Valley of Virginia, United States. It is the county seat of Rockbridge County and is located in the heart of the Blue Ridge Mountains. The population was 6,650 at the 2010 census.
History
The area that is now Buena Vista was first settled in the late 1700s by German and Scots-Irish immigrants. The town was originally known as "Harmony Hill" and was renamed "Buena Vista" in 1833. The name was chosen to honor the Battle of Buena Vista, which had taken place in Mexico in 1847.
The town was incorporated in 1851 and was the site of the first public school in Rockbridge County. The town was also home to the first railroad in the county, the Virginia Central Railroad, which was completed in 1854.
The town was a major center of the Confederate Army during the Civil War. The Battle of Buena Vista was fought in the area in 1864. The town was also the site of the Battle of New Market in 1864.
Geography
Buena Vista is located in the Shenandoah Valley of Virginia, in the heart of the Blue Ridge Mountains. The city is situated at the confluence of the Maury and James Rivers. The city is located at the intersection of U.S. Route 60 and U.S. Route 501.
The city has a total area of 4.2 square miles, all of which is land. The city is located at an elevation of 1,890 feet above sea level.
Economy
The economy of Buena Vista is largely based on tourism and manufacturing. The city is home to several manufacturing companies, including a furniture factory, a plastics factory, and a printing company.
The city is also home to several tourist attractions, including the Virginia Horse Center, the Natural Bridge of Virginia, and the George C. Marshall Museum.
Demographics
As of the 2010 census, the population of Buena Vista was 6,650. The racial makeup of the city was 87.3% White, 8.2% African American, 0.3% Native American, 0.7% Asian, 0.1% Pacific Islander, 1.2% from other races, and 2.4% from two or more races. Hispanic or Latino of any race were 3.2% of the population.
The median income for a household in the city was $35,938, and the median income for a family was $45,938. The per capita income for the city was $19,938. About 11.2% of families and 14.2% of the population were below the poverty line, including 19.2% of those under age 18 and 8.2% of those age 65 or over.
Common Questions
What is Per Capita Income in Buena Vista?
Per Capita income in Buena Vista is $32,925.
What is the Median Family Income in Buena Vista?
Median Family Income in Buena Vista is $55,717.
What is the Median Household income in Buena Vista?
Median Household Income in Buena Vista is $48,783.
What is Income or Wage Gap in Buena Vista?
Income or Wage Gap in Buena Vista is 22.0%.
Women in Buena Vista earn 78.0 cents for every dollar earned by a man.
What is Inequality or Gini Index in Buena Vista?
Inequality or Gini Index in Buena Vista is 0.56.
What is the Total Population of Buena Vista?
Total Population of Buena Vista is 6,639.
What is the Total Male Population of Buena Vista?
Total Male Population of Buena Vista is 3,128.
What is the Total Female Population of Buena Vista?
Total Female Population of Buena Vista is 3,511.
What is the Ratio of Males per 100 Females in Buena Vista?
There are 89.09 Males per 100 Females in Buena Vista.
What is the Ratio of Females per 100 Males in Buena Vista?
There are 112.24 Females per 100 Males in Buena Vista.
What is the Median Population Age in Buena Vista?
Median Population Age in Buena Vista is 35.3 Years.
What is the Average Family Size in Buena Vista
Average Family Size in Buena Vista is 2.7 People.
What is the Average Household Size in Buena Vista
Average Household Size in Buena Vista is 2.3 People.
How Large is the Labor Force in Buena Vista?
There are 3,160 People in the Labor Forcein in Buena Vista.
What is the Percentage of People in the Labor Force in Buena Vista?
58.2% of People are in the Labor Force in Buena Vista.
What is the Unemployment Rate in Buena Vista?
Unemployment Rate in Buena Vista is 1.3%.