Brookneal, VA Map & Demographics
Brookneal Map
Brookneal Overview
$20,292
PER CAPITA INCOME
$55,313
AVG FAMILY INCOME
$42,019
AVG HOUSEHOLD INCOME
10.6%
WAGE / INCOME GAP [ % ]
89.4¢/ $1
WAGE / INCOME GAP [ $ ]
$16,998
FAMILY INCOME DEFICIT
0.38
INEQUALITY / GINI INDEX
1,225
TOTAL POPULATION
577
MALE POPULATION
648
FEMALE POPULATION
89.04
MALES / 100 FEMALES
112.31
FEMALES / 100 MALES
47.2
MEDIAN AGE
3.2
AVG FAMILY SIZE
2.4
AVG HOUSEHOLD SIZE
462
LABOR FORCE [ PEOPLE ]
45.8%
PERCENT IN LABOR FORCE
8.9%
UNEMPLOYMENT RATE
Brookneal Zip Codes
Brookneal Area Codes
Income in Brookneal
Income Overview in Brookneal
Per Capita Income in Brookneal is $20,292, while median incomes of families and households are $55,313 and $42,019 respectively.
| Characteristic | Number | Measure |
| Per Capita Income | 1,225 | $20,292 |
| Median Family Income | 302 | $55,313 |
| Mean Family Income | 302 | $51,248 |
| Median Household Income | 483 | $42,019 |
| Mean Household Income | 483 | $47,134 |
| Income Deficit | 302 | $16,998 |
| Wage / Income Gap (%) | 1,225 | 10.65% |
| Wage / Income Gap ($) | 1,225 | 89.35¢ per $1 |
| Gini / Inequality Index | 1,225 | 0.38 |
Earnings by Sex in Brookneal
Average Earnings in Brookneal are $26,188, $28,190 for men and $25,188 for women, a difference of 10.6%.
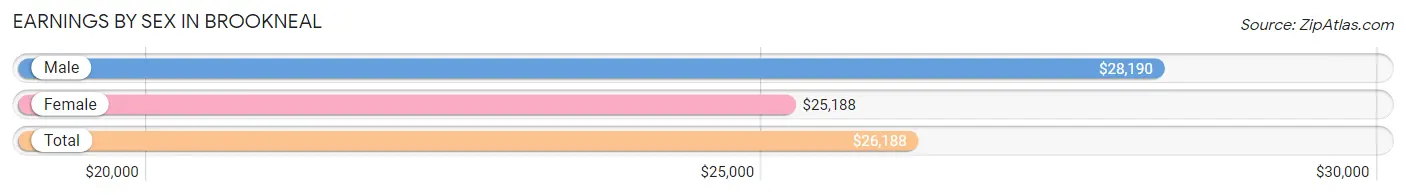
| Sex | Number | Average Earnings |
| Male | 232 (48.6%) | $28,190 |
| Female | 245 (51.4%) | $25,188 |
| Total | 477 (100.0%) | $26,188 |
Earnings by Sex by Income Bracket in Brookneal
The most common earnings brackets in Brookneal are $7,500 to $9,999 for men (37 | 16.0%) and $55,000 to $64,999 for women (37 | 15.1%).
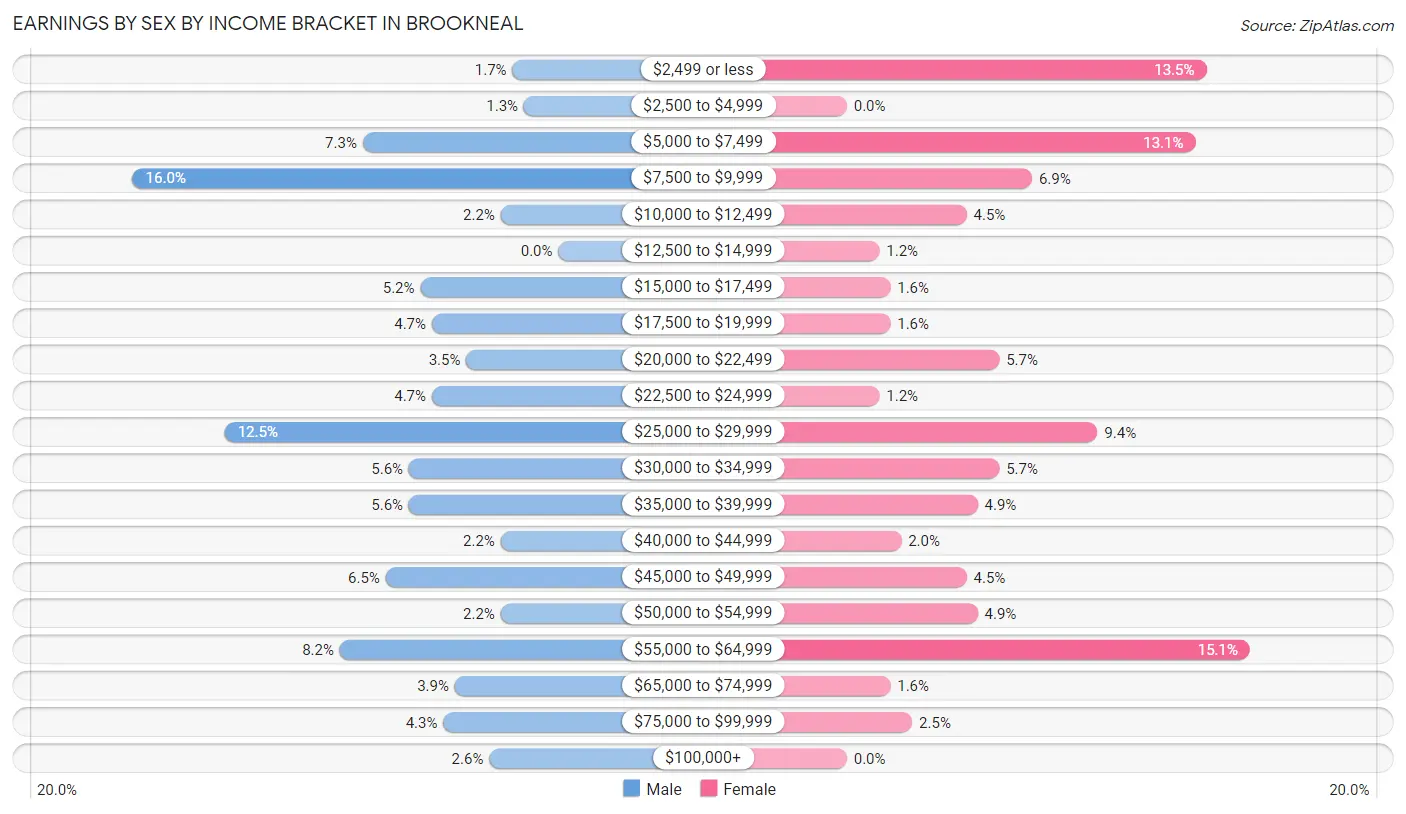
| Income | Male | Female |
| $2,499 or less | 4 (1.7%) | 33 (13.5%) |
| $2,500 to $4,999 | 3 (1.3%) | 0 (0.0%) |
| $5,000 to $7,499 | 17 (7.3%) | 32 (13.1%) |
| $7,500 to $9,999 | 37 (16.0%) | 17 (6.9%) |
| $10,000 to $12,499 | 5 (2.2%) | 11 (4.5%) |
| $12,500 to $14,999 | 0 (0.0%) | 3 (1.2%) |
| $15,000 to $17,499 | 12 (5.2%) | 4 (1.6%) |
| $17,500 to $19,999 | 11 (4.7%) | 4 (1.6%) |
| $20,000 to $22,499 | 8 (3.5%) | 14 (5.7%) |
| $22,500 to $24,999 | 11 (4.7%) | 3 (1.2%) |
| $25,000 to $29,999 | 29 (12.5%) | 23 (9.4%) |
| $30,000 to $34,999 | 13 (5.6%) | 14 (5.7%) |
| $35,000 to $39,999 | 13 (5.6%) | 12 (4.9%) |
| $40,000 to $44,999 | 5 (2.2%) | 5 (2.0%) |
| $45,000 to $49,999 | 15 (6.5%) | 11 (4.5%) |
| $50,000 to $54,999 | 5 (2.2%) | 12 (4.9%) |
| $55,000 to $64,999 | 19 (8.2%) | 37 (15.1%) |
| $65,000 to $74,999 | 9 (3.9%) | 4 (1.6%) |
| $75,000 to $99,999 | 10 (4.3%) | 6 (2.5%) |
| $100,000+ | 6 (2.6%) | 0 (0.0%) |
| Total | 232 (100.0%) | 245 (100.0%) |
Earnings by Sex by Educational Attainment in Brookneal
Average earnings in Brookneal are $28,804 for men and $33,750 for women, a difference of 14.6%. Men with an educational attainment of college or associate's degree enjoy the highest average annual earnings of $33,250, while those with less than high school education earn the least with $19,659. Women with an educational attainment of graduate degree earn the most with the average annual earnings of $56,429, while those with high school diploma education have the smallest earnings of $35,313.
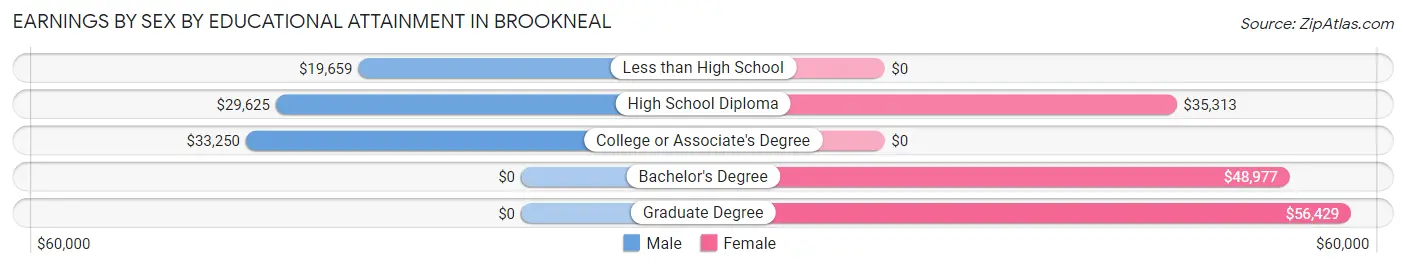
| Educational Attainment | Male Income | Female Income |
| Less than High School | $19,659 | $0 |
| High School Diploma | $29,625 | $35,313 |
| College or Associate's Degree | $33,250 | $0 |
| Bachelor's Degree | - | - |
| Graduate Degree | - | - |
| Total | $28,804 | $33,750 |
Family Income in Brookneal
Family Income Brackets in Brookneal
According to the Brookneal family income data, there are 123 families falling into the $50,000 to $74,999 income range, which is the most common income bracket and makes up 40.7% of all families.
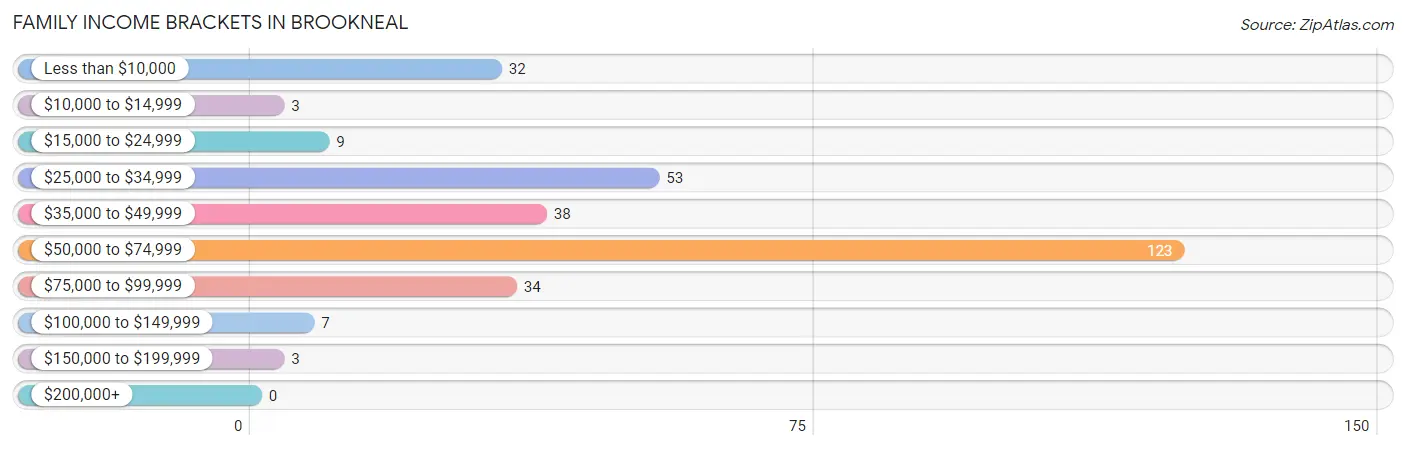
| Income Bracket | # Families | % Families |
| Less than $10,000 | 32 | 10.6% |
| $10,000 to $14,999 | 3 | 1.0% |
| $15,000 to $24,999 | 9 | 3.0% |
| $25,000 to $34,999 | 53 | 17.5% |
| $35,000 to $49,999 | 38 | 12.6% |
| $50,000 to $74,999 | 123 | 40.7% |
| $75,000 to $99,999 | 34 | 11.3% |
| $100,000 to $149,999 | 7 | 2.3% |
| $150,000 to $199,999 | 3 | 1.0% |
| $200,000+ | 0 | 0.0% |
Family Income by Famaliy Size in Brookneal
4-person families (26 | 8.6%) account for the highest median family income in Brookneal with $71,000 per family, while 2-person families (127 | 42.0%) have the highest median income of $28,940 per family member.
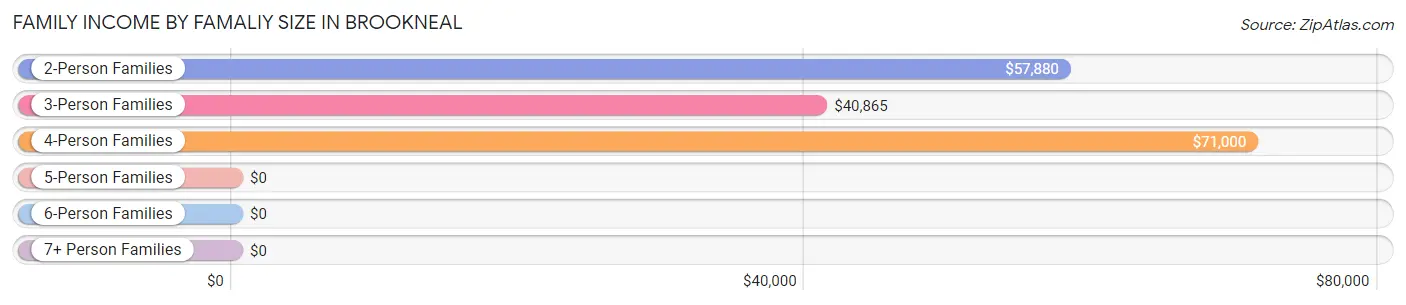
| Income Bracket | # Families | Median Income |
| 2-Person Families | 127 (42.0%) | $57,880 |
| 3-Person Families | 87 (28.8%) | $40,865 |
| 4-Person Families | 26 (8.6%) | $71,000 |
| 5-Person Families | 48 (15.9%) | $0 |
| 6-Person Families | 0 (0.0%) | $0 |
| 7+ Person Families | 14 (4.6%) | $0 |
| Total | 302 (100.0%) | $55,313 |
Family Income by Number of Earners in Brookneal
The median family income in Brookneal is $55,313, with families comprising 3+ earners (30) having the highest median family income of $68,977, while families with no earners (85) have the lowest median family income of $26,250, accounting for 9.9% and 28.1% of families, respectively.
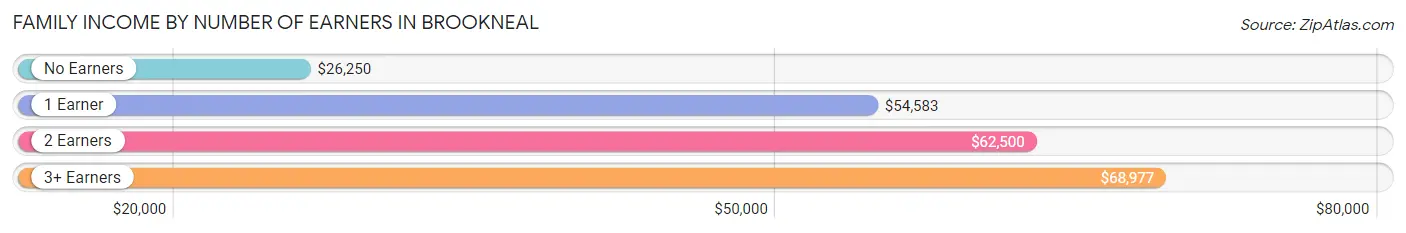
| Number of Earners | # Families | Median Income |
| No Earners | 85 (28.1%) | $26,250 |
| 1 Earner | 117 (38.7%) | $54,583 |
| 2 Earners | 70 (23.2%) | $62,500 |
| 3+ Earners | 30 (9.9%) | $68,977 |
| Total | 302 (100.0%) | $55,313 |
Household Income in Brookneal
Household Income Brackets in Brookneal
With 159 households falling in the category, the $50,000 to $74,999 income range is the most frequent in Brookneal, accounting for 32.9% of all households.
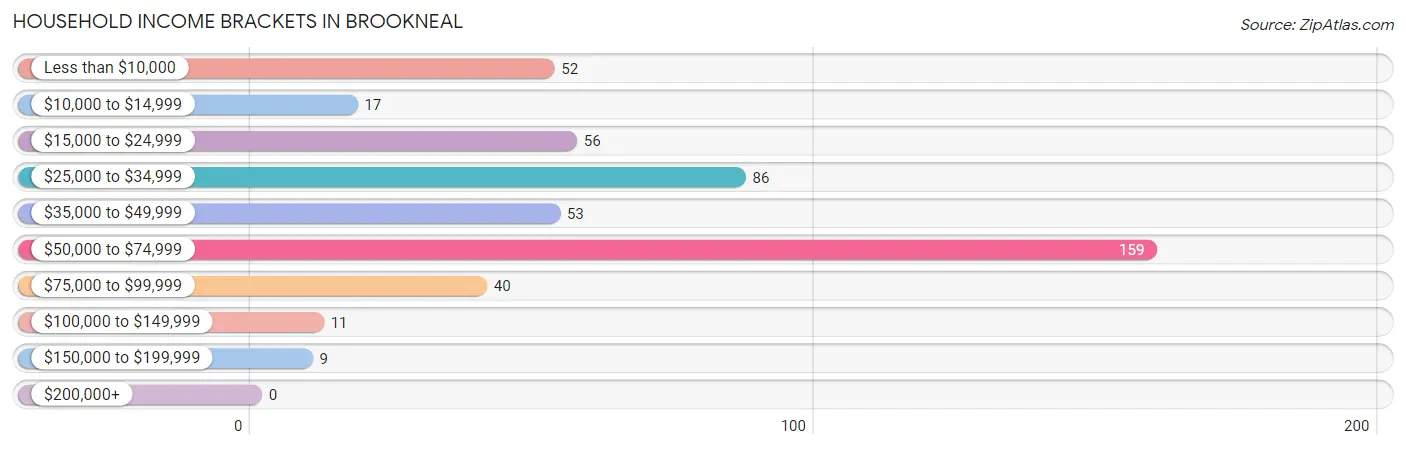
| Income Bracket | # Households | % Households |
| Less than $10,000 | 52 | 10.8% |
| $10,000 to $14,999 | 17 | 3.5% |
| $15,000 to $24,999 | 56 | 11.6% |
| $25,000 to $34,999 | 86 | 17.8% |
| $35,000 to $49,999 | 53 | 11.0% |
| $50,000 to $74,999 | 159 | 32.9% |
| $75,000 to $99,999 | 40 | 8.3% |
| $100,000 to $149,999 | 11 | 2.3% |
| $150,000 to $199,999 | 9 | 1.9% |
| $200,000+ | 0 | 0.0% |
Household Income by Householder Age in Brookneal
The median household income in Brookneal is $42,019, with the highest median household income of $61,000 found in the 65+ years age bracket for the primary householder. A total of 116 households (24.0%) fall into this category. Meanwhile, the 15 to 24 years age bracket for the primary householder has the lowest median household income of $0, with 8 households (1.7%) in this group.
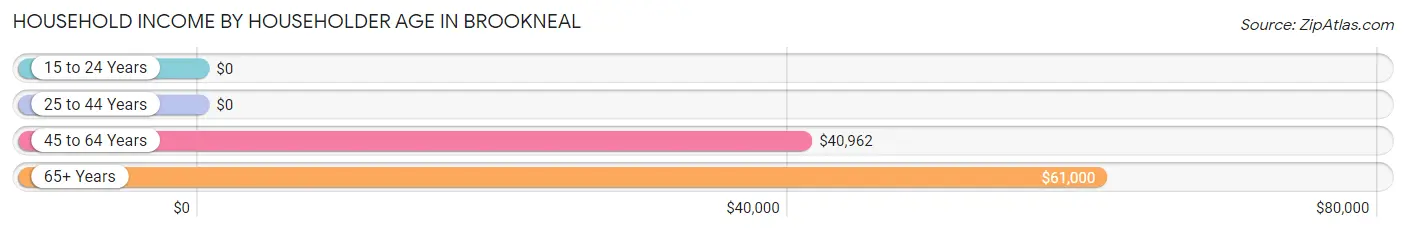
| Income Bracket | # Households | Median Income |
| 15 to 24 Years | 8 (1.7%) | $0 |
| 25 to 44 Years | 95 (19.7%) | $0 |
| 45 to 64 Years | 264 (54.7%) | $40,962 |
| 65+ Years | 116 (24.0%) | $61,000 |
| Total | 483 (100.0%) | $42,019 |
Poverty in Brookneal
Income Below Poverty by Sex and Age in Brookneal
With 15.9% poverty level for males and 30.6% for females among the residents of Brookneal, 75 year old and over males and under 5 year old females are the most vulnerable to poverty, with 9 males (47.4%) and 38 females (100.0%) in their respective age groups living below the poverty level.
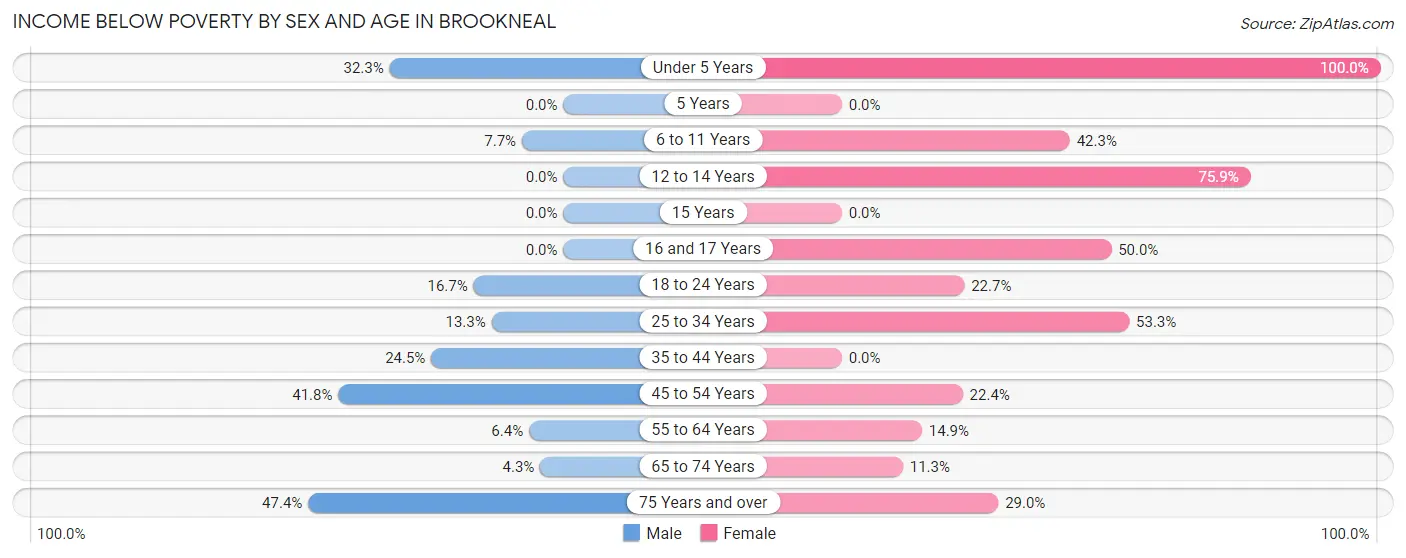
| Age Bracket | Male | Female |
| Under 5 Years | 10 (32.3%) | 38 (100.0%) |
| 5 Years | 0 (0.0%) | 0 (0.0%) |
| 6 to 11 Years | 4 (7.7%) | 11 (42.3%) |
| 12 to 14 Years | 0 (0.0%) | 22 (75.9%) |
| 15 Years | 0 (0.0%) | 0 (0.0%) |
| 16 and 17 Years | 0 (0.0%) | 4 (50.0%) |
| 18 to 24 Years | 4 (16.7%) | 20 (22.7%) |
| 25 to 34 Years | 4 (13.3%) | 40 (53.3%) |
| 35 to 44 Years | 13 (24.5%) | 0 (0.0%) |
| 45 to 54 Years | 33 (41.8%) | 24 (22.4%) |
| 55 to 64 Years | 9 (6.4%) | 11 (14.9%) |
| 65 to 74 Years | 4 (4.3%) | 6 (11.3%) |
| 75 Years and over | 9 (47.4%) | 9 (29.0%) |
| Total | 90 (15.9%) | 185 (30.6%) |
Income Above Poverty by Sex and Age in Brookneal
According to the poverty statistics in Brookneal, males aged 12 to 14 years and females aged 15 years are the age groups that are most secure financially, with 100.0% of males and 100.0% of females in these age groups living above the poverty line.
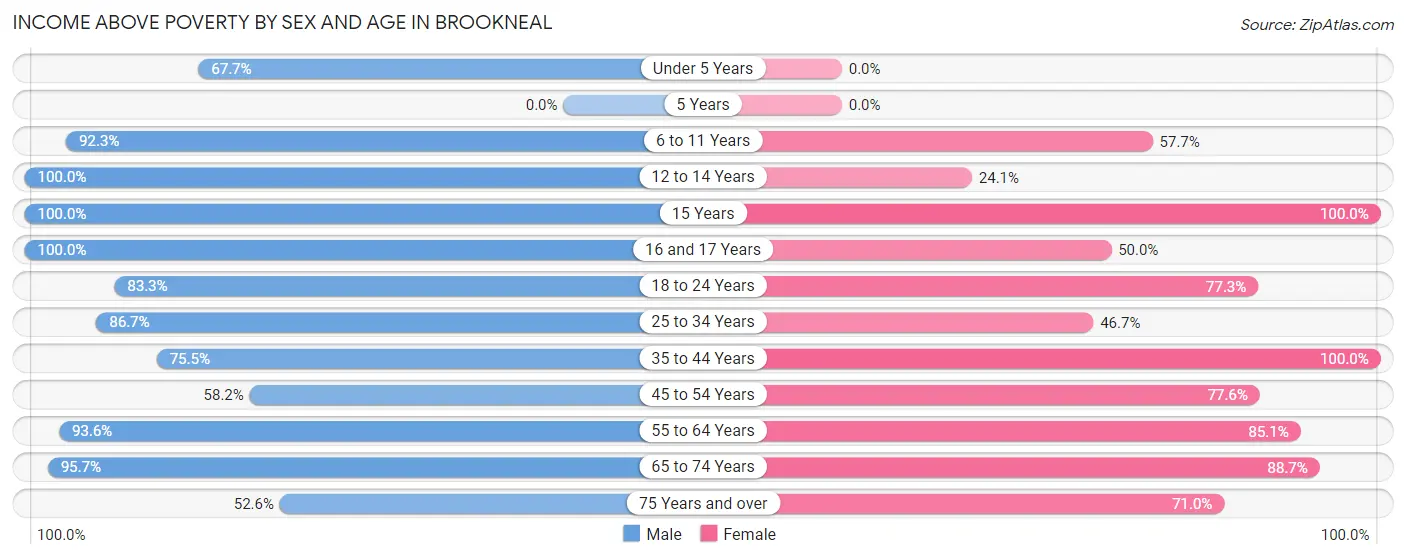
| Age Bracket | Male | Female |
| Under 5 Years | 21 (67.7%) | 0 (0.0%) |
| 5 Years | 0 (0.0%) | 0 (0.0%) |
| 6 to 11 Years | 48 (92.3%) | 15 (57.7%) |
| 12 to 14 Years | 21 (100.0%) | 7 (24.1%) |
| 15 Years | 10 (100.0%) | 10 (100.0%) |
| 16 and 17 Years | 15 (100.0%) | 4 (50.0%) |
| 18 to 24 Years | 20 (83.3%) | 68 (77.3%) |
| 25 to 34 Years | 26 (86.7%) | 35 (46.7%) |
| 35 to 44 Years | 40 (75.5%) | 66 (100.0%) |
| 45 to 54 Years | 46 (58.2%) | 83 (77.6%) |
| 55 to 64 Years | 132 (93.6%) | 63 (85.1%) |
| 65 to 74 Years | 89 (95.7%) | 47 (88.7%) |
| 75 Years and over | 10 (52.6%) | 22 (71.0%) |
| Total | 478 (84.2%) | 420 (69.4%) |
Income Below Poverty Among Married-Couple Families in Brookneal
The poverty statistics for married-couple families in Brookneal show that 14.5% or 24 of the total 166 families live below the poverty line. Families with 1 or 2 children have the highest poverty rate of 26.2%, comprising of 11 families. On the other hand, families with 3 or 4 children have the lowest poverty rate of 0.0%, which includes 0 families.
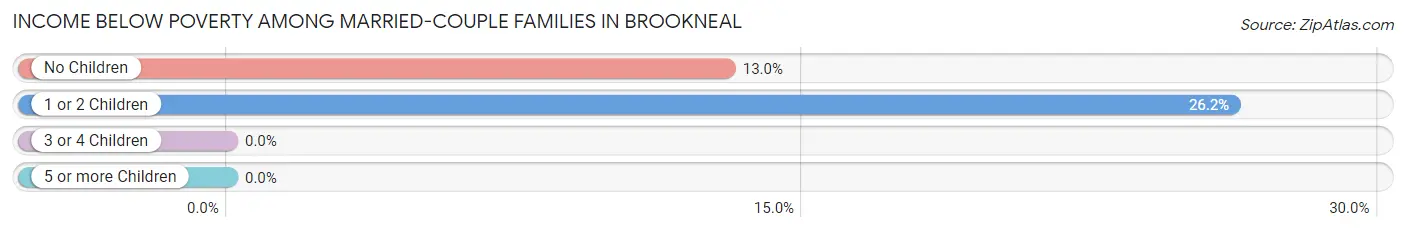
| Children | Above Poverty | Below Poverty |
| No Children | 87 (87.0%) | 13 (13.0%) |
| 1 or 2 Children | 31 (73.8%) | 11 (26.2%) |
| 3 or 4 Children | 24 (100.0%) | 0 (0.0%) |
| 5 or more Children | 0 (0.0%) | 0 (0.0%) |
| Total | 142 (85.5%) | 24 (14.5%) |
Income Below Poverty Among Single-Parent Households in Brookneal
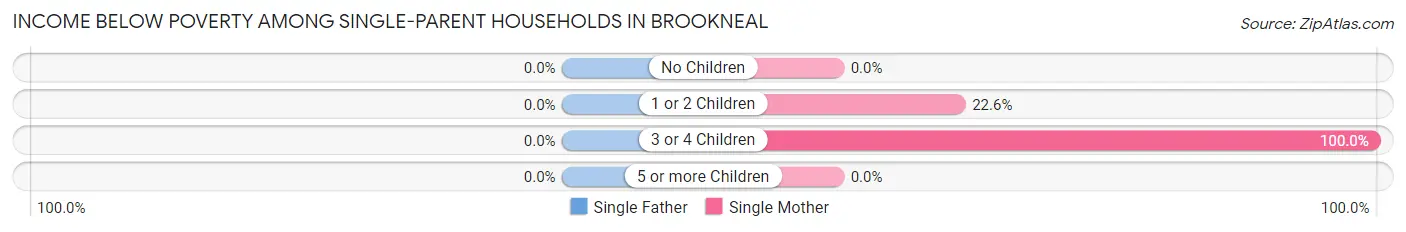
| Children | Single Father | Single Mother |
| No Children | 0 (0.0%) | 0 (0.0%) |
| 1 or 2 Children | 0 (0.0%) | 12 (22.6%) |
| 3 or 4 Children | 0 (0.0%) | 19 (100.0%) |
| 5 or more Children | 0 (0.0%) | 0 (0.0%) |
| Total | 0 (0.0%) | 31 (32.0%) |
Income Below Poverty Among Married-Couple vs Single-Parent Households in Brookneal
The poverty data for Brookneal shows that 24 of the married-couple family households (14.5%) and 31 of the single-parent households (22.8%) are living below the poverty level. Within the married-couple family households, those with 1 or 2 children have the highest poverty rate, with 11 households (26.2%) falling below the poverty line. Among the single-parent households, those with 3 or 4 children have the highest poverty rate, with 19 household (100.0%) living below poverty.
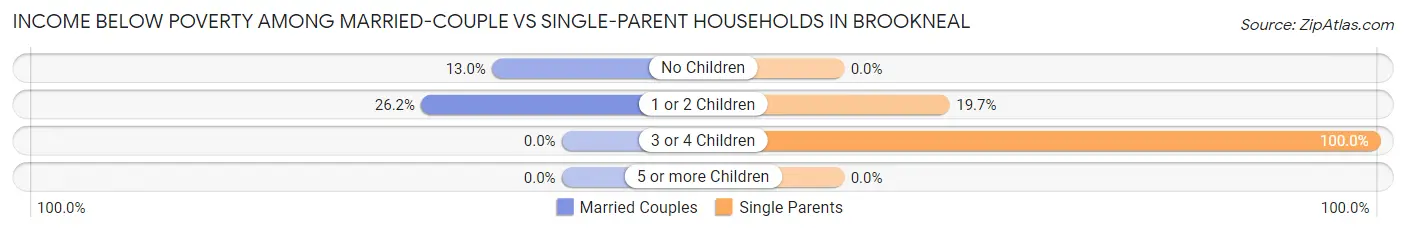
| Children | Married-Couple Families | Single-Parent Households |
| No Children | 13 (13.0%) | 0 (0.0%) |
| 1 or 2 Children | 11 (26.2%) | 12 (19.7%) |
| 3 or 4 Children | 0 (0.0%) | 19 (100.0%) |
| 5 or more Children | 0 (0.0%) | 0 (0.0%) |
| Total | 24 (14.5%) | 31 (22.8%) |
Race in Brookneal
The most populous races in Brookneal are White / Caucasian (718 | 58.6%), Black / African American (428 | 34.9%), and Two or more Races (79 | 6.5%).
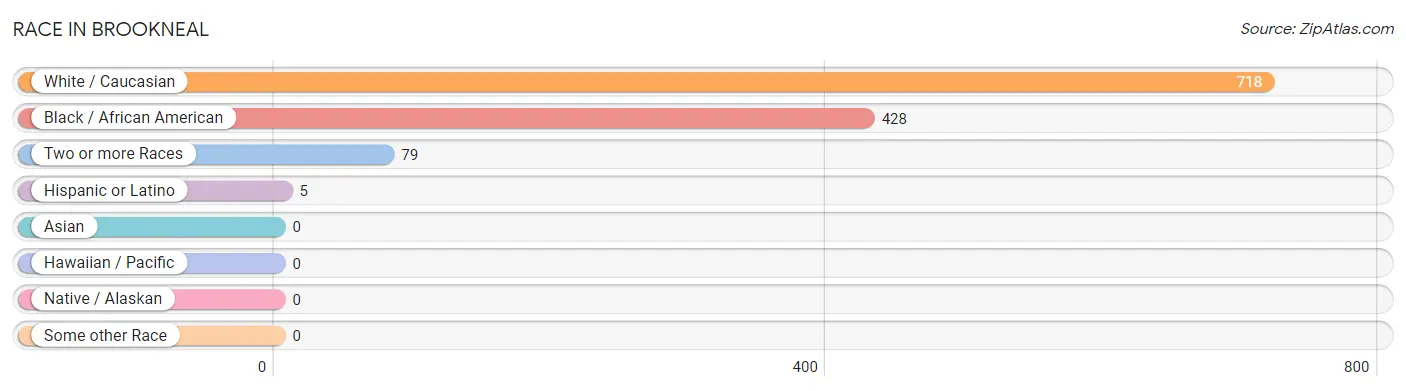
| Race | # Population | % Population |
| Asian | 0 | 0.0% |
| Black / African American | 428 | 34.9% |
| Hawaiian / Pacific | 0 | 0.0% |
| Hispanic or Latino | 5 | 0.4% |
| Native / Alaskan | 0 | 0.0% |
| White / Caucasian | 718 | 58.6% |
| Two or more Races | 79 | 6.5% |
| Some other Race | 0 | 0.0% |
| Total | 1,225 | 100.0% |
Ancestry in Brookneal
The most populous ancestries reported in Brookneal are American (320 | 26.1%), African (85 | 6.9%), Subsaharan African (85 | 6.9%), Cherokee (63 | 5.1%), and Irish (37 | 3.0%), together accounting for 48.2% of all Brookneal residents.
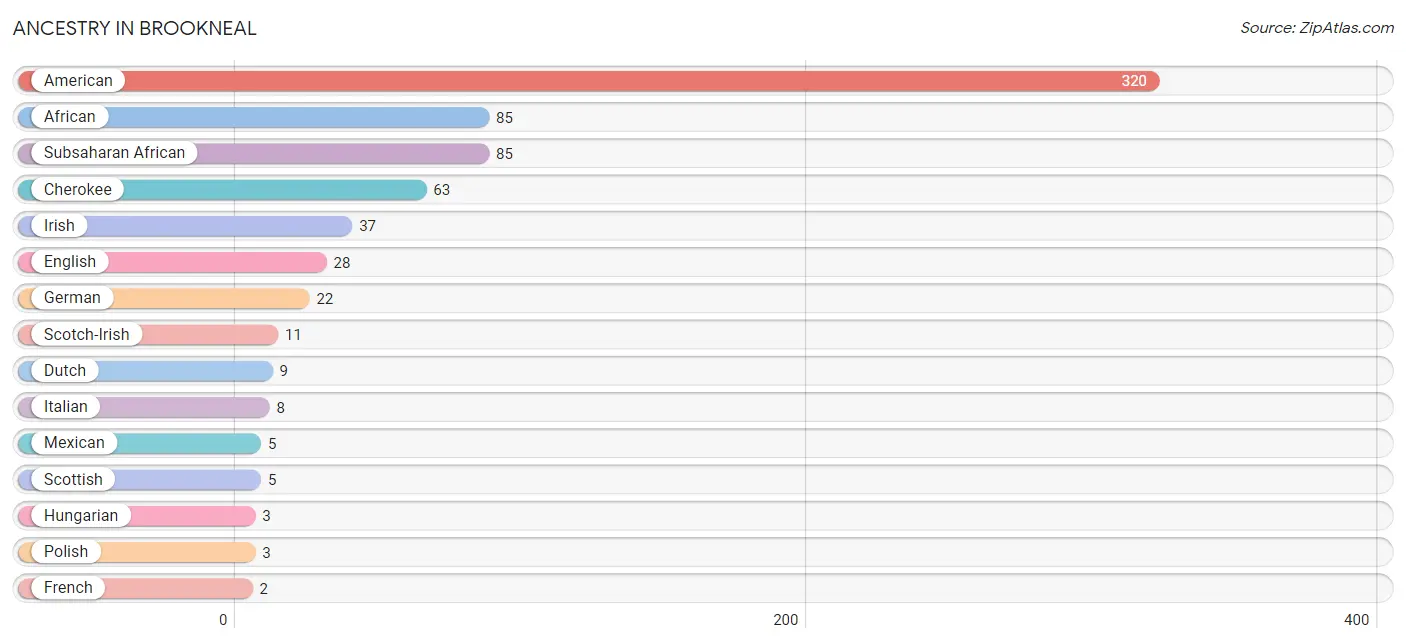
| Ancestry | # Population | % Population |
| African | 85 | 6.9% |
| American | 320 | 26.1% |
| Cherokee | 63 | 5.1% |
| Dutch | 9 | 0.7% |
| English | 28 | 2.3% |
| French | 2 | 0.2% |
| German | 22 | 1.8% |
| Hungarian | 3 | 0.2% |
| Irish | 37 | 3.0% |
| Italian | 8 | 0.6% |
| Mexican | 5 | 0.4% |
| Polish | 3 | 0.2% |
| Scotch-Irish | 11 | 0.9% |
| Scottish | 5 | 0.4% |
| Subsaharan African | 85 | 6.9% | View All 15 Rows |
Immigrants in Brookneal
The most numerous immigrant groups reported in Brookneal came from Central America (5 | 0.4%), Latin America (5 | 0.4%), and Mexico (5 | 0.4%), together accounting for 1.2% of all Brookneal residents.
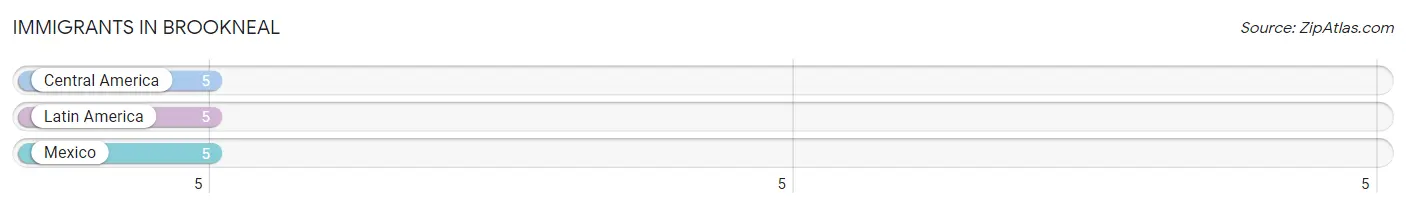
| Immigration Origin | # Population | % Population |
| Central America | 5 | 0.4% |
| Latin America | 5 | 0.4% |
| Mexico | 5 | 0.4% | View All 3 Rows |
Sex and Age in Brookneal
Sex and Age in Brookneal
The most populous age groups in Brookneal are 60 to 64 Years (93 | 16.1%) for men and 45 to 49 Years (84 | 13.0%) for women.
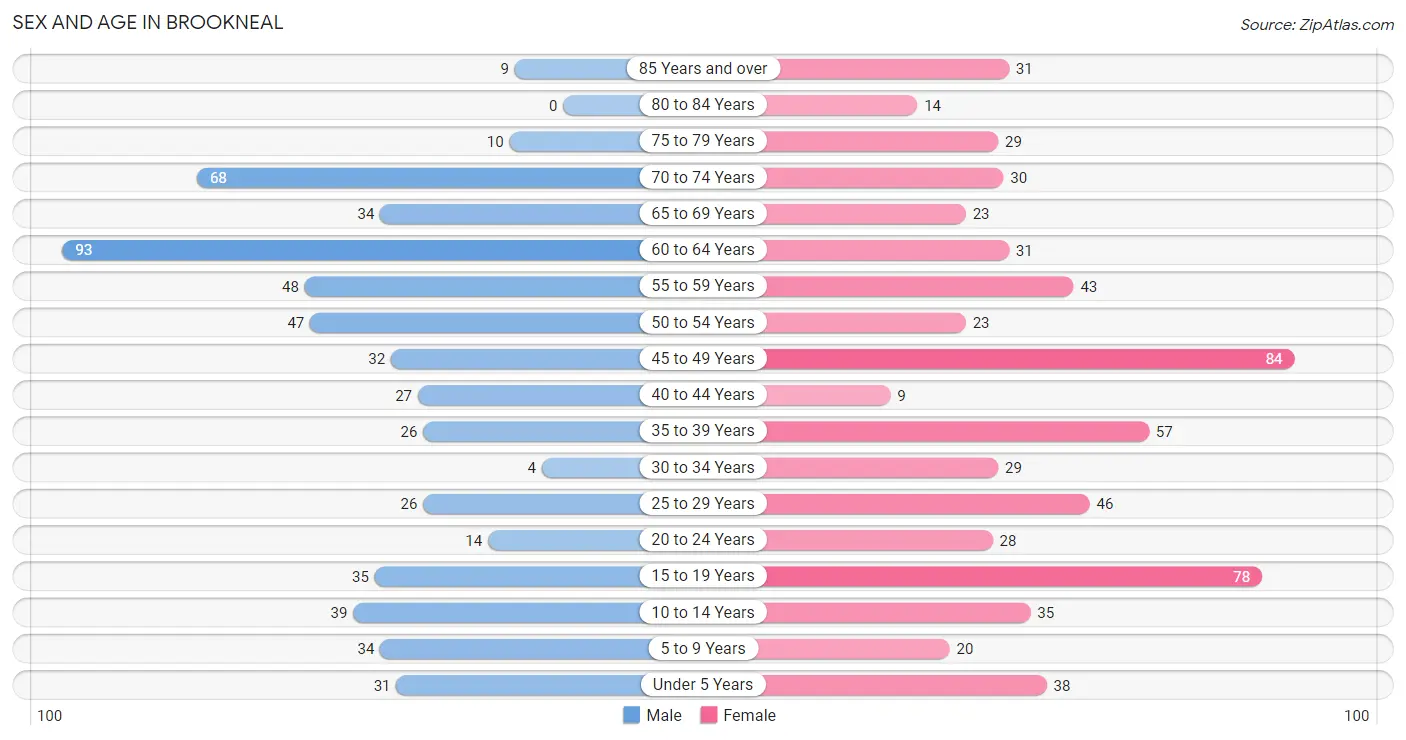
| Age Bracket | Male | Female |
| Under 5 Years | 31 (5.4%) | 38 (5.9%) |
| 5 to 9 Years | 34 (5.9%) | 20 (3.1%) |
| 10 to 14 Years | 39 (6.8%) | 35 (5.4%) |
| 15 to 19 Years | 35 (6.1%) | 78 (12.0%) |
| 20 to 24 Years | 14 (2.4%) | 28 (4.3%) |
| 25 to 29 Years | 26 (4.5%) | 46 (7.1%) |
| 30 to 34 Years | 4 (0.7%) | 29 (4.5%) |
| 35 to 39 Years | 26 (4.5%) | 57 (8.8%) |
| 40 to 44 Years | 27 (4.7%) | 9 (1.4%) |
| 45 to 49 Years | 32 (5.6%) | 84 (13.0%) |
| 50 to 54 Years | 47 (8.2%) | 23 (3.5%) |
| 55 to 59 Years | 48 (8.3%) | 43 (6.6%) |
| 60 to 64 Years | 93 (16.1%) | 31 (4.8%) |
| 65 to 69 Years | 34 (5.9%) | 23 (3.5%) |
| 70 to 74 Years | 68 (11.8%) | 30 (4.6%) |
| 75 to 79 Years | 10 (1.7%) | 29 (4.5%) |
| 80 to 84 Years | 0 (0.0%) | 14 (2.2%) |
| 85 Years and over | 9 (1.6%) | 31 (4.8%) |
| Total | 577 (100.0%) | 648 (100.0%) |
Families and Households in Brookneal
Median Family Size in Brookneal
The median family size in Brookneal is 3.18 persons per family, with single male/father families (39 | 12.9%) accounting for the largest median family size of 3.26 persons per family. On the other hand, single female/mother families (97 | 32.1%) represent the smallest median family size with 3.14 persons per family.
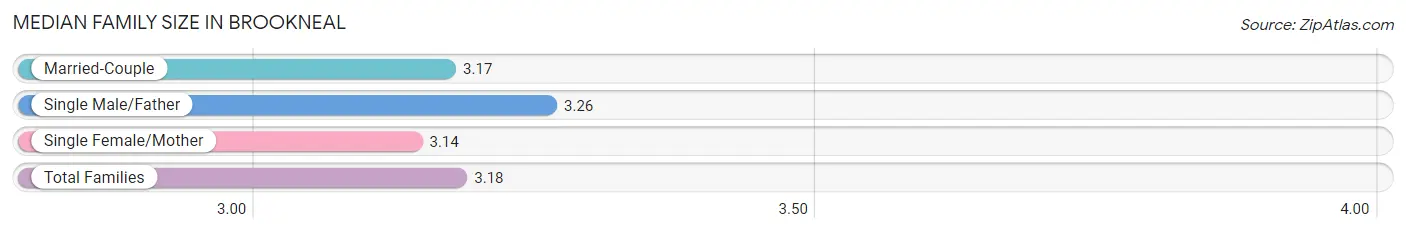
| Family Type | # Families | Family Size |
| Married-Couple | 166 (55.0%) | 3.17 |
| Single Male/Father | 39 (12.9%) | 3.26 |
| Single Female/Mother | 97 (32.1%) | 3.14 |
| Total Families | 302 (100.0%) | 3.18 |
Median Household Size in Brookneal
The median household size in Brookneal is 2.43 persons per household, with single male/father households (39 | 8.1%) accounting for the largest median household size of 3.36 persons per household. non-family households (181 | 37.5%) represent the smallest median household size with 1.07 persons per household.
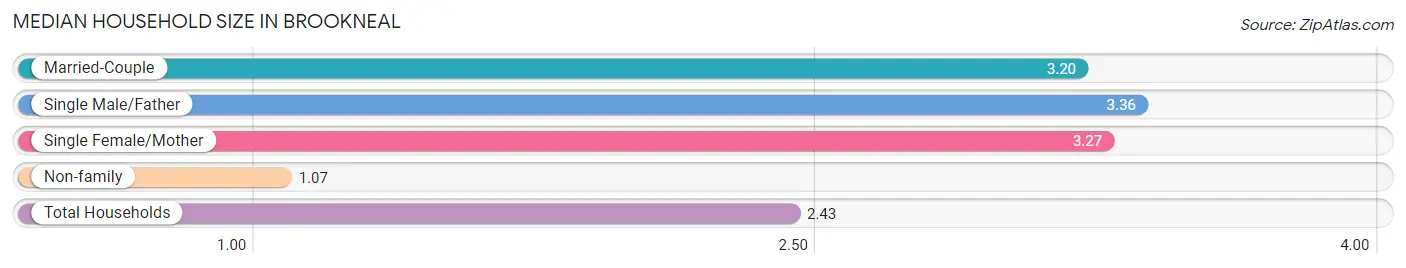
| Household Type | # Households | Household Size |
| Married-Couple | 166 (34.4%) | 3.20 |
| Single Male/Father | 39 (8.1%) | 3.36 |
| Single Female/Mother | 97 (20.1%) | 3.27 |
| Non-family | 181 (37.5%) | 1.07 |
| Total Households | 483 (100.0%) | 2.43 |
Household Size by Marriage Status in Brookneal
Out of a total of 483 households in Brookneal, 302 (62.5%) are family households, while 181 (37.5%) are nonfamily households. The most numerous type of family households are 2-person households, comprising 127, and the most common type of nonfamily households are 1-person households, comprising 173.
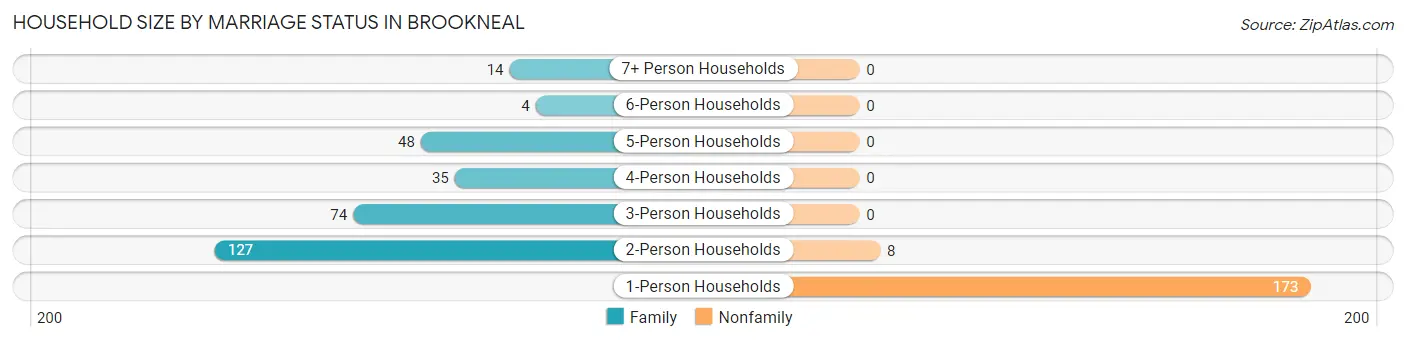
| Household Size | Family Households | Nonfamily Households |
| 1-Person Households | - | 173 (35.8%) |
| 2-Person Households | 127 (26.3%) | 8 (1.7%) |
| 3-Person Households | 74 (15.3%) | 0 (0.0%) |
| 4-Person Households | 35 (7.2%) | 0 (0.0%) |
| 5-Person Households | 48 (9.9%) | 0 (0.0%) |
| 6-Person Households | 4 (0.8%) | 0 (0.0%) |
| 7+ Person Households | 14 (2.9%) | 0 (0.0%) |
| Total | 302 (62.5%) | 181 (37.5%) |
Female Fertility in Brookneal
Fertility by Age in Brookneal
Average fertility rate in Brookneal is 97.0 births per 1,000 women. Women in the age bracket of 35 to 50 years have the highest fertility rate with 213.0 births per 1,000 women. Women in the age bracket of 35 to 50 years acount for 100.0% of all women with births.
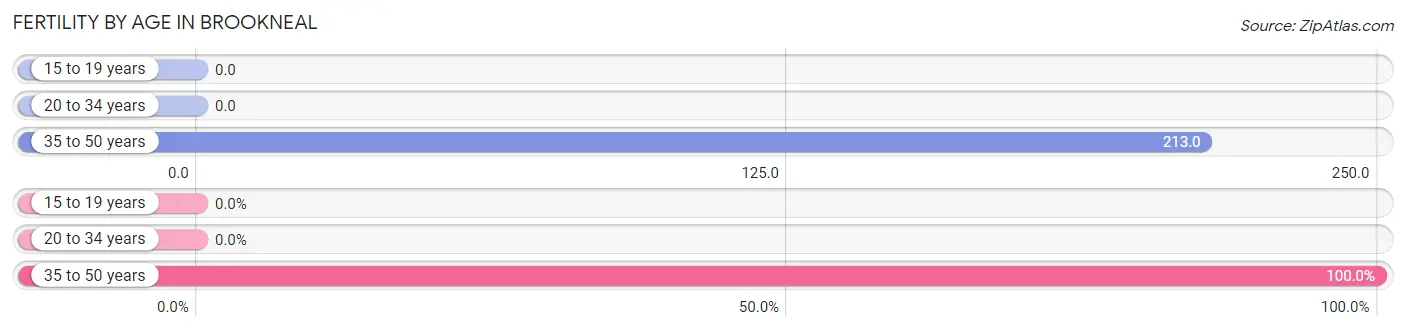
| Age Bracket | Women with Births | Births / 1,000 Women |
| 15 to 19 years | 0 (0.0%) | 0.0 |
| 20 to 34 years | 0 (0.0%) | 0.0 |
| 35 to 50 years | 32 (100.0%) | 213.0 |
| Total | 32 (100.0%) | 97.0 |
Fertility by Age by Marriage Status in Brookneal
40.6% of women with births (32) in Brookneal are married. The highest percentage of unmarried women with births falls into 35 to 50 years age bracket with 59.4% of them unmarried at the time of birth, while the lowest percentage of unmarried women with births belong to 35 to 50 years age bracket with 59.4% of them unmarried.
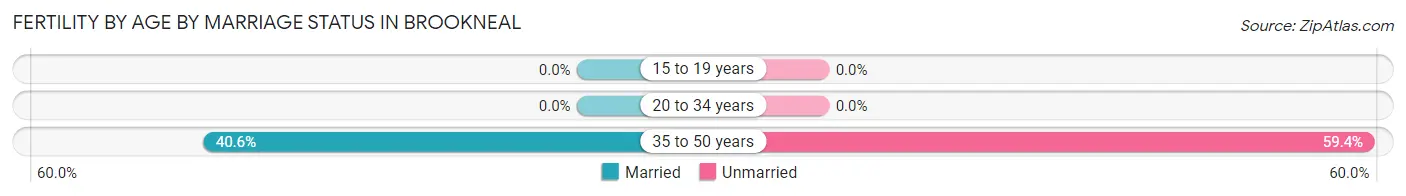
| Age Bracket | Married | Unmarried |
| 15 to 19 years | 0 (0.0%) | 0 (0.0%) |
| 20 to 34 years | 0 (0.0%) | 0 (0.0%) |
| 35 to 50 years | 13 (40.6%) | 19 (59.4%) |
| Total | 13 (40.6%) | 19 (59.4%) |
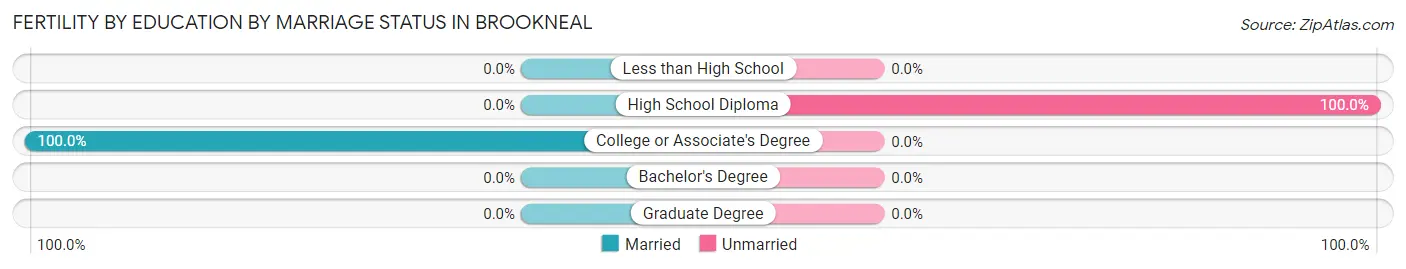
Fertility by Education in Brookneal
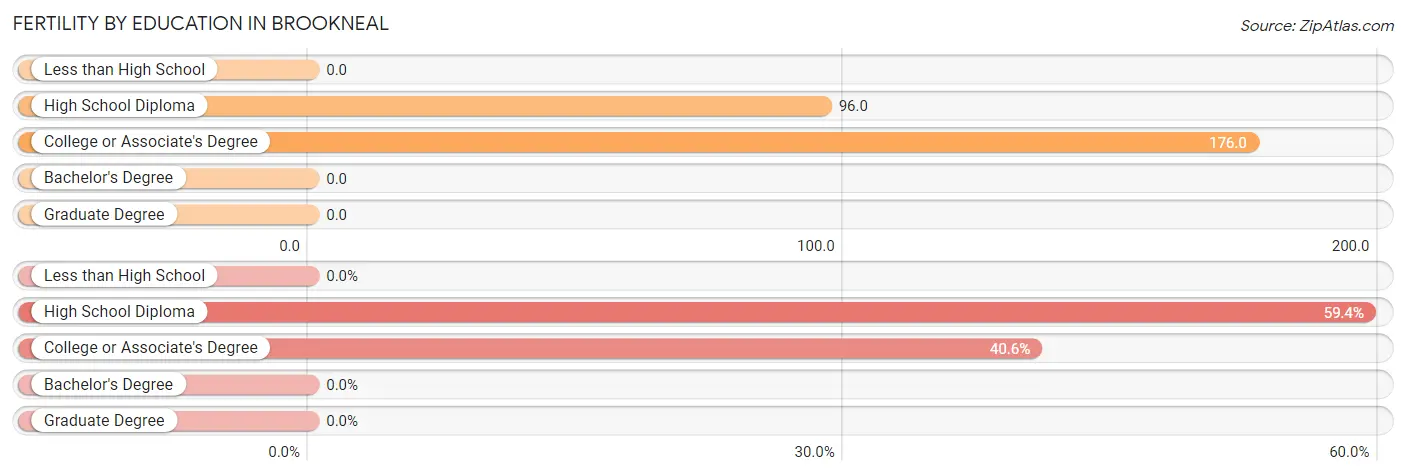
| Educational Attainment | Women with Births | Births / 1,000 Women |
| Less than High School | 0 (0.0%) | 0.0 |
| High School Diploma | 19 (59.4%) | 96.0 |
| College or Associate's Degree | 13 (40.6%) | 176.0 |
| Bachelor's Degree | 0 (0.0%) | 0.0 |
| Graduate Degree | 0 (0.0%) | 0.0 |
| Total | 32 (100.0%) | 97.0 |
Fertility by Education by Marriage Status in Brookneal
59.4% of women with births in Brookneal are unmarried. Women with the educational attainment of college or associate's degree are most likely to be married with 100.0% of them married at childbirth, while women with the educational attainment of high school diploma are least likely to be married with 100.0% of them unmarried at childbirth.
| Educational Attainment | Married | Unmarried |
| Less than High School | 0 (0.0%) | 0 (0.0%) |
| High School Diploma | 0 (0.0%) | 19 (100.0%) |
| College or Associate's Degree | 13 (100.0%) | 0 (0.0%) |
| Bachelor's Degree | 0 (0.0%) | 0 (0.0%) |
| Graduate Degree | 0 (0.0%) | 0 (0.0%) |
| Total | 13 (40.6%) | 19 (59.4%) |
Employment Characteristics in Brookneal
Employment by Class of Employer in Brookneal
Among the 417 employed individuals in Brookneal, private company employees (361 | 86.6%), not-for-profit organizations (16 | 3.8%), and self-employed (not incorporated) (14 | 3.4%) make up the most common classes of employment.
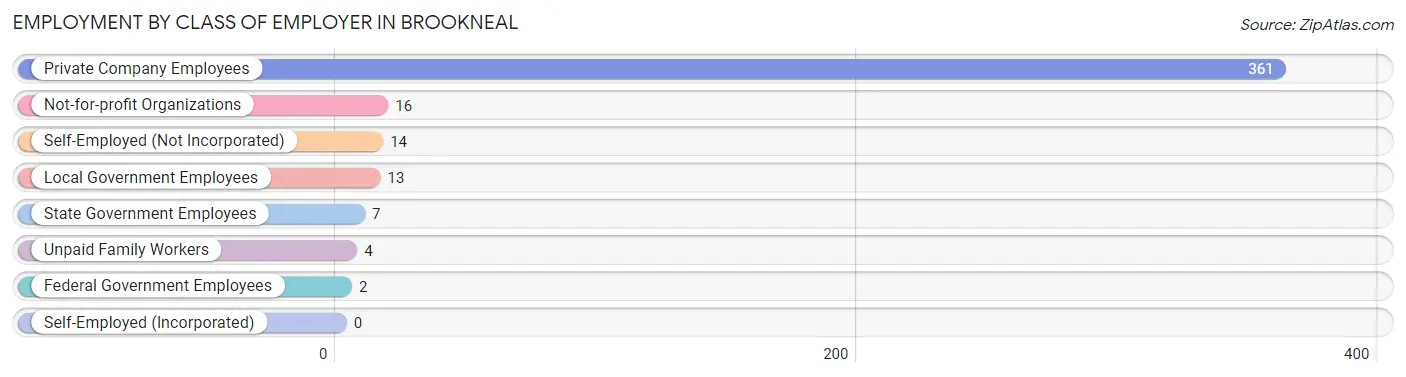
| Employer Class | # Employees | % Employees |
| Private Company Employees | 361 | 86.6% |
| Self-Employed (Incorporated) | 0 | 0.0% |
| Self-Employed (Not Incorporated) | 14 | 3.4% |
| Not-for-profit Organizations | 16 | 3.8% |
| Local Government Employees | 13 | 3.1% |
| State Government Employees | 7 | 1.7% |
| Federal Government Employees | 2 | 0.5% |
| Unpaid Family Workers | 4 | 1.0% |
| Total | 417 | 100.0% |
Employment Status by Age in Brookneal
According to the labor force statistics for Brookneal, out of the total population over 16 years of age (1,008), 45.8% or 462 individuals are in the labor force, with 8.9% or 41 of them unemployed. The age group with the highest labor force participation rate is 20 to 24 years, with 100.0% or 42 individuals in the labor force. Within the labor force, the 75 years and over age range has the highest percentage of unemployed individuals, with 100.0% or 3 of them being unemployed.
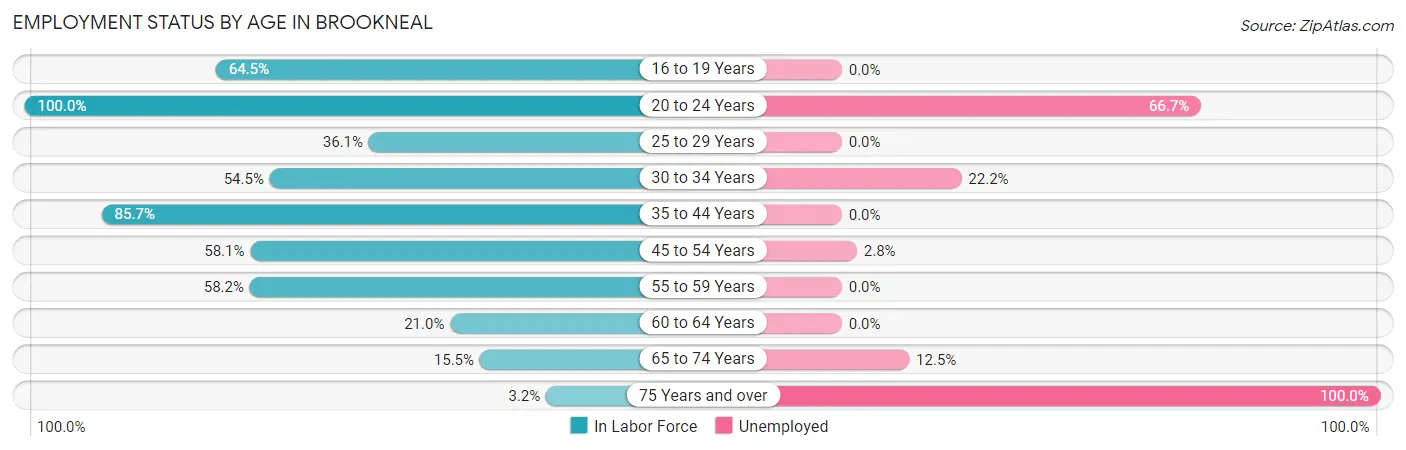
| Age Bracket | In Labor Force | Unemployed |
| 16 to 19 Years | 60 (64.5%) | 0 (0.0%) |
| 20 to 24 Years | 42 (100.0%) | 28 (66.7%) |
| 25 to 29 Years | 26 (36.1%) | 0 (0.0%) |
| 30 to 34 Years | 18 (54.5%) | 4 (22.2%) |
| 35 to 44 Years | 102 (85.7%) | 0 (0.0%) |
| 45 to 54 Years | 108 (58.1%) | 3 (2.8%) |
| 55 to 59 Years | 53 (58.2%) | 0 (0.0%) |
| 60 to 64 Years | 26 (21.0%) | 0 (0.0%) |
| 65 to 74 Years | 24 (15.5%) | 3 (12.5%) |
| 75 Years and over | 3 (3.2%) | 3 (100.0%) |
| Total | 462 (45.8%) | 41 (8.9%) |
Employment Status by Educational Attainment in Brookneal
According to labor force statistics for Brookneal, 53.3% of individuals (333) out of the total population between 25 and 64 years of age (625) are in the labor force, with 2.1% or 7 of them being unemployed. The group with the highest labor force participation rate are those with the educational attainment of bachelor's degree or higher, with 72.1% or 49 individuals in the labor force. Within the labor force, individuals with high school diploma education have the highest percentage of unemployment, with 4.3% or 7 of them being unemployed.
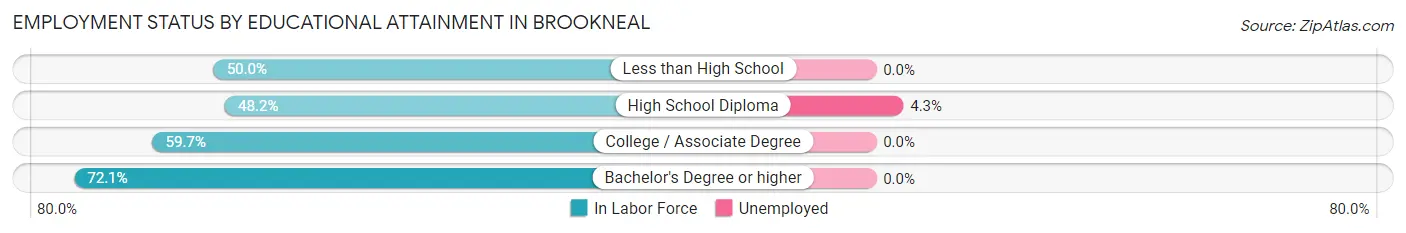
| Educational Attainment | In Labor Force | Unemployed |
| Less than High School | 49 (50.0%) | 0 (0.0%) |
| High School Diploma | 164 (48.2%) | 15 (4.3%) |
| College / Associate Degree | 71 (59.7%) | 0 (0.0%) |
| Bachelor's Degree or higher | 49 (72.1%) | 0 (0.0%) |
| Total | 333 (53.3%) | 13 (2.1%) |
Employment Occupations by Sex in Brookneal
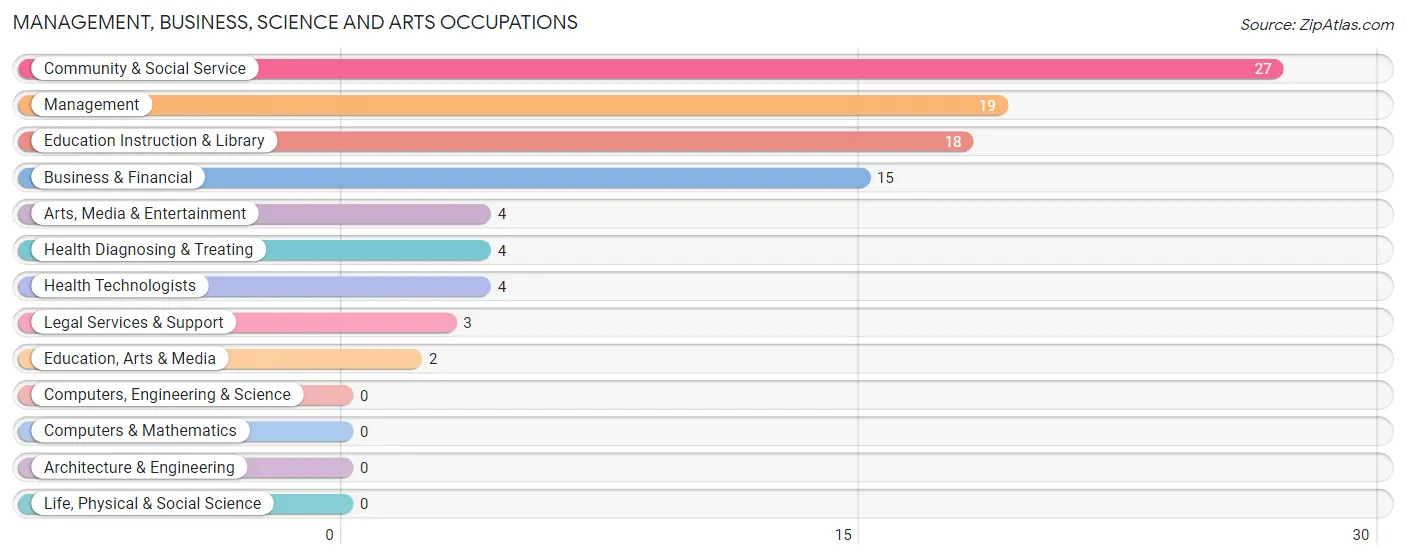
Management, Business, Science and Arts Occupations
The most common Management, Business, Science and Arts occupations in Brookneal are Community & Social Service (27 | 6.4%), Management (19 | 4.5%), Education Instruction & Library (18 | 4.3%), Business & Financial (15 | 3.6%), and Arts, Media & Entertainment (4 | 0.9%).
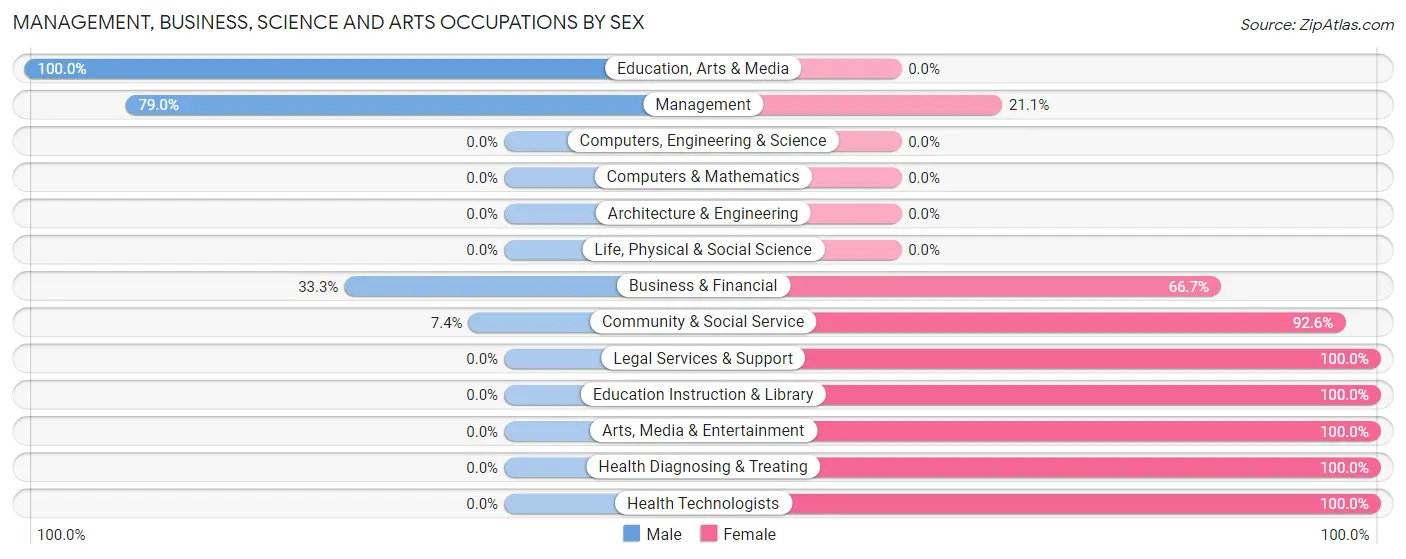
Management, Business, Science and Arts Occupations by Sex
Within the Management, Business, Science and Arts occupations in Brookneal, the most male-oriented occupations are Education, Arts & Media (100.0%), Management (78.9%), and Business & Financial (33.3%), while the most female-oriented occupations are Legal Services & Support (100.0%), Education Instruction & Library (100.0%), and Arts, Media & Entertainment (100.0%).
| Occupation | Male | Female |
| Management | 15 (78.9%) | 4 (21.0%) |
| Business & Financial | 5 (33.3%) | 10 (66.7%) |
| Computers, Engineering & Science | 0 (0.0%) | 0 (0.0%) |
| Computers & Mathematics | 0 (0.0%) | 0 (0.0%) |
| Architecture & Engineering | 0 (0.0%) | 0 (0.0%) |
| Life, Physical & Social Science | 0 (0.0%) | 0 (0.0%) |
| Community & Social Service | 2 (7.4%) | 25 (92.6%) |
| Education, Arts & Media | 2 (100.0%) | 0 (0.0%) |
| Legal Services & Support | 0 (0.0%) | 3 (100.0%) |
| Education Instruction & Library | 0 (0.0%) | 18 (100.0%) |
| Arts, Media & Entertainment | 0 (0.0%) | 4 (100.0%) |
| Health Diagnosing & Treating | 0 (0.0%) | 4 (100.0%) |
| Health Technologists | 0 (0.0%) | 4 (100.0%) |
| Total (Category) | 22 (33.9%) | 43 (66.1%) |
| Total (Overall) | 194 (46.1%) | 227 (53.9%) |
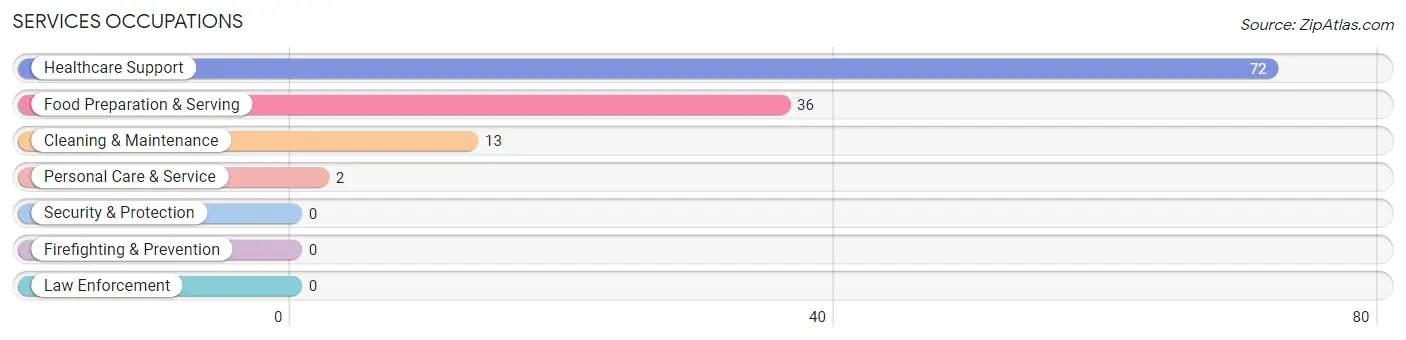
Services Occupations
The most common Services occupations in Brookneal are Healthcare Support (72 | 17.1%), Food Preparation & Serving (36 | 8.6%), Cleaning & Maintenance (13 | 3.1%), and Personal Care & Service (2 | 0.5%).
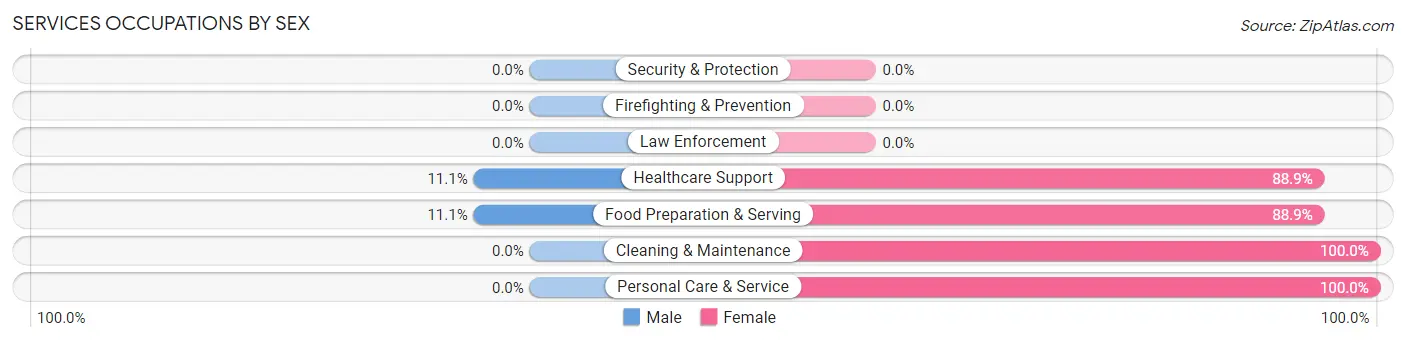
Services Occupations by Sex
Within the Services occupations in Brookneal, the most male-oriented occupations are Healthcare Support (11.1%), and Food Preparation & Serving (11.1%), while the most female-oriented occupations are Cleaning & Maintenance (100.0%), Personal Care & Service (100.0%), and Healthcare Support (88.9%).
| Occupation | Male | Female |
| Healthcare Support | 8 (11.1%) | 64 (88.9%) |
| Security & Protection | 0 (0.0%) | 0 (0.0%) |
| Firefighting & Prevention | 0 (0.0%) | 0 (0.0%) |
| Law Enforcement | 0 (0.0%) | 0 (0.0%) |
| Food Preparation & Serving | 4 (11.1%) | 32 (88.9%) |
| Cleaning & Maintenance | 0 (0.0%) | 13 (100.0%) |
| Personal Care & Service | 0 (0.0%) | 2 (100.0%) |
| Total (Category) | 12 (9.8%) | 111 (90.2%) |
| Total (Overall) | 194 (46.1%) | 227 (53.9%) |
Sales and Office Occupations
The most common Sales and Office occupations in Brookneal are Office & Administration (49 | 11.6%), and Sales & Related (10 | 2.4%).
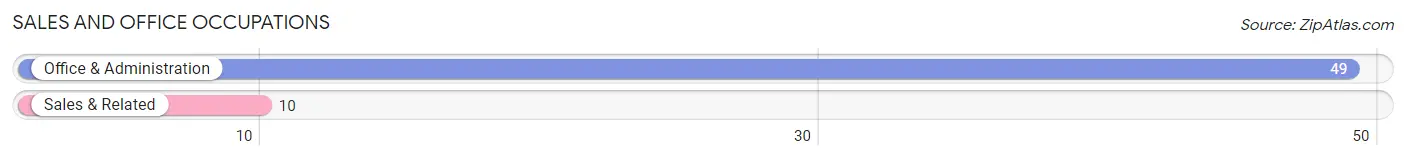
Sales and Office Occupations by Sex
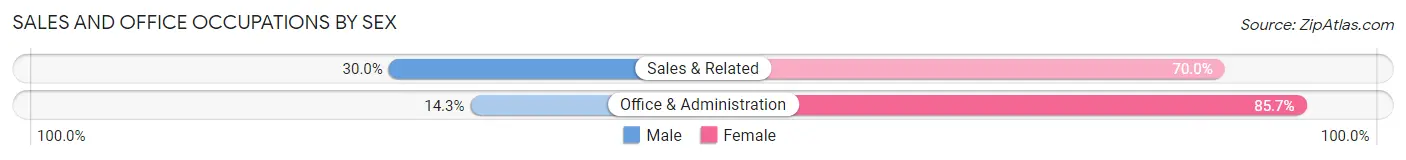
| Occupation | Male | Female |
| Sales & Related | 3 (30.0%) | 7 (70.0%) |
| Office & Administration | 7 (14.3%) | 42 (85.7%) |
| Total (Category) | 10 (17.0%) | 49 (83.1%) |
| Total (Overall) | 194 (46.1%) | 227 (53.9%) |
Natural Resources, Construction and Maintenance Occupations
The most common Natural Resources, Construction and Maintenance occupations in Brookneal are Construction & Extraction (33 | 7.8%), Farming, Fishing & Forestry (7 | 1.7%), and Installation, Maintenance & Repair (5 | 1.2%).
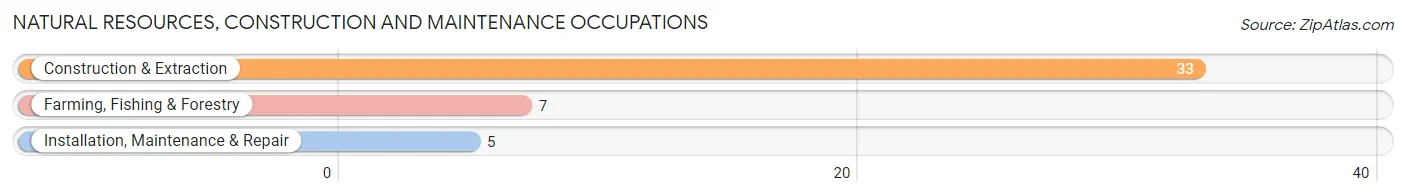
Natural Resources, Construction and Maintenance Occupations by Sex
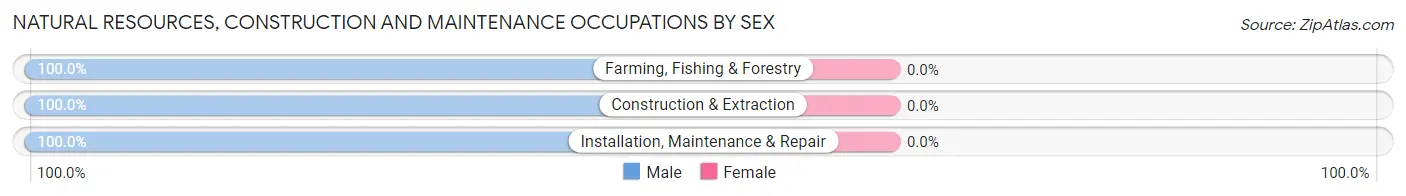
| Occupation | Male | Female |
| Farming, Fishing & Forestry | 7 (100.0%) | 0 (0.0%) |
| Construction & Extraction | 33 (100.0%) | 0 (0.0%) |
| Installation, Maintenance & Repair | 5 (100.0%) | 0 (0.0%) |
| Total (Category) | 45 (100.0%) | 0 (0.0%) |
| Total (Overall) | 194 (46.1%) | 227 (53.9%) |
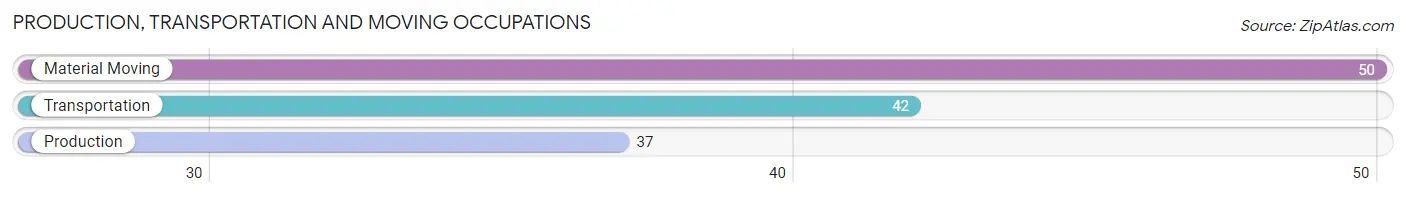
Production, Transportation and Moving Occupations
The most common Production, Transportation and Moving occupations in Brookneal are Material Moving (50 | 11.9%), Transportation (42 | 10.0%), and Production (37 | 8.8%).
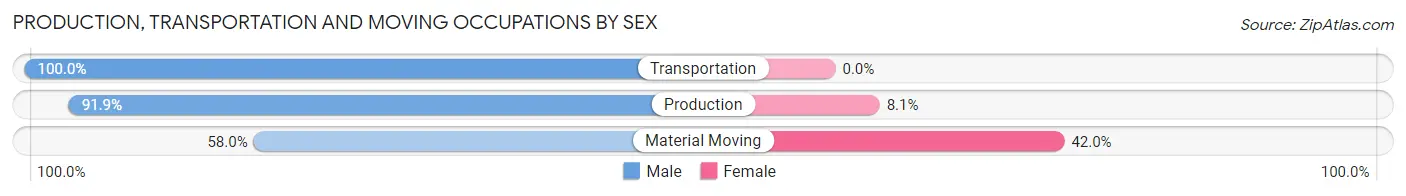
Production, Transportation and Moving Occupations by Sex
| Occupation | Male | Female |
| Production | 34 (91.9%) | 3 (8.1%) |
| Transportation | 42 (100.0%) | 0 (0.0%) |
| Material Moving | 29 (58.0%) | 21 (42.0%) |
| Total (Category) | 105 (81.4%) | 24 (18.6%) |
| Total (Overall) | 194 (46.1%) | 227 (53.9%) |
Employment Industries by Sex in Brookneal
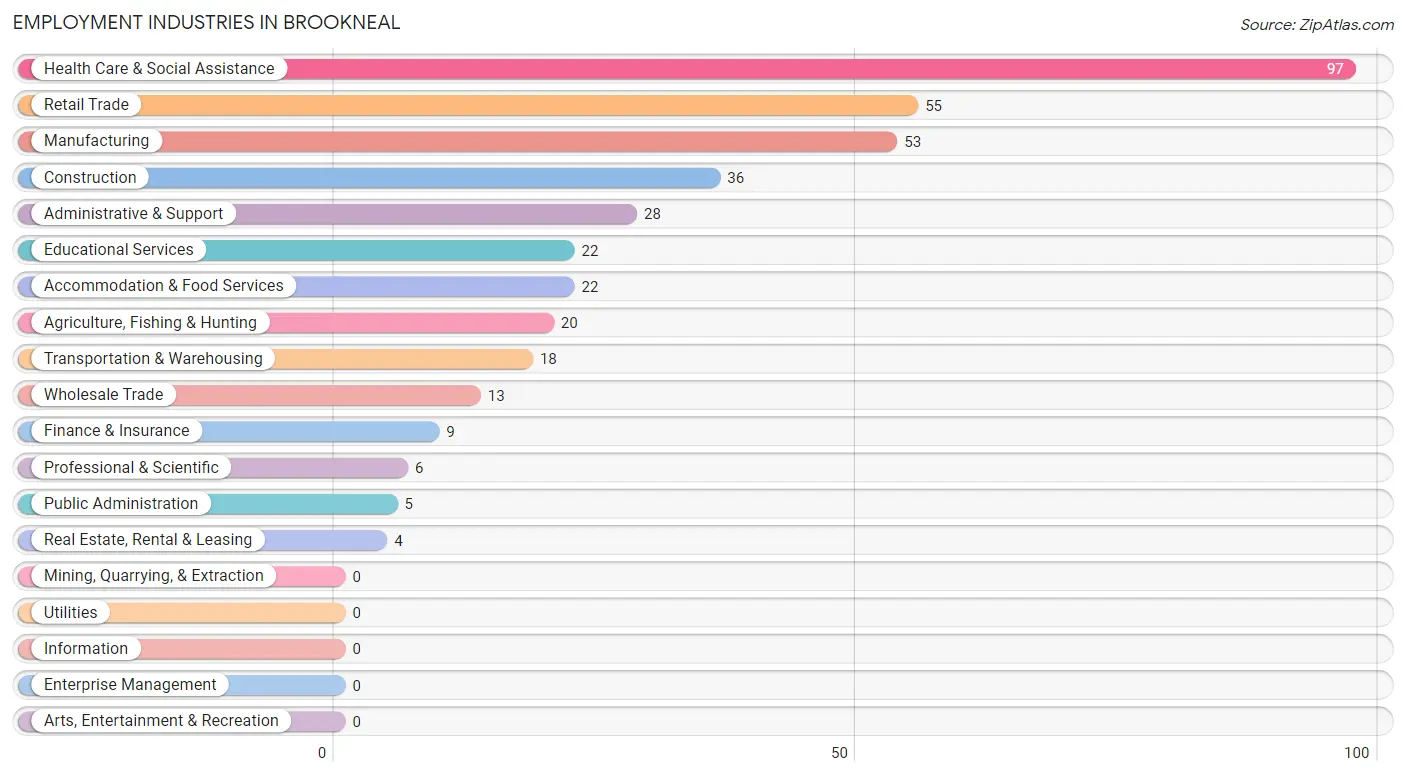
Employment Industries in Brookneal
The major employment industries in Brookneal include Health Care & Social Assistance (97 | 23.0%), Retail Trade (55 | 13.1%), Manufacturing (53 | 12.6%), Construction (36 | 8.6%), and Administrative & Support (28 | 6.7%).
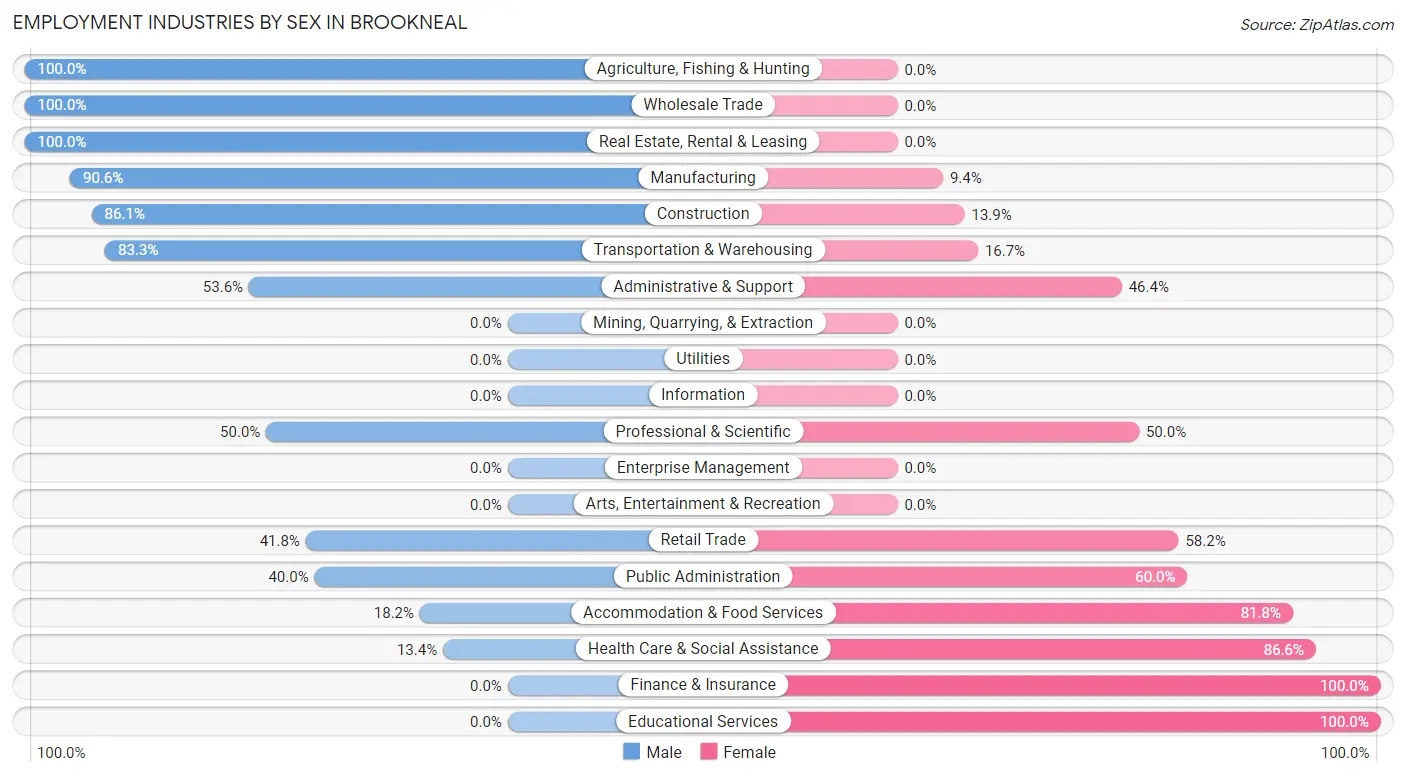
Employment Industries by Sex in Brookneal
The Brookneal industries that see more men than women are Agriculture, Fishing & Hunting (100.0%), Wholesale Trade (100.0%), and Real Estate, Rental & Leasing (100.0%), whereas the industries that tend to have a higher number of women are Finance & Insurance (100.0%), Educational Services (100.0%), and Health Care & Social Assistance (86.6%).
| Industry | Male | Female |
| Agriculture, Fishing & Hunting | 20 (100.0%) | 0 (0.0%) |
| Mining, Quarrying, & Extraction | 0 (0.0%) | 0 (0.0%) |
| Construction | 31 (86.1%) | 5 (13.9%) |
| Manufacturing | 48 (90.6%) | 5 (9.4%) |
| Wholesale Trade | 13 (100.0%) | 0 (0.0%) |
| Retail Trade | 23 (41.8%) | 32 (58.2%) |
| Transportation & Warehousing | 15 (83.3%) | 3 (16.7%) |
| Utilities | 0 (0.0%) | 0 (0.0%) |
| Information | 0 (0.0%) | 0 (0.0%) |
| Finance & Insurance | 0 (0.0%) | 9 (100.0%) |
| Real Estate, Rental & Leasing | 4 (100.0%) | 0 (0.0%) |
| Professional & Scientific | 3 (50.0%) | 3 (50.0%) |
| Enterprise Management | 0 (0.0%) | 0 (0.0%) |
| Administrative & Support | 15 (53.6%) | 13 (46.4%) |
| Educational Services | 0 (0.0%) | 22 (100.0%) |
| Health Care & Social Assistance | 13 (13.4%) | 84 (86.6%) |
| Arts, Entertainment & Recreation | 0 (0.0%) | 0 (0.0%) |
| Accommodation & Food Services | 4 (18.2%) | 18 (81.8%) |
| Public Administration | 2 (40.0%) | 3 (60.0%) |
| Total | 194 (46.1%) | 227 (53.9%) |
Education in Brookneal
School Enrollment in Brookneal
The most common levels of schooling among the 193 students in Brookneal are high school (89 | 46.1%), middle school (54 | 28.0%), and elementary school (34 | 17.6%).
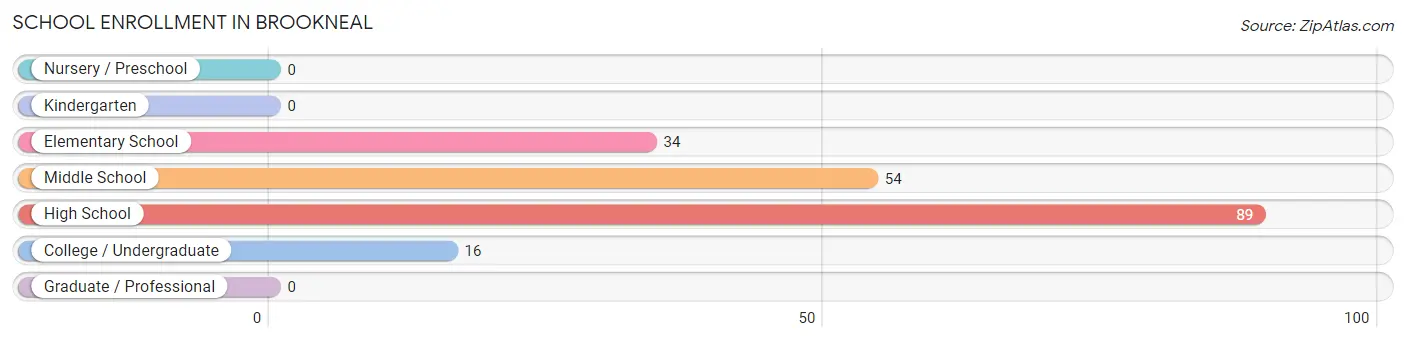
| School Level | # Students | % Students |
| Nursery / Preschool | 0 | 0.0% |
| Kindergarten | 0 | 0.0% |
| Elementary School | 34 | 17.6% |
| Middle School | 54 | 28.0% |
| High School | 89 | 46.1% |
| College / Undergraduate | 16 | 8.3% |
| Graduate / Professional | 0 | 0.0% |
| Total | 193 | 100.0% |
School Enrollment by Age by Funding Source in Brookneal
Out of a total of 193 students who are enrolled in schools in Brookneal, 4 (2.1%) attend a private institution, while the remaining 189 (97.9%) are enrolled in public schools. The age group of 5 to 9 year old has the highest likelihood of being enrolled in private schools, with 4 (11.8% in the age bracket) enrolled. Conversely, the age group of 10 to 14 year olds has the lowest likelihood of being enrolled in a private school, with 72 (100.0% in the age bracket) attending a public institution.
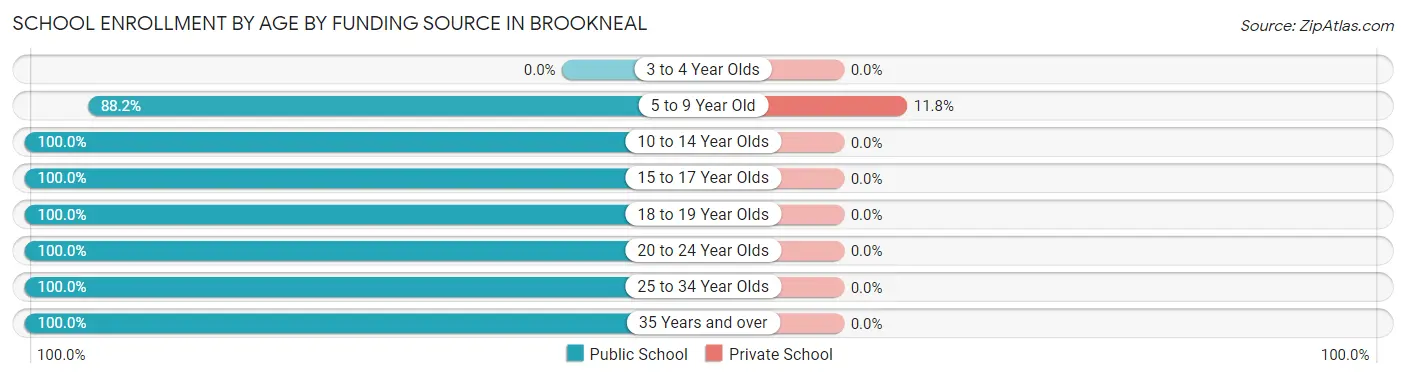
| Age Bracket | Public School | Private School |
| 3 to 4 Year Olds | 0 (0.0%) | 0 (0.0%) |
| 5 to 9 Year Old | 30 (88.2%) | 4 (11.8%) |
| 10 to 14 Year Olds | 72 (100.0%) | 0 (0.0%) |
| 15 to 17 Year Olds | 43 (100.0%) | 0 (0.0%) |
| 18 to 19 Year Olds | 28 (100.0%) | 0 (0.0%) |
| 20 to 24 Year Olds | 2 (100.0%) | 0 (0.0%) |
| 25 to 34 Year Olds | 3 (100.0%) | 0 (0.0%) |
| 35 Years and over | 11 (100.0%) | 0 (0.0%) |
| Total | 189 (97.9%) | 4 (2.1%) |
Educational Attainment by Field of Study in Brookneal
Liberal arts & history (25 | 32.1%), education (18 | 23.1%), business (7 | 9.0%), literature & languages (7 | 9.0%), and engineering (6 | 7.7%) are the most common fields of study among 78 individuals in Brookneal who have obtained a bachelor's degree or higher.
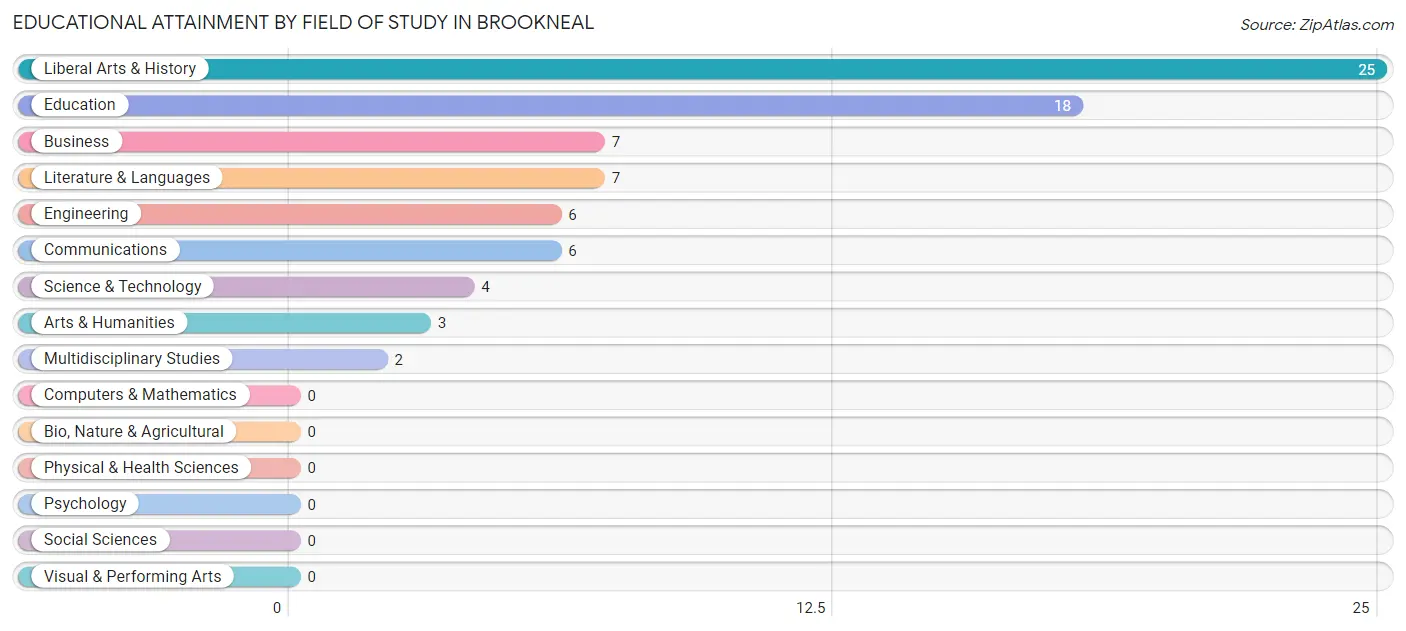
| Field of Study | # Graduates | % Graduates |
| Computers & Mathematics | 0 | 0.0% |
| Bio, Nature & Agricultural | 0 | 0.0% |
| Physical & Health Sciences | 0 | 0.0% |
| Psychology | 0 | 0.0% |
| Social Sciences | 0 | 0.0% |
| Engineering | 6 | 7.7% |
| Multidisciplinary Studies | 2 | 2.6% |
| Science & Technology | 4 | 5.1% |
| Business | 7 | 9.0% |
| Education | 18 | 23.1% |
| Literature & Languages | 7 | 9.0% |
| Liberal Arts & History | 25 | 32.1% |
| Visual & Performing Arts | 0 | 0.0% |
| Communications | 6 | 7.7% |
| Arts & Humanities | 3 | 3.8% |
| Total | 78 | 100.0% |
Transportation & Commute in Brookneal
Vehicle Availability by Sex in Brookneal
The most prevalent vehicle ownership categories in Brookneal are males with 1 vehicle (62, accounting for 32.6%) and females with 1 vehicle (82, making up 27.3%).
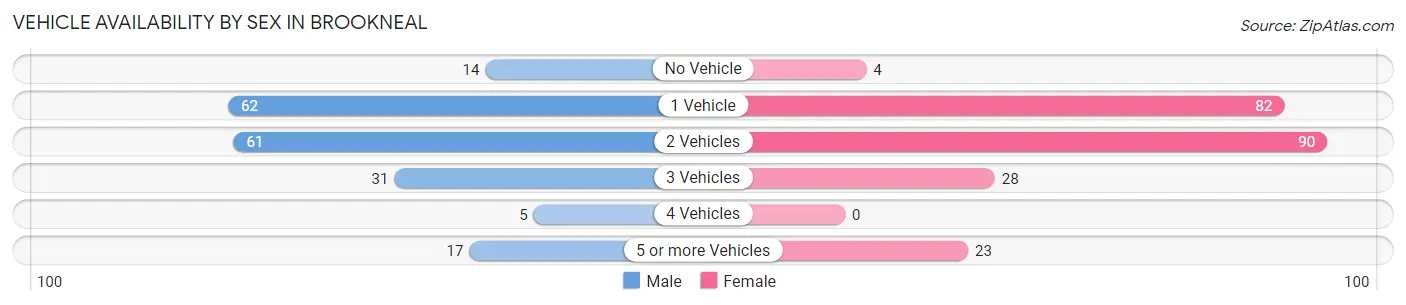
| Vehicles Available | Male | Female |
| No Vehicle | 14 (7.4%) | 4 (1.8%) |
| 1 Vehicle | 62 (32.6%) | 82 (36.1%) |
| 2 Vehicles | 61 (32.1%) | 90 (39.7%) |
| 3 Vehicles | 31 (16.3%) | 28 (12.3%) |
| 4 Vehicles | 5 (2.6%) | 0 (0.0%) |
| 5 or more Vehicles | 17 (8.9%) | 23 (10.1%) |
| Total | 190 (100.0%) | 227 (100.0%) |
Commute Time in Brookneal
The most frequently occuring commute durations in Brookneal are 5 to 9 minutes (98 commuters, 25.5%), 45 to 59 minutes (88 commuters, 22.9%), and 60 to 89 minutes (47 commuters, 12.2%).
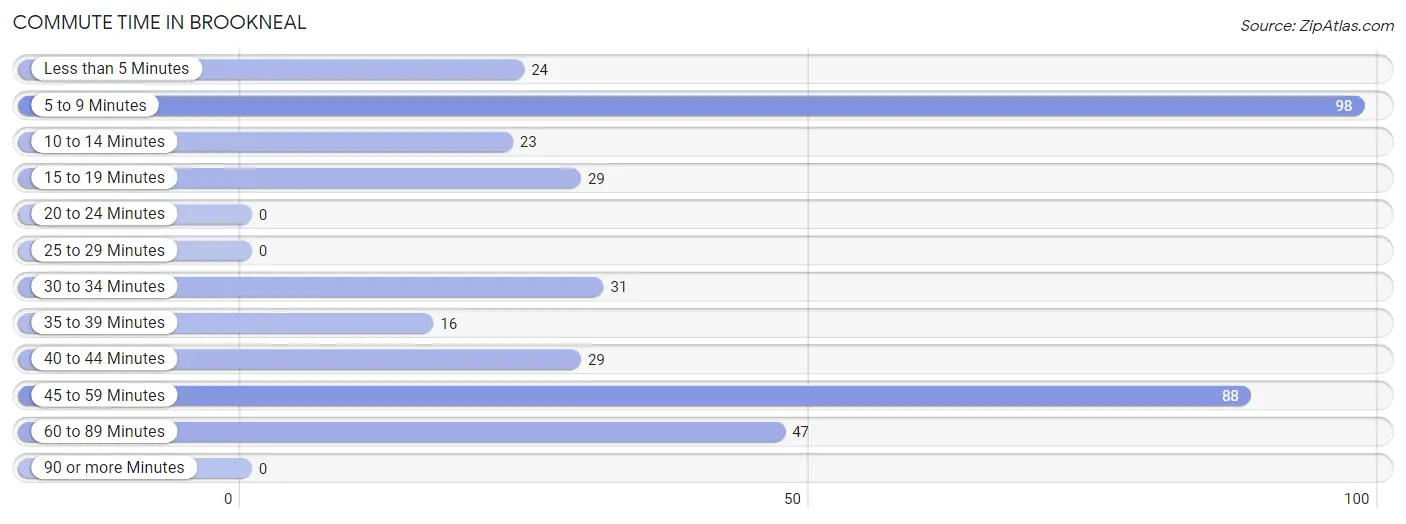
| Commute Time | # Commuters | % Commuters |
| Less than 5 Minutes | 24 | 6.2% |
| 5 to 9 Minutes | 98 | 25.5% |
| 10 to 14 Minutes | 23 | 6.0% |
| 15 to 19 Minutes | 29 | 7.5% |
| 20 to 24 Minutes | 0 | 0.0% |
| 25 to 29 Minutes | 0 | 0.0% |
| 30 to 34 Minutes | 31 | 8.1% |
| 35 to 39 Minutes | 16 | 4.2% |
| 40 to 44 Minutes | 29 | 7.5% |
| 45 to 59 Minutes | 88 | 22.9% |
| 60 to 89 Minutes | 47 | 12.2% |
| 90 or more Minutes | 0 | 0.0% |
Commute Time by Sex in Brookneal
The most common commute times in Brookneal are 45 to 59 minutes (38 commuters, 22.9%) for males and 5 to 9 minutes (68 commuters, 31.0%) for females.
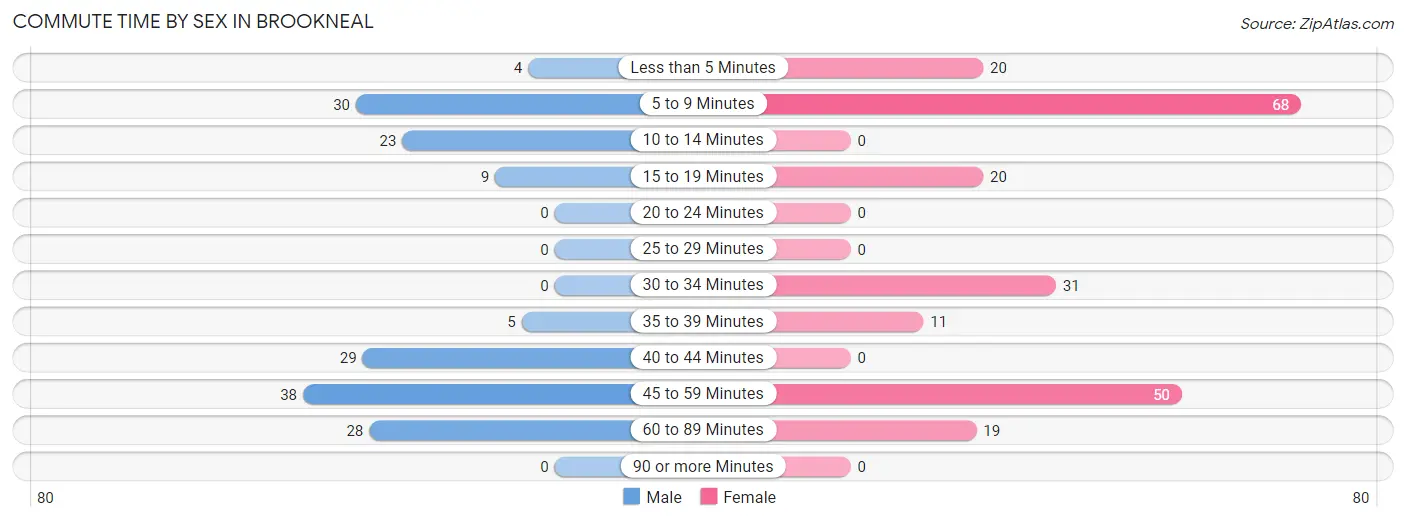
| Commute Time | Male | Female |
| Less than 5 Minutes | 4 (2.4%) | 20 (9.1%) |
| 5 to 9 Minutes | 30 (18.1%) | 68 (31.0%) |
| 10 to 14 Minutes | 23 (13.9%) | 0 (0.0%) |
| 15 to 19 Minutes | 9 (5.4%) | 20 (9.1%) |
| 20 to 24 Minutes | 0 (0.0%) | 0 (0.0%) |
| 25 to 29 Minutes | 0 (0.0%) | 0 (0.0%) |
| 30 to 34 Minutes | 0 (0.0%) | 31 (14.2%) |
| 35 to 39 Minutes | 5 (3.0%) | 11 (5.0%) |
| 40 to 44 Minutes | 29 (17.5%) | 0 (0.0%) |
| 45 to 59 Minutes | 38 (22.9%) | 50 (22.8%) |
| 60 to 89 Minutes | 28 (16.9%) | 19 (8.7%) |
| 90 or more Minutes | 0 (0.0%) | 0 (0.0%) |
Time of Departure to Work by Sex in Brookneal
The most frequent times of departure to work in Brookneal are 6:00 AM to 6:29 AM (30, 18.1%) for males and 7:00 AM to 7:29 AM (80, 36.5%) for females.
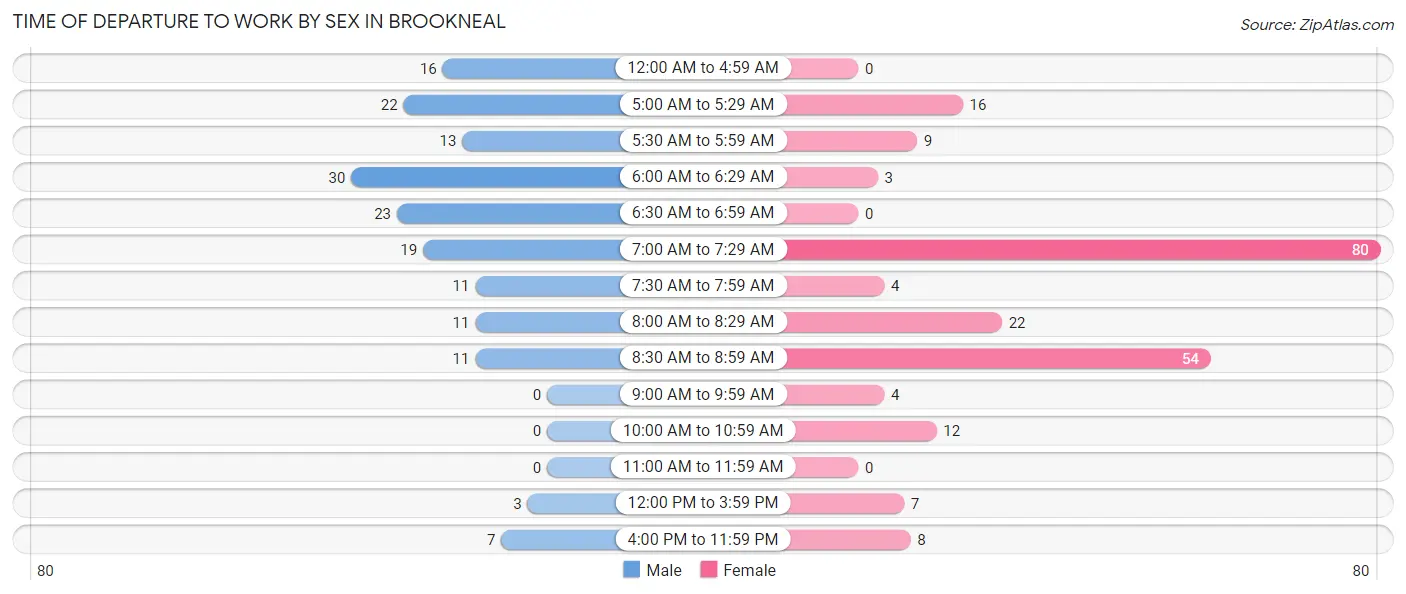
| Time of Departure | Male | Female |
| 12:00 AM to 4:59 AM | 16 (9.6%) | 0 (0.0%) |
| 5:00 AM to 5:29 AM | 22 (13.3%) | 16 (7.3%) |
| 5:30 AM to 5:59 AM | 13 (7.8%) | 9 (4.1%) |
| 6:00 AM to 6:29 AM | 30 (18.1%) | 3 (1.4%) |
| 6:30 AM to 6:59 AM | 23 (13.9%) | 0 (0.0%) |
| 7:00 AM to 7:29 AM | 19 (11.5%) | 80 (36.5%) |
| 7:30 AM to 7:59 AM | 11 (6.6%) | 4 (1.8%) |
| 8:00 AM to 8:29 AM | 11 (6.6%) | 22 (10.1%) |
| 8:30 AM to 8:59 AM | 11 (6.6%) | 54 (24.7%) |
| 9:00 AM to 9:59 AM | 0 (0.0%) | 4 (1.8%) |
| 10:00 AM to 10:59 AM | 0 (0.0%) | 12 (5.5%) |
| 11:00 AM to 11:59 AM | 0 (0.0%) | 0 (0.0%) |
| 12:00 PM to 3:59 PM | 3 (1.8%) | 7 (3.2%) |
| 4:00 PM to 11:59 PM | 7 (4.2%) | 8 (3.6%) |
| Total | 166 (100.0%) | 219 (100.0%) |
Housing Occupancy in Brookneal
Occupancy by Ownership in Brookneal
Of the total 483 dwellings in Brookneal, owner-occupied units account for 277 (57.4%), while renter-occupied units make up 206 (42.6%).
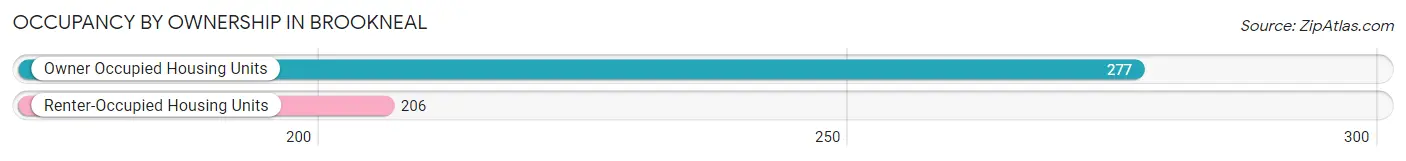
| Occupancy | # Housing Units | % Housing Units |
| Owner Occupied Housing Units | 277 | 57.4% |
| Renter-Occupied Housing Units | 206 | 42.6% |
| Total Occupied Housing Units | 483 | 100.0% |
Occupancy by Household Size in Brookneal
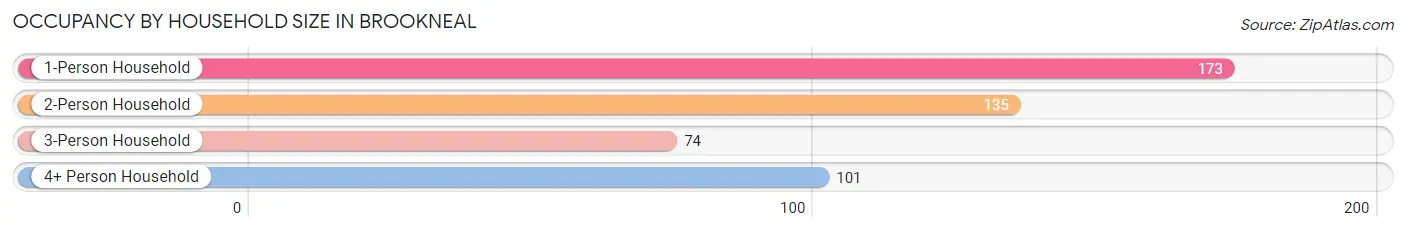
| Household Size | # Housing Units | % Housing Units |
| 1-Person Household | 173 | 35.8% |
| 2-Person Household | 135 | 28.0% |
| 3-Person Household | 74 | 15.3% |
| 4+ Person Household | 101 | 20.9% |
| Total Housing Units | 483 | 100.0% |
Occupancy by Ownership by Household Size in Brookneal
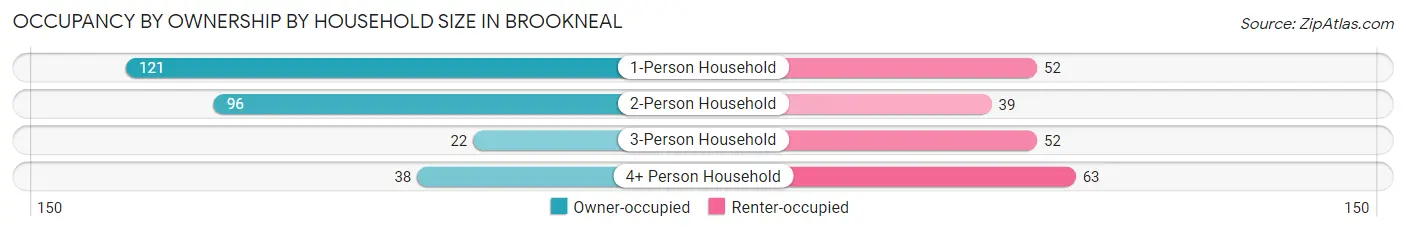
| Household Size | Owner-occupied | Renter-occupied |
| 1-Person Household | 121 (69.9%) | 52 (30.1%) |
| 2-Person Household | 96 (71.1%) | 39 (28.9%) |
| 3-Person Household | 22 (29.7%) | 52 (70.3%) |
| 4+ Person Household | 38 (37.6%) | 63 (62.4%) |
| Total Housing Units | 277 (57.4%) | 206 (42.6%) |
Occupancy by Educational Attainment in Brookneal
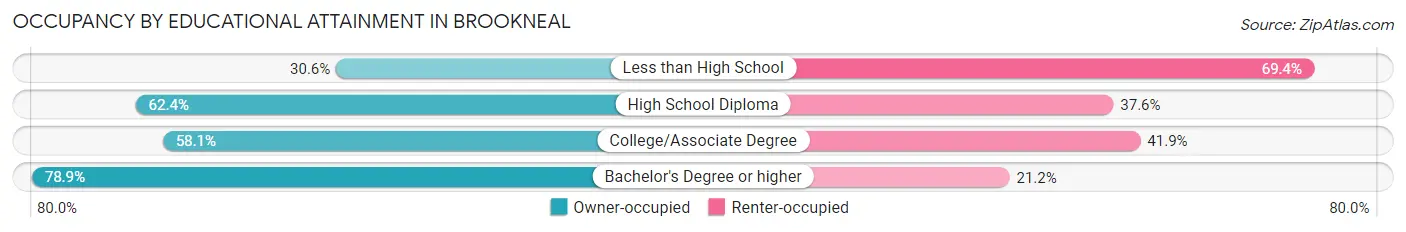
| Household Size | Owner-occupied | Renter-occupied |
| Less than High School | 26 (30.6%) | 59 (69.4%) |
| High School Diploma | 131 (62.4%) | 79 (37.6%) |
| College/Associate Degree | 79 (58.1%) | 57 (41.9%) |
| Bachelor's Degree or higher | 41 (78.8%) | 11 (21.1%) |
Occupancy by Age of Householder in Brookneal
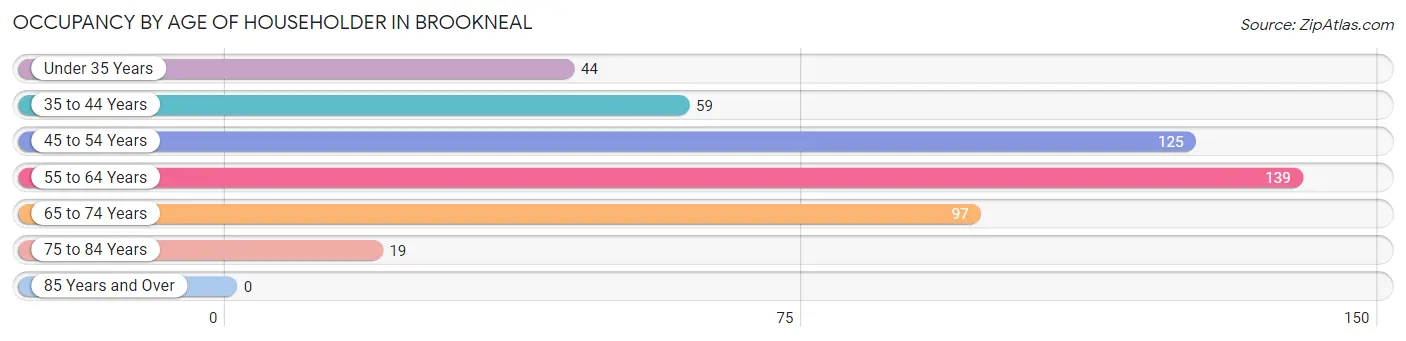
| Age Bracket | # Households | % Households |
| Under 35 Years | 44 | 9.1% |
| 35 to 44 Years | 59 | 12.2% |
| 45 to 54 Years | 125 | 25.9% |
| 55 to 64 Years | 139 | 28.8% |
| 65 to 74 Years | 97 | 20.1% |
| 75 to 84 Years | 19 | 3.9% |
| 85 Years and Over | 0 | 0.0% |
| Total | 483 | 100.0% |
Housing Finances in Brookneal
Median Income by Occupancy in Brookneal
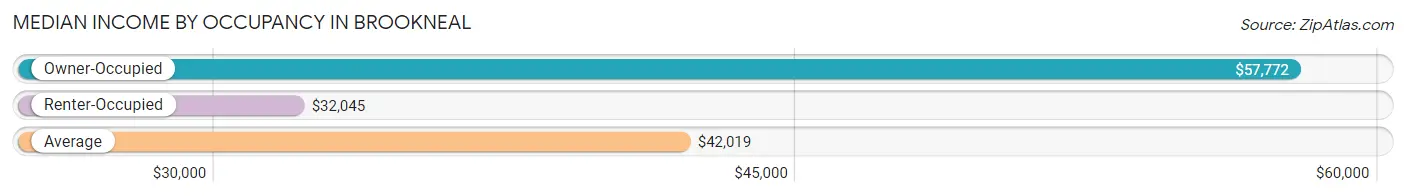
| Occupancy Type | # Households | Median Income |
| Owner-Occupied | 277 (57.4%) | $57,772 |
| Renter-Occupied | 206 (42.6%) | $32,045 |
| Average | 483 (100.0%) | $42,019 |
Occupancy by Householder Income Bracket in Brookneal
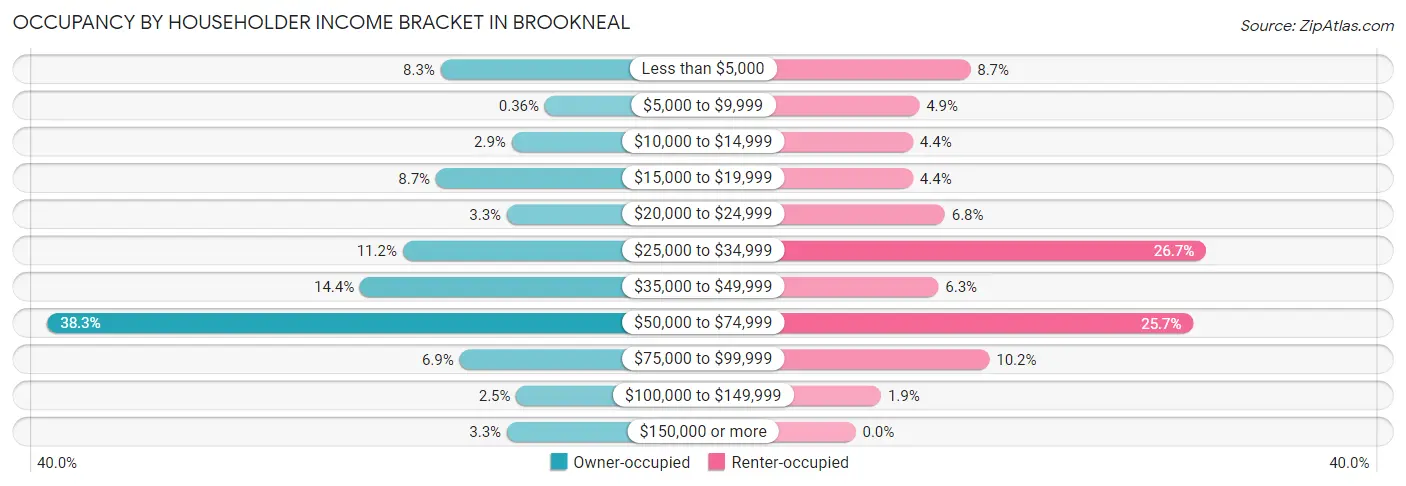
| Income Bracket | Owner-occupied | Renter-occupied |
| Less than $5,000 | 23 (8.3%) | 18 (8.7%) |
| $5,000 to $9,999 | 1 (0.4%) | 10 (4.9%) |
| $10,000 to $14,999 | 8 (2.9%) | 9 (4.4%) |
| $15,000 to $19,999 | 24 (8.7%) | 9 (4.4%) |
| $20,000 to $24,999 | 9 (3.3%) | 14 (6.8%) |
| $25,000 to $34,999 | 31 (11.2%) | 55 (26.7%) |
| $35,000 to $49,999 | 40 (14.4%) | 13 (6.3%) |
| $50,000 to $74,999 | 106 (38.3%) | 53 (25.7%) |
| $75,000 to $99,999 | 19 (6.9%) | 21 (10.2%) |
| $100,000 to $149,999 | 7 (2.5%) | 4 (1.9%) |
| $150,000 or more | 9 (3.3%) | 0 (0.0%) |
| Total | 277 (100.0%) | 206 (100.0%) |
Monthly Housing Cost Tiers in Brookneal
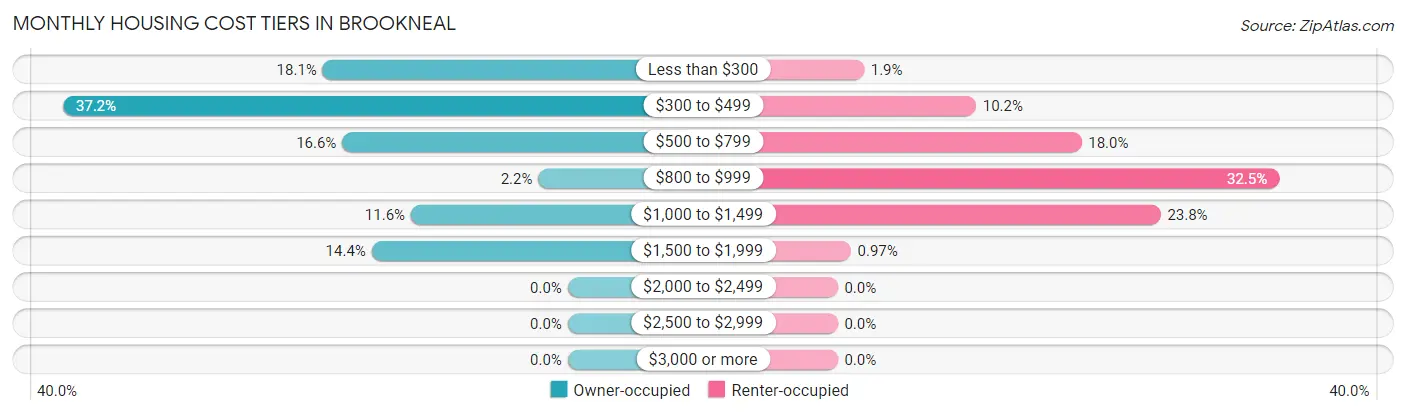
| Monthly Cost | Owner-occupied | Renter-occupied |
| Less than $300 | 50 (18.0%) | 4 (1.9%) |
| $300 to $499 | 103 (37.2%) | 21 (10.2%) |
| $500 to $799 | 46 (16.6%) | 37 (18.0%) |
| $800 to $999 | 6 (2.2%) | 67 (32.5%) |
| $1,000 to $1,499 | 32 (11.6%) | 49 (23.8%) |
| $1,500 to $1,999 | 40 (14.4%) | 2 (1.0%) |
| $2,000 to $2,499 | 0 (0.0%) | 0 (0.0%) |
| $2,500 to $2,999 | 0 (0.0%) | 0 (0.0%) |
| $3,000 or more | 0 (0.0%) | 0 (0.0%) |
| Total | 277 (100.0%) | 206 (100.0%) |
Physical Housing Characteristics in Brookneal
Housing Structures in Brookneal
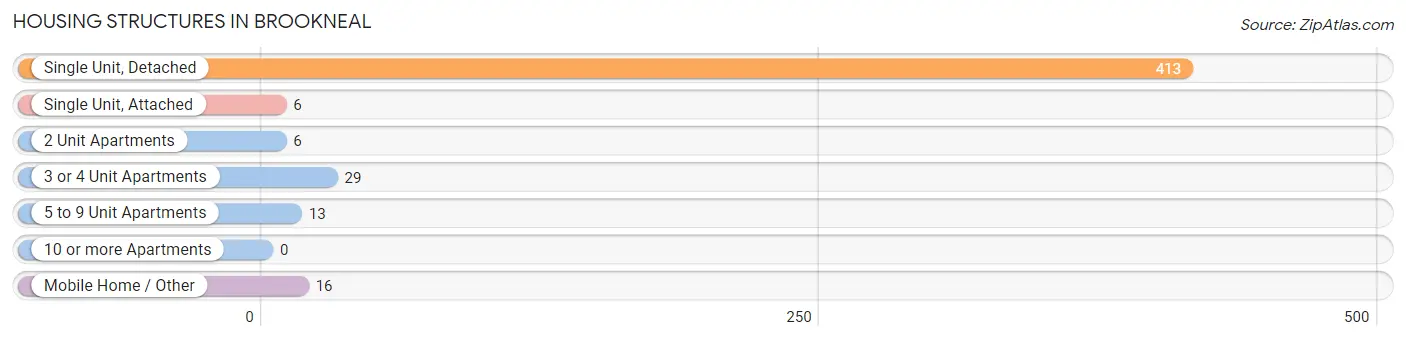
| Structure Type | # Housing Units | % Housing Units |
| Single Unit, Detached | 413 | 85.5% |
| Single Unit, Attached | 6 | 1.2% |
| 2 Unit Apartments | 6 | 1.2% |
| 3 or 4 Unit Apartments | 29 | 6.0% |
| 5 to 9 Unit Apartments | 13 | 2.7% |
| 10 or more Apartments | 0 | 0.0% |
| Mobile Home / Other | 16 | 3.3% |
| Total | 483 | 100.0% |
Housing Structures by Occupancy in Brookneal
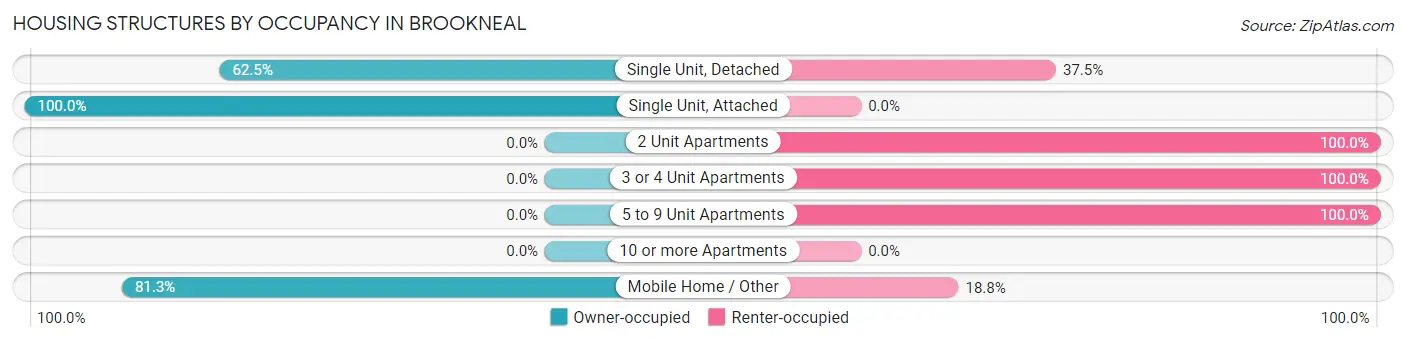
| Structure Type | Owner-occupied | Renter-occupied |
| Single Unit, Detached | 258 (62.5%) | 155 (37.5%) |
| Single Unit, Attached | 6 (100.0%) | 0 (0.0%) |
| 2 Unit Apartments | 0 (0.0%) | 6 (100.0%) |
| 3 or 4 Unit Apartments | 0 (0.0%) | 29 (100.0%) |
| 5 to 9 Unit Apartments | 0 (0.0%) | 13 (100.0%) |
| 10 or more Apartments | 0 (0.0%) | 0 (0.0%) |
| Mobile Home / Other | 13 (81.2%) | 3 (18.8%) |
| Total | 277 (57.4%) | 206 (42.6%) |
Housing Structures by Number of Rooms in Brookneal
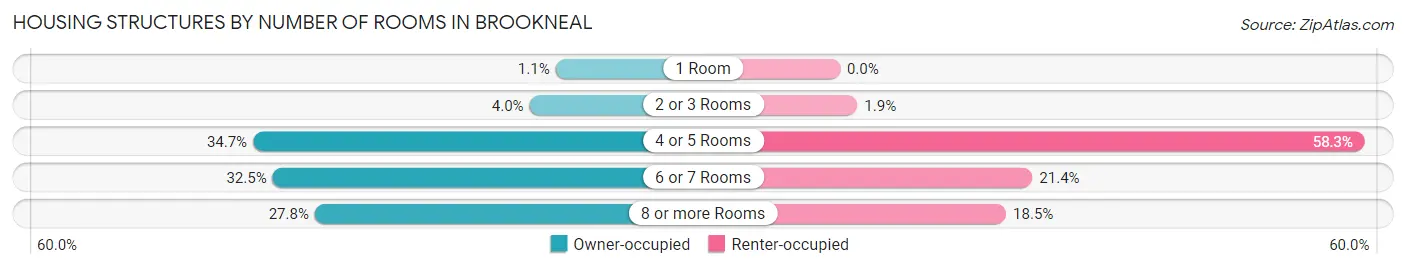
| Number of Rooms | Owner-occupied | Renter-occupied |
| 1 Room | 3 (1.1%) | 0 (0.0%) |
| 2 or 3 Rooms | 11 (4.0%) | 4 (1.9%) |
| 4 or 5 Rooms | 96 (34.7%) | 120 (58.3%) |
| 6 or 7 Rooms | 90 (32.5%) | 44 (21.4%) |
| 8 or more Rooms | 77 (27.8%) | 38 (18.4%) |
| Total | 277 (100.0%) | 206 (100.0%) |
Housing Structure by Heating Type in Brookneal
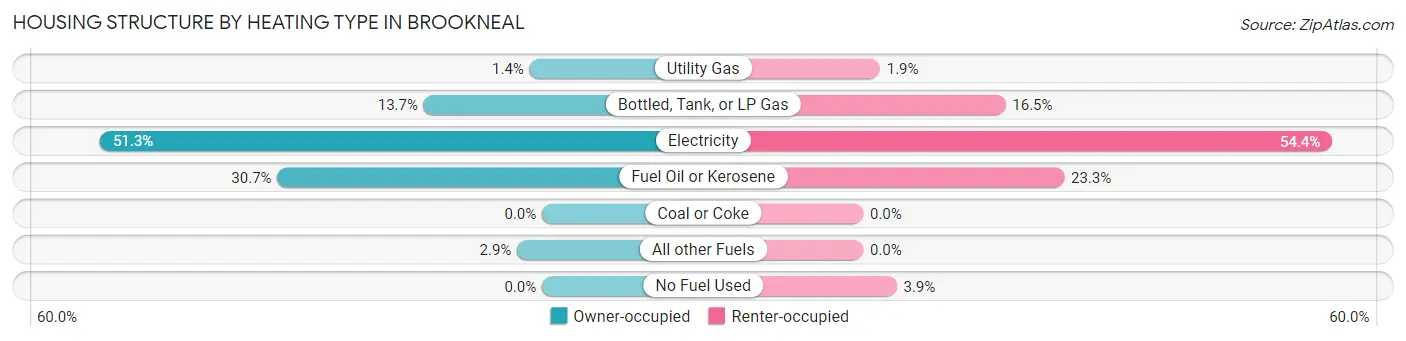
| Heating Type | Owner-occupied | Renter-occupied |
| Utility Gas | 4 (1.4%) | 4 (1.9%) |
| Bottled, Tank, or LP Gas | 38 (13.7%) | 34 (16.5%) |
| Electricity | 142 (51.3%) | 112 (54.4%) |
| Fuel Oil or Kerosene | 85 (30.7%) | 48 (23.3%) |
| Coal or Coke | 0 (0.0%) | 0 (0.0%) |
| All other Fuels | 8 (2.9%) | 0 (0.0%) |
| No Fuel Used | 0 (0.0%) | 8 (3.9%) |
| Total | 277 (100.0%) | 206 (100.0%) |
Household Vehicle Usage in Brookneal
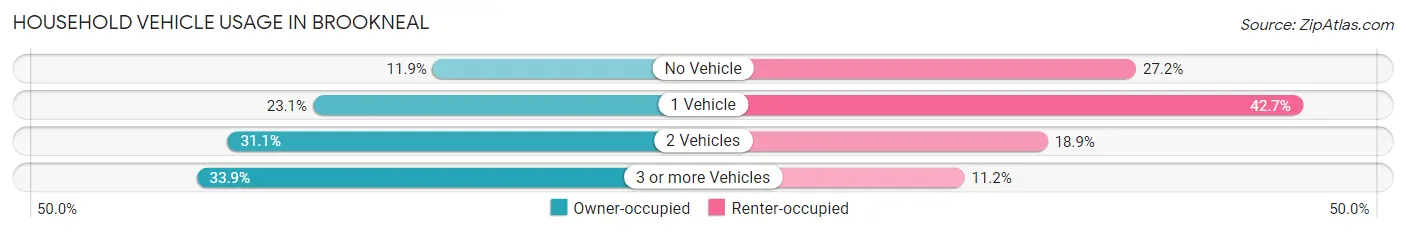
| Vehicles per Household | Owner-occupied | Renter-occupied |
| No Vehicle | 33 (11.9%) | 56 (27.2%) |
| 1 Vehicle | 64 (23.1%) | 88 (42.7%) |
| 2 Vehicles | 86 (31.0%) | 39 (18.9%) |
| 3 or more Vehicles | 94 (33.9%) | 23 (11.2%) |
| Total | 277 (100.0%) | 206 (100.0%) |
Real Estate & Mortgages in Brookneal
Real Estate and Mortgage Overview in Brookneal
| Characteristic | Without Mortgage | With Mortgage |
| Housing Units | 152 | 125 |
| Median Property Value | $76,500 | $144,500 |
| Median Household Income | $36,333 | $3 |
| Monthly Housing Costs | $325 | $0 |
| Real Estate Taxes | $418 | $0 |
Property Value by Mortgage Status in Brookneal
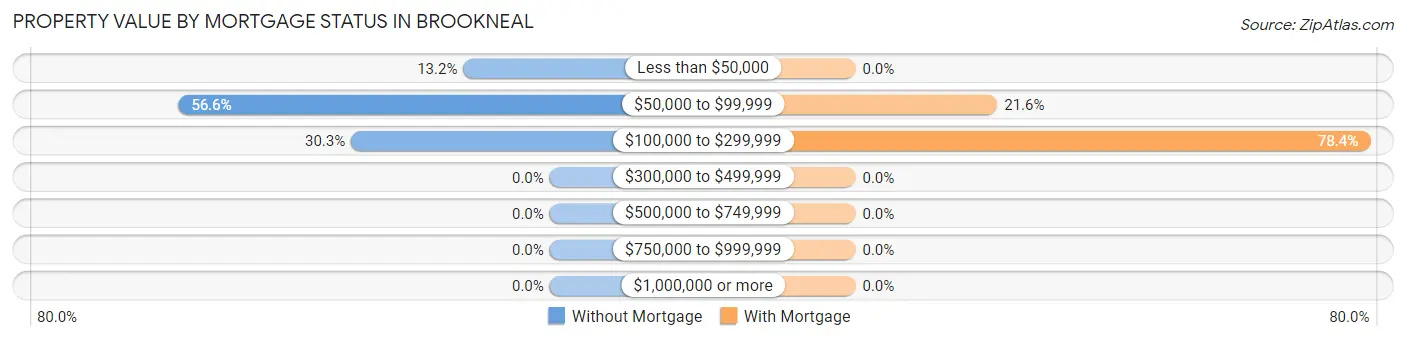
| Property Value | Without Mortgage | With Mortgage |
| Less than $50,000 | 20 (13.2%) | 0 (0.0%) |
| $50,000 to $99,999 | 86 (56.6%) | 27 (21.6%) |
| $100,000 to $299,999 | 46 (30.3%) | 98 (78.4%) |
| $300,000 to $499,999 | 0 (0.0%) | 0 (0.0%) |
| $500,000 to $749,999 | 0 (0.0%) | 0 (0.0%) |
| $750,000 to $999,999 | 0 (0.0%) | 0 (0.0%) |
| $1,000,000 or more | 0 (0.0%) | 0 (0.0%) |
| Total | 152 (100.0%) | 125 (100.0%) |
Household Income by Mortgage Status in Brookneal
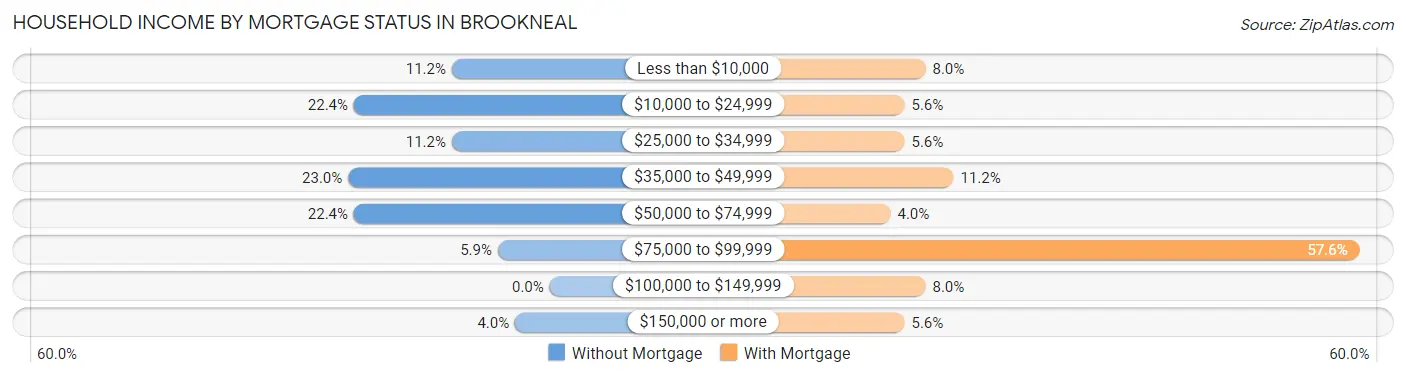
| Household Income | Without Mortgage | With Mortgage |
| Less than $10,000 | 17 (11.2%) | 10 (8.0%) |
| $10,000 to $24,999 | 34 (22.4%) | 7 (5.6%) |
| $25,000 to $34,999 | 17 (11.2%) | 7 (5.6%) |
| $35,000 to $49,999 | 35 (23.0%) | 14 (11.2%) |
| $50,000 to $74,999 | 34 (22.4%) | 5 (4.0%) |
| $75,000 to $99,999 | 9 (5.9%) | 72 (57.6%) |
| $100,000 to $149,999 | 0 (0.0%) | 10 (8.0%) |
| $150,000 or more | 6 (4.0%) | 7 (5.6%) |
| Total | 152 (100.0%) | 125 (100.0%) |
Property Value to Household Income Ratio in Brookneal
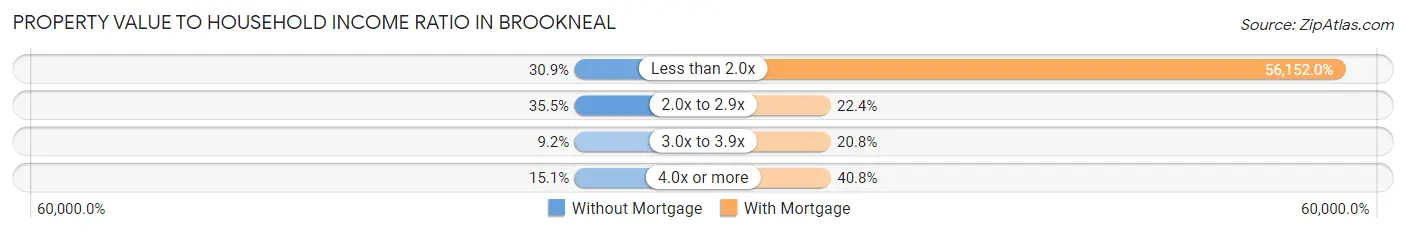
| Value-to-Income Ratio | Without Mortgage | With Mortgage |
| Less than 2.0x | 47 (30.9%) | 70,190 (56,152.0%) |
| 2.0x to 2.9x | 54 (35.5%) | 28 (22.4%) |
| 3.0x to 3.9x | 14 (9.2%) | 26 (20.8%) |
| 4.0x or more | 23 (15.1%) | 51 (40.8%) |
| Total | 152 (100.0%) | 125 (100.0%) |
Real Estate Taxes by Mortgage Status in Brookneal
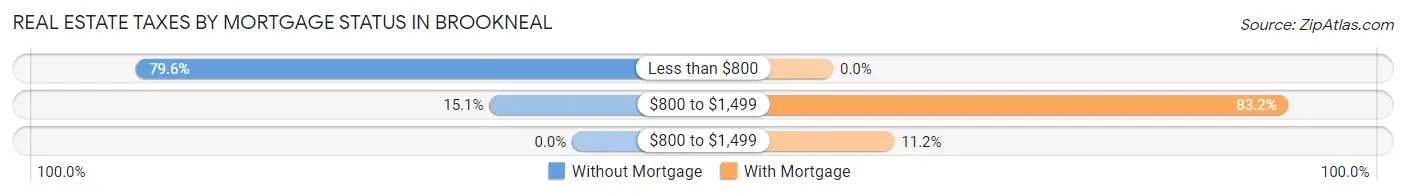
| Property Taxes | Without Mortgage | With Mortgage |
| Less than $800 | 121 (79.6%) | 0 (0.0%) |
| $800 to $1,499 | 23 (15.1%) | 104 (83.2%) |
| $800 to $1,499 | 0 (0.0%) | 14 (11.2%) |
| Total | 152 (100.0%) | 125 (100.0%) |
Health & Disability in Brookneal
Health Insurance Coverage by Age in Brookneal
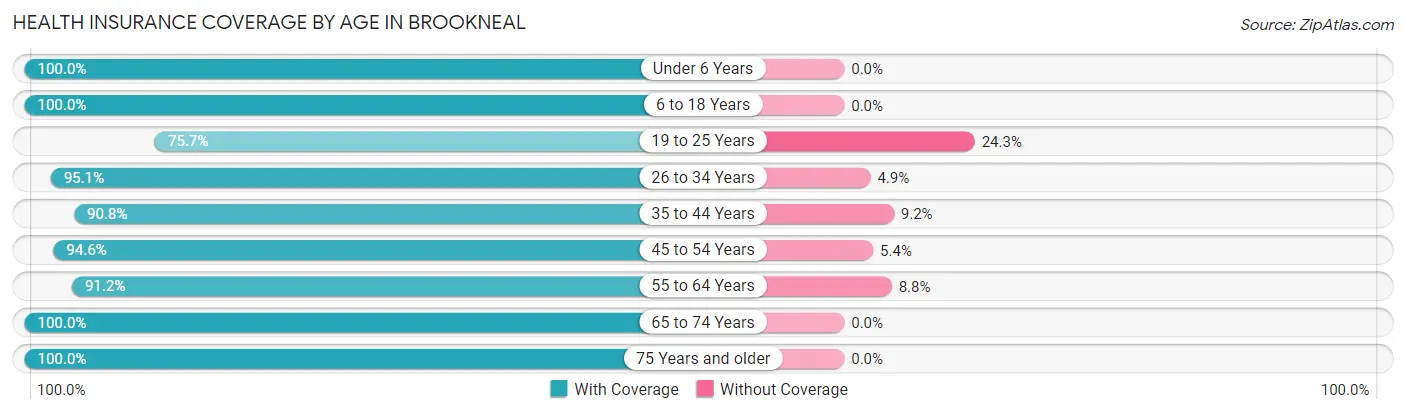
| Age Bracket | With Coverage | Without Coverage |
| Under 6 Years | 69 (100.0%) | 0 (0.0%) |
| 6 to 18 Years | 195 (100.0%) | 0 (0.0%) |
| 19 to 25 Years | 84 (75.7%) | 27 (24.3%) |
| 26 to 34 Years | 78 (95.1%) | 4 (4.9%) |
| 35 to 44 Years | 108 (90.8%) | 11 (9.2%) |
| 45 to 54 Years | 176 (94.6%) | 10 (5.4%) |
| 55 to 64 Years | 196 (91.2%) | 19 (8.8%) |
| 65 to 74 Years | 146 (100.0%) | 0 (0.0%) |
| 75 Years and older | 50 (100.0%) | 0 (0.0%) |
| Total | 1,102 (94.0%) | 71 (6.0%) |
Health Insurance Coverage by Citizenship Status in Brookneal
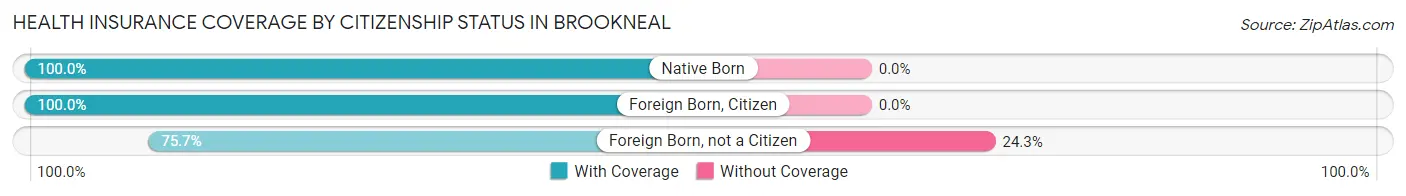
| Citizenship Status | With Coverage | Without Coverage |
| Native Born | 69 (100.0%) | 0 (0.0%) |
| Foreign Born, Citizen | 195 (100.0%) | 0 (0.0%) |
| Foreign Born, not a Citizen | 84 (75.7%) | 27 (24.3%) |
Health Insurance Coverage by Household Income in Brookneal
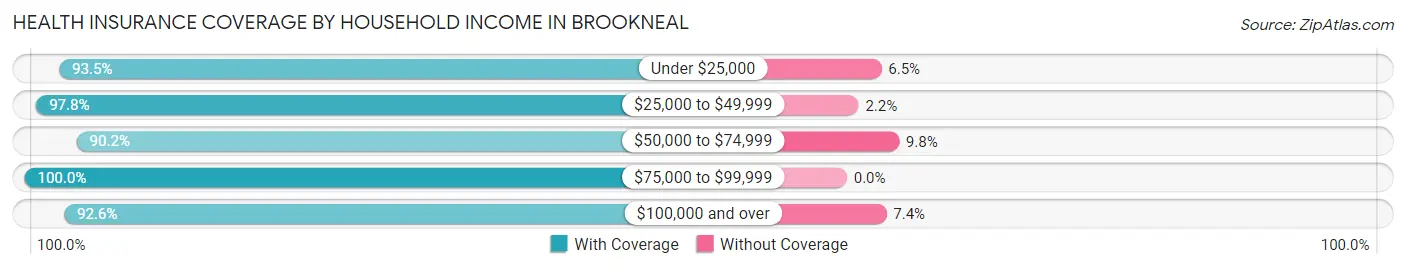
| Household Income | With Coverage | Without Coverage |
| Under $25,000 | 231 (93.5%) | 16 (6.5%) |
| $25,000 to $49,999 | 313 (97.8%) | 7 (2.2%) |
| $50,000 to $74,999 | 407 (90.2%) | 44 (9.8%) |
| $75,000 to $99,999 | 101 (100.0%) | 0 (0.0%) |
| $100,000 and over | 50 (92.6%) | 4 (7.4%) |
Public vs Private Health Insurance Coverage by Age in Brookneal
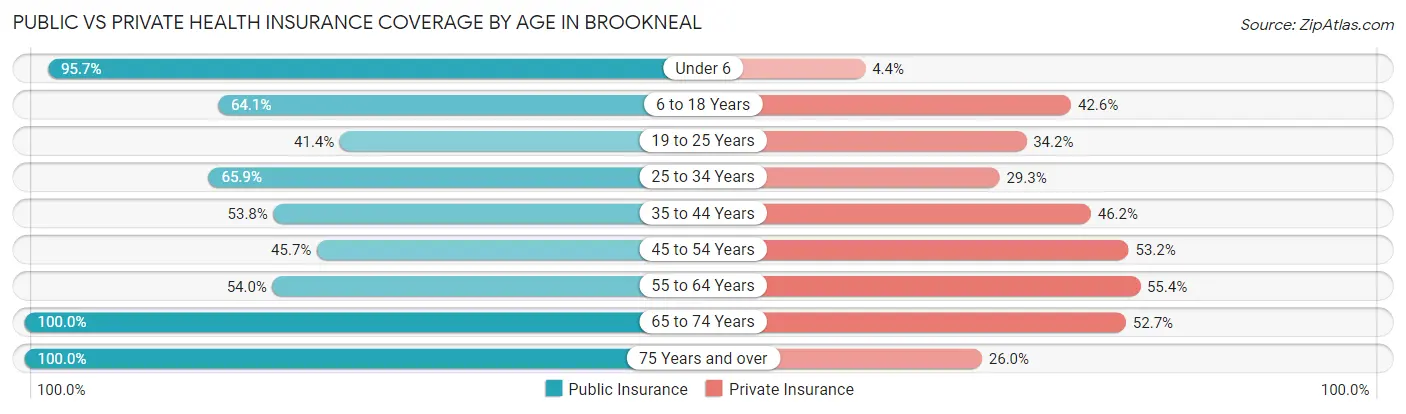
| Age Bracket | Public Insurance | Private Insurance |
| Under 6 | 66 (95.7%) | 3 (4.3%) |
| 6 to 18 Years | 125 (64.1%) | 83 (42.6%) |
| 19 to 25 Years | 46 (41.4%) | 38 (34.2%) |
| 25 to 34 Years | 54 (65.8%) | 24 (29.3%) |
| 35 to 44 Years | 64 (53.8%) | 55 (46.2%) |
| 45 to 54 Years | 85 (45.7%) | 99 (53.2%) |
| 55 to 64 Years | 116 (53.9%) | 119 (55.3%) |
| 65 to 74 Years | 146 (100.0%) | 77 (52.7%) |
| 75 Years and over | 50 (100.0%) | 13 (26.0%) |
| Total | 752 (64.1%) | 511 (43.6%) |
Disability Status by Sex by Age in Brookneal
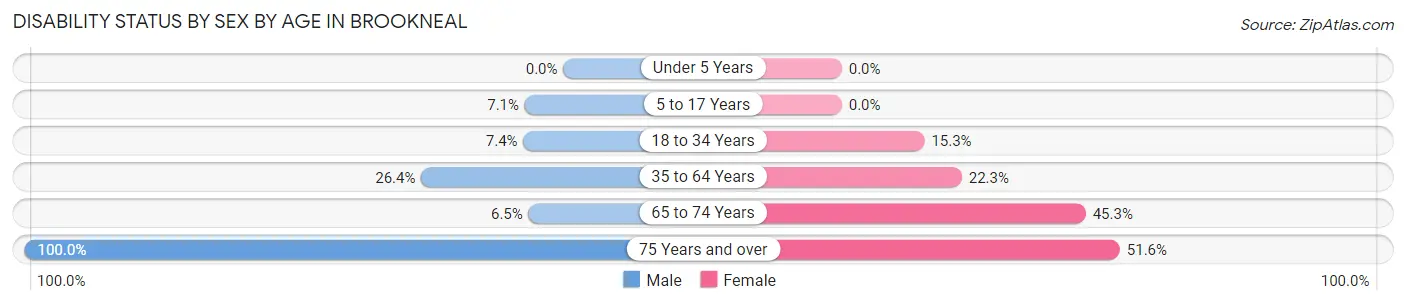
| Age Bracket | Male | Female |
| Under 5 Years | 0 (0.0%) | 0 (0.0%) |
| 5 to 17 Years | 7 (7.1%) | 0 (0.0%) |
| 18 to 34 Years | 4 (7.4%) | 25 (15.3%) |
| 35 to 64 Years | 72 (26.4%) | 55 (22.3%) |
| 65 to 74 Years | 6 (6.5%) | 24 (45.3%) |
| 75 Years and over | 19 (100.0%) | 16 (51.6%) |
Disability Class by Sex by Age in Brookneal
Disability Class: Hearing Difficulty
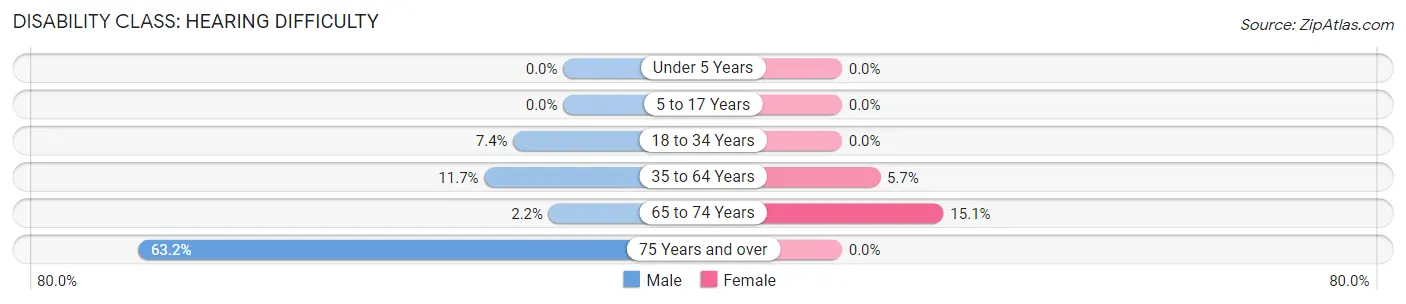
| Age Bracket | Male | Female |
| Under 5 Years | 0 (0.0%) | 0 (0.0%) |
| 5 to 17 Years | 0 (0.0%) | 0 (0.0%) |
| 18 to 34 Years | 4 (7.4%) | 0 (0.0%) |
| 35 to 64 Years | 32 (11.7%) | 14 (5.7%) |
| 65 to 74 Years | 2 (2.1%) | 8 (15.1%) |
| 75 Years and over | 12 (63.2%) | 0 (0.0%) |
Disability Class: Vision Difficulty
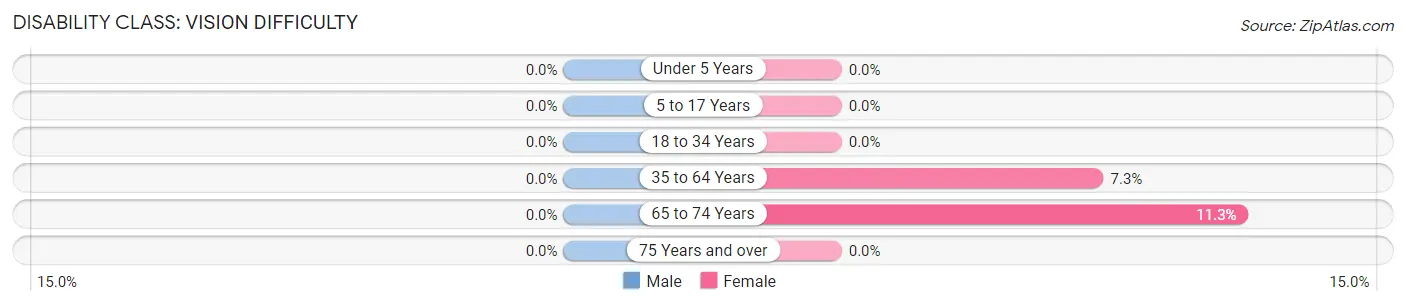
| Age Bracket | Male | Female |
| Under 5 Years | 0 (0.0%) | 0 (0.0%) |
| 5 to 17 Years | 0 (0.0%) | 0 (0.0%) |
| 18 to 34 Years | 0 (0.0%) | 0 (0.0%) |
| 35 to 64 Years | 0 (0.0%) | 18 (7.3%) |
| 65 to 74 Years | 0 (0.0%) | 6 (11.3%) |
| 75 Years and over | 0 (0.0%) | 0 (0.0%) |
Disability Class: Cognitive Difficulty
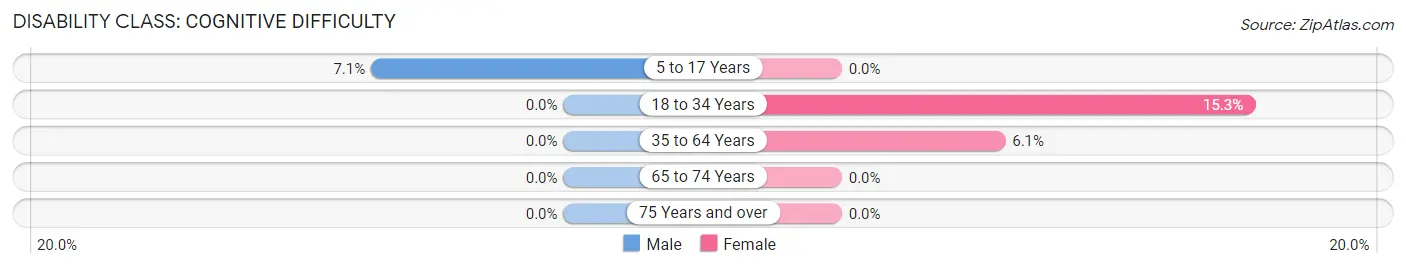
| Age Bracket | Male | Female |
| 5 to 17 Years | 7 (7.1%) | 0 (0.0%) |
| 18 to 34 Years | 0 (0.0%) | 25 (15.3%) |
| 35 to 64 Years | 0 (0.0%) | 15 (6.1%) |
| 65 to 74 Years | 0 (0.0%) | 0 (0.0%) |
| 75 Years and over | 0 (0.0%) | 0 (0.0%) |
Disability Class: Ambulatory Difficulty
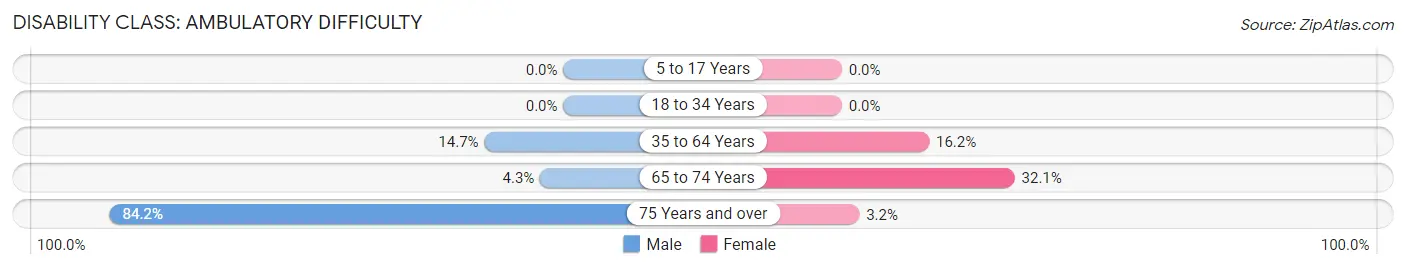
| Age Bracket | Male | Female |
| 5 to 17 Years | 0 (0.0%) | 0 (0.0%) |
| 18 to 34 Years | 0 (0.0%) | 0 (0.0%) |
| 35 to 64 Years | 40 (14.6%) | 40 (16.2%) |
| 65 to 74 Years | 4 (4.3%) | 17 (32.1%) |
| 75 Years and over | 16 (84.2%) | 1 (3.2%) |
Disability Class: Self-Care Difficulty
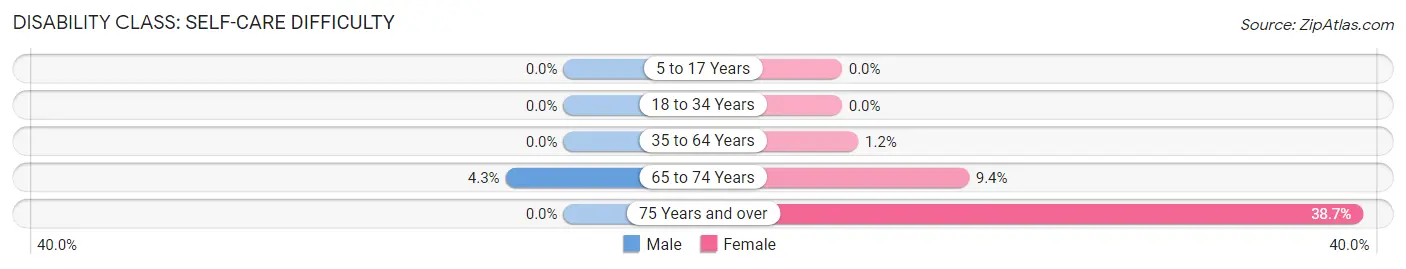
| Age Bracket | Male | Female |
| 5 to 17 Years | 0 (0.0%) | 0 (0.0%) |
| 18 to 34 Years | 0 (0.0%) | 0 (0.0%) |
| 35 to 64 Years | 0 (0.0%) | 3 (1.2%) |
| 65 to 74 Years | 4 (4.3%) | 5 (9.4%) |
| 75 Years and over | 0 (0.0%) | 12 (38.7%) |
Technology Access in Brookneal
Computing Device Access in Brookneal
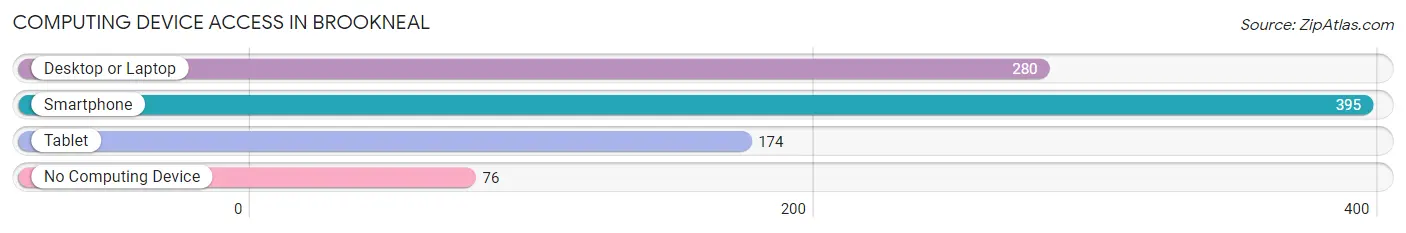
| Device Type | # Households | % Households |
| Desktop or Laptop | 280 | 58.0% |
| Smartphone | 395 | 81.8% |
| Tablet | 174 | 36.0% |
| No Computing Device | 76 | 15.7% |
| Total | 483 | 100.0% |
Internet Access in Brookneal
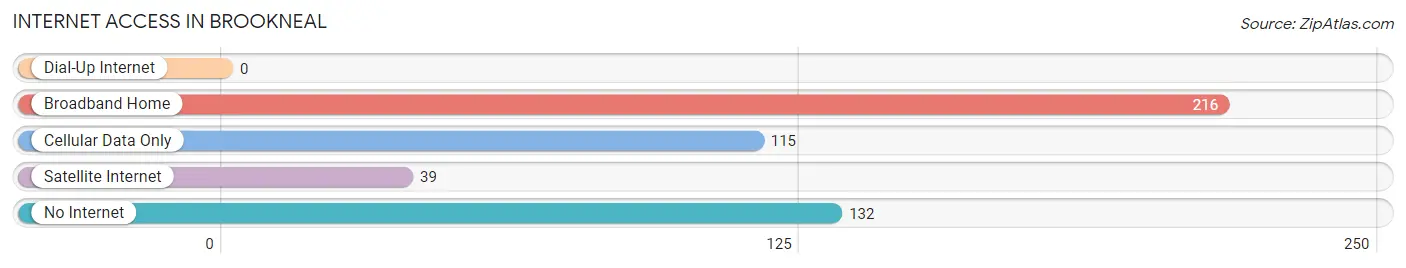
| Internet Type | # Households | % Households |
| Dial-Up Internet | 0 | 0.0% |
| Broadband Home | 216 | 44.7% |
| Cellular Data Only | 115 | 23.8% |
| Satellite Internet | 39 | 8.1% |
| No Internet | 132 | 27.3% |
| Total | 483 | 100.0% |
Brookneal Summary
History
The town of Brookneal, Virginia is located in Campbell County, Virginia and is part of the Lynchburg Metropolitan Statistical Area. The town was first settled in 1745 by William and Mary Anderson, who were Quakers from Pennsylvania. The town was originally known as Anderson’s Store, but was later renamed Brookneal in 1812. The name is derived from the nearby creek, which was named after a local Native American chief.
The town was an important stop on the Great Road, which connected the Shenandoah Valley to the Tidewater region. This road was used by settlers, traders, and military personnel during the Revolutionary War and the War of 1812. The town was also an important stop on the Richmond and Danville Railroad, which was built in the late 19th century.
The town was home to several prominent families, including the Andersons, the Harrisons, the Harrisons, and the Wilsons. These families were influential in the development of the town and the surrounding area.
Geography
Brookneal is located in the foothills of the Blue Ridge Mountains in south-central Virginia. The town is situated on the banks of the Staunton River, which is a tributary of the James River. The town is located approximately 30 miles south of Lynchburg and 40 miles north of Danville.
The town is located in a rural area, with the nearest major city being Lynchburg. The town is surrounded by rolling hills and farmland, with the Blue Ridge Mountains visible in the distance. The climate in the area is temperate, with hot summers and mild winters.
Economy
The economy of Brookneal is largely based on agriculture and manufacturing. The town is home to several large farms, which produce a variety of crops, including corn, soybeans, and tobacco. The town is also home to several manufacturing companies, which produce a variety of products, including furniture, textiles, and automotive parts.
The town is also home to several small businesses, including restaurants, retail stores, and service providers. The town is also home to a branch of the Campbell County Public Library, which serves the local community.
Demographics
As of the 2010 census, the population of Brookneal was 1,717. The population is largely white (94.3%), with a small African American population (3.2%). The median household income in the town is $37,917, and the median age is 43.7 years. The town is served by the Campbell County Public Schools system.
Common Questions
What is Per Capita Income in Brookneal?
Per Capita income in Brookneal is $20,292.
What is the Median Family Income in Brookneal?
Median Family Income in Brookneal is $55,313.
What is the Median Household income in Brookneal?
Median Household Income in Brookneal is $42,019.
What is Income or Wage Gap in Brookneal?
Income or Wage Gap in Brookneal is 10.6%.
Women in Brookneal earn 89.4 cents for every dollar earned by a man.
What is Family Income Deficit in Brookneal?
Family Income Deficit in Brookneal is $16,998.
Families that are below poverty line in Brookneal earn $16,998 less on average than the poverty threshold level.
What is Inequality or Gini Index in Brookneal?
Inequality or Gini Index in Brookneal is 0.38.
What is the Total Population of Brookneal?
Total Population of Brookneal is 1,225.
What is the Total Male Population of Brookneal?
Total Male Population of Brookneal is 577.
What is the Total Female Population of Brookneal?
Total Female Population of Brookneal is 648.
What is the Ratio of Males per 100 Females in Brookneal?
There are 89.04 Males per 100 Females in Brookneal.
What is the Ratio of Females per 100 Males in Brookneal?
There are 112.31 Females per 100 Males in Brookneal.
What is the Median Population Age in Brookneal?
Median Population Age in Brookneal is 47.2 Years.
What is the Average Family Size in Brookneal
Average Family Size in Brookneal is 3.2 People.
What is the Average Household Size in Brookneal
Average Household Size in Brookneal is 2.4 People.
How Large is the Labor Force in Brookneal?
There are 462 People in the Labor Forcein in Brookneal.
What is the Percentage of People in the Labor Force in Brookneal?
45.8% of People are in the Labor Force in Brookneal.
What is the Unemployment Rate in Brookneal?
Unemployment Rate in Brookneal is 8.9%.