Boston, VA Map & Demographics
Boston Map
Boston Overview
$28,077
PER CAPITA INCOME
$113,725
AVG FAMILY INCOME
0.26
INEQUALITY / GINI INDEX
406
TOTAL POPULATION
245
MALE POPULATION
161
FEMALE POPULATION
152.17
MALES / 100 FEMALES
65.71
FEMALES / 100 MALES
31.2
MEDIAN AGE
4.8
AVG FAMILY SIZE
2.8
AVG HOUSEHOLD SIZE
231
LABOR FORCE [ PEOPLE ]
80.8%
PERCENT IN LABOR FORCE
3.9%
UNEMPLOYMENT RATE
Boston Zip Codes
Boston Area Codes
Income in Boston
Income Overview in Boston
| Characteristic | Number | Measure |
| Per Capita Income | 406 | $28,077 |
| Median Family Income | 70 | $113,725 |
| Mean Family Income | 70 | $102,983 |
| Median Household Income | 143 | $0 |
| Mean Household Income | 143 | $75,994 |
| Income Deficit | 70 | $0 |
| Wage / Income Gap (%) | 406 | 0.00% |
| Wage / Income Gap ($) | 406 | 100.00¢ per $1 |
| Gini / Inequality Index | 406 | 0.26 |
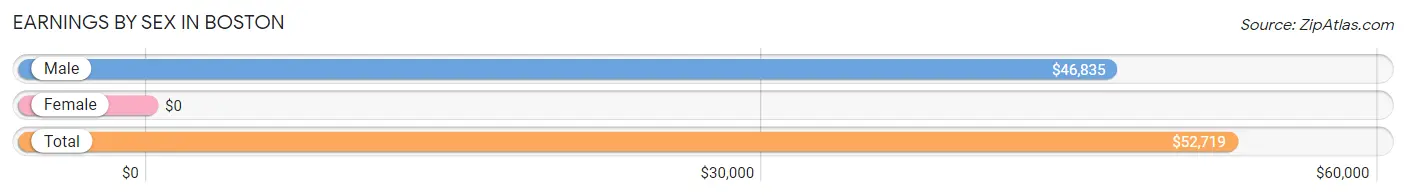
Earnings by Sex in Boston
| Sex | Number | Average Earnings |
| Male | 163 (73.4%) | $46,835 |
| Female | 59 (26.6%) | $0 |
| Total | 222 (100.0%) | $52,719 |
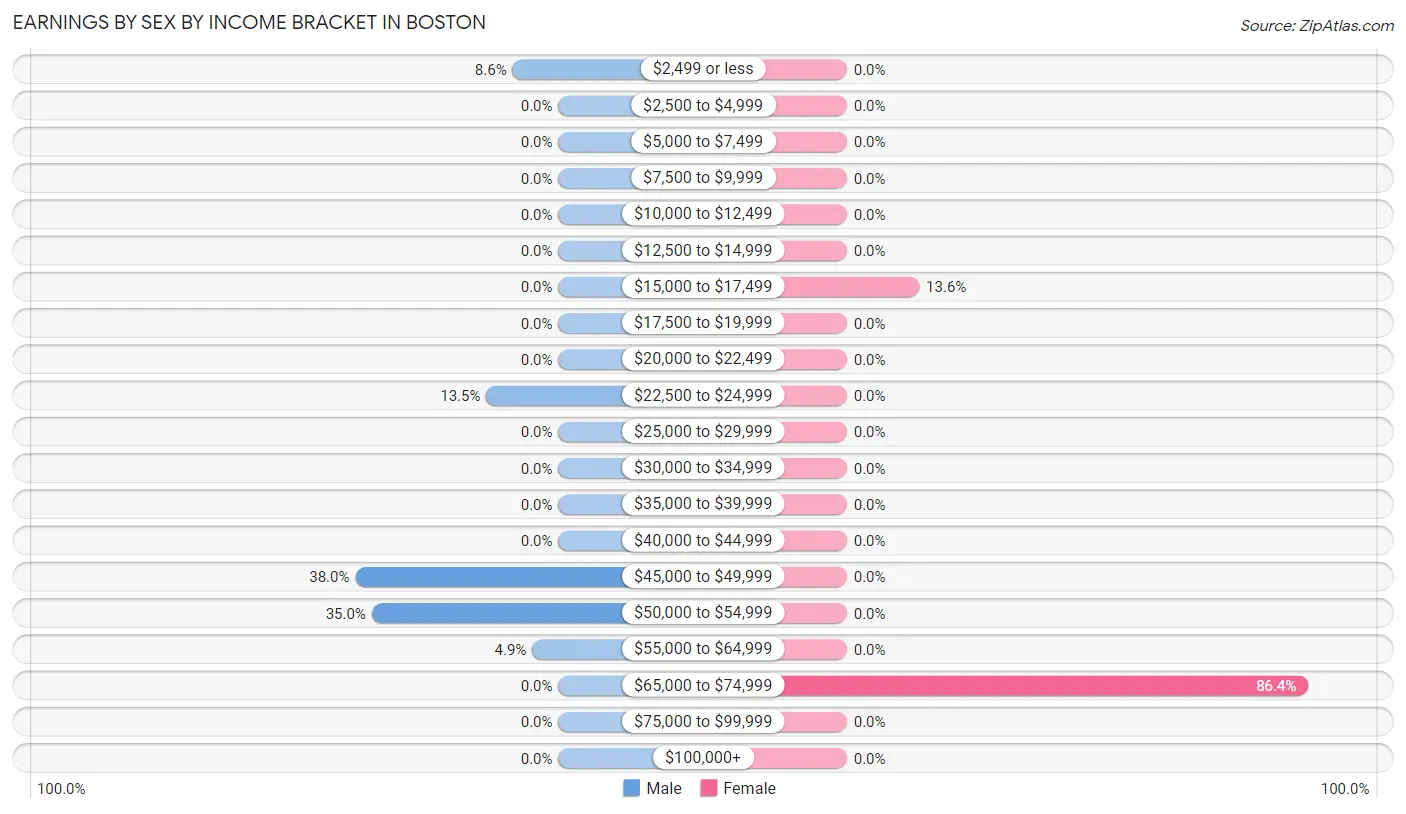
Earnings by Sex by Income Bracket in Boston
The most common earnings brackets in Boston are $45,000 to $49,999 for men (62 | 38.0%) and $65,000 to $74,999 for women (51 | 86.4%).
| Income | Male | Female |
| $2,499 or less | 14 (8.6%) | 0 (0.0%) |
| $2,500 to $4,999 | 0 (0.0%) | 0 (0.0%) |
| $5,000 to $7,499 | 0 (0.0%) | 0 (0.0%) |
| $7,500 to $9,999 | 0 (0.0%) | 0 (0.0%) |
| $10,000 to $12,499 | 0 (0.0%) | 0 (0.0%) |
| $12,500 to $14,999 | 0 (0.0%) | 0 (0.0%) |
| $15,000 to $17,499 | 0 (0.0%) | 8 (13.6%) |
| $17,500 to $19,999 | 0 (0.0%) | 0 (0.0%) |
| $20,000 to $22,499 | 0 (0.0%) | 0 (0.0%) |
| $22,500 to $24,999 | 22 (13.5%) | 0 (0.0%) |
| $25,000 to $29,999 | 0 (0.0%) | 0 (0.0%) |
| $30,000 to $34,999 | 0 (0.0%) | 0 (0.0%) |
| $35,000 to $39,999 | 0 (0.0%) | 0 (0.0%) |
| $40,000 to $44,999 | 0 (0.0%) | 0 (0.0%) |
| $45,000 to $49,999 | 62 (38.0%) | 0 (0.0%) |
| $50,000 to $54,999 | 57 (35.0%) | 0 (0.0%) |
| $55,000 to $64,999 | 8 (4.9%) | 0 (0.0%) |
| $65,000 to $74,999 | 0 (0.0%) | 51 (86.4%) |
| $75,000 to $99,999 | 0 (0.0%) | 0 (0.0%) |
| $100,000+ | 0 (0.0%) | 0 (0.0%) |
| Total | 163 (100.0%) | 59 (100.0%) |
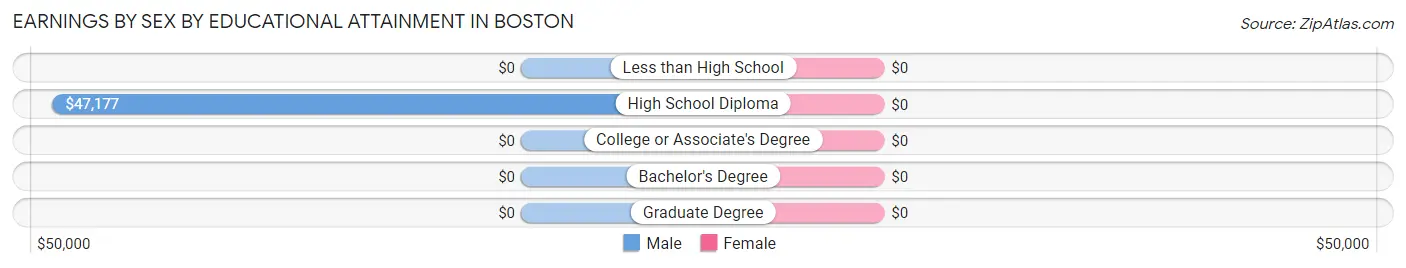
Earnings by Sex by Educational Attainment in Boston
| Educational Attainment | Male Income | Female Income |
| Less than High School | - | - |
| High School Diploma | $47,177 | $0 |
| College or Associate's Degree | - | - |
| Bachelor's Degree | - | - |
| Graduate Degree | - | - |
| Total | $46,835 | $0 |
Family Income in Boston
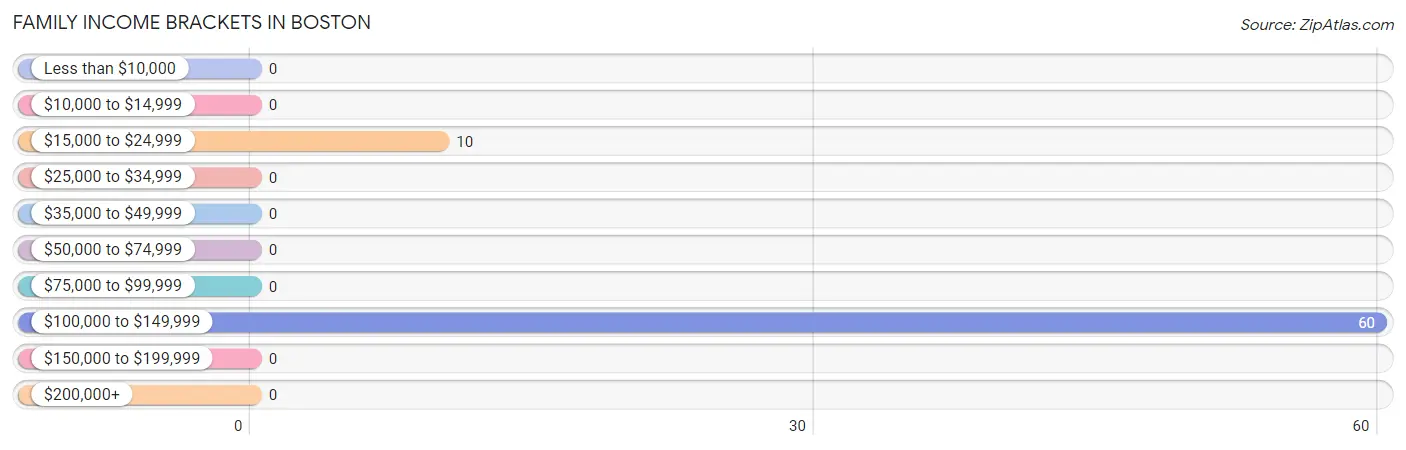
Family Income Brackets in Boston
According to the Boston family income data, there are 60 families falling into the $100,000 to $149,999 income range, which is the most common income bracket and makes up 85.7% of all families.
| Income Bracket | # Families | % Families |
| Less than $10,000 | 0 | 0.0% |
| $10,000 to $14,999 | 0 | 0.0% |
| $15,000 to $24,999 | 10 | 14.3% |
| $25,000 to $34,999 | 0 | 0.0% |
| $35,000 to $49,999 | 0 | 0.0% |
| $50,000 to $74,999 | 0 | 0.0% |
| $75,000 to $99,999 | 0 | 0.0% |
| $100,000 to $149,999 | 60 | 85.7% |
| $150,000 to $199,999 | 0 | 0.0% |
| $200,000+ | 0 | 0.0% |
Family Income by Famaliy Size in Boston
| Income Bracket | # Families | Median Income |
| 2-Person Families | 0 (0.0%) | $0 |
| 3-Person Families | 0 (0.0%) | $0 |
| 4-Person Families | 51 (72.9%) | $0 |
| 5-Person Families | 19 (27.1%) | $0 |
| 6-Person Families | 0 (0.0%) | $0 |
| 7+ Person Families | 0 (0.0%) | $0 |
| Total | 70 (100.0%) | $113,725 |
Family Income by Number of Earners in Boston
| Number of Earners | # Families | Median Income |
| No Earners | 0 (0.0%) | $0 |
| 1 Earner | 10 (14.3%) | $0 |
| 2 Earners | 51 (72.9%) | $0 |
| 3+ Earners | 9 (12.9%) | $0 |
| Total | 70 (100.0%) | $113,725 |
Household Income in Boston
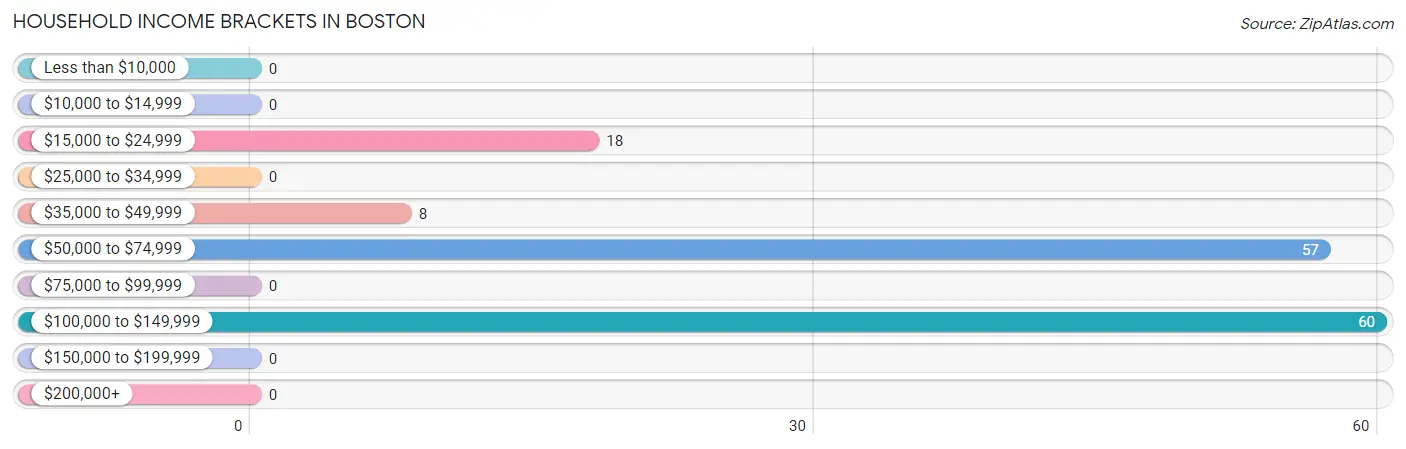
Household Income Brackets in Boston
With 60 households falling in the category, the $100,000 to $149,999 income range is the most frequent in Boston, accounting for 42.0% of all households.
| Income Bracket | # Households | % Households |
| Less than $10,000 | 0 | 0.0% |
| $10,000 to $14,999 | 0 | 0.0% |
| $15,000 to $24,999 | 18 | 12.6% |
| $25,000 to $34,999 | 0 | 0.0% |
| $35,000 to $49,999 | 8 | 5.6% |
| $50,000 to $74,999 | 57 | 39.9% |
| $75,000 to $99,999 | 0 | 0.0% |
| $100,000 to $149,999 | 60 | 42.0% |
| $150,000 to $199,999 | 0 | 0.0% |
| $200,000+ | 0 | 0.0% |
Household Income by Householder Age in Boston
| Income Bracket | # Households | Median Income |
| 15 to 24 Years | 0 (0.0%) | $0 |
| 25 to 44 Years | 51 (35.7%) | $0 |
| 45 to 64 Years | 65 (45.5%) | $0 |
| 65+ Years | 27 (18.9%) | $0 |
| Total | 143 (100.0%) | $0 |
Poverty in Boston
Income Below Poverty by Sex and Age in Boston
With 12.7% poverty level for males and 24.2% for females among the residents of Boston, 55 to 64 year old males and 16 and 17 year old females are the most vulnerable to poverty, with 14 males (100.0%) and 20 females (100.0%) in their respective age groups living below the poverty level.
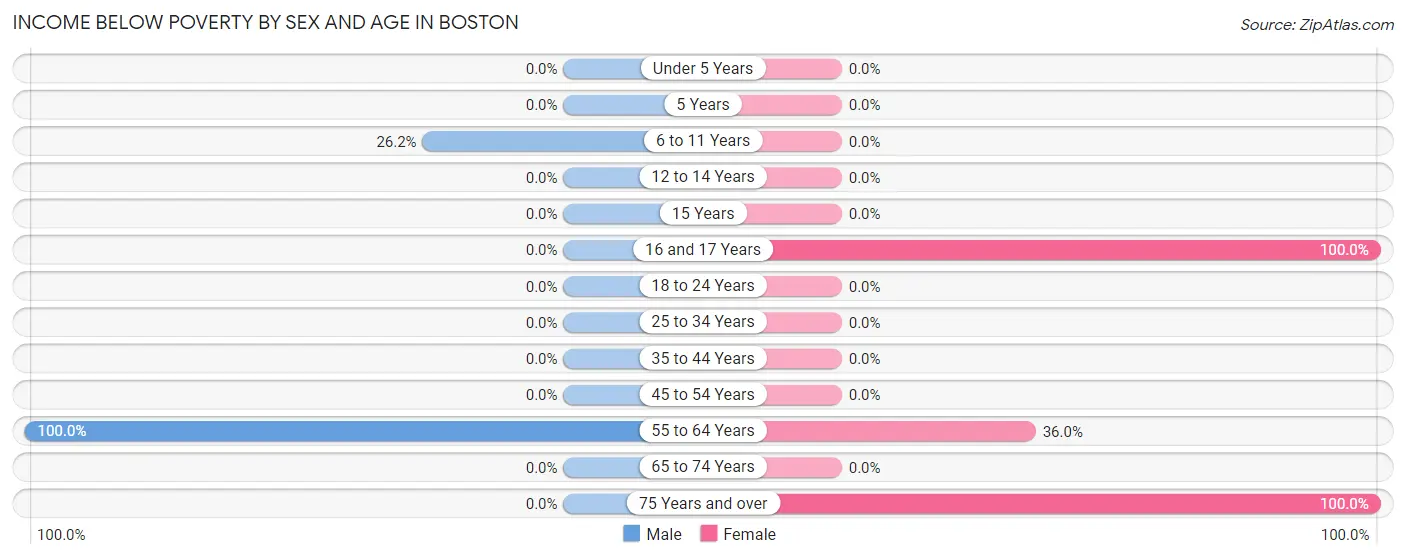
| Age Bracket | Male | Female |
| Under 5 Years | 0 (0.0%) | 0 (0.0%) |
| 5 Years | 0 (0.0%) | 0 (0.0%) |
| 6 to 11 Years | 17 (26.2%) | 0 (0.0%) |
| 12 to 14 Years | 0 (0.0%) | 0 (0.0%) |
| 15 Years | 0 (0.0%) | 0 (0.0%) |
| 16 and 17 Years | 0 (0.0%) | 20 (100.0%) |
| 18 to 24 Years | 0 (0.0%) | 0 (0.0%) |
| 25 to 34 Years | 0 (0.0%) | 0 (0.0%) |
| 35 to 44 Years | 0 (0.0%) | 0 (0.0%) |
| 45 to 54 Years | 0 (0.0%) | 0 (0.0%) |
| 55 to 64 Years | 14 (100.0%) | 9 (36.0%) |
| 65 to 74 Years | 0 (0.0%) | 0 (0.0%) |
| 75 Years and over | 0 (0.0%) | 10 (100.0%) |
| Total | 31 (12.7%) | 39 (24.2%) |
Income Above Poverty by Sex and Age in Boston
According to the poverty statistics in Boston, males aged 25 to 34 years and females aged 6 to 11 years are the age groups that are most secure financially, with 100.0% of males and 100.0% of females in these age groups living above the poverty line.
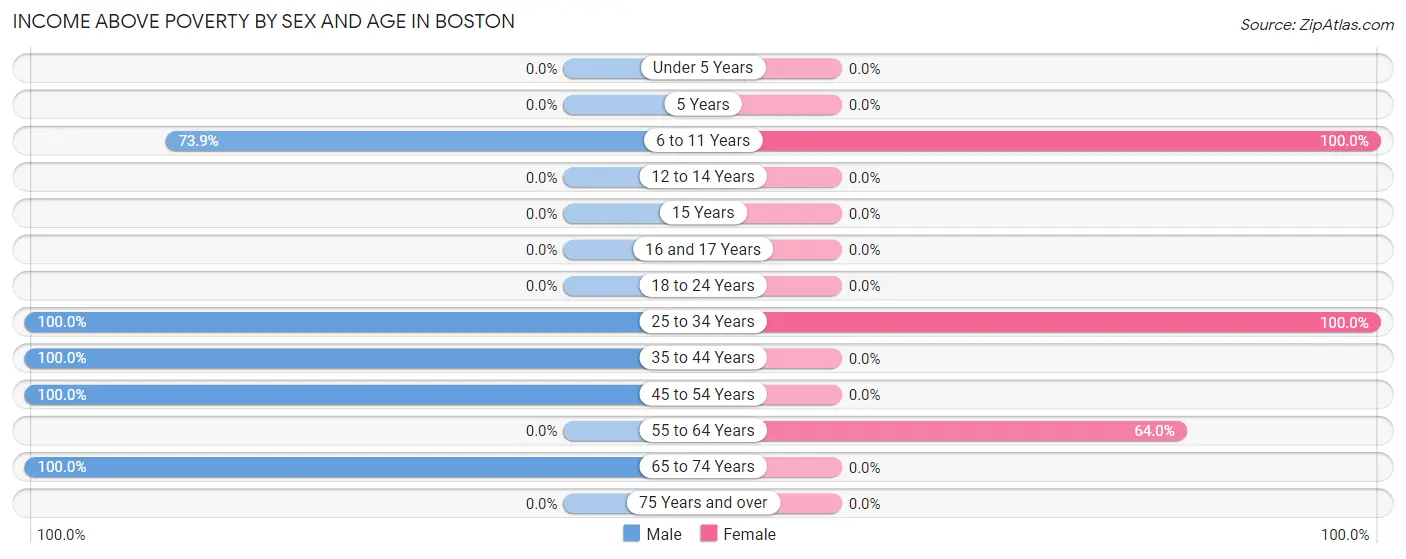
| Age Bracket | Male | Female |
| Under 5 Years | 0 (0.0%) | 0 (0.0%) |
| 5 Years | 0 (0.0%) | 0 (0.0%) |
| 6 to 11 Years | 48 (73.9%) | 55 (100.0%) |
| 12 to 14 Years | 0 (0.0%) | 0 (0.0%) |
| 15 Years | 0 (0.0%) | 0 (0.0%) |
| 16 and 17 Years | 0 (0.0%) | 0 (0.0%) |
| 18 to 24 Years | 0 (0.0%) | 0 (0.0%) |
| 25 to 34 Years | 84 (100.0%) | 51 (100.0%) |
| 35 to 44 Years | 8 (100.0%) | 0 (0.0%) |
| 45 to 54 Years | 57 (100.0%) | 0 (0.0%) |
| 55 to 64 Years | 0 (0.0%) | 16 (64.0%) |
| 65 to 74 Years | 17 (100.0%) | 0 (0.0%) |
| 75 Years and over | 0 (0.0%) | 0 (0.0%) |
| Total | 214 (87.4%) | 122 (75.8%) |
Income Below Poverty Among Married-Couple Families in Boston
| Children | Above Poverty | Below Poverty |
| No Children | 9 (100.0%) | 0 (0.0%) |
| 1 or 2 Children | 51 (100.0%) | 0 (0.0%) |
| 3 or 4 Children | 0 (0.0%) | 0 (0.0%) |
| 5 or more Children | 0 (0.0%) | 0 (0.0%) |
| Total | 60 (100.0%) | 0 (0.0%) |
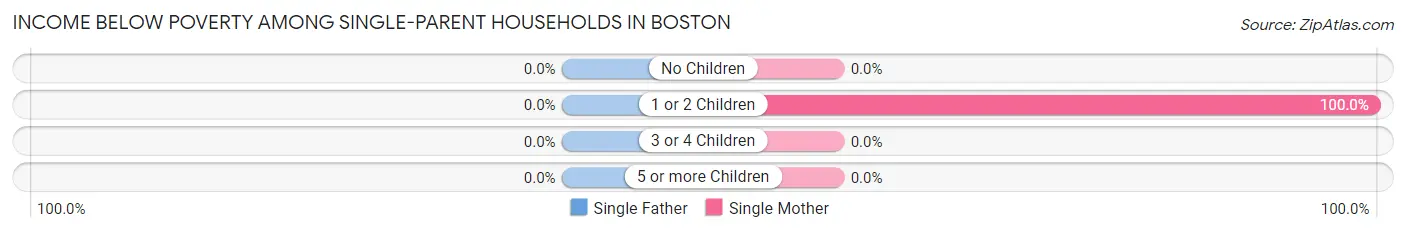
Income Below Poverty Among Single-Parent Households in Boston
| Children | Single Father | Single Mother |
| No Children | 0 (0.0%) | 0 (0.0%) |
| 1 or 2 Children | 0 (0.0%) | 10 (100.0%) |
| 3 or 4 Children | 0 (0.0%) | 0 (0.0%) |
| 5 or more Children | 0 (0.0%) | 0 (0.0%) |
| Total | 0 (0.0%) | 10 (100.0%) |
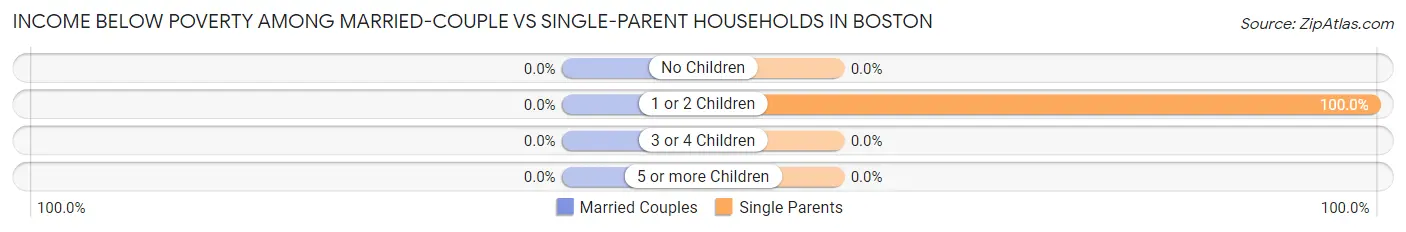
Income Below Poverty Among Married-Couple vs Single-Parent Households in Boston
| Children | Married-Couple Families | Single-Parent Households |
| No Children | 0 (0.0%) | 0 (0.0%) |
| 1 or 2 Children | 0 (0.0%) | 10 (100.0%) |
| 3 or 4 Children | 0 (0.0%) | 0 (0.0%) |
| 5 or more Children | 0 (0.0%) | 0 (0.0%) |
| Total | 0 (0.0%) | 10 (100.0%) |
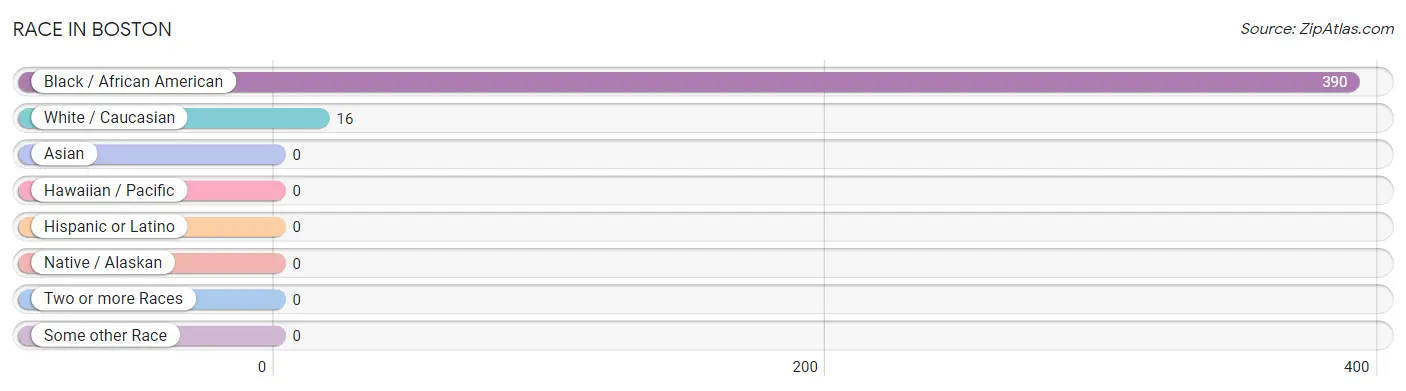
Race in Boston
The most populous races in Boston are Black / African American (390 | 96.1%), and White / Caucasian (16 | 3.9%).
| Race | # Population | % Population |
| Asian | 0 | 0.0% |
| Black / African American | 390 | 96.1% |
| Hawaiian / Pacific | 0 | 0.0% |
| Hispanic or Latino | 0 | 0.0% |
| Native / Alaskan | 0 | 0.0% |
| White / Caucasian | 16 | 3.9% |
| Two or more Races | 0 | 0.0% |
| Some other Race | 0 | 0.0% |
| Total | 406 | 100.0% |
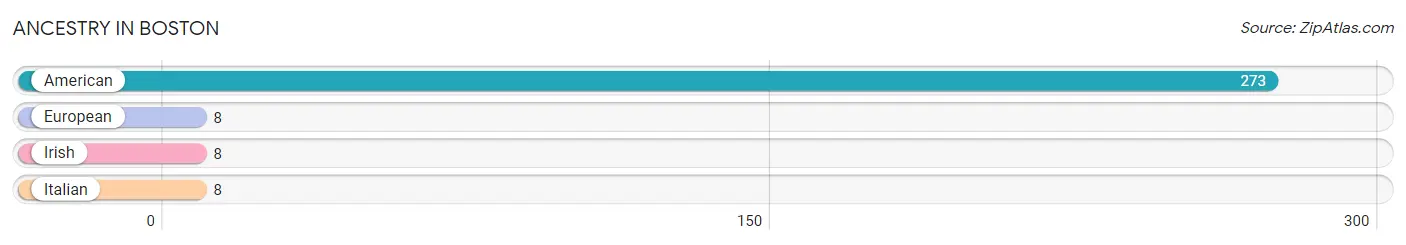
Ancestry in Boston
The most populous ancestries reported in Boston are American (273 | 67.2%), European (8 | 2.0%), Irish (8 | 2.0%), and Italian (8 | 2.0%), together accounting for 73.2% of all Boston residents.
| Ancestry | # Population | % Population |
| American | 273 | 67.2% |
| European | 8 | 2.0% |
| Irish | 8 | 2.0% |
| Italian | 8 | 2.0% | View All 4 Rows |
Immigrants in Boston

| Immigration Origin | # Population | % Population | View All 0 Rows |
Sex and Age in Boston
Sex and Age in Boston
The most populous age groups in Boston are 30 to 34 Years (84 | 34.3%) for men and 10 to 14 Years (55 | 34.2%) for women.
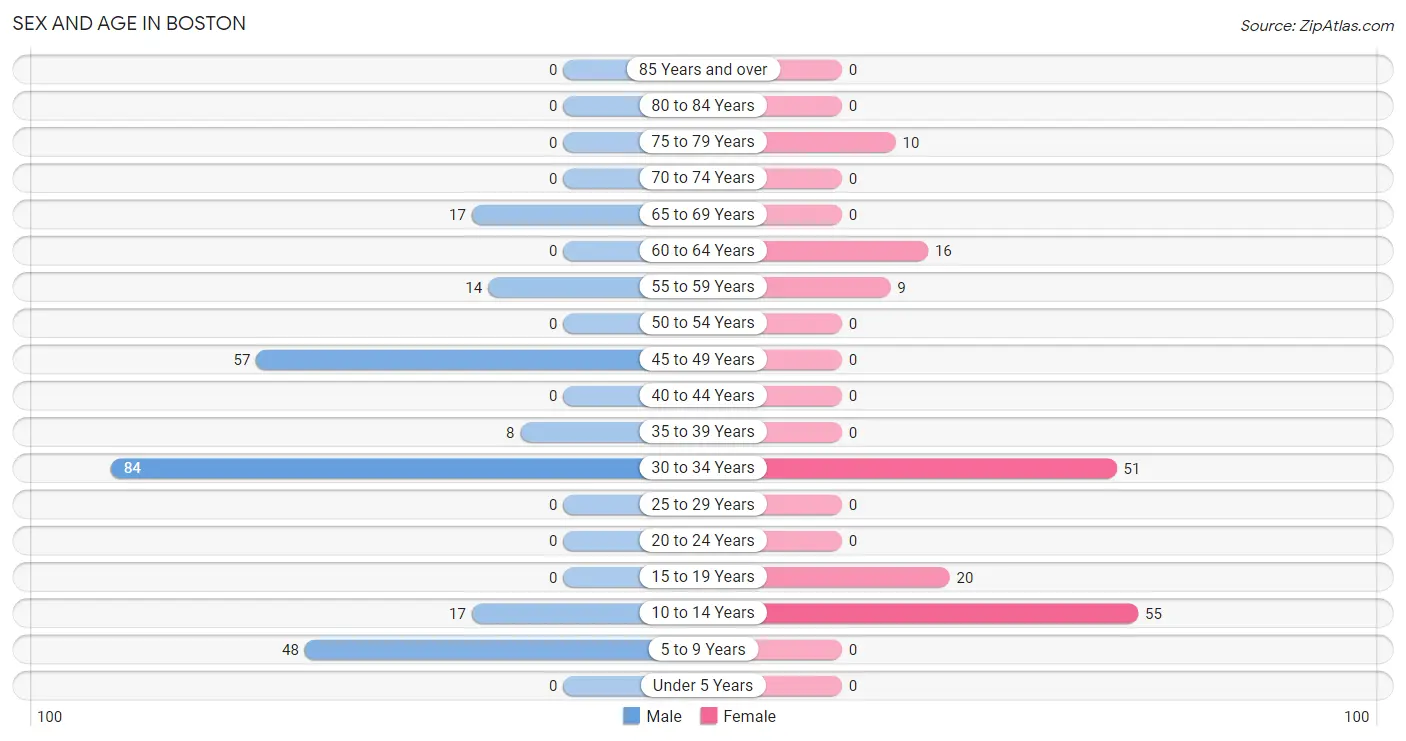
| Age Bracket | Male | Female |
| Under 5 Years | 0 (0.0%) | 0 (0.0%) |
| 5 to 9 Years | 48 (19.6%) | 0 (0.0%) |
| 10 to 14 Years | 17 (6.9%) | 55 (34.2%) |
| 15 to 19 Years | 0 (0.0%) | 20 (12.4%) |
| 20 to 24 Years | 0 (0.0%) | 0 (0.0%) |
| 25 to 29 Years | 0 (0.0%) | 0 (0.0%) |
| 30 to 34 Years | 84 (34.3%) | 51 (31.7%) |
| 35 to 39 Years | 8 (3.3%) | 0 (0.0%) |
| 40 to 44 Years | 0 (0.0%) | 0 (0.0%) |
| 45 to 49 Years | 57 (23.3%) | 0 (0.0%) |
| 50 to 54 Years | 0 (0.0%) | 0 (0.0%) |
| 55 to 59 Years | 14 (5.7%) | 9 (5.6%) |
| 60 to 64 Years | 0 (0.0%) | 16 (9.9%) |
| 65 to 69 Years | 17 (6.9%) | 0 (0.0%) |
| 70 to 74 Years | 0 (0.0%) | 0 (0.0%) |
| 75 to 79 Years | 0 (0.0%) | 10 (6.2%) |
| 80 to 84 Years | 0 (0.0%) | 0 (0.0%) |
| 85 Years and over | 0 (0.0%) | 0 (0.0%) |
| Total | 245 (100.0%) | 161 (100.0%) |
Families and Households in Boston
Median Family Size in Boston
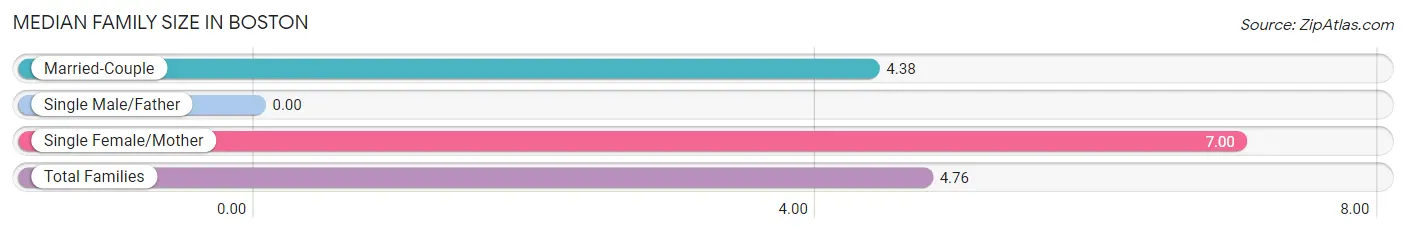
| Family Type | # Families | Family Size |
| Married-Couple | 60 (85.7%) | 4.38 |
| Single Male/Father | 0 (0.0%) | - |
| Single Female/Mother | 10 (14.3%) | 7.00 |
| Total Families | 70 (100.0%) | 4.76 |
Median Household Size in Boston
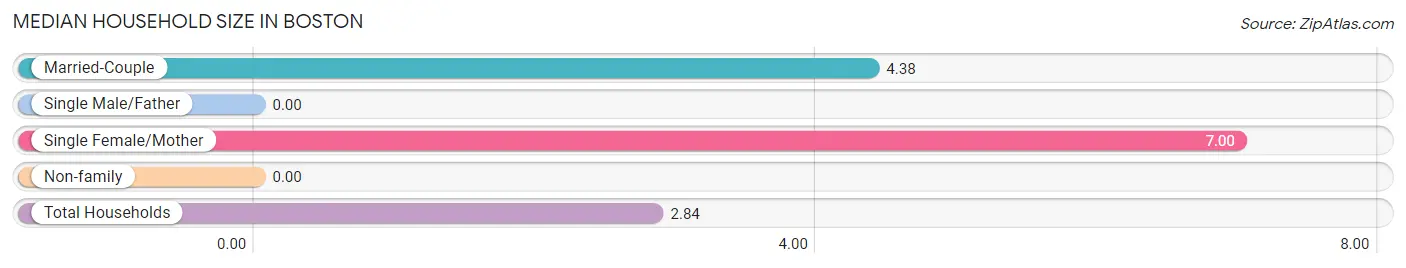
| Household Type | # Households | Household Size |
| Married-Couple | 60 (42.0%) | 4.38 |
| Single Male/Father | 0 (0.0%) | - |
| Single Female/Mother | 10 (7.0%) | 7.00 |
| Non-family | 73 (51.0%) | - |
| Total Households | 143 (100.0%) | 2.84 |
Household Size by Marriage Status in Boston
Out of a total of 143 households in Boston, 70 (48.9%) are family households, while 73 (51.0%) are nonfamily households. The most numerous type of family households are 4-person households, comprising 51, and the most common type of nonfamily households are 1-person households, comprising 73.
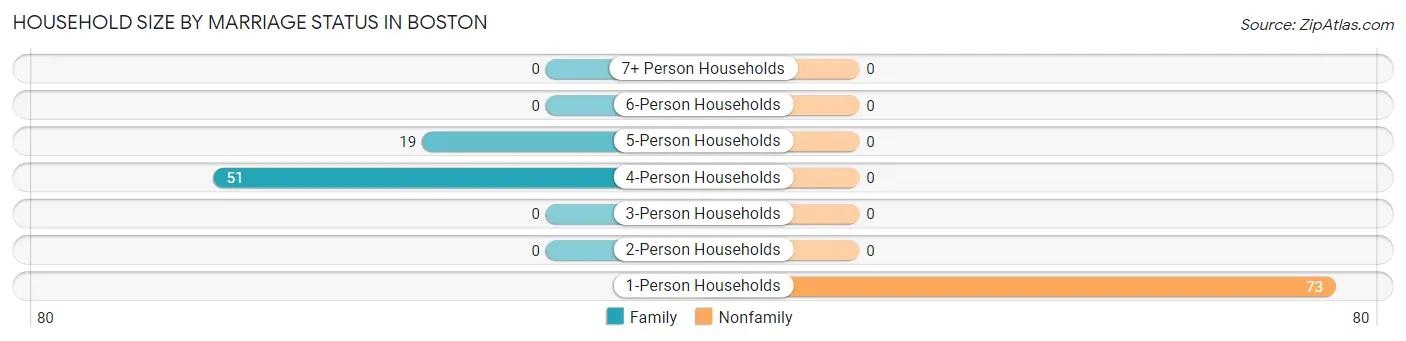
| Household Size | Family Households | Nonfamily Households |
| 1-Person Households | - | 73 (51.0%) |
| 2-Person Households | 0 (0.0%) | 0 (0.0%) |
| 3-Person Households | 0 (0.0%) | 0 (0.0%) |
| 4-Person Households | 51 (35.7%) | 0 (0.0%) |
| 5-Person Households | 19 (13.3%) | 0 (0.0%) |
| 6-Person Households | 0 (0.0%) | 0 (0.0%) |
| 7+ Person Households | 0 (0.0%) | 0 (0.0%) |
| Total | 70 (48.9%) | 73 (51.0%) |
Female Fertility in Boston
Fertility by Age in Boston
| Age Bracket | Women with Births | Births / 1,000 Women |
| 15 to 19 years | 0 (0.0%) | 0.0 |
| 20 to 34 years | 0 (0.0%) | 0.0 |
| 35 to 50 years | 0 (0.0%) | 0.0 |
| Total | 0 (0.0%) | 0.0 |
Fertility by Age by Marriage Status in Boston
| Age Bracket | Married | Unmarried |
| 15 to 19 years | 0 (0.0%) | 0 (0.0%) |
| 20 to 34 years | 0 (0.0%) | 0 (0.0%) |
| 35 to 50 years | 0 (0.0%) | 0 (0.0%) |
| Total | 0 (0.0%) | 0 (0.0%) |
Fertility by Education in Boston
| Educational Attainment | Women with Births | Births / 1,000 Women |
| Less than High School | 0 (0.0%) | 0.0 |
| High School Diploma | 0 (0.0%) | 0.0 |
| College or Associate's Degree | 0 (0.0%) | 0.0 |
| Bachelor's Degree | 0 (0.0%) | 0.0 |
| Graduate Degree | 0 (0.0%) | 0.0 |
| Total | 0 (0.0%) | 0.0 |
Fertility by Education by Marriage Status in Boston
| Educational Attainment | Married | Unmarried |
| Less than High School | 0 (0.0%) | 0 (0.0%) |
| High School Diploma | 0 (0.0%) | 0 (0.0%) |
| College or Associate's Degree | 0 (0.0%) | 0 (0.0%) |
| Bachelor's Degree | 0 (0.0%) | 0 (0.0%) |
| Graduate Degree | 0 (0.0%) | 0 (0.0%) |
| Total | 0 (0.0%) | 0 (0.0%) |
Employment Characteristics in Boston
Employment by Class of Employer in Boston
Among the 222 employed individuals in Boston, private company employees (208 | 93.7%), and self-employed (incorporated) (14 | 6.3%) make up the most common classes of employment.
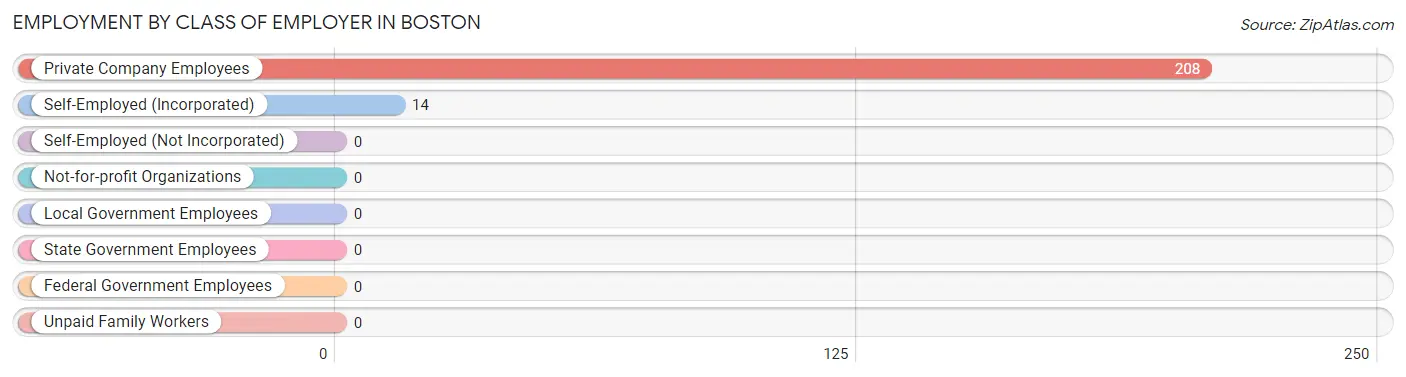
| Employer Class | # Employees | % Employees |
| Private Company Employees | 208 | 93.7% |
| Self-Employed (Incorporated) | 14 | 6.3% |
| Self-Employed (Not Incorporated) | 0 | 0.0% |
| Not-for-profit Organizations | 0 | 0.0% |
| Local Government Employees | 0 | 0.0% |
| State Government Employees | 0 | 0.0% |
| Federal Government Employees | 0 | 0.0% |
| Unpaid Family Workers | 0 | 0.0% |
| Total | 222 | 100.0% |
Employment Status by Age in Boston
According to the labor force statistics for Boston, out of the total population over 16 years of age (286), 80.8% or 231 individuals are in the labor force, with 3.9% or 9 of them unemployed. The age group with the highest labor force participation rate is 30 to 34 years, with 100.0% or 135 individuals in the labor force. Within the labor force, the 55 to 59 years age range has the highest percentage of unemployed individuals, with 39.1% or 9 of them being unemployed.
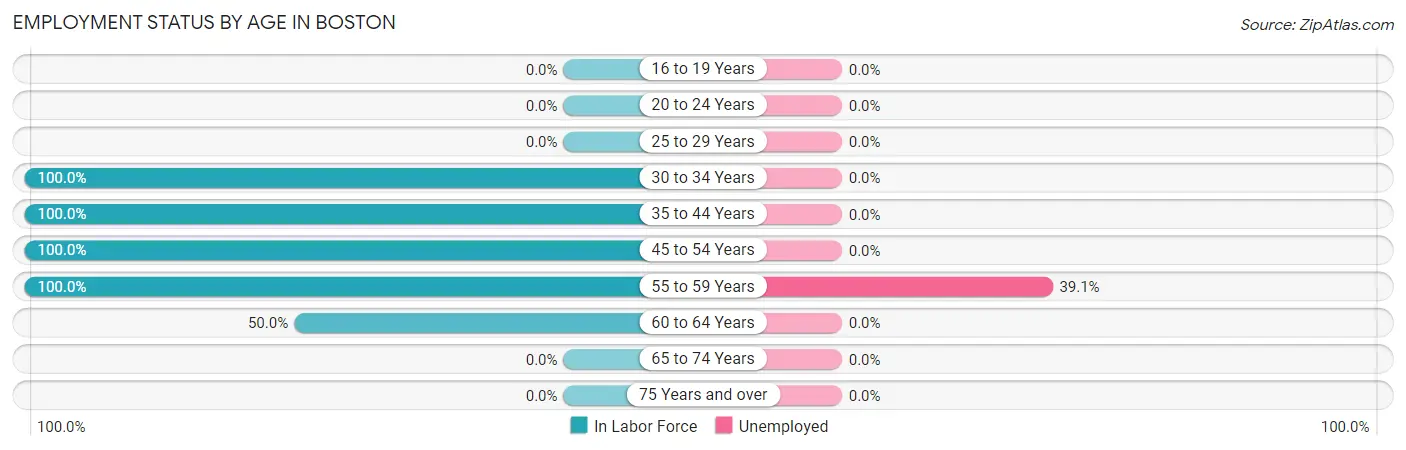
| Age Bracket | In Labor Force | Unemployed |
| 16 to 19 Years | 0 (0.0%) | 0 (0.0%) |
| 20 to 24 Years | 0 (0.0%) | 0 (0.0%) |
| 25 to 29 Years | 0 (0.0%) | 0 (0.0%) |
| 30 to 34 Years | 135 (100.0%) | 0 (0.0%) |
| 35 to 44 Years | 8 (100.0%) | 0 (0.0%) |
| 45 to 54 Years | 57 (100.0%) | 0 (0.0%) |
| 55 to 59 Years | 23 (100.0%) | 9 (39.1%) |
| 60 to 64 Years | 8 (50.0%) | 0 (0.0%) |
| 65 to 74 Years | 0 (0.0%) | 0 (0.0%) |
| 75 Years and over | 0 (0.0%) | 0 (0.0%) |
| Total | 231 (80.8%) | 9 (3.9%) |
Employment Status by Educational Attainment in Boston
According to labor force statistics for Boston, 96.7% of individuals (231) out of the total population between 25 and 64 years of age (239) are in the labor force, with 3.9% or 9 of them being unemployed. The group with the highest labor force participation rate are those with the educational attainment of less than high school, with 100.0% or 11 individuals in the labor force. Within the labor force, individuals with college / associate degree education have the highest percentage of unemployment, with 29.0% or 9 of them being unemployed.
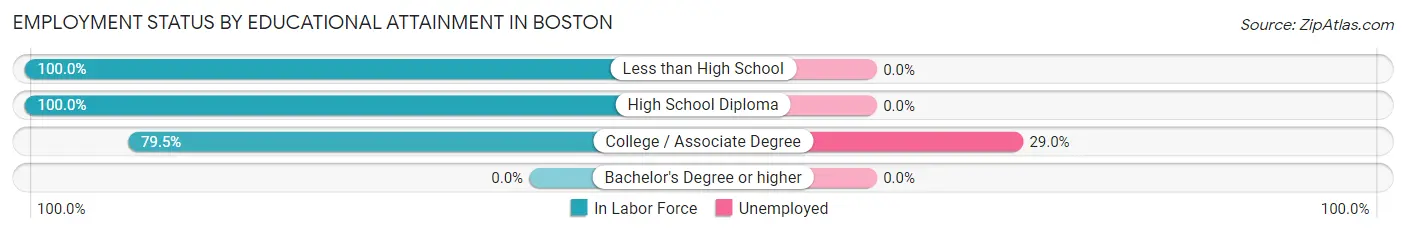
| Educational Attainment | In Labor Force | Unemployed |
| Less than High School | 11 (100.0%) | 0 (0.0%) |
| High School Diploma | 189 (100.0%) | 0 (0.0%) |
| College / Associate Degree | 31 (79.5%) | 11 (29.0%) |
| Bachelor's Degree or higher | 0 (0.0%) | 0 (0.0%) |
| Total | 231 (96.7%) | 9 (3.9%) |
Employment Occupations by Sex in Boston
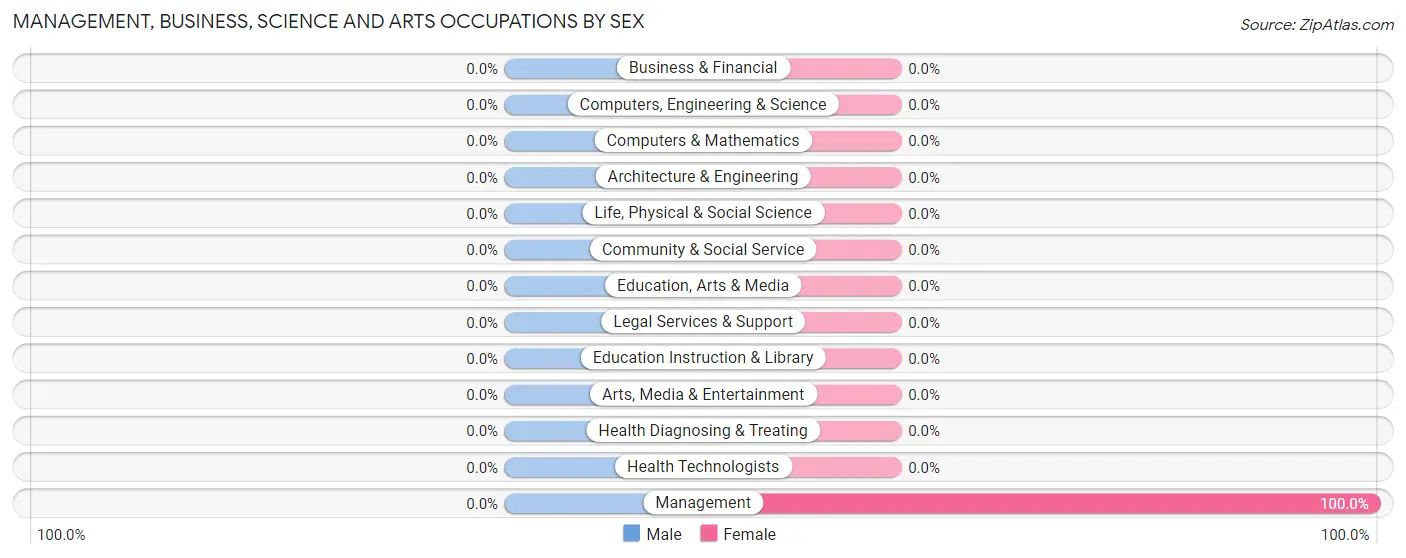
Management, Business, Science and Arts Occupations
The most common Management, Business, Science and Arts occupations in Boston are , and Management (51 | 23.0%).
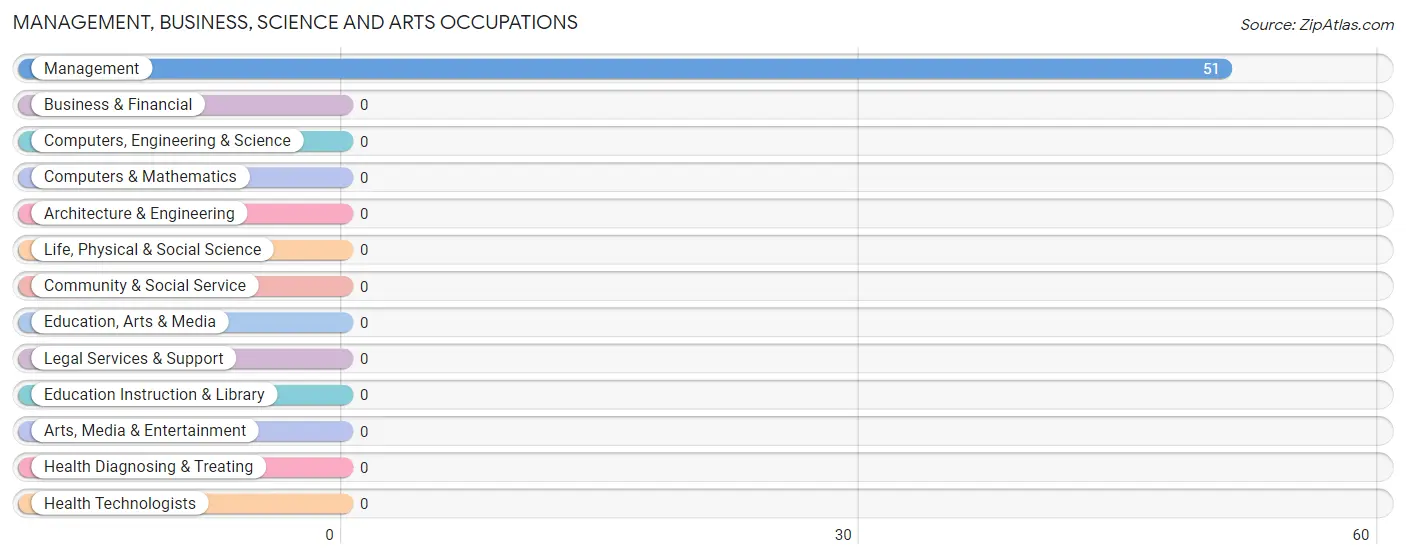
Management, Business, Science and Arts Occupations by Sex
| Occupation | Male | Female |
| Management | 0 (0.0%) | 51 (100.0%) |
| Business & Financial | 0 (0.0%) | 0 (0.0%) |
| Computers, Engineering & Science | 0 (0.0%) | 0 (0.0%) |
| Computers & Mathematics | 0 (0.0%) | 0 (0.0%) |
| Architecture & Engineering | 0 (0.0%) | 0 (0.0%) |
| Life, Physical & Social Science | 0 (0.0%) | 0 (0.0%) |
| Community & Social Service | 0 (0.0%) | 0 (0.0%) |
| Education, Arts & Media | 0 (0.0%) | 0 (0.0%) |
| Legal Services & Support | 0 (0.0%) | 0 (0.0%) |
| Education Instruction & Library | 0 (0.0%) | 0 (0.0%) |
| Arts, Media & Entertainment | 0 (0.0%) | 0 (0.0%) |
| Health Diagnosing & Treating | 0 (0.0%) | 0 (0.0%) |
| Health Technologists | 0 (0.0%) | 0 (0.0%) |
| Total (Category) | 0 (0.0%) | 51 (100.0%) |
| Total (Overall) | 163 (73.4%) | 59 (26.6%) |
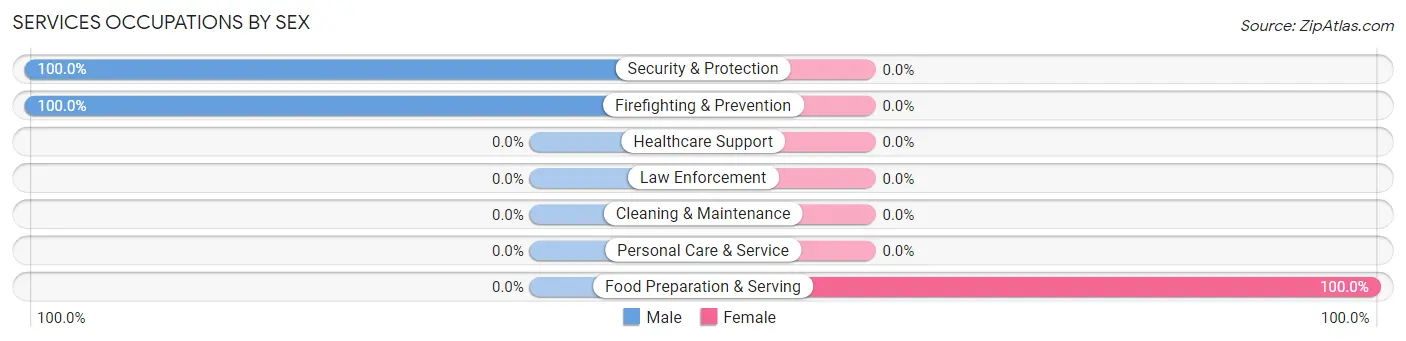
Services Occupations
The most common Services occupations in Boston are Security & Protection (22 | 9.9%), Firefighting & Prevention (22 | 9.9%), and Food Preparation & Serving (8 | 3.6%).
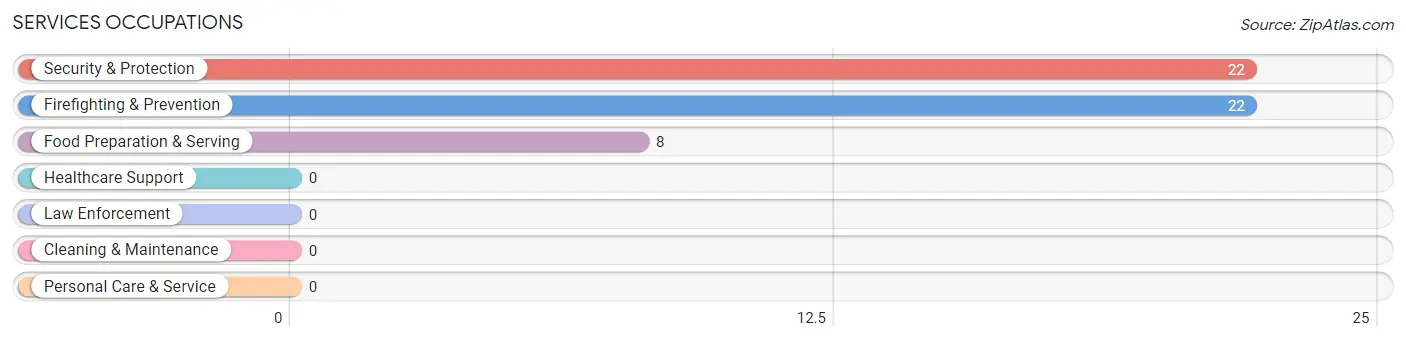
Services Occupations by Sex
| Occupation | Male | Female |
| Healthcare Support | 0 (0.0%) | 0 (0.0%) |
| Security & Protection | 22 (100.0%) | 0 (0.0%) |
| Firefighting & Prevention | 22 (100.0%) | 0 (0.0%) |
| Law Enforcement | 0 (0.0%) | 0 (0.0%) |
| Food Preparation & Serving | 0 (0.0%) | 8 (100.0%) |
| Cleaning & Maintenance | 0 (0.0%) | 0 (0.0%) |
| Personal Care & Service | 0 (0.0%) | 0 (0.0%) |
| Total (Category) | 22 (73.3%) | 8 (26.7%) |
| Total (Overall) | 163 (73.4%) | 59 (26.6%) |
Sales and Office Occupations
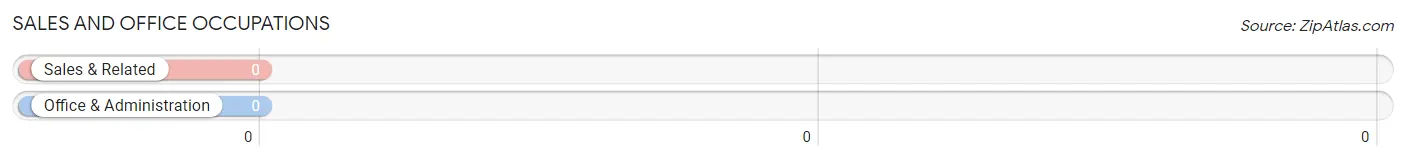
Sales and Office Occupations by Sex
| Occupation | Male | Female |
| Sales & Related | 0 (0.0%) | 0 (0.0%) |
| Office & Administration | 0 (0.0%) | 0 (0.0%) |
| Total (Category) | 0 (0.0%) | 0 (0.0%) |
| Total (Overall) | 163 (73.4%) | 59 (26.6%) |
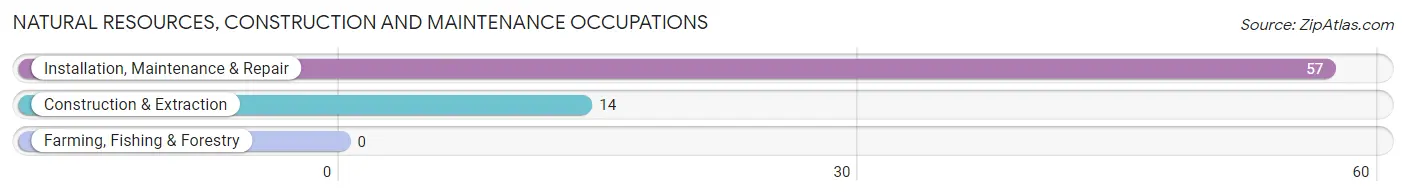
Natural Resources, Construction and Maintenance Occupations
The most common Natural Resources, Construction and Maintenance occupations in Boston are Installation, Maintenance & Repair (57 | 25.7%), and Construction & Extraction (14 | 6.3%).
Natural Resources, Construction and Maintenance Occupations by Sex
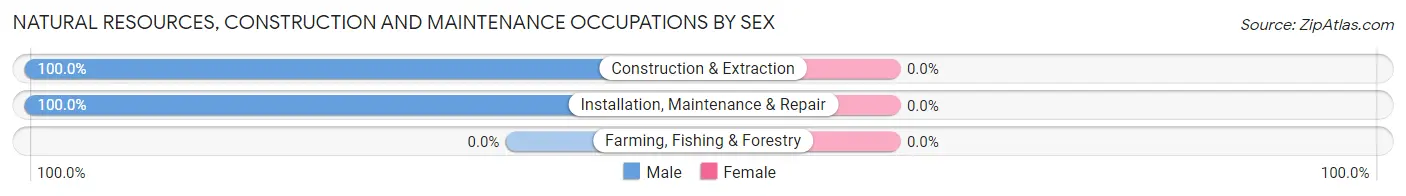
| Occupation | Male | Female |
| Farming, Fishing & Forestry | 0 (0.0%) | 0 (0.0%) |
| Construction & Extraction | 14 (100.0%) | 0 (0.0%) |
| Installation, Maintenance & Repair | 57 (100.0%) | 0 (0.0%) |
| Total (Category) | 71 (100.0%) | 0 (0.0%) |
| Total (Overall) | 163 (73.4%) | 59 (26.6%) |
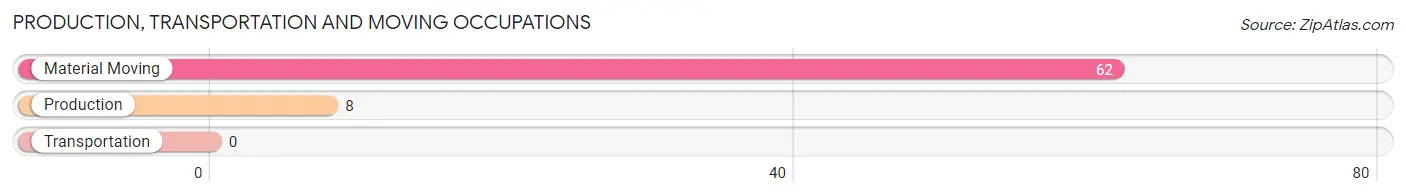
Production, Transportation and Moving Occupations
The most common Production, Transportation and Moving occupations in Boston are Material Moving (62 | 27.9%), and Production (8 | 3.6%).
Production, Transportation and Moving Occupations by Sex
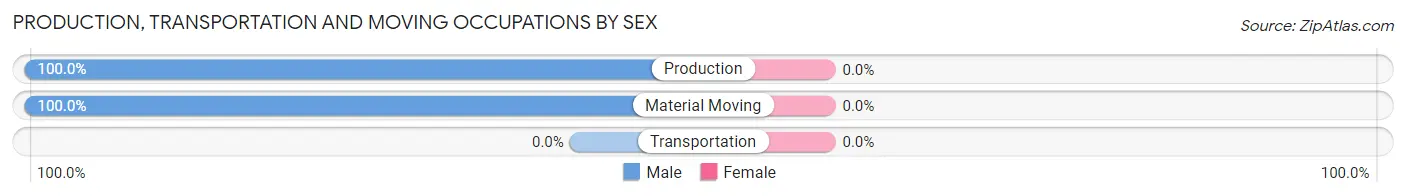
| Occupation | Male | Female |
| Production | 8 (100.0%) | 0 (0.0%) |
| Transportation | 0 (0.0%) | 0 (0.0%) |
| Material Moving | 62 (100.0%) | 0 (0.0%) |
| Total (Category) | 70 (100.0%) | 0 (0.0%) |
| Total (Overall) | 163 (73.4%) | 59 (26.6%) |
Employment Industries by Sex in Boston
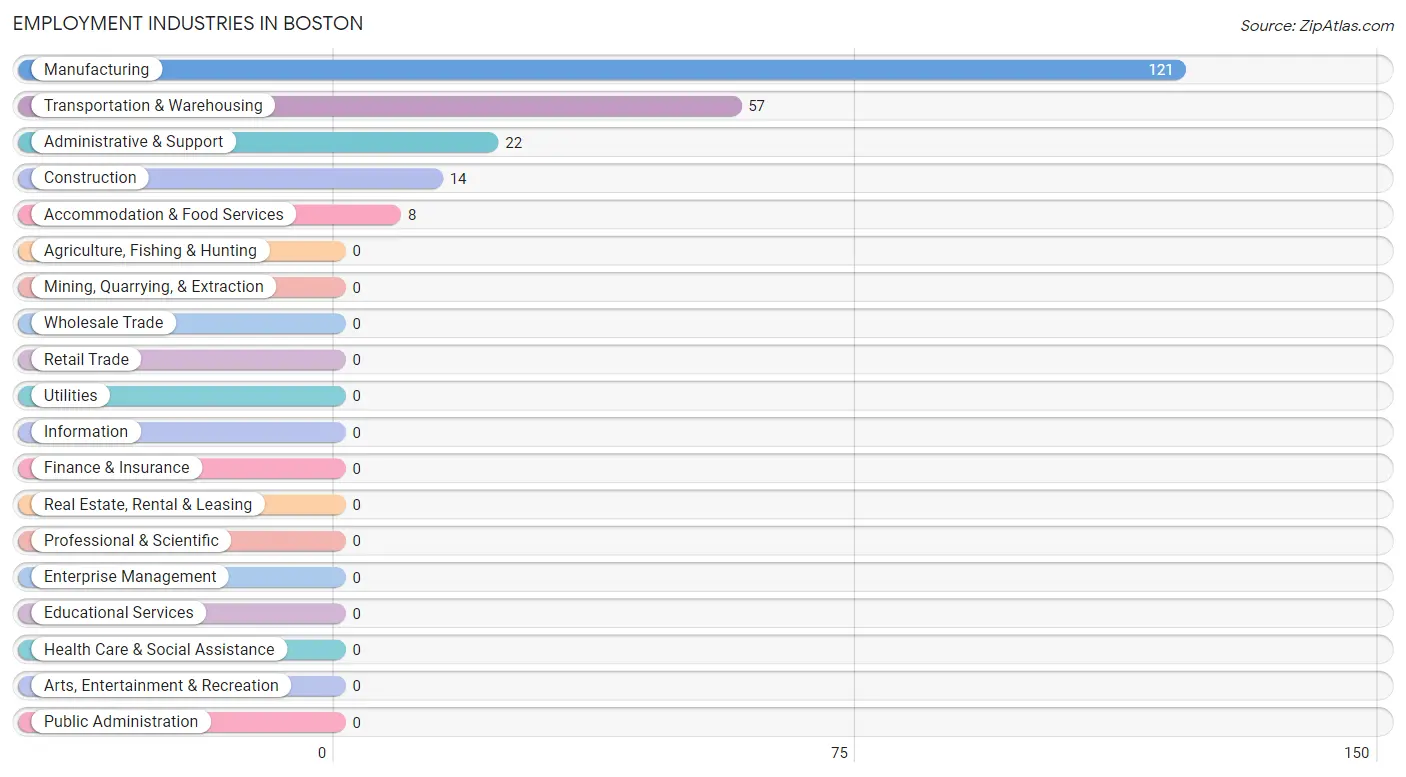
Employment Industries in Boston
The major employment industries in Boston include Manufacturing (121 | 54.5%), Transportation & Warehousing (57 | 25.7%), Administrative & Support (22 | 9.9%), Construction (14 | 6.3%), and Accommodation & Food Services (8 | 3.6%).
Employment Industries by Sex in Boston
The Boston industries that see more men than women are Construction (100.0%), Transportation & Warehousing (100.0%), and Administrative & Support (100.0%), whereas the industries that tend to have a higher number of women are Accommodation & Food Services (100.0%), and Manufacturing (42.1%).
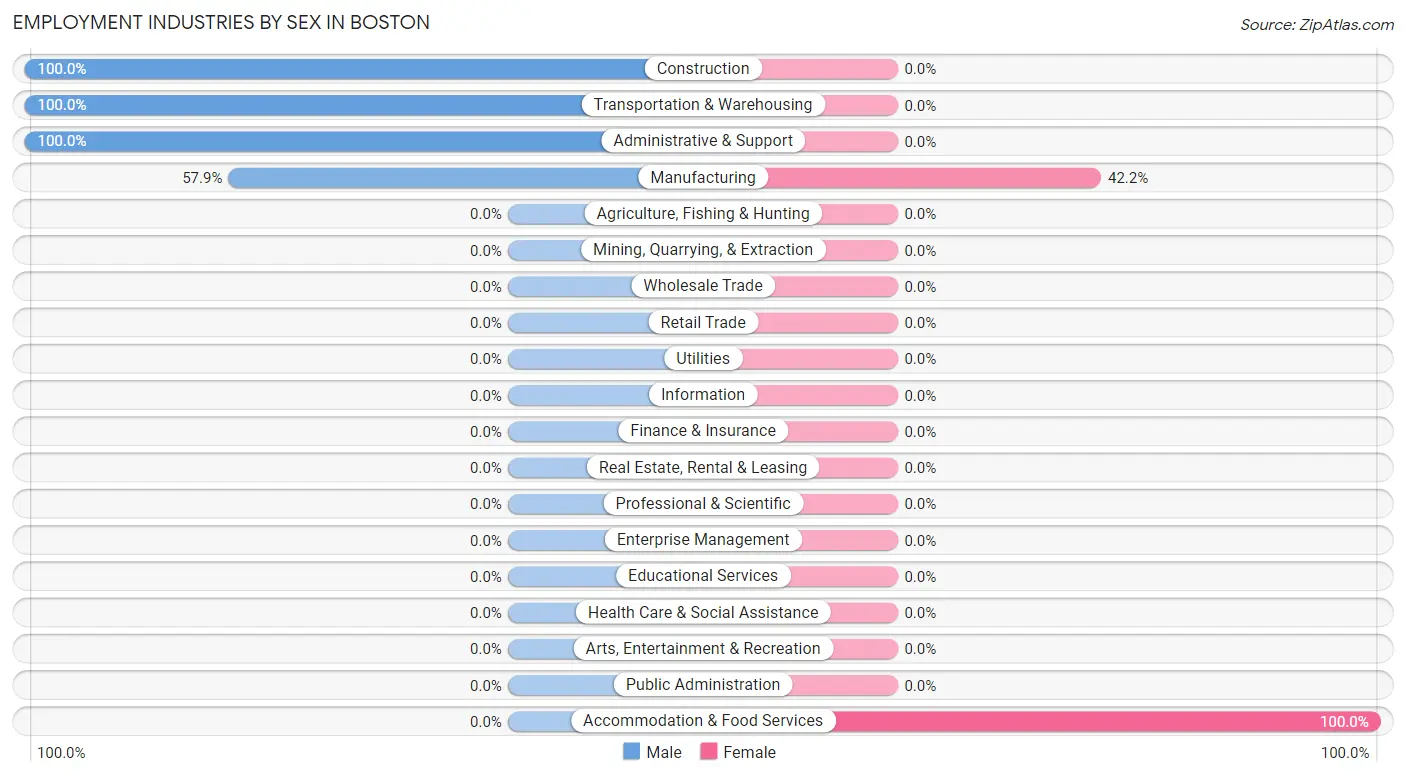
| Industry | Male | Female |
| Agriculture, Fishing & Hunting | 0 (0.0%) | 0 (0.0%) |
| Mining, Quarrying, & Extraction | 0 (0.0%) | 0 (0.0%) |
| Construction | 14 (100.0%) | 0 (0.0%) |
| Manufacturing | 70 (57.9%) | 51 (42.1%) |
| Wholesale Trade | 0 (0.0%) | 0 (0.0%) |
| Retail Trade | 0 (0.0%) | 0 (0.0%) |
| Transportation & Warehousing | 57 (100.0%) | 0 (0.0%) |
| Utilities | 0 (0.0%) | 0 (0.0%) |
| Information | 0 (0.0%) | 0 (0.0%) |
| Finance & Insurance | 0 (0.0%) | 0 (0.0%) |
| Real Estate, Rental & Leasing | 0 (0.0%) | 0 (0.0%) |
| Professional & Scientific | 0 (0.0%) | 0 (0.0%) |
| Enterprise Management | 0 (0.0%) | 0 (0.0%) |
| Administrative & Support | 22 (100.0%) | 0 (0.0%) |
| Educational Services | 0 (0.0%) | 0 (0.0%) |
| Health Care & Social Assistance | 0 (0.0%) | 0 (0.0%) |
| Arts, Entertainment & Recreation | 0 (0.0%) | 0 (0.0%) |
| Accommodation & Food Services | 0 (0.0%) | 8 (100.0%) |
| Public Administration | 0 (0.0%) | 0 (0.0%) |
| Total | 163 (73.4%) | 59 (26.6%) |
Education in Boston
School Enrollment in Boston
The most common levels of schooling among the 140 students in Boston are middle school (72 | 51.4%), elementary school (48 | 34.3%), and high school (20 | 14.3%).
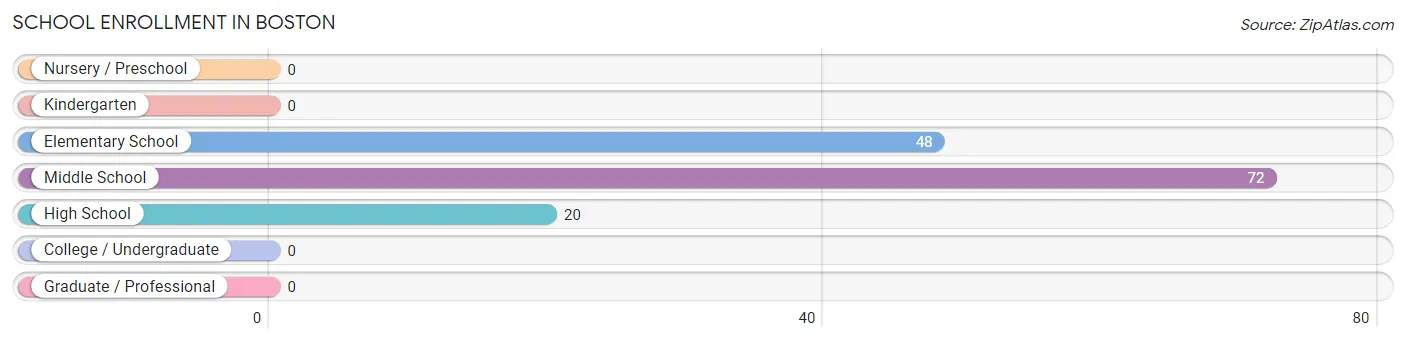
| School Level | # Students | % Students |
| Nursery / Preschool | 0 | 0.0% |
| Kindergarten | 0 | 0.0% |
| Elementary School | 48 | 34.3% |
| Middle School | 72 | 51.4% |
| High School | 20 | 14.3% |
| College / Undergraduate | 0 | 0.0% |
| Graduate / Professional | 0 | 0.0% |
| Total | 140 | 100.0% |
School Enrollment by Age by Funding Source in Boston
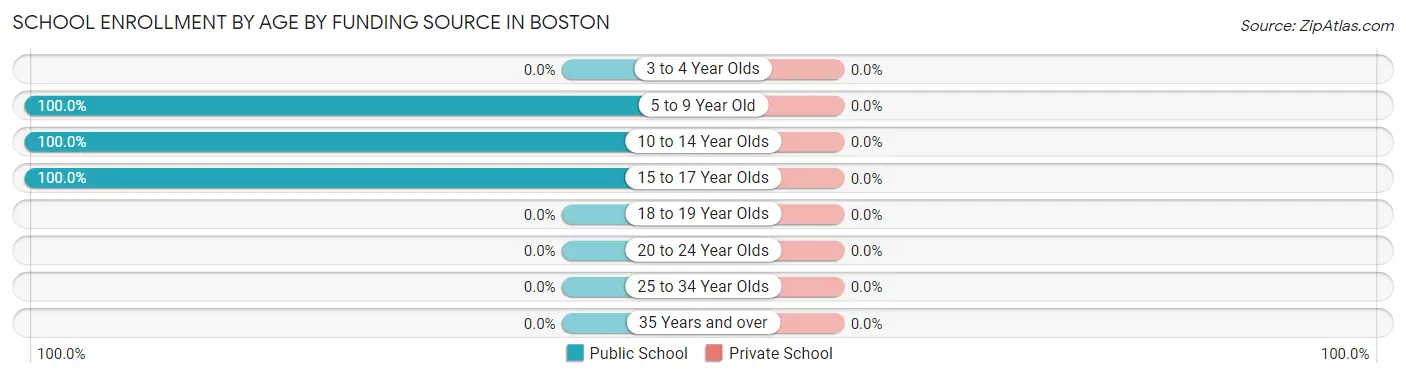
| Age Bracket | Public School | Private School |
| 3 to 4 Year Olds | 0 (0.0%) | 0 (0.0%) |
| 5 to 9 Year Old | 48 (100.0%) | 0 (0.0%) |
| 10 to 14 Year Olds | 72 (100.0%) | 0 (0.0%) |
| 15 to 17 Year Olds | 20 (100.0%) | 0 (0.0%) |
| 18 to 19 Year Olds | 0 (0.0%) | 0 (0.0%) |
| 20 to 24 Year Olds | 0 (0.0%) | 0 (0.0%) |
| 25 to 34 Year Olds | 0 (0.0%) | 0 (0.0%) |
| 35 Years and over | 0 (0.0%) | 0 (0.0%) |
| Total | 140 (100.0%) | 0 (0.0%) |
Educational Attainment by Field of Study in Boston
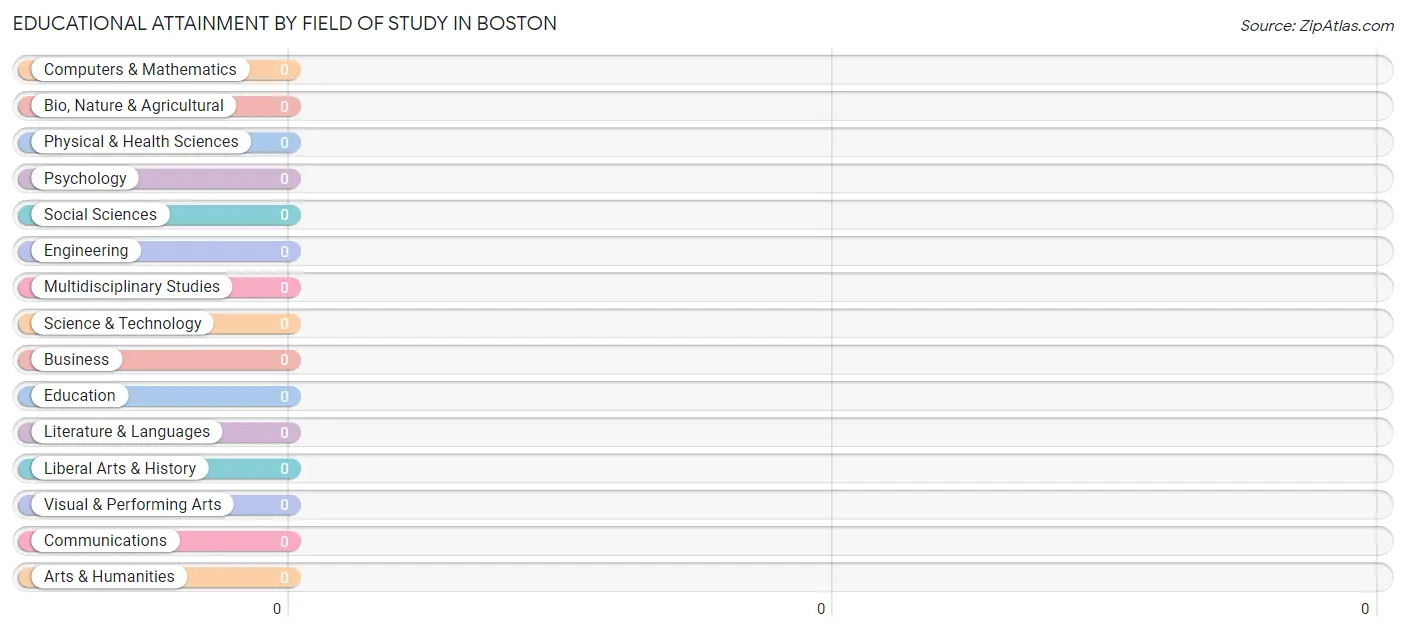
| Field of Study | # Graduates | % Graduates |
| Computers & Mathematics | 0 | 0.0% |
| Bio, Nature & Agricultural | 0 | 0.0% |
| Physical & Health Sciences | 0 | 0.0% |
| Psychology | 0 | 0.0% |
| Social Sciences | 0 | 0.0% |
| Engineering | 0 | 0.0% |
| Multidisciplinary Studies | 0 | 0.0% |
| Science & Technology | 0 | 0.0% |
| Business | 0 | 0.0% |
| Education | 0 | 0.0% |
| Literature & Languages | 0 | 0.0% |
| Liberal Arts & History | 0 | 0.0% |
| Visual & Performing Arts | 0 | 0.0% |
| Communications | 0 | 0.0% |
| Arts & Humanities | 0 | 0.0% |
| Total | 0 | 0.0% |
Transportation & Commute in Boston
Vehicle Availability by Sex in Boston
The most prevalent vehicle ownership categories in Boston are males with 2 vehicles (119, accounting for 73.0%) and females with 2 vehicles (51, making up 201.7%).
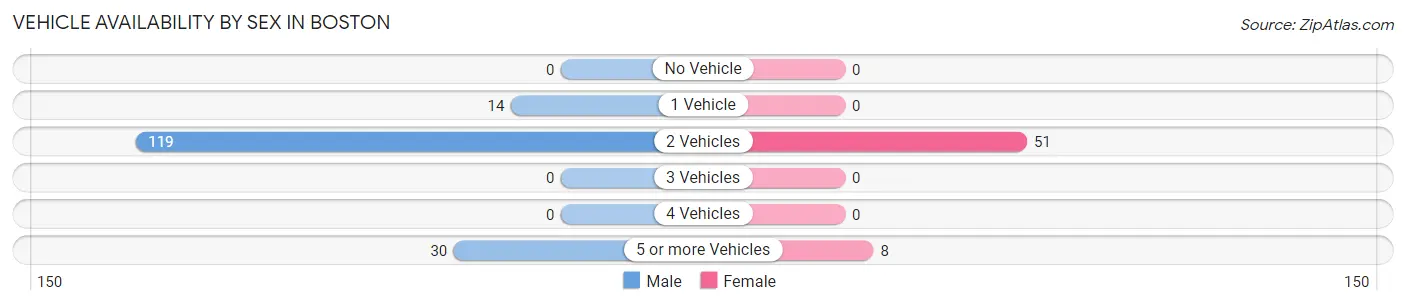
| Vehicles Available | Male | Female |
| No Vehicle | 0 (0.0%) | 0 (0.0%) |
| 1 Vehicle | 14 (8.6%) | 0 (0.0%) |
| 2 Vehicles | 119 (73.0%) | 51 (86.4%) |
| 3 Vehicles | 0 (0.0%) | 0 (0.0%) |
| 4 Vehicles | 0 (0.0%) | 0 (0.0%) |
| 5 or more Vehicles | 30 (18.4%) | 8 (13.6%) |
| Total | 163 (100.0%) | 59 (100.0%) |
Commute Time in Boston
The most frequently occuring commute durations in Boston are 40 to 44 minutes (108 commuters, 51.9%), 20 to 24 minutes (62 commuters, 29.8%), and 15 to 19 minutes (19 commuters, 9.1%).
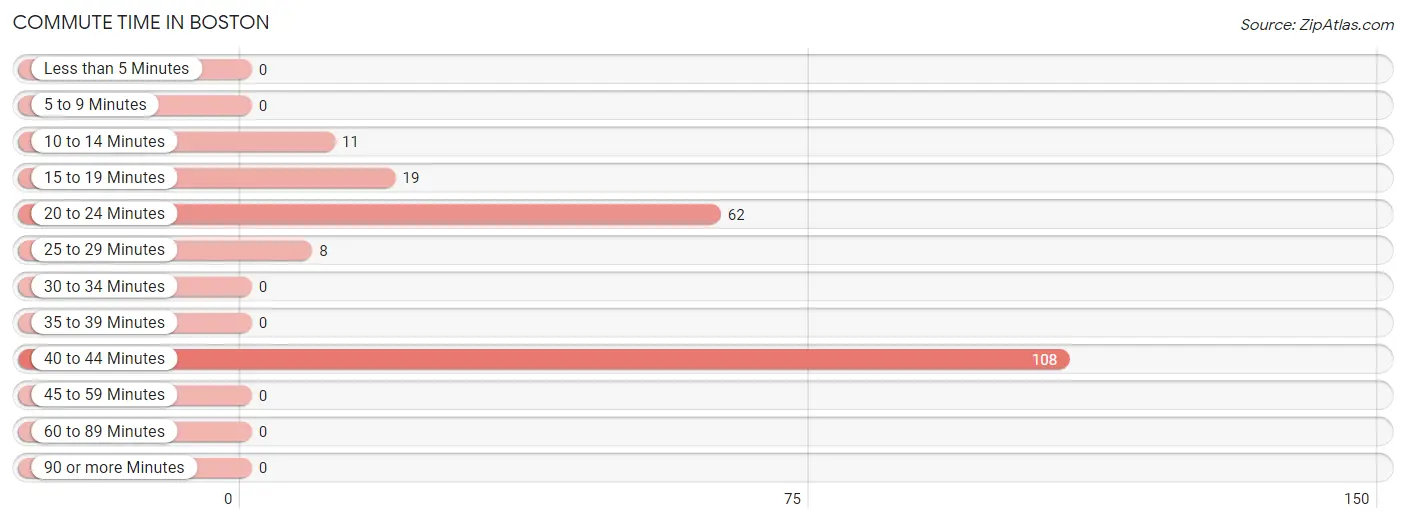
| Commute Time | # Commuters | % Commuters |
| Less than 5 Minutes | 0 | 0.0% |
| 5 to 9 Minutes | 0 | 0.0% |
| 10 to 14 Minutes | 11 | 5.3% |
| 15 to 19 Minutes | 19 | 9.1% |
| 20 to 24 Minutes | 62 | 29.8% |
| 25 to 29 Minutes | 8 | 3.8% |
| 30 to 34 Minutes | 0 | 0.0% |
| 35 to 39 Minutes | 0 | 0.0% |
| 40 to 44 Minutes | 108 | 51.9% |
| 45 to 59 Minutes | 0 | 0.0% |
| 60 to 89 Minutes | 0 | 0.0% |
| 90 or more Minutes | 0 | 0.0% |
Commute Time by Sex in Boston
The most common commute times in Boston are 20 to 24 minutes (62 commuters, 41.6%) for males and 40 to 44 minutes (51 commuters, 86.4%) for females.
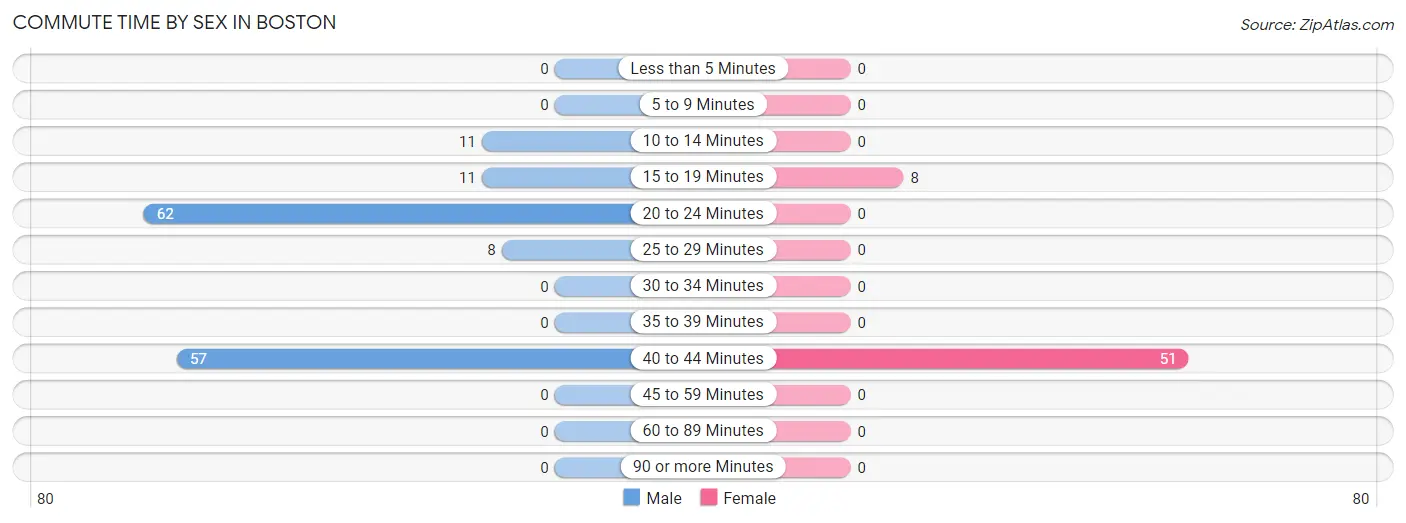
| Commute Time | Male | Female |
| Less than 5 Minutes | 0 (0.0%) | 0 (0.0%) |
| 5 to 9 Minutes | 0 (0.0%) | 0 (0.0%) |
| 10 to 14 Minutes | 11 (7.4%) | 0 (0.0%) |
| 15 to 19 Minutes | 11 (7.4%) | 8 (13.6%) |
| 20 to 24 Minutes | 62 (41.6%) | 0 (0.0%) |
| 25 to 29 Minutes | 8 (5.4%) | 0 (0.0%) |
| 30 to 34 Minutes | 0 (0.0%) | 0 (0.0%) |
| 35 to 39 Minutes | 0 (0.0%) | 0 (0.0%) |
| 40 to 44 Minutes | 57 (38.3%) | 51 (86.4%) |
| 45 to 59 Minutes | 0 (0.0%) | 0 (0.0%) |
| 60 to 89 Minutes | 0 (0.0%) | 0 (0.0%) |
| 90 or more Minutes | 0 (0.0%) | 0 (0.0%) |
Time of Departure to Work by Sex in Boston
The most frequent times of departure to work in Boston are 5:00 AM to 5:29 AM (127, 85.2%) for males and 12:00 PM to 3:59 PM (51, 86.4%) for females.
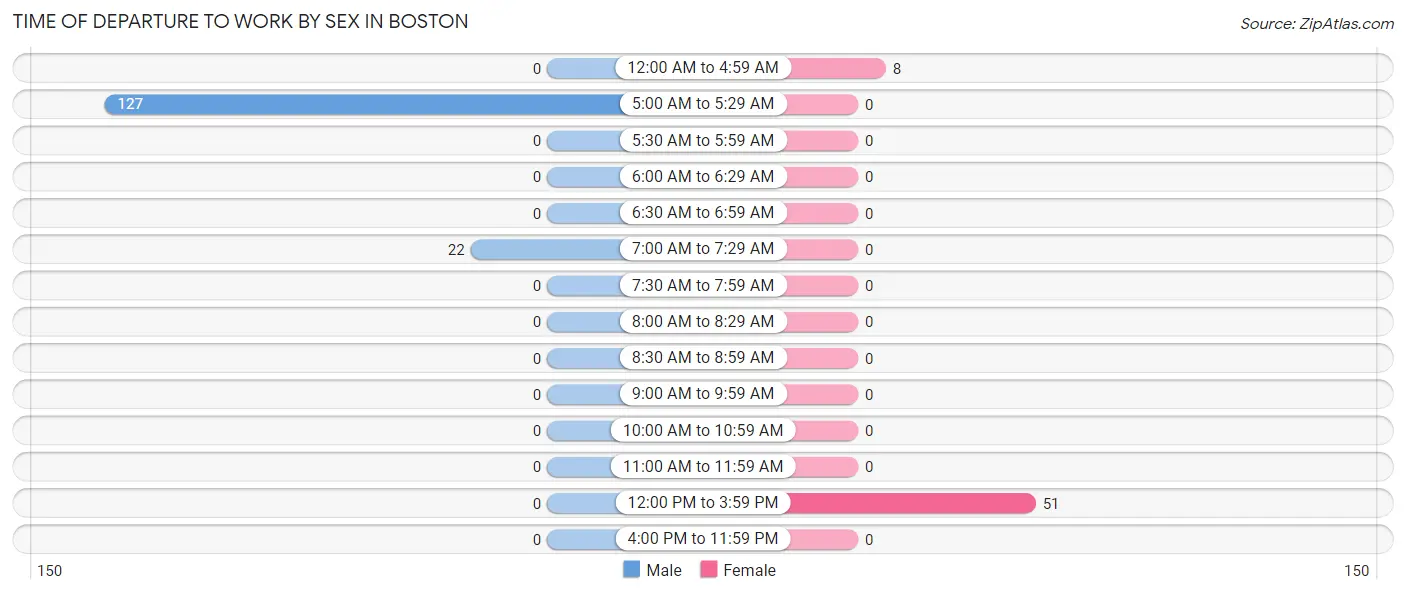
| Time of Departure | Male | Female |
| 12:00 AM to 4:59 AM | 0 (0.0%) | 8 (13.6%) |
| 5:00 AM to 5:29 AM | 127 (85.2%) | 0 (0.0%) |
| 5:30 AM to 5:59 AM | 0 (0.0%) | 0 (0.0%) |
| 6:00 AM to 6:29 AM | 0 (0.0%) | 0 (0.0%) |
| 6:30 AM to 6:59 AM | 0 (0.0%) | 0 (0.0%) |
| 7:00 AM to 7:29 AM | 22 (14.8%) | 0 (0.0%) |
| 7:30 AM to 7:59 AM | 0 (0.0%) | 0 (0.0%) |
| 8:00 AM to 8:29 AM | 0 (0.0%) | 0 (0.0%) |
| 8:30 AM to 8:59 AM | 0 (0.0%) | 0 (0.0%) |
| 9:00 AM to 9:59 AM | 0 (0.0%) | 0 (0.0%) |
| 10:00 AM to 10:59 AM | 0 (0.0%) | 0 (0.0%) |
| 11:00 AM to 11:59 AM | 0 (0.0%) | 0 (0.0%) |
| 12:00 PM to 3:59 PM | 0 (0.0%) | 51 (86.4%) |
| 4:00 PM to 11:59 PM | 0 (0.0%) | 0 (0.0%) |
| Total | 149 (100.0%) | 59 (100.0%) |
Housing Occupancy in Boston
Occupancy by Ownership in Boston
Of the total 143 dwellings in Boston, owner-occupied units account for 92 (64.3%), while renter-occupied units make up 51 (35.7%).
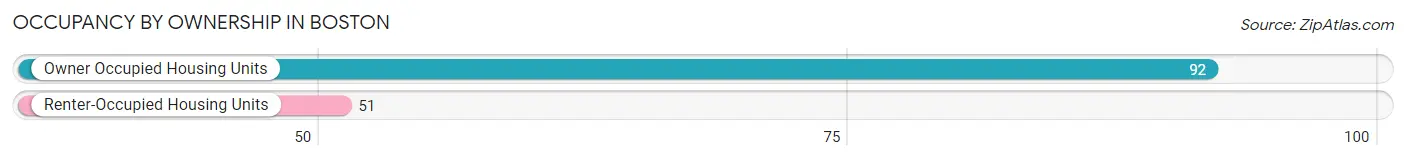
| Occupancy | # Housing Units | % Housing Units |
| Owner Occupied Housing Units | 92 | 64.3% |
| Renter-Occupied Housing Units | 51 | 35.7% |
| Total Occupied Housing Units | 143 | 100.0% |
Occupancy by Household Size in Boston
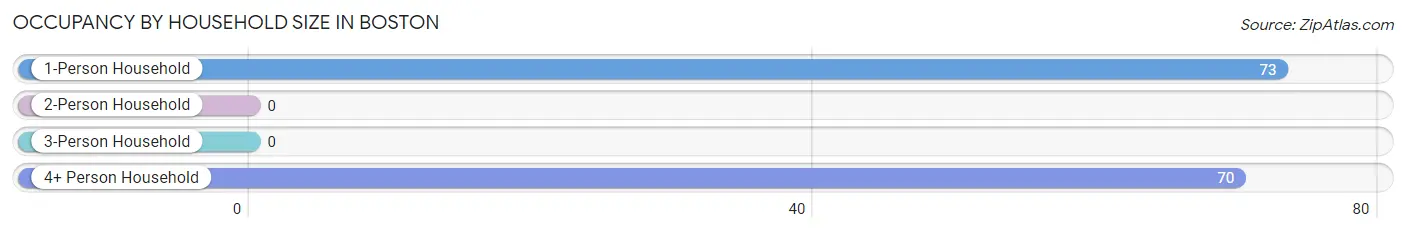
| Household Size | # Housing Units | % Housing Units |
| 1-Person Household | 73 | 51.0% |
| 2-Person Household | 0 | 0.0% |
| 3-Person Household | 0 | 0.0% |
| 4+ Person Household | 70 | 48.9% |
| Total Housing Units | 143 | 100.0% |
Occupancy by Ownership by Household Size in Boston
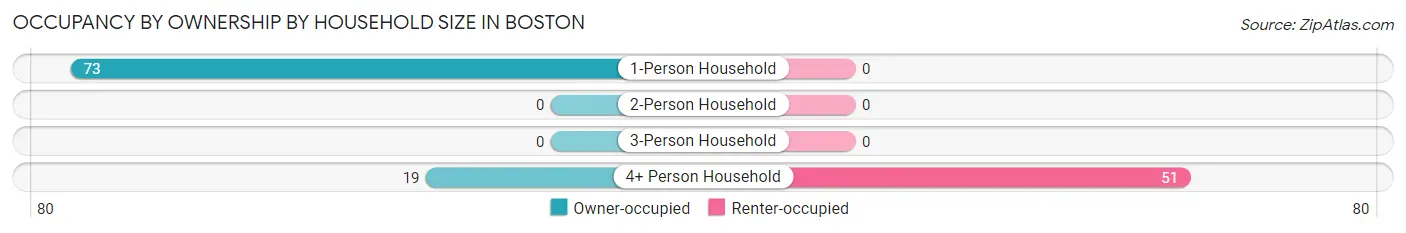
| Household Size | Owner-occupied | Renter-occupied |
| 1-Person Household | 73 (100.0%) | 0 (0.0%) |
| 2-Person Household | 0 (0.0%) | 0 (0.0%) |
| 3-Person Household | 0 (0.0%) | 0 (0.0%) |
| 4+ Person Household | 19 (27.1%) | 51 (72.9%) |
| Total Housing Units | 92 (64.3%) | 51 (35.7%) |
Occupancy by Educational Attainment in Boston
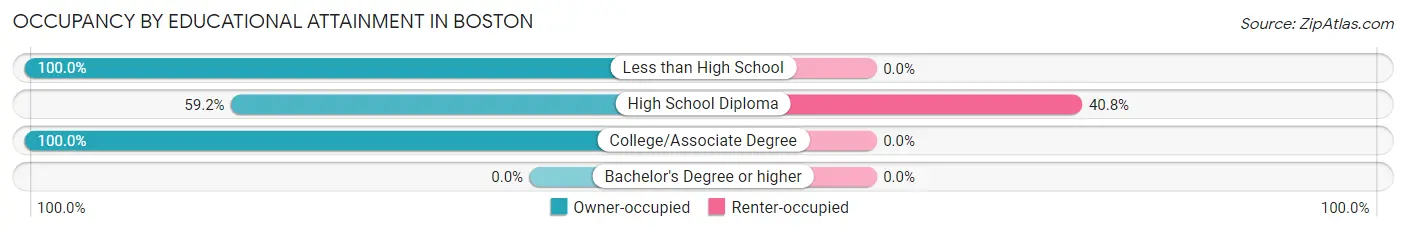
| Household Size | Owner-occupied | Renter-occupied |
| Less than High School | 10 (100.0%) | 0 (0.0%) |
| High School Diploma | 74 (59.2%) | 51 (40.8%) |
| College/Associate Degree | 8 (100.0%) | 0 (0.0%) |
| Bachelor's Degree or higher | 0 (0.0%) | 0 (0.0%) |
Occupancy by Age of Householder in Boston
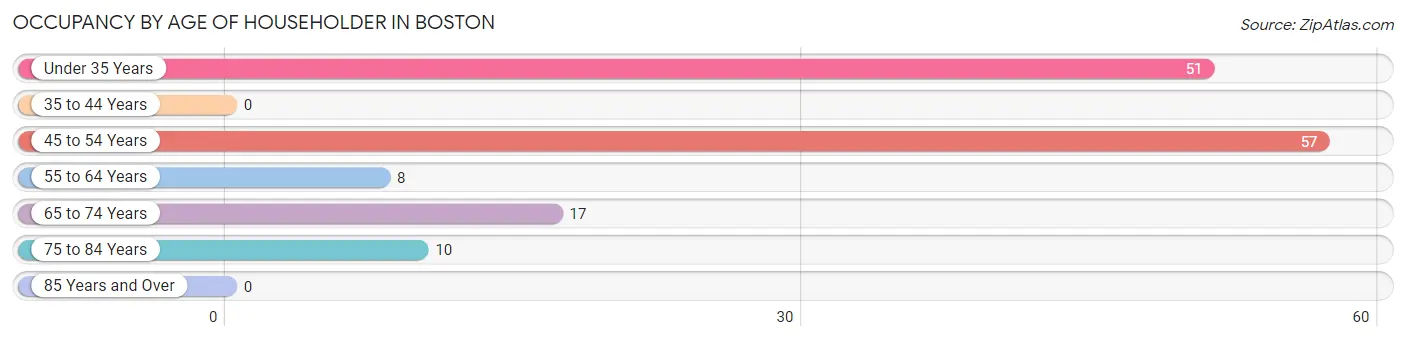
| Age Bracket | # Households | % Households |
| Under 35 Years | 51 | 35.7% |
| 35 to 44 Years | 0 | 0.0% |
| 45 to 54 Years | 57 | 39.9% |
| 55 to 64 Years | 8 | 5.6% |
| 65 to 74 Years | 17 | 11.9% |
| 75 to 84 Years | 10 | 7.0% |
| 85 Years and Over | 0 | 0.0% |
| Total | 143 | 100.0% |
Housing Finances in Boston
Median Income by Occupancy in Boston
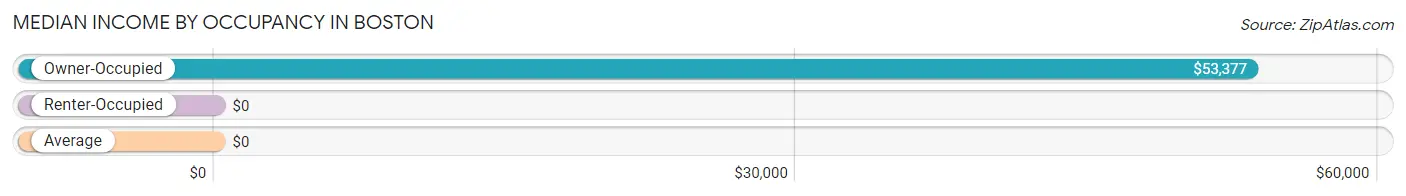
| Occupancy Type | # Households | Median Income |
| Owner-Occupied | 92 (64.3%) | $53,377 |
| Renter-Occupied | 51 (35.7%) | $0 |
| Average | 143 (100.0%) | $0 |
Occupancy by Householder Income Bracket in Boston
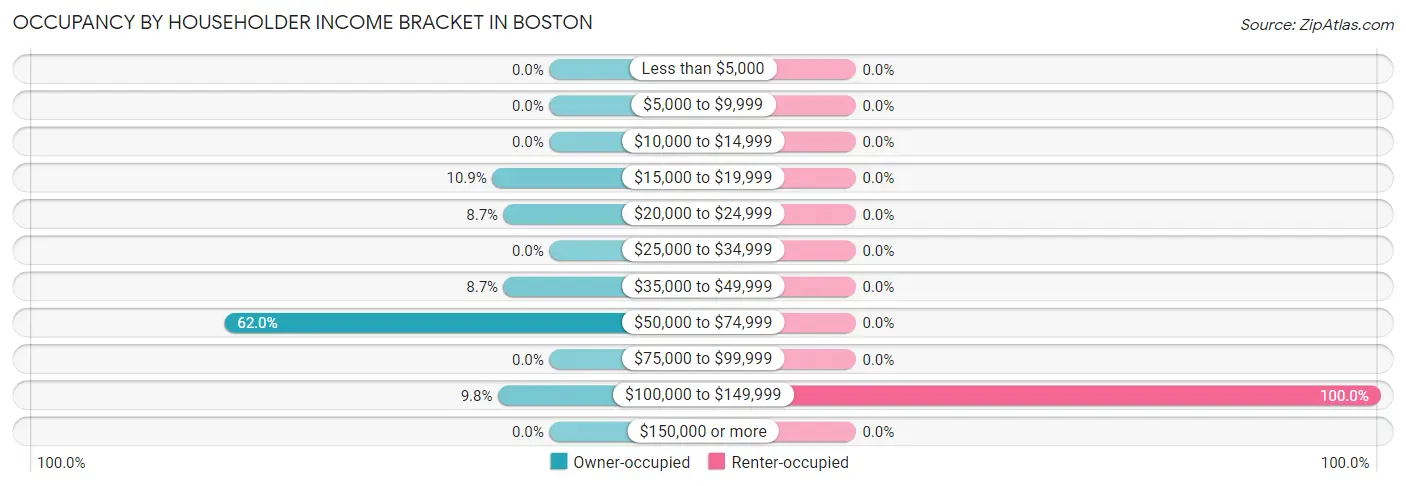
| Income Bracket | Owner-occupied | Renter-occupied |
| Less than $5,000 | 0 (0.0%) | 0 (0.0%) |
| $5,000 to $9,999 | 0 (0.0%) | 0 (0.0%) |
| $10,000 to $14,999 | 0 (0.0%) | 0 (0.0%) |
| $15,000 to $19,999 | 10 (10.9%) | 0 (0.0%) |
| $20,000 to $24,999 | 8 (8.7%) | 0 (0.0%) |
| $25,000 to $34,999 | 0 (0.0%) | 0 (0.0%) |
| $35,000 to $49,999 | 8 (8.7%) | 0 (0.0%) |
| $50,000 to $74,999 | 57 (62.0%) | 0 (0.0%) |
| $75,000 to $99,999 | 0 (0.0%) | 0 (0.0%) |
| $100,000 to $149,999 | 9 (9.8%) | 51 (100.0%) |
| $150,000 or more | 0 (0.0%) | 0 (0.0%) |
| Total | 92 (100.0%) | 51 (100.0%) |
Monthly Housing Cost Tiers in Boston
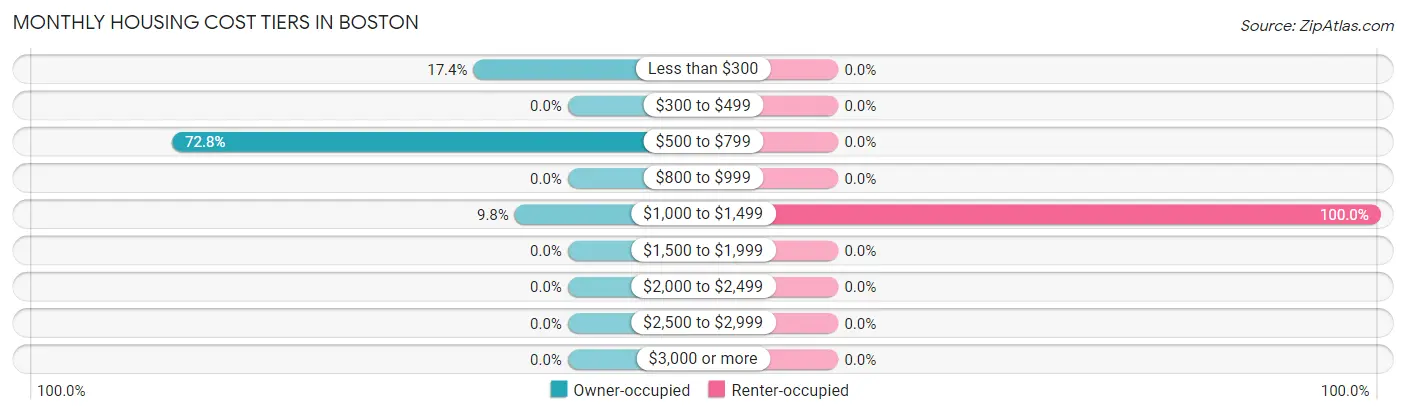
| Monthly Cost | Owner-occupied | Renter-occupied |
| Less than $300 | 16 (17.4%) | 0 (0.0%) |
| $300 to $499 | 0 (0.0%) | 0 (0.0%) |
| $500 to $799 | 67 (72.8%) | 0 (0.0%) |
| $800 to $999 | 0 (0.0%) | 0 (0.0%) |
| $1,000 to $1,499 | 9 (9.8%) | 51 (100.0%) |
| $1,500 to $1,999 | 0 (0.0%) | 0 (0.0%) |
| $2,000 to $2,499 | 0 (0.0%) | 0 (0.0%) |
| $2,500 to $2,999 | 0 (0.0%) | 0 (0.0%) |
| $3,000 or more | 0 (0.0%) | 0 (0.0%) |
| Total | 92 (100.0%) | 51 (100.0%) |
Physical Housing Characteristics in Boston
Housing Structures in Boston
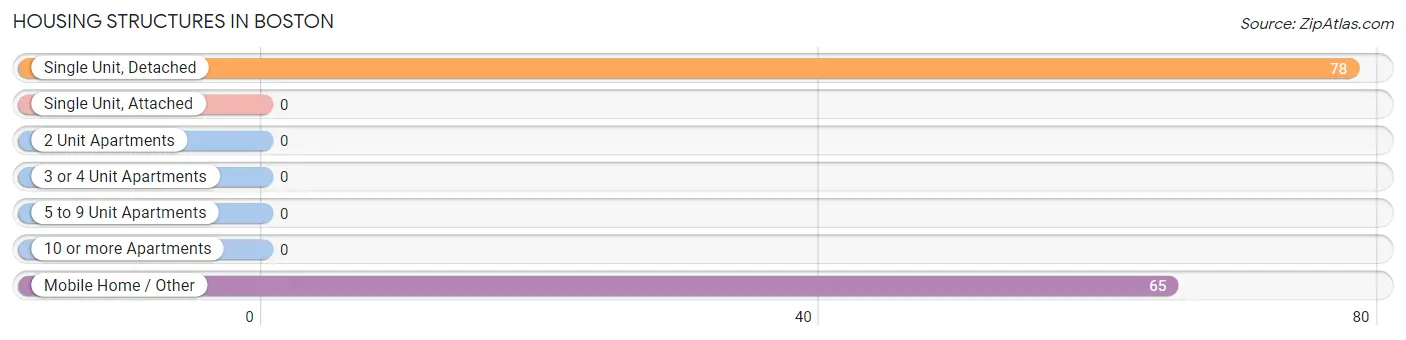
| Structure Type | # Housing Units | % Housing Units |
| Single Unit, Detached | 78 | 54.5% |
| Single Unit, Attached | 0 | 0.0% |
| 2 Unit Apartments | 0 | 0.0% |
| 3 or 4 Unit Apartments | 0 | 0.0% |
| 5 to 9 Unit Apartments | 0 | 0.0% |
| 10 or more Apartments | 0 | 0.0% |
| Mobile Home / Other | 65 | 45.5% |
| Total | 143 | 100.0% |
Housing Structures by Occupancy in Boston
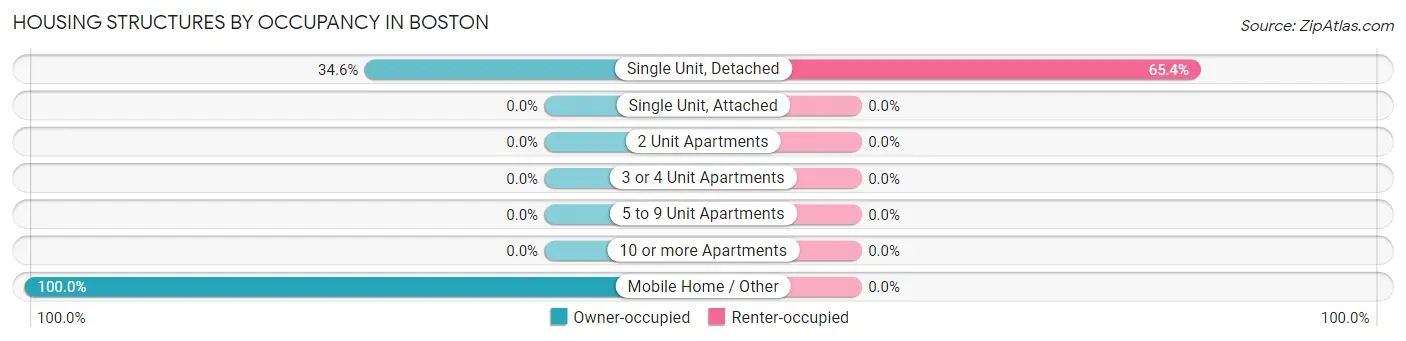
| Structure Type | Owner-occupied | Renter-occupied |
| Single Unit, Detached | 27 (34.6%) | 51 (65.4%) |
| Single Unit, Attached | 0 (0.0%) | 0 (0.0%) |
| 2 Unit Apartments | 0 (0.0%) | 0 (0.0%) |
| 3 or 4 Unit Apartments | 0 (0.0%) | 0 (0.0%) |
| 5 to 9 Unit Apartments | 0 (0.0%) | 0 (0.0%) |
| 10 or more Apartments | 0 (0.0%) | 0 (0.0%) |
| Mobile Home / Other | 65 (100.0%) | 0 (0.0%) |
| Total | 92 (64.3%) | 51 (35.7%) |
Housing Structures by Number of Rooms in Boston
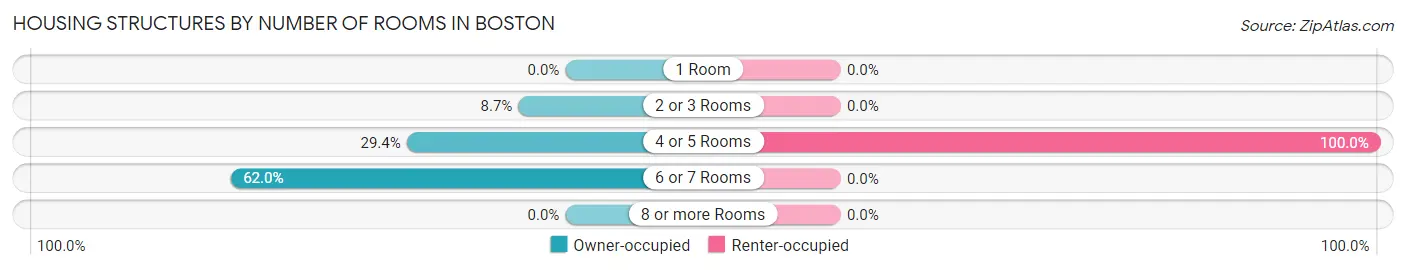
| Number of Rooms | Owner-occupied | Renter-occupied |
| 1 Room | 0 (0.0%) | 0 (0.0%) |
| 2 or 3 Rooms | 8 (8.7%) | 0 (0.0%) |
| 4 or 5 Rooms | 27 (29.3%) | 51 (100.0%) |
| 6 or 7 Rooms | 57 (62.0%) | 0 (0.0%) |
| 8 or more Rooms | 0 (0.0%) | 0 (0.0%) |
| Total | 92 (100.0%) | 51 (100.0%) |
Housing Structure by Heating Type in Boston
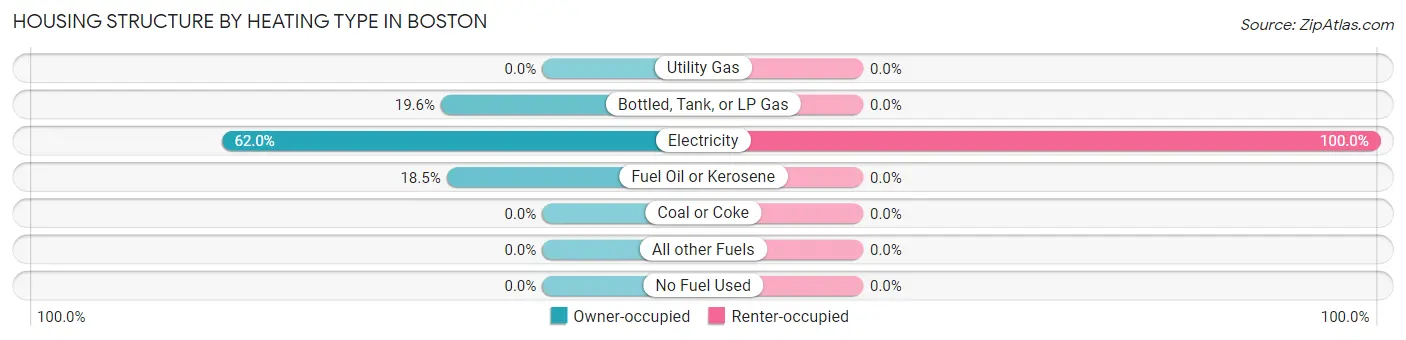
| Heating Type | Owner-occupied | Renter-occupied |
| Utility Gas | 0 (0.0%) | 0 (0.0%) |
| Bottled, Tank, or LP Gas | 18 (19.6%) | 0 (0.0%) |
| Electricity | 57 (62.0%) | 51 (100.0%) |
| Fuel Oil or Kerosene | 17 (18.5%) | 0 (0.0%) |
| Coal or Coke | 0 (0.0%) | 0 (0.0%) |
| All other Fuels | 0 (0.0%) | 0 (0.0%) |
| No Fuel Used | 0 (0.0%) | 0 (0.0%) |
| Total | 92 (100.0%) | 51 (100.0%) |
Household Vehicle Usage in Boston
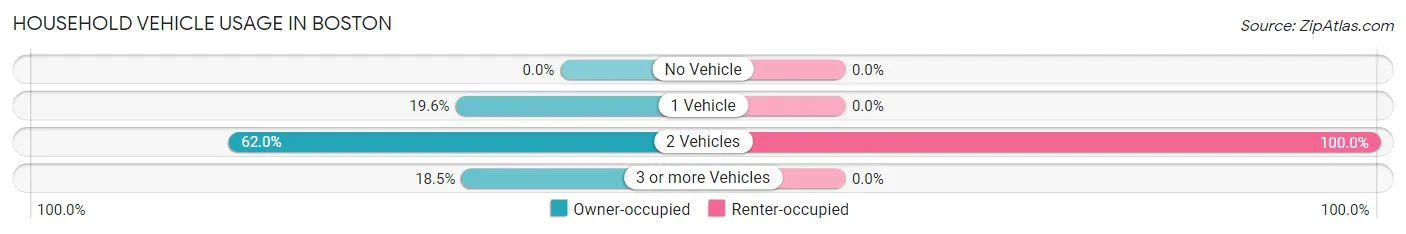
| Vehicles per Household | Owner-occupied | Renter-occupied |
| No Vehicle | 0 (0.0%) | 0 (0.0%) |
| 1 Vehicle | 18 (19.6%) | 0 (0.0%) |
| 2 Vehicles | 57 (62.0%) | 51 (100.0%) |
| 3 or more Vehicles | 17 (18.5%) | 0 (0.0%) |
| Total | 92 (100.0%) | 51 (100.0%) |
Real Estate & Mortgages in Boston
Real Estate and Mortgage Overview in Boston
| Characteristic | Without Mortgage | With Mortgage |
| Housing Units | 26 | 66 |
| Median Property Value | $9,999 | $0 |
| Median Household Income | - | - |
| Monthly Housing Costs | - | - |
| Real Estate Taxes | - | - |
Property Value by Mortgage Status in Boston
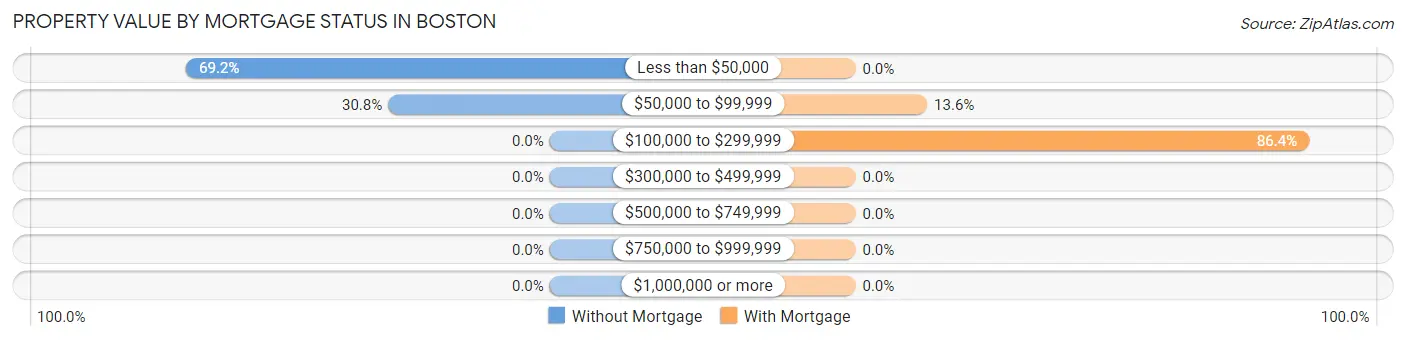
| Property Value | Without Mortgage | With Mortgage |
| Less than $50,000 | 18 (69.2%) | 0 (0.0%) |
| $50,000 to $99,999 | 8 (30.8%) | 9 (13.6%) |
| $100,000 to $299,999 | 0 (0.0%) | 57 (86.4%) |
| $300,000 to $499,999 | 0 (0.0%) | 0 (0.0%) |
| $500,000 to $749,999 | 0 (0.0%) | 0 (0.0%) |
| $750,000 to $999,999 | 0 (0.0%) | 0 (0.0%) |
| $1,000,000 or more | 0 (0.0%) | 0 (0.0%) |
| Total | 26 (100.0%) | 66 (100.0%) |
Household Income by Mortgage Status in Boston
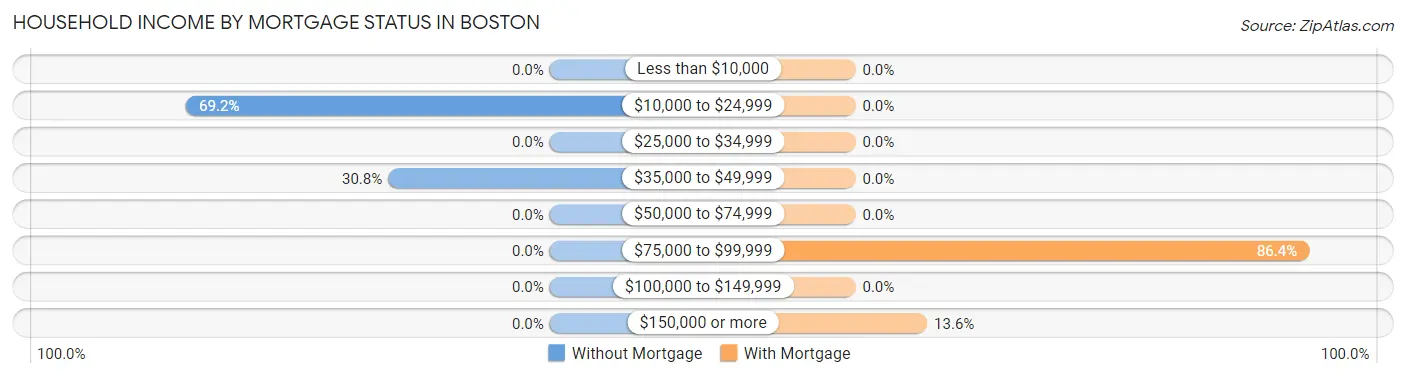
| Household Income | Without Mortgage | With Mortgage |
| Less than $10,000 | 0 (0.0%) | 0 (0.0%) |
| $10,000 to $24,999 | 18 (69.2%) | 0 (0.0%) |
| $25,000 to $34,999 | 0 (0.0%) | 0 (0.0%) |
| $35,000 to $49,999 | 8 (30.8%) | 0 (0.0%) |
| $50,000 to $74,999 | 0 (0.0%) | 0 (0.0%) |
| $75,000 to $99,999 | 0 (0.0%) | 57 (86.4%) |
| $100,000 to $149,999 | 0 (0.0%) | 0 (0.0%) |
| $150,000 or more | 0 (0.0%) | 9 (13.6%) |
| Total | 26 (100.0%) | 66 (100.0%) |
Property Value to Household Income Ratio in Boston
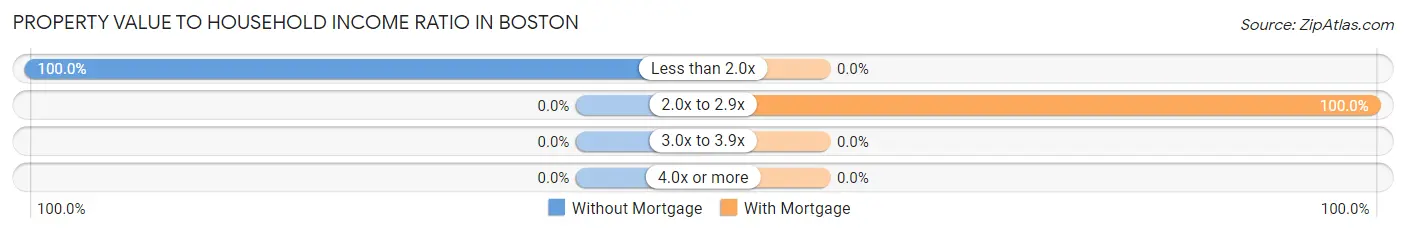
| Value-to-Income Ratio | Without Mortgage | With Mortgage |
| Less than 2.0x | 26 (100.0%) | 0 (0.0%) |
| 2.0x to 2.9x | 0 (0.0%) | 66 (100.0%) |
| 3.0x to 3.9x | 0 (0.0%) | 0 (0.0%) |
| 4.0x or more | 0 (0.0%) | 0 (0.0%) |
| Total | 26 (100.0%) | 66 (100.0%) |
Real Estate Taxes by Mortgage Status in Boston
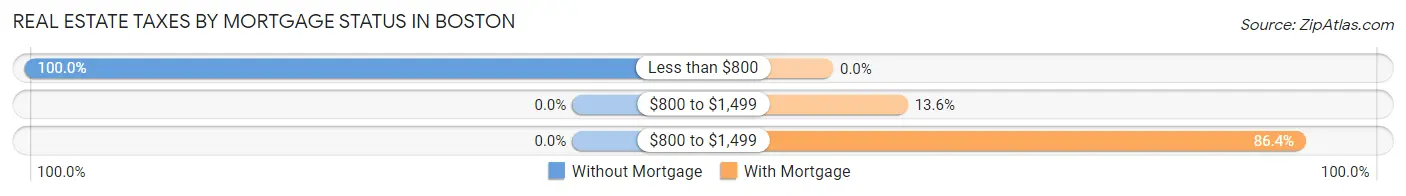
| Property Taxes | Without Mortgage | With Mortgage |
| Less than $800 | 26 (100.0%) | 0 (0.0%) |
| $800 to $1,499 | 0 (0.0%) | 9 (13.6%) |
| $800 to $1,499 | 0 (0.0%) | 57 (86.4%) |
| Total | 26 (100.0%) | 66 (100.0%) |
Health & Disability in Boston
Health Insurance Coverage by Age in Boston
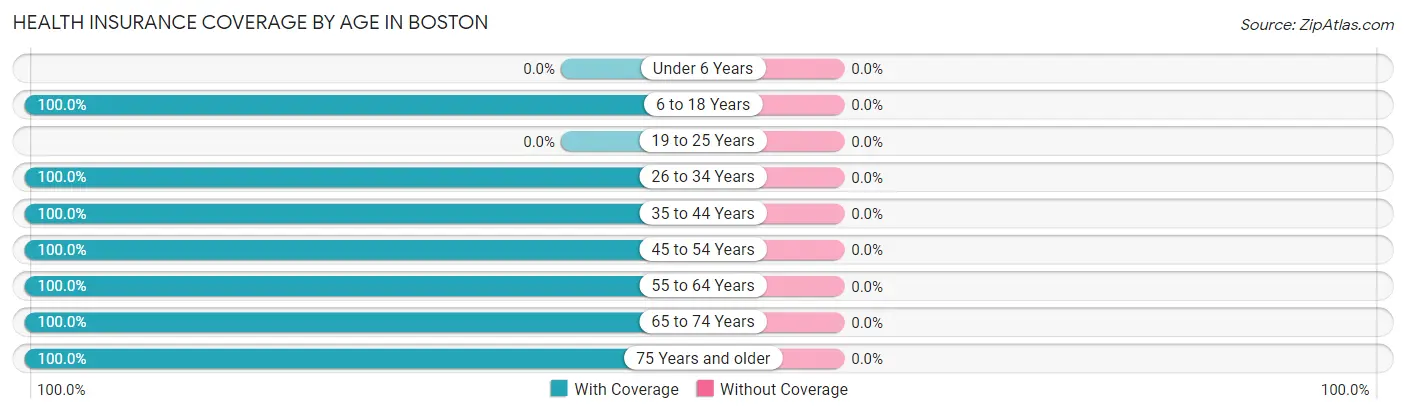
| Age Bracket | With Coverage | Without Coverage |
| Under 6 Years | 0 (0.0%) | 0 (0.0%) |
| 6 to 18 Years | 140 (100.0%) | 0 (0.0%) |
| 19 to 25 Years | 0 (0.0%) | 0 (0.0%) |
| 26 to 34 Years | 135 (100.0%) | 0 (0.0%) |
| 35 to 44 Years | 8 (100.0%) | 0 (0.0%) |
| 45 to 54 Years | 57 (100.0%) | 0 (0.0%) |
| 55 to 64 Years | 39 (100.0%) | 0 (0.0%) |
| 65 to 74 Years | 17 (100.0%) | 0 (0.0%) |
| 75 Years and older | 10 (100.0%) | 0 (0.0%) |
| Total | 406 (100.0%) | 0 (0.0%) |
Health Insurance Coverage by Citizenship Status in Boston
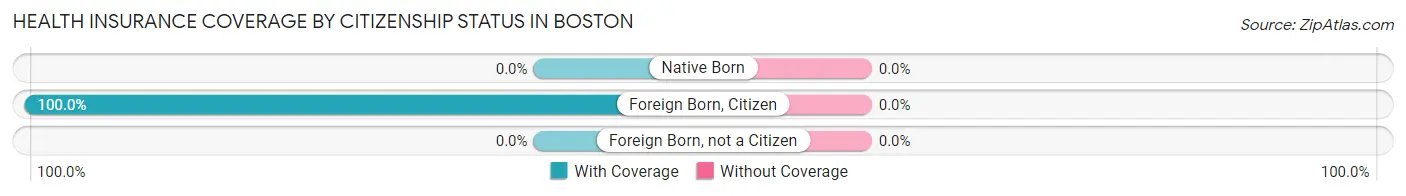
| Citizenship Status | With Coverage | Without Coverage |
| Native Born | 0 (0.0%) | 0 (0.0%) |
| Foreign Born, Citizen | 140 (100.0%) | 0 (0.0%) |
| Foreign Born, not a Citizen | 0 (0.0%) | 0 (0.0%) |
Health Insurance Coverage by Household Income in Boston
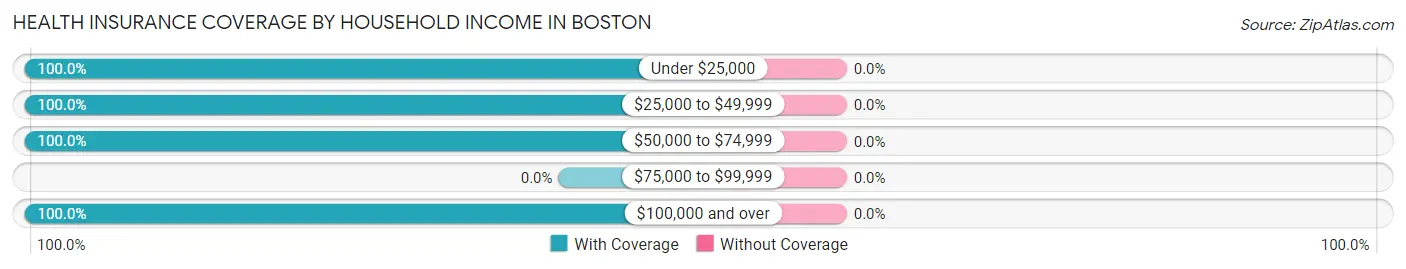
| Household Income | With Coverage | Without Coverage |
| Under $25,000 | 78 (100.0%) | 0 (0.0%) |
| $25,000 to $49,999 | 8 (100.0%) | 0 (0.0%) |
| $50,000 to $74,999 | 57 (100.0%) | 0 (0.0%) |
| $75,000 to $99,999 | 0 (0.0%) | 0 (0.0%) |
| $100,000 and over | 263 (100.0%) | 0 (0.0%) |
Public vs Private Health Insurance Coverage by Age in Boston
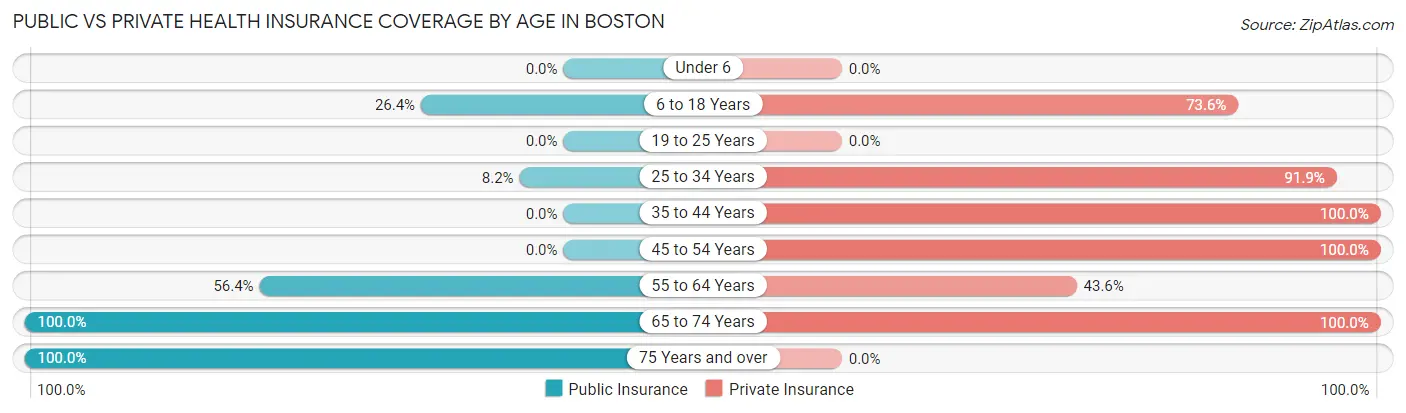
| Age Bracket | Public Insurance | Private Insurance |
| Under 6 | 0 (0.0%) | 0 (0.0%) |
| 6 to 18 Years | 37 (26.4%) | 103 (73.6%) |
| 19 to 25 Years | 0 (0.0%) | 0 (0.0%) |
| 25 to 34 Years | 11 (8.2%) | 124 (91.8%) |
| 35 to 44 Years | 0 (0.0%) | 8 (100.0%) |
| 45 to 54 Years | 0 (0.0%) | 57 (100.0%) |
| 55 to 64 Years | 22 (56.4%) | 17 (43.6%) |
| 65 to 74 Years | 17 (100.0%) | 17 (100.0%) |
| 75 Years and over | 10 (100.0%) | 0 (0.0%) |
| Total | 97 (23.9%) | 326 (80.3%) |
Disability Status by Sex by Age in Boston
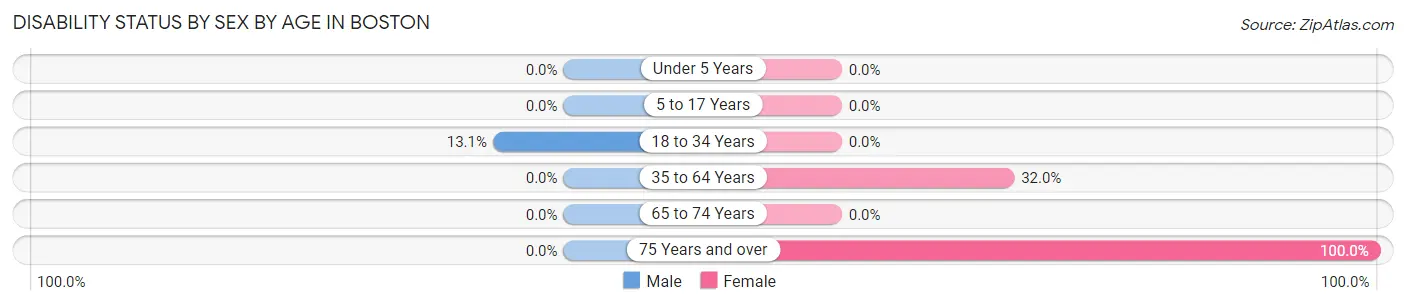
| Age Bracket | Male | Female |
| Under 5 Years | 0 (0.0%) | 0 (0.0%) |
| 5 to 17 Years | 0 (0.0%) | 0 (0.0%) |
| 18 to 34 Years | 11 (13.1%) | 0 (0.0%) |
| 35 to 64 Years | 0 (0.0%) | 8 (32.0%) |
| 65 to 74 Years | 0 (0.0%) | 0 (0.0%) |
| 75 Years and over | 0 (0.0%) | 10 (100.0%) |
Disability Class by Sex by Age in Boston
Disability Class: Hearing Difficulty
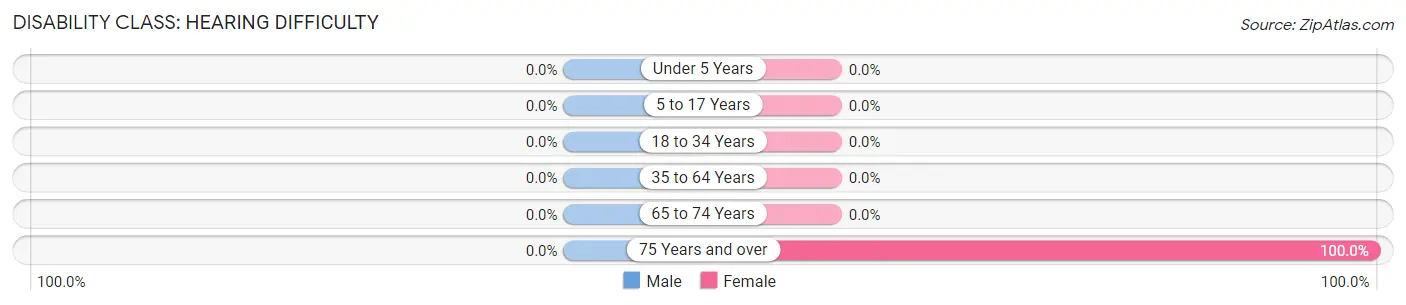
| Age Bracket | Male | Female |
| Under 5 Years | 0 (0.0%) | 0 (0.0%) |
| 5 to 17 Years | 0 (0.0%) | 0 (0.0%) |
| 18 to 34 Years | 0 (0.0%) | 0 (0.0%) |
| 35 to 64 Years | 0 (0.0%) | 0 (0.0%) |
| 65 to 74 Years | 0 (0.0%) | 0 (0.0%) |
| 75 Years and over | 0 (0.0%) | 10 (100.0%) |
Disability Class: Vision Difficulty
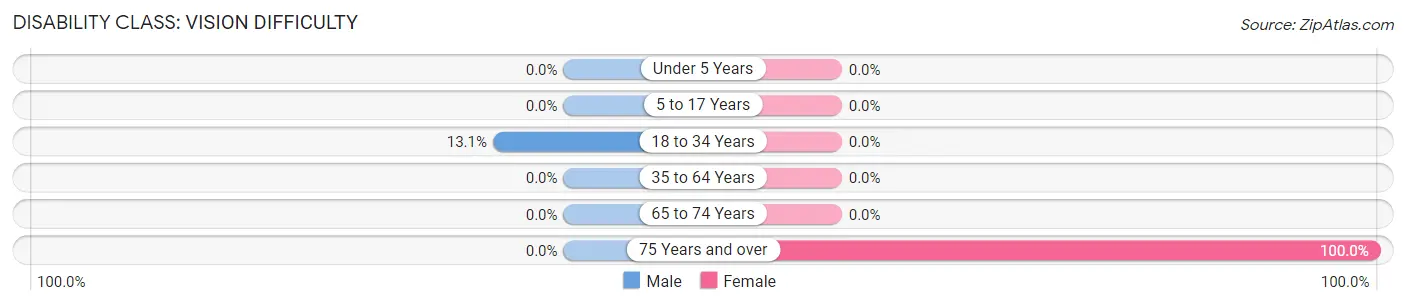
| Age Bracket | Male | Female |
| Under 5 Years | 0 (0.0%) | 0 (0.0%) |
| 5 to 17 Years | 0 (0.0%) | 0 (0.0%) |
| 18 to 34 Years | 11 (13.1%) | 0 (0.0%) |
| 35 to 64 Years | 0 (0.0%) | 0 (0.0%) |
| 65 to 74 Years | 0 (0.0%) | 0 (0.0%) |
| 75 Years and over | 0 (0.0%) | 10 (100.0%) |
Disability Class: Cognitive Difficulty
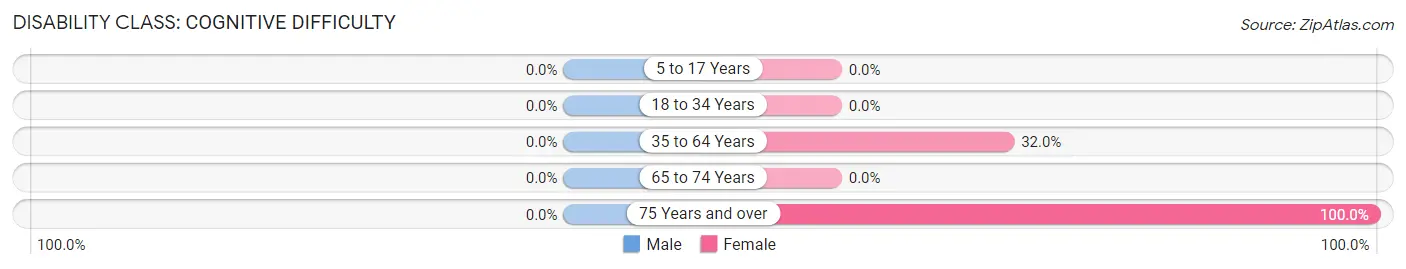
| Age Bracket | Male | Female |
| 5 to 17 Years | 0 (0.0%) | 0 (0.0%) |
| 18 to 34 Years | 0 (0.0%) | 0 (0.0%) |
| 35 to 64 Years | 0 (0.0%) | 8 (32.0%) |
| 65 to 74 Years | 0 (0.0%) | 0 (0.0%) |
| 75 Years and over | 0 (0.0%) | 10 (100.0%) |
Disability Class: Ambulatory Difficulty
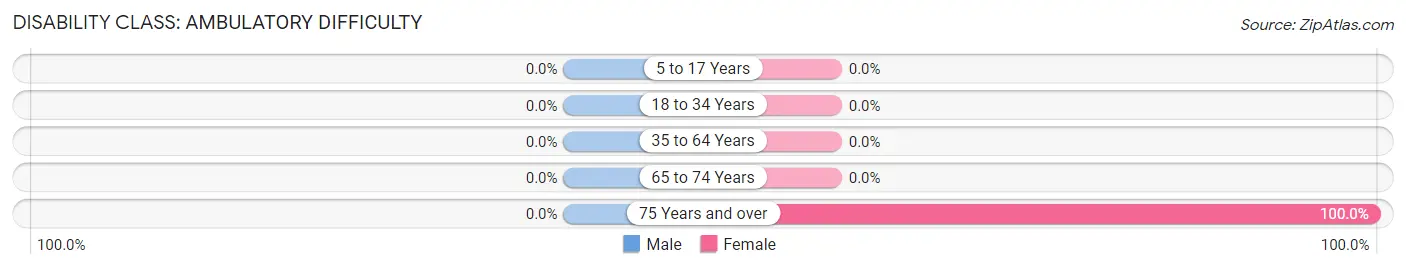
| Age Bracket | Male | Female |
| 5 to 17 Years | 0 (0.0%) | 0 (0.0%) |
| 18 to 34 Years | 0 (0.0%) | 0 (0.0%) |
| 35 to 64 Years | 0 (0.0%) | 0 (0.0%) |
| 65 to 74 Years | 0 (0.0%) | 0 (0.0%) |
| 75 Years and over | 0 (0.0%) | 10 (100.0%) |
Disability Class: Self-Care Difficulty
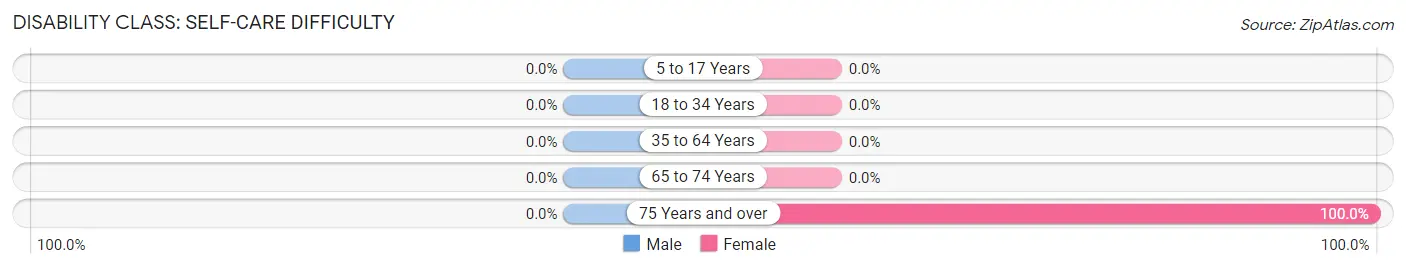
| Age Bracket | Male | Female |
| 5 to 17 Years | 0 (0.0%) | 0 (0.0%) |
| 18 to 34 Years | 0 (0.0%) | 0 (0.0%) |
| 35 to 64 Years | 0 (0.0%) | 0 (0.0%) |
| 65 to 74 Years | 0 (0.0%) | 0 (0.0%) |
| 75 Years and over | 0 (0.0%) | 10 (100.0%) |
Technology Access in Boston
Computing Device Access in Boston
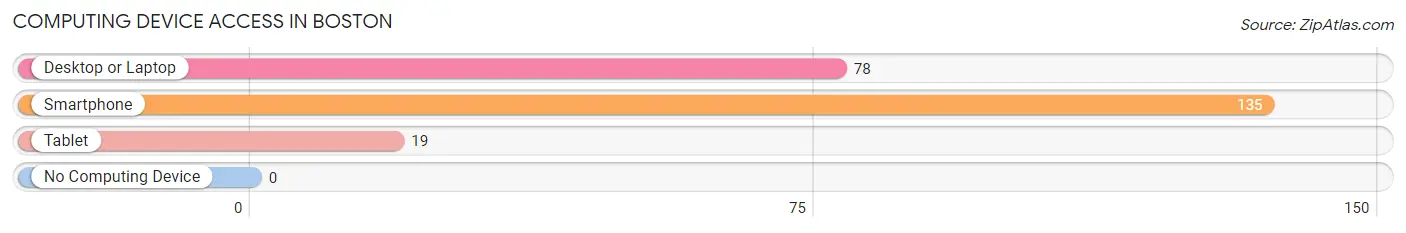
| Device Type | # Households | % Households |
| Desktop or Laptop | 78 | 54.5% |
| Smartphone | 135 | 94.4% |
| Tablet | 19 | 13.3% |
| No Computing Device | 0 | 0.0% |
| Total | 143 | 100.0% |
Internet Access in Boston
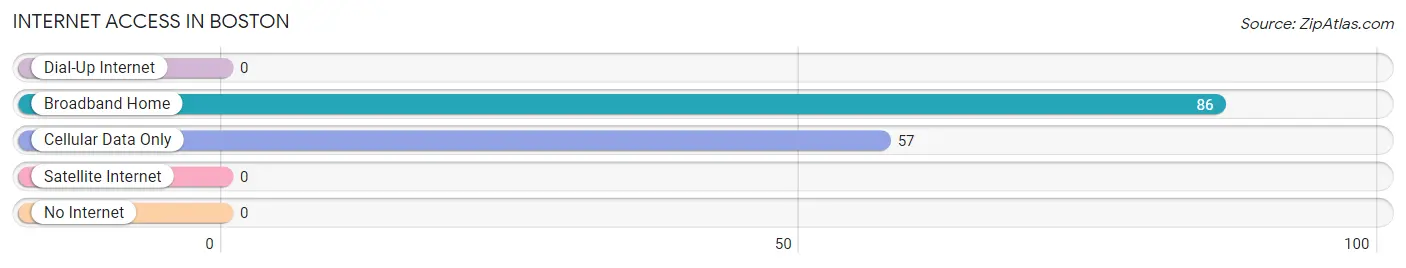
| Internet Type | # Households | % Households |
| Dial-Up Internet | 0 | 0.0% |
| Broadband Home | 86 | 60.1% |
| Cellular Data Only | 57 | 39.9% |
| Satellite Internet | 0 | 0.0% |
| No Internet | 0 | 0.0% |
| Total | 143 | 100.0% |
Boston Summary
Boston, Virginia is a small town located in the western part of the state, in the foothills of the Blue Ridge Mountains. It is situated in the Shenandoah Valley, and is part of the larger metropolitan area of Roanoke. The town has a population of approximately 1,500 people, and is the county seat of Botetourt County.
History
Boston, Virginia was founded in 1790 by William and Mary Smith, who named the town after their hometown of Boston, Massachusetts. The town was originally a trading post, and was the first settlement in the area. In 1812, the town was officially incorporated, and it quickly grew to become a major hub for the local economy. The town was home to a number of businesses, including a tannery, a gristmill, and a sawmill.
In the mid-1800s, the town was a major stop on the Virginia and Tennessee Railroad, and it was also the site of a major Civil War battle in 1864. The town was also home to a number of prominent citizens, including the first mayor of Roanoke, William B. Preston.
Geography
Boston, Virginia is located in the western part of the state, in the foothills of the Blue Ridge Mountains. It is situated in the Shenandoah Valley, and is part of the larger metropolitan area of Roanoke. The town is located at the intersection of US Route 11 and US Route 460, and is approximately 30 miles from Roanoke.
The town is situated on the banks of the James River, and is surrounded by rolling hills and forests. The town is also home to a number of parks and recreational areas, including the Botetourt County Park and the James River Wildlife Management Area.
Economy
The economy of Boston, Virginia is largely based on agriculture and tourism. The town is home to a number of farms, and is also a popular destination for outdoor recreation. The town is also home to a number of businesses, including a number of restaurants, retail stores, and professional services.
The town is also home to a number of manufacturing companies, including a number of furniture and woodworking companies. The town is also home to a number of technology companies, including a number of software and web development companies.
Demographics
As of the 2010 census, the population of Boston, Virginia was 1,500 people. The town is predominantly white, with approximately 90% of the population being white. The town is also home to a small African American population, with approximately 5% of the population being African American. The town is also home to a small Hispanic population, with approximately 2% of the population being Hispanic. The median household income in the town is approximately $45,000, and the median home value is approximately $150,000.
Common Questions
What is Per Capita Income in Boston?
Per Capita income in Boston is $28,077.
What is the Median Family Income in Boston?
Median Family Income in Boston is $113,725.
What is Inequality or Gini Index in Boston?
Inequality or Gini Index in Boston is 0.26.
What is the Total Population of Boston?
Total Population of Boston is 406.
What is the Total Male Population of Boston?
Total Male Population of Boston is 245.
What is the Total Female Population of Boston?
Total Female Population of Boston is 161.
What is the Ratio of Males per 100 Females in Boston?
There are 152.17 Males per 100 Females in Boston.
What is the Ratio of Females per 100 Males in Boston?
There are 65.71 Females per 100 Males in Boston.
What is the Median Population Age in Boston?
Median Population Age in Boston is 31.2 Years.
What is the Average Family Size in Boston
Average Family Size in Boston is 4.8 People.
What is the Average Household Size in Boston
Average Household Size in Boston is 2.8 People.
How Large is the Labor Force in Boston?
There are 231 People in the Labor Forcein in Boston.
What is the Percentage of People in the Labor Force in Boston?
80.8% of People are in the Labor Force in Boston.
What is the Unemployment Rate in Boston?
Unemployment Rate in Boston is 3.9%.