Blairs, VA Map & Demographics
Blairs Map
Blairs Overview
$23,630
PER CAPITA INCOME
$47,479
AVG FAMILY INCOME
$46,750
AVG HOUSEHOLD INCOME
43.0%
WAGE / INCOME GAP [ % ]
57.0¢/ $1
WAGE / INCOME GAP [ $ ]
0.39
INEQUALITY / GINI INDEX
1,015
TOTAL POPULATION
482
MALE POPULATION
533
FEMALE POPULATION
90.43
MALES / 100 FEMALES
110.58
FEMALES / 100 MALES
36.2
MEDIAN AGE
3.2
AVG FAMILY SIZE
2.9
AVG HOUSEHOLD SIZE
437
LABOR FORCE [ PEOPLE ]
53.0%
PERCENT IN LABOR FORCE
Blairs Zip Codes
Blairs Area Codes
Income in Blairs
Income Overview in Blairs
Per Capita Income in Blairs is $23,630, while median incomes of families and households are $47,479 and $46,750 respectively.
| Characteristic | Number | Measure |
| Per Capita Income | 1,015 | $23,630 |
| Median Family Income | 299 | $47,479 |
| Mean Family Income | 299 | $70,129 |
| Median Household Income | 356 | $46,750 |
| Mean Household Income | 356 | $62,461 |
| Income Deficit | 299 | $0 |
| Wage / Income Gap (%) | 1,015 | 42.98% |
| Wage / Income Gap ($) | 1,015 | 57.02¢ per $1 |
| Gini / Inequality Index | 1,015 | 0.39 |
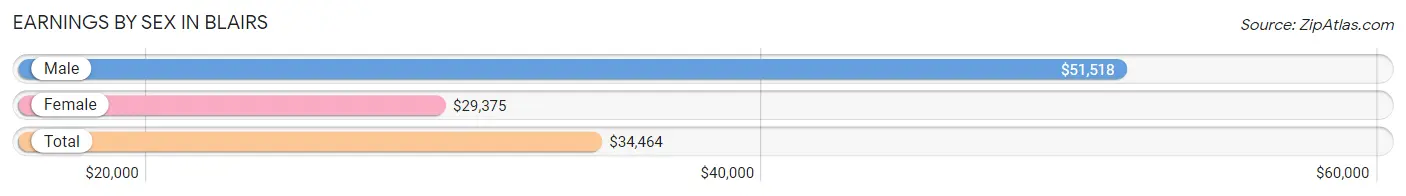
Earnings by Sex in Blairs
Average Earnings in Blairs are $34,464, $51,518 for men and $29,375 for women, a difference of 43.0%.
| Sex | Number | Average Earnings |
| Male | 223 (47.4%) | $51,518 |
| Female | 247 (52.5%) | $29,375 |
| Total | 470 (100.0%) | $34,464 |
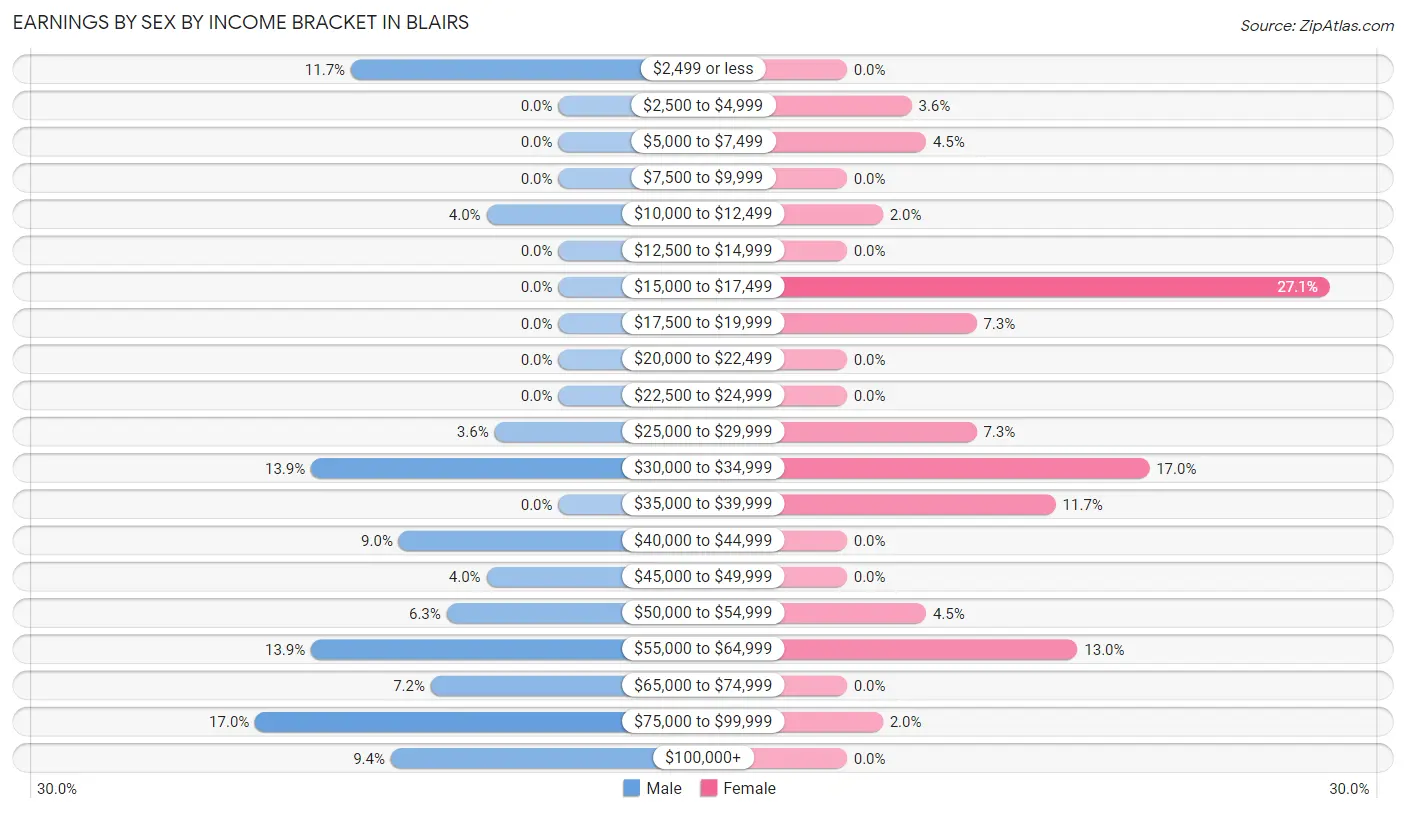
Earnings by Sex by Income Bracket in Blairs
The most common earnings brackets in Blairs are $75,000 to $99,999 for men (38 | 17.0%) and $15,000 to $17,499 for women (67 | 27.1%).
| Income | Male | Female |
| $2,499 or less | 26 (11.7%) | 0 (0.0%) |
| $2,500 to $4,999 | 0 (0.0%) | 9 (3.6%) |
| $5,000 to $7,499 | 0 (0.0%) | 11 (4.4%) |
| $7,500 to $9,999 | 0 (0.0%) | 0 (0.0%) |
| $10,000 to $12,499 | 9 (4.0%) | 5 (2.0%) |
| $12,500 to $14,999 | 0 (0.0%) | 0 (0.0%) |
| $15,000 to $17,499 | 0 (0.0%) | 67 (27.1%) |
| $17,500 to $19,999 | 0 (0.0%) | 18 (7.3%) |
| $20,000 to $22,499 | 0 (0.0%) | 0 (0.0%) |
| $22,500 to $24,999 | 0 (0.0%) | 0 (0.0%) |
| $25,000 to $29,999 | 8 (3.6%) | 18 (7.3%) |
| $30,000 to $34,999 | 31 (13.9%) | 42 (17.0%) |
| $35,000 to $39,999 | 0 (0.0%) | 29 (11.7%) |
| $40,000 to $44,999 | 20 (9.0%) | 0 (0.0%) |
| $45,000 to $49,999 | 9 (4.0%) | 0 (0.0%) |
| $50,000 to $54,999 | 14 (6.3%) | 11 (4.4%) |
| $55,000 to $64,999 | 31 (13.9%) | 32 (13.0%) |
| $65,000 to $74,999 | 16 (7.2%) | 0 (0.0%) |
| $75,000 to $99,999 | 38 (17.0%) | 5 (2.0%) |
| $100,000+ | 21 (9.4%) | 0 (0.0%) |
| Total | 223 (100.0%) | 247 (100.0%) |
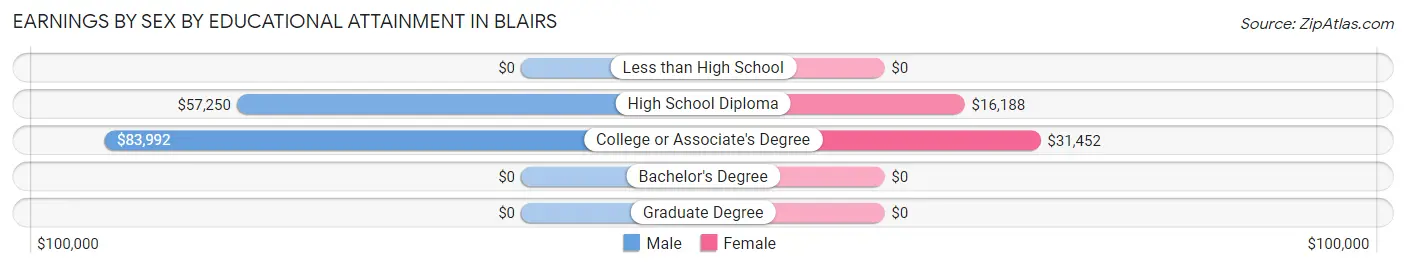
Earnings by Sex by Educational Attainment in Blairs
Average earnings in Blairs are $66,042 for men and $28,611 for women, a difference of 56.7%. Men with an educational attainment of college or associate's degree enjoy the highest average annual earnings of $83,992, while those with high school diploma education earn the least with $57,250. Women with an educational attainment of college or associate's degree earn the most with the average annual earnings of $31,452, while those with high school diploma education have the smallest earnings of $16,188.
| Educational Attainment | Male Income | Female Income |
| Less than High School | - | - |
| High School Diploma | $57,250 | $16,188 |
| College or Associate's Degree | $83,992 | $31,452 |
| Bachelor's Degree | - | - |
| Graduate Degree | - | - |
| Total | $66,042 | $28,611 |
Family Income in Blairs
Family Income Brackets in Blairs
According to the Blairs family income data, there are 93 families falling into the $100,000 to $149,999 income range, which is the most common income bracket and makes up 31.1% of all families.
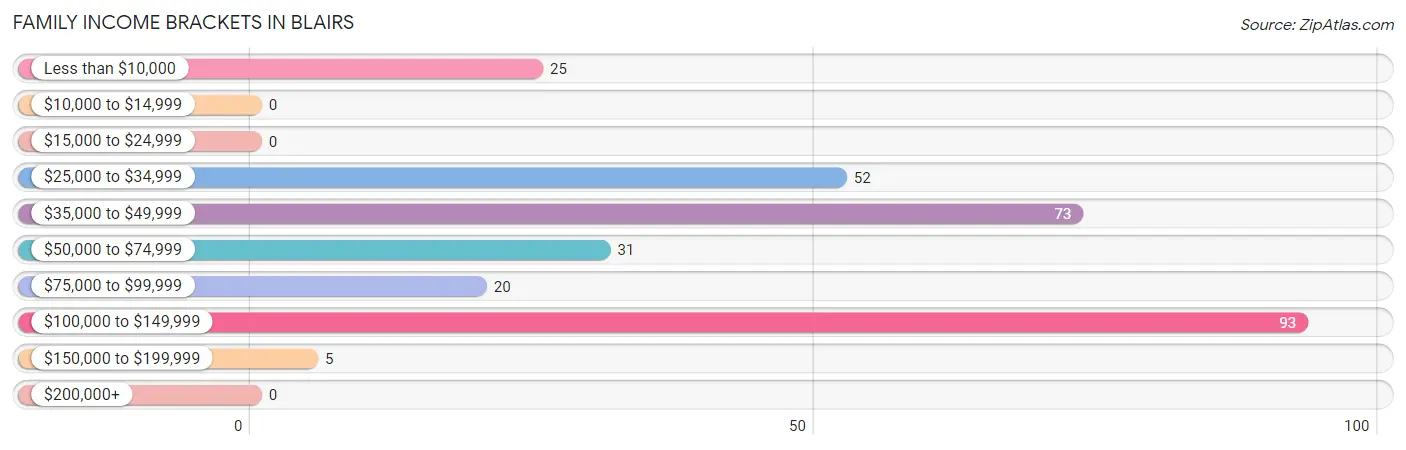
| Income Bracket | # Families | % Families |
| Less than $10,000 | 25 | 8.4% |
| $10,000 to $14,999 | 0 | 0.0% |
| $15,000 to $24,999 | 0 | 0.0% |
| $25,000 to $34,999 | 52 | 17.4% |
| $35,000 to $49,999 | 73 | 24.4% |
| $50,000 to $74,999 | 31 | 10.4% |
| $75,000 to $99,999 | 20 | 6.7% |
| $100,000 to $149,999 | 93 | 31.1% |
| $150,000 to $199,999 | 5 | 1.7% |
| $200,000+ | 0 | 0.0% |
Family Income by Famaliy Size in Blairs
3-person families (59 | 19.7%) account for the highest median family income in Blairs with $115,507 per family, while 3-person families (59 | 19.7%) have the highest median income of $38,502 per family member.
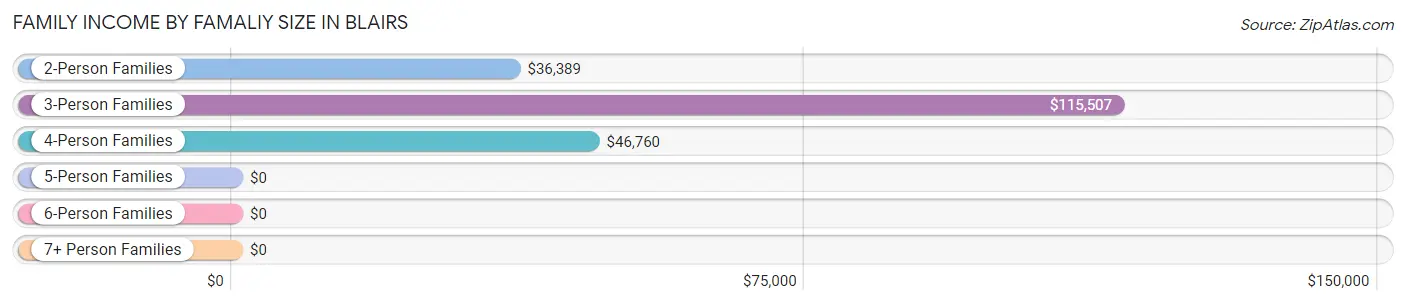
| Income Bracket | # Families | Median Income |
| 2-Person Families | 164 (54.8%) | $36,389 |
| 3-Person Families | 59 (19.7%) | $115,507 |
| 4-Person Families | 69 (23.1%) | $46,760 |
| 5-Person Families | 0 (0.0%) | $0 |
| 6-Person Families | 7 (2.3%) | $0 |
| 7+ Person Families | 0 (0.0%) | $0 |
| Total | 299 (100.0%) | $47,479 |
Family Income by Number of Earners in Blairs
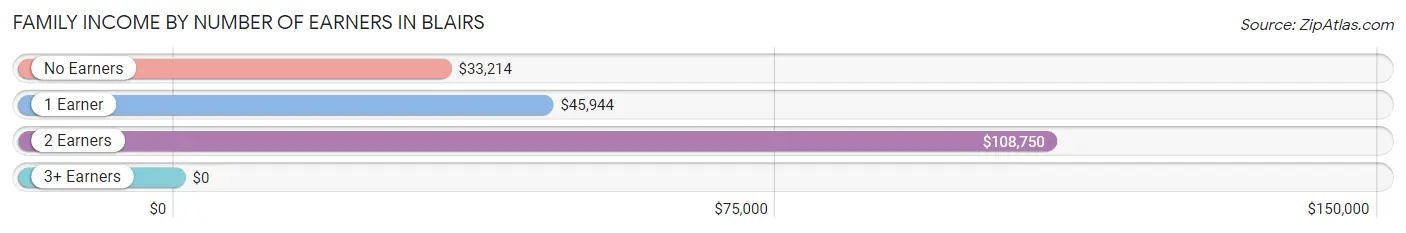
| Number of Earners | # Families | Median Income |
| No Earners | 70 (23.4%) | $33,214 |
| 1 Earner | 73 (24.4%) | $45,944 |
| 2 Earners | 151 (50.5%) | $108,750 |
| 3+ Earners | 5 (1.7%) | $0 |
| Total | 299 (100.0%) | $47,479 |
Household Income in Blairs
Household Income Brackets in Blairs
With 93 households falling in the category, the $100,000 to $149,999 income range is the most frequent in Blairs, accounting for 26.1% of all households.
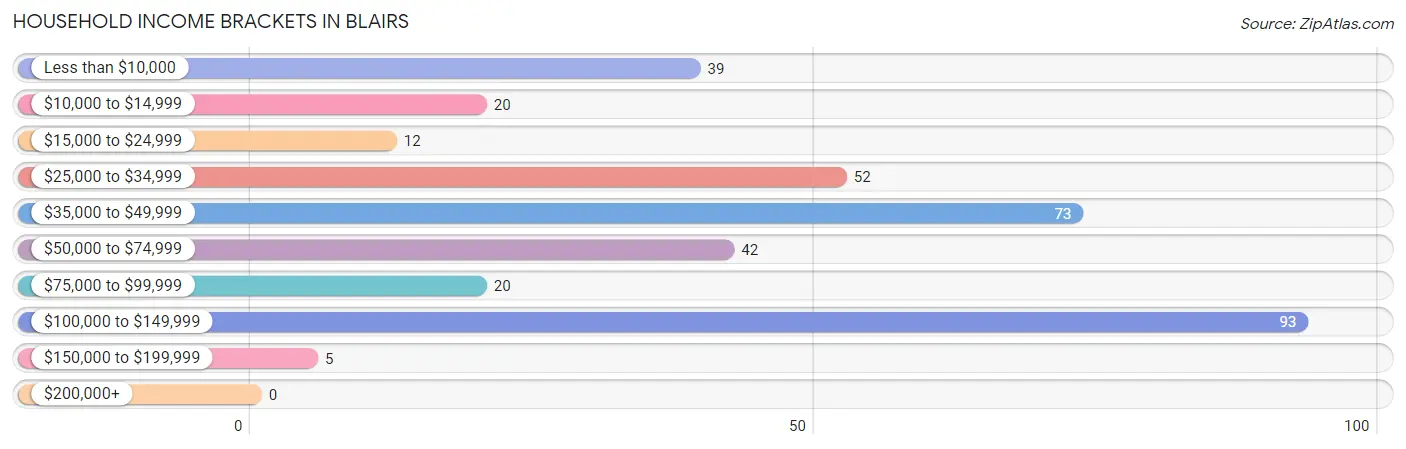
| Income Bracket | # Households | % Households |
| Less than $10,000 | 39 | 11.0% |
| $10,000 to $14,999 | 20 | 5.6% |
| $15,000 to $24,999 | 12 | 3.4% |
| $25,000 to $34,999 | 52 | 14.6% |
| $35,000 to $49,999 | 73 | 20.5% |
| $50,000 to $74,999 | 42 | 11.8% |
| $75,000 to $99,999 | 20 | 5.6% |
| $100,000 to $149,999 | 93 | 26.1% |
| $150,000 to $199,999 | 5 | 1.4% |
| $200,000+ | 0 | 0.0% |
Household Income by Householder Age in Blairs
The median household income in Blairs is $46,750, with the highest median household income of $89,625 found in the 25 to 44 years age bracket for the primary householder. A total of 103 households (28.9%) fall into this category. Meanwhile, the 15 to 24 years age bracket for the primary householder has the lowest median household income of $0, with 23 households (6.5%) in this group.
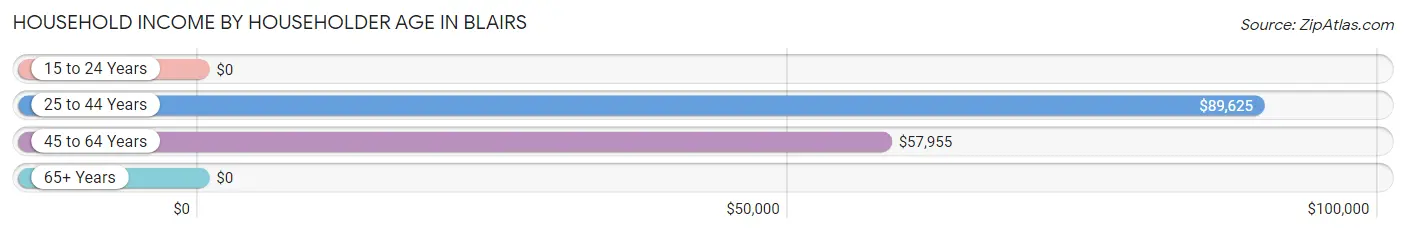
| Income Bracket | # Households | Median Income |
| 15 to 24 Years | 23 (6.5%) | $0 |
| 25 to 44 Years | 103 (28.9%) | $89,625 |
| 45 to 64 Years | 102 (28.6%) | $57,955 |
| 65+ Years | 128 (36.0%) | $0 |
| Total | 356 (100.0%) | $46,750 |
Poverty in Blairs
Income Below Poverty by Sex and Age in Blairs
With 16.4% poverty level for males and 2.8% for females among the residents of Blairs, 65 to 74 year old males and 75 year old and over females are the most vulnerable to poverty, with 59 males (83.1%) and 6 females (27.3%) in their respective age groups living below the poverty level.
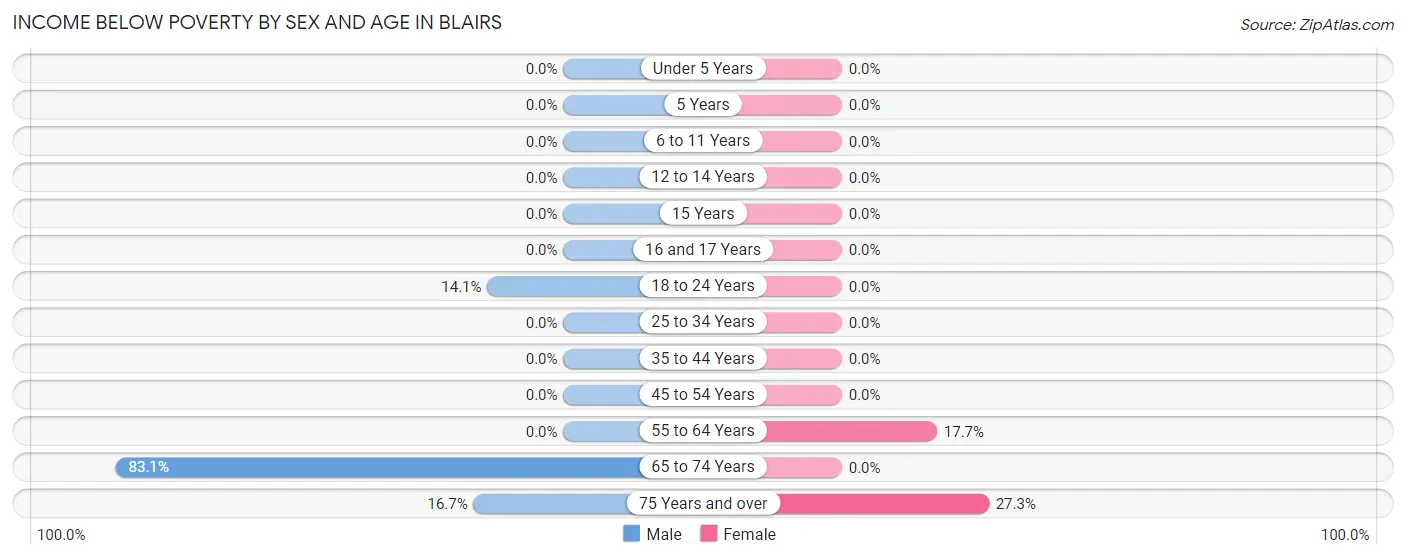
| Age Bracket | Male | Female |
| Under 5 Years | 0 (0.0%) | 0 (0.0%) |
| 5 Years | 0 (0.0%) | 0 (0.0%) |
| 6 to 11 Years | 0 (0.0%) | 0 (0.0%) |
| 12 to 14 Years | 0 (0.0%) | 0 (0.0%) |
| 15 Years | 0 (0.0%) | 0 (0.0%) |
| 16 and 17 Years | 0 (0.0%) | 0 (0.0%) |
| 18 to 24 Years | 11 (14.1%) | 0 (0.0%) |
| 25 to 34 Years | 0 (0.0%) | 0 (0.0%) |
| 35 to 44 Years | 0 (0.0%) | 0 (0.0%) |
| 45 to 54 Years | 0 (0.0%) | 0 (0.0%) |
| 55 to 64 Years | 0 (0.0%) | 9 (17.6%) |
| 65 to 74 Years | 59 (83.1%) | 0 (0.0%) |
| 75 Years and over | 9 (16.7%) | 6 (27.3%) |
| Total | 79 (16.4%) | 15 (2.8%) |
Income Above Poverty by Sex and Age in Blairs
According to the poverty statistics in Blairs, males aged under 5 years and females aged under 5 years are the age groups that are most secure financially, with 100.0% of males and 100.0% of females in these age groups living above the poverty line.
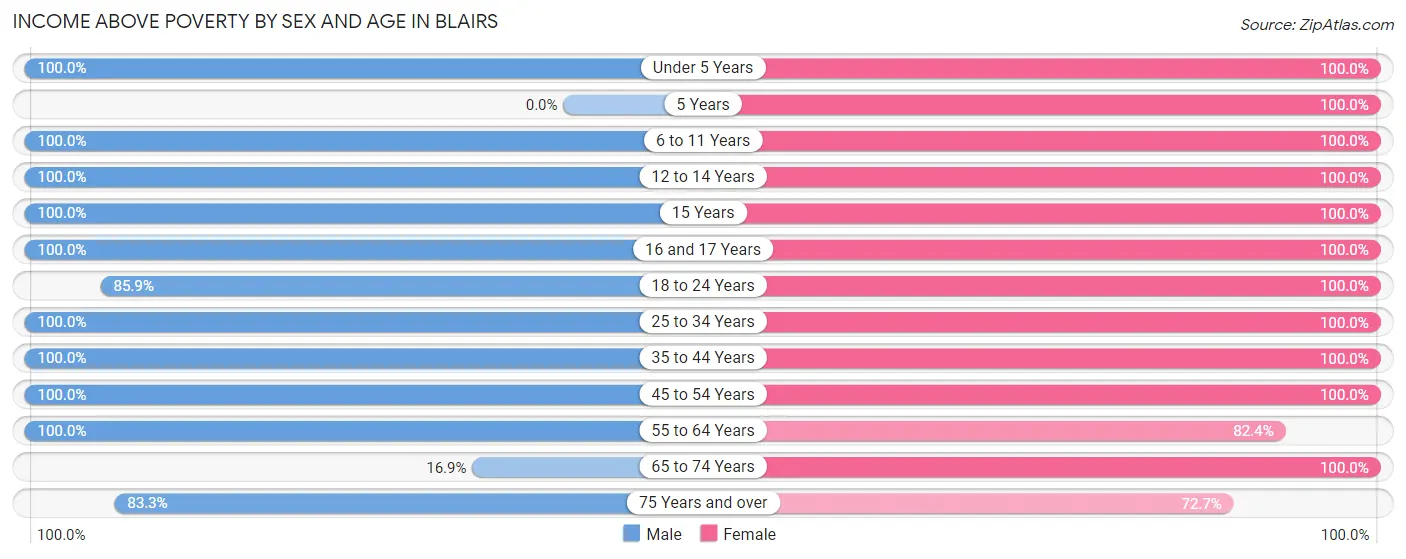
| Age Bracket | Male | Female |
| Under 5 Years | 26 (100.0%) | 56 (100.0%) |
| 5 Years | 0 (0.0%) | 5 (100.0%) |
| 6 to 11 Years | 16 (100.0%) | 58 (100.0%) |
| 12 to 14 Years | 6 (100.0%) | 8 (100.0%) |
| 15 Years | 9 (100.0%) | 6 (100.0%) |
| 16 and 17 Years | 33 (100.0%) | 26 (100.0%) |
| 18 to 24 Years | 67 (85.9%) | 11 (100.0%) |
| 25 to 34 Years | 41 (100.0%) | 93 (100.0%) |
| 35 to 44 Years | 20 (100.0%) | 94 (100.0%) |
| 45 to 54 Years | 40 (100.0%) | 28 (100.0%) |
| 55 to 64 Years | 88 (100.0%) | 42 (82.4%) |
| 65 to 74 Years | 12 (16.9%) | 75 (100.0%) |
| 75 Years and over | 45 (83.3%) | 16 (72.7%) |
| Total | 403 (83.6%) | 518 (97.2%) |
Income Below Poverty Among Married-Couple Families in Blairs
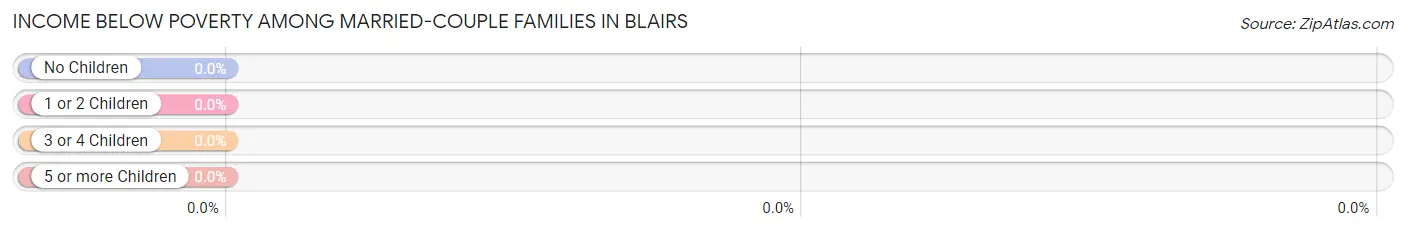
| Children | Above Poverty | Below Poverty |
| No Children | 106 (100.0%) | 0 (0.0%) |
| 1 or 2 Children | 94 (100.0%) | 0 (0.0%) |
| 3 or 4 Children | 7 (100.0%) | 0 (0.0%) |
| 5 or more Children | 0 (0.0%) | 0 (0.0%) |
| Total | 207 (100.0%) | 0 (0.0%) |
Income Below Poverty Among Single-Parent Households in Blairs
According to the poverty data in Blairs, 45.3% or 24 single-father households and 2.6% or 1 single-mother households are living below the poverty line. Among single-father households, those with no children have the highest poverty rate, with 24 households (45.3%) experiencing poverty. Likewise, among single-mother households, those with no children have the highest poverty rate, with 1 households (10.0%) falling below the poverty line.
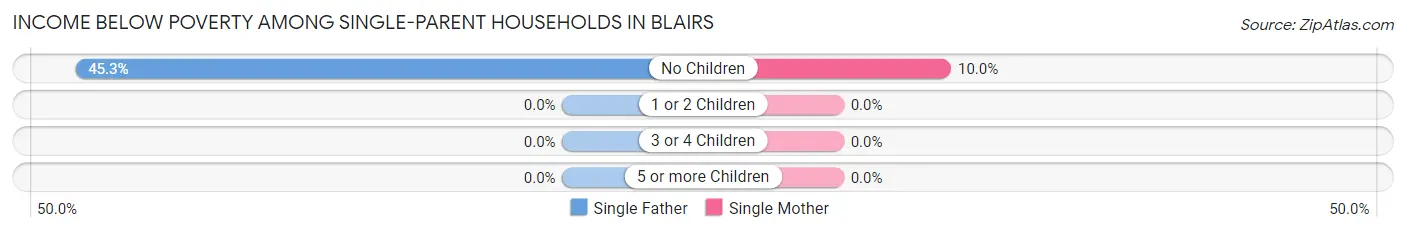
| Children | Single Father | Single Mother |
| No Children | 24 (45.3%) | 1 (10.0%) |
| 1 or 2 Children | 0 (0.0%) | 0 (0.0%) |
| 3 or 4 Children | 0 (0.0%) | 0 (0.0%) |
| 5 or more Children | 0 (0.0%) | 0 (0.0%) |
| Total | 24 (45.3%) | 1 (2.6%) |
Income Below Poverty Among Married-Couple vs Single-Parent Households in Blairs
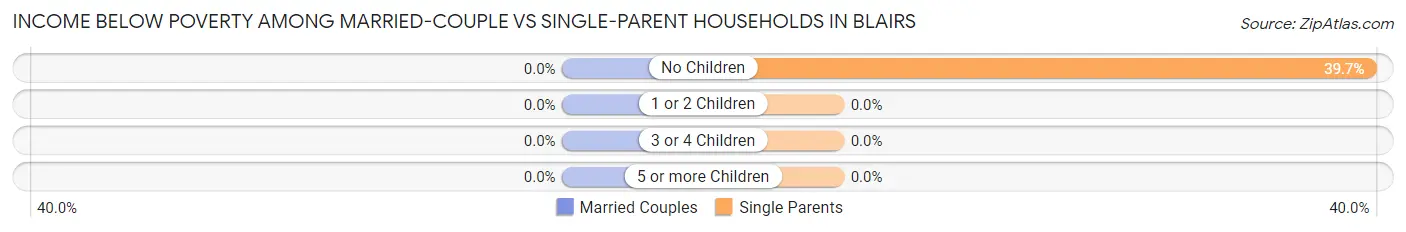
| Children | Married-Couple Families | Single-Parent Households |
| No Children | 0 (0.0%) | 25 (39.7%) |
| 1 or 2 Children | 0 (0.0%) | 0 (0.0%) |
| 3 or 4 Children | 0 (0.0%) | 0 (0.0%) |
| 5 or more Children | 0 (0.0%) | 0 (0.0%) |
| Total | 0 (0.0%) | 25 (27.2%) |
Race in Blairs
The most populous races in Blairs are White / Caucasian (795 | 78.3%), Black / African American (187 | 18.4%), and Hispanic or Latino (33 | 3.3%).
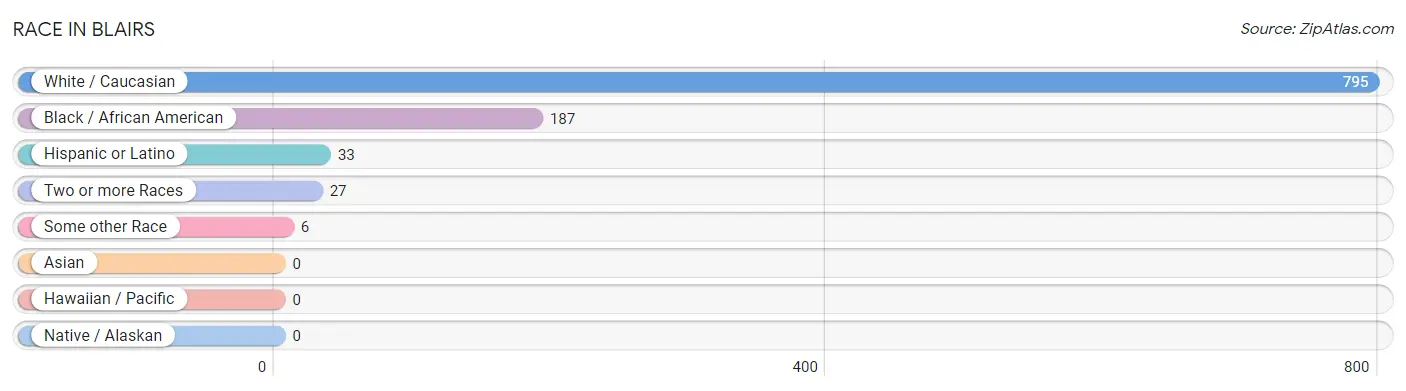
| Race | # Population | % Population |
| Asian | 0 | 0.0% |
| Black / African American | 187 | 18.4% |
| Hawaiian / Pacific | 0 | 0.0% |
| Hispanic or Latino | 33 | 3.3% |
| Native / Alaskan | 0 | 0.0% |
| White / Caucasian | 795 | 78.3% |
| Two or more Races | 27 | 2.7% |
| Some other Race | 6 | 0.6% |
| Total | 1,015 | 100.0% |
Ancestry in Blairs
The most populous ancestries reported in Blairs are American (363 | 35.8%), English (120 | 11.8%), Italian (46 | 4.5%), Irish (28 | 2.8%), and Peruvian (27 | 2.7%), together accounting for 57.5% of all Blairs residents.
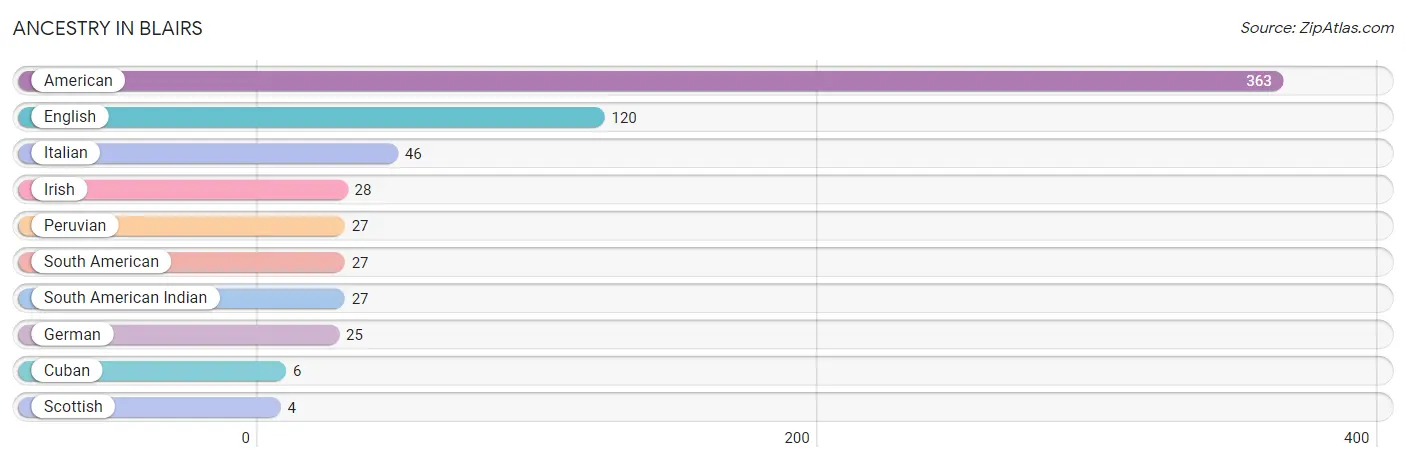
| Ancestry | # Population | % Population |
| American | 363 | 35.8% |
| Cuban | 6 | 0.6% |
| English | 120 | 11.8% |
| German | 25 | 2.5% |
| Irish | 28 | 2.8% |
| Italian | 46 | 4.5% |
| Peruvian | 27 | 2.7% |
| Scottish | 4 | 0.4% |
| South American | 27 | 2.7% |
| South American Indian | 27 | 2.7% | View All 10 Rows |
Immigrants in Blairs
The most numerous immigrant groups reported in Blairs came from Latin America (3 | 0.3%), Peru (3 | 0.3%), and South America (3 | 0.3%), together accounting for 0.9% of all Blairs residents.
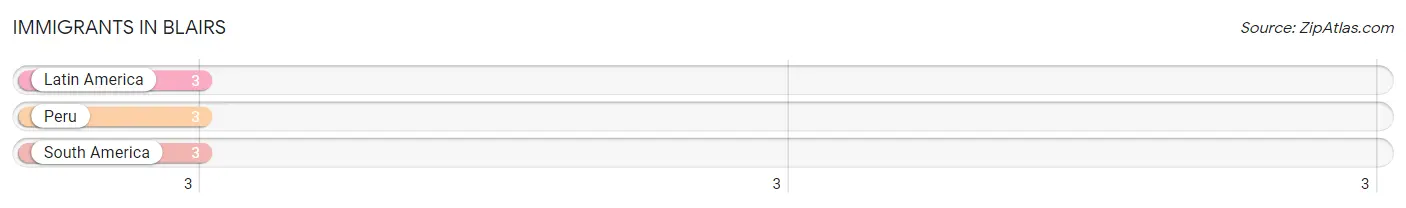
| Immigration Origin | # Population | % Population |
| Latin America | 3 | 0.3% |
| Peru | 3 | 0.3% |
| South America | 3 | 0.3% | View All 3 Rows |
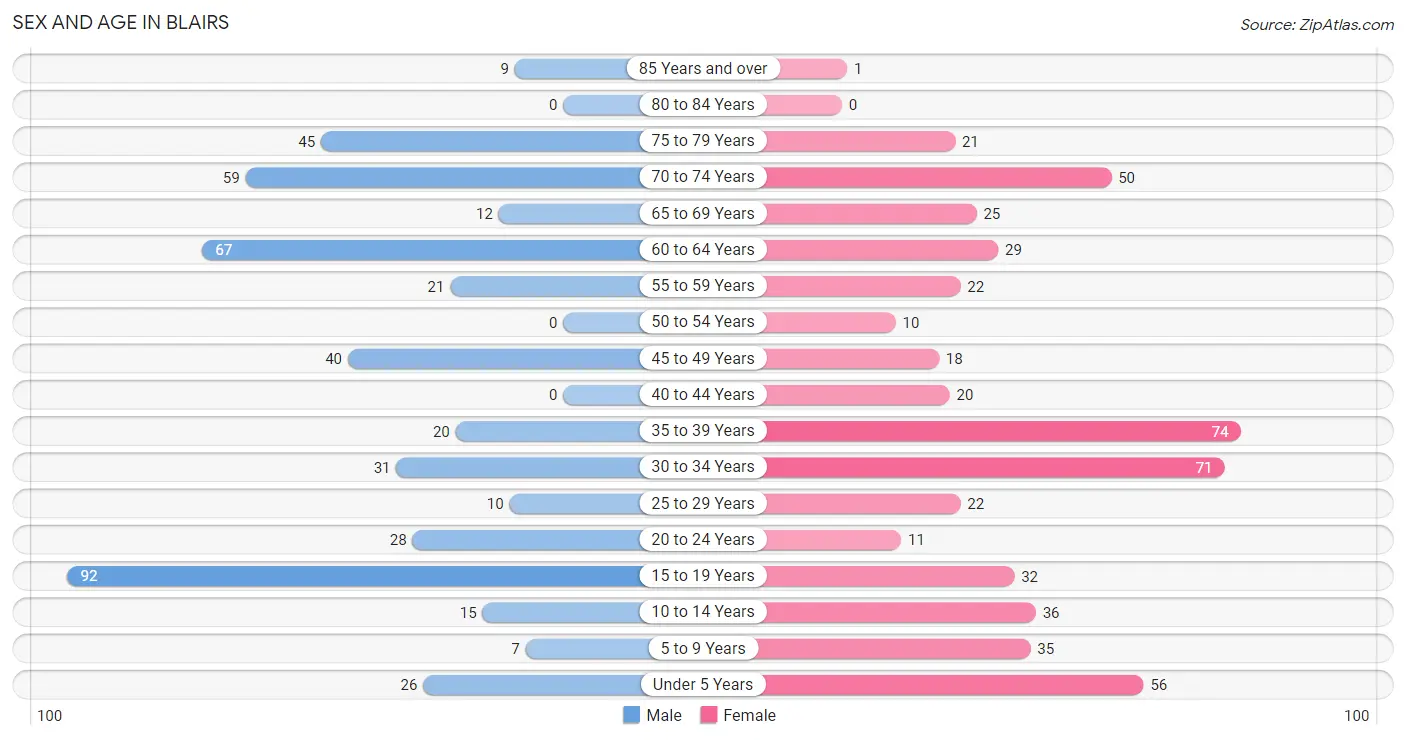
Sex and Age in Blairs
Sex and Age in Blairs
The most populous age groups in Blairs are 15 to 19 Years (92 | 19.1%) for men and 35 to 39 Years (74 | 13.9%) for women.
| Age Bracket | Male | Female |
| Under 5 Years | 26 (5.4%) | 56 (10.5%) |
| 5 to 9 Years | 7 (1.5%) | 35 (6.6%) |
| 10 to 14 Years | 15 (3.1%) | 36 (6.8%) |
| 15 to 19 Years | 92 (19.1%) | 32 (6.0%) |
| 20 to 24 Years | 28 (5.8%) | 11 (2.1%) |
| 25 to 29 Years | 10 (2.1%) | 22 (4.1%) |
| 30 to 34 Years | 31 (6.4%) | 71 (13.3%) |
| 35 to 39 Years | 20 (4.2%) | 74 (13.9%) |
| 40 to 44 Years | 0 (0.0%) | 20 (3.7%) |
| 45 to 49 Years | 40 (8.3%) | 18 (3.4%) |
| 50 to 54 Years | 0 (0.0%) | 10 (1.9%) |
| 55 to 59 Years | 21 (4.4%) | 22 (4.1%) |
| 60 to 64 Years | 67 (13.9%) | 29 (5.4%) |
| 65 to 69 Years | 12 (2.5%) | 25 (4.7%) |
| 70 to 74 Years | 59 (12.2%) | 50 (9.4%) |
| 75 to 79 Years | 45 (9.3%) | 21 (3.9%) |
| 80 to 84 Years | 0 (0.0%) | 0 (0.0%) |
| 85 Years and over | 9 (1.9%) | 1 (0.2%) |
| Total | 482 (100.0%) | 533 (100.0%) |
Families and Households in Blairs
Median Family Size in Blairs
The median family size in Blairs is 3.17 persons per family, with single female/mother families (39 | 13.0%) accounting for the largest median family size of 3.9 persons per family. On the other hand, single male/father families (53 | 17.7%) represent the smallest median family size with 2.42 persons per family.
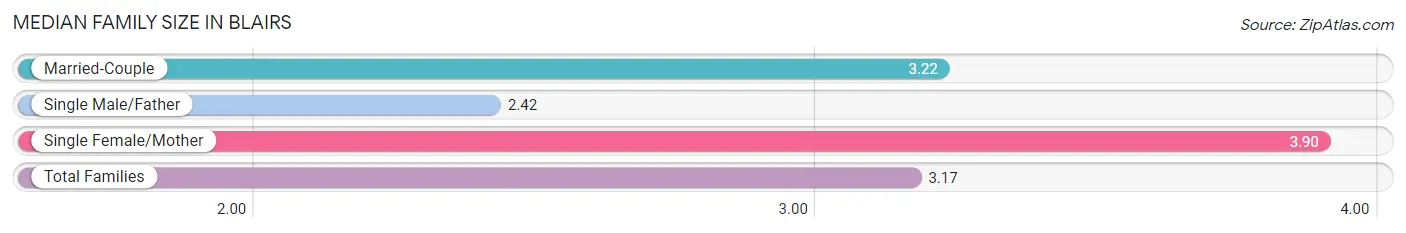
| Family Type | # Families | Family Size |
| Married-Couple | 207 (69.2%) | 3.22 |
| Single Male/Father | 53 (17.7%) | 2.42 |
| Single Female/Mother | 39 (13.0%) | 3.90 |
| Total Families | 299 (100.0%) | 3.17 |
Median Household Size in Blairs
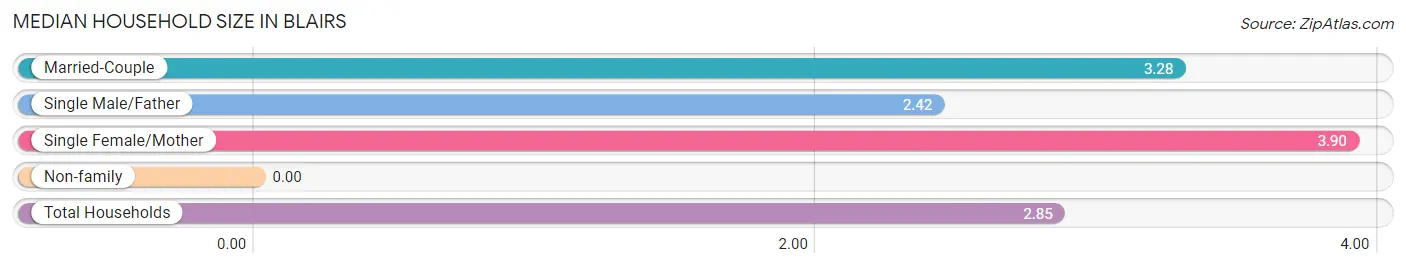
| Household Type | # Households | Household Size |
| Married-Couple | 207 (58.2%) | 3.28 |
| Single Male/Father | 53 (14.9%) | 2.42 |
| Single Female/Mother | 39 (11.0%) | 3.90 |
| Non-family | 57 (16.0%) | - |
| Total Households | 356 (100.0%) | 2.85 |
Household Size by Marriage Status in Blairs
Out of a total of 356 households in Blairs, 299 (84.0%) are family households, while 57 (16.0%) are nonfamily households. The most numerous type of family households are 2-person households, comprising 164, and the most common type of nonfamily households are 1-person households, comprising 57.
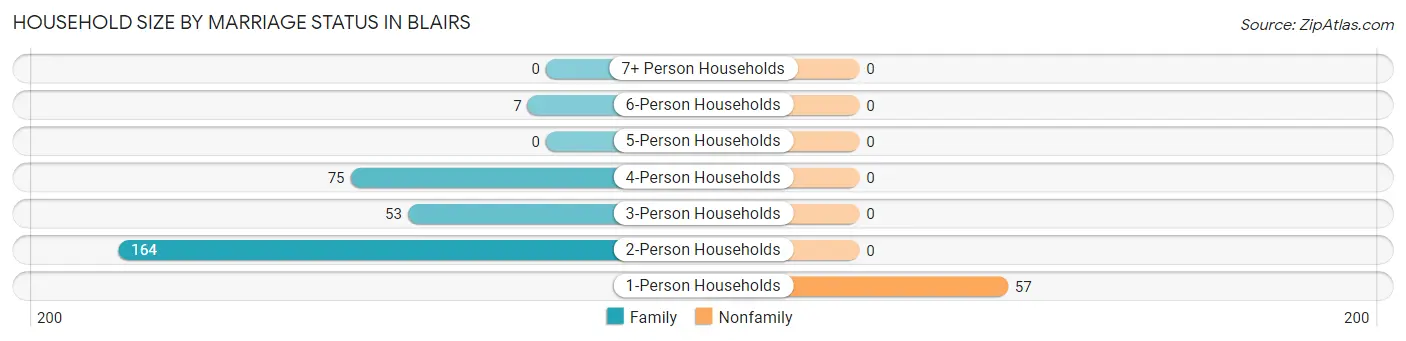
| Household Size | Family Households | Nonfamily Households |
| 1-Person Households | - | 57 (16.0%) |
| 2-Person Households | 164 (46.1%) | 0 (0.0%) |
| 3-Person Households | 53 (14.9%) | 0 (0.0%) |
| 4-Person Households | 75 (21.1%) | 0 (0.0%) |
| 5-Person Households | 0 (0.0%) | 0 (0.0%) |
| 6-Person Households | 7 (2.0%) | 0 (0.0%) |
| 7+ Person Households | 0 (0.0%) | 0 (0.0%) |
| Total | 299 (84.0%) | 57 (16.0%) |
Female Fertility in Blairs
Fertility by Age in Blairs
Average fertility rate in Blairs is 32.0 births per 1,000 women. Women in the age bracket of 20 to 34 years have the highest fertility rate with 77.0 births per 1,000 women. Women in the age bracket of 20 to 34 years acount for 100.0% of all women with births.
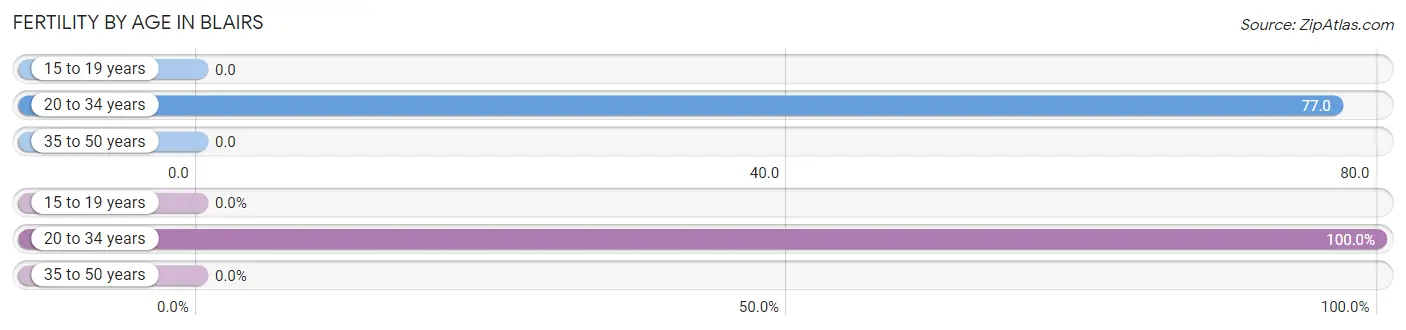
| Age Bracket | Women with Births | Births / 1,000 Women |
| 15 to 19 years | 0 (0.0%) | 0.0 |
| 20 to 34 years | 8 (100.0%) | 77.0 |
| 35 to 50 years | 0 (0.0%) | 0.0 |
| Total | 8 (100.0%) | 32.0 |
Fertility by Age by Marriage Status in Blairs
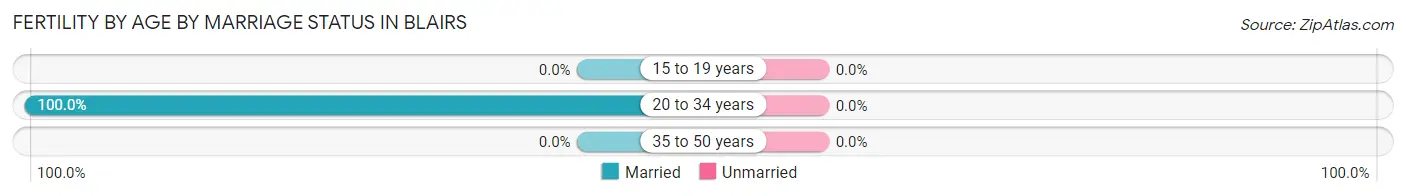
| Age Bracket | Married | Unmarried |
| 15 to 19 years | 0 (0.0%) | 0 (0.0%) |
| 20 to 34 years | 8 (100.0%) | 0 (0.0%) |
| 35 to 50 years | 0 (0.0%) | 0 (0.0%) |
| Total | 8 (100.0%) | 0 (0.0%) |
Fertility by Education in Blairs
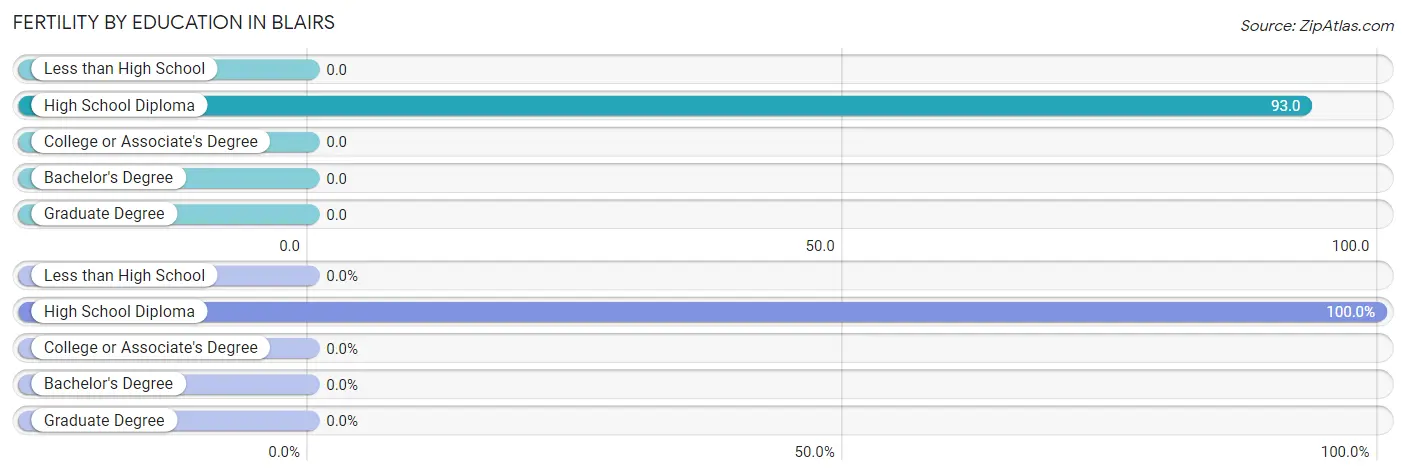
| Educational Attainment | Women with Births | Births / 1,000 Women |
| Less than High School | 0 (0.0%) | 0.0 |
| High School Diploma | 8 (100.0%) | 93.0 |
| College or Associate's Degree | 0 (0.0%) | 0.0 |
| Bachelor's Degree | 0 (0.0%) | 0.0 |
| Graduate Degree | 0 (0.0%) | 0.0 |
| Total | 8 (100.0%) | 32.0 |
Fertility by Education by Marriage Status in Blairs
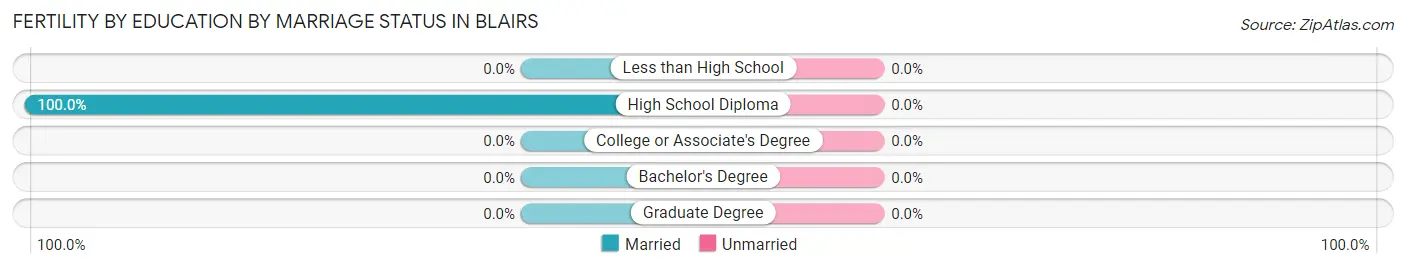
| Educational Attainment | Married | Unmarried |
| Less than High School | 0 (0.0%) | 0 (0.0%) |
| High School Diploma | 8 (100.0%) | 0 (0.0%) |
| College or Associate's Degree | 0 (0.0%) | 0 (0.0%) |
| Bachelor's Degree | 0 (0.0%) | 0 (0.0%) |
| Graduate Degree | 0 (0.0%) | 0 (0.0%) |
| Total | 8 (100.0%) | 0 (0.0%) |
Employment Characteristics in Blairs
Employment by Class of Employer in Blairs
Among the 389 employed individuals in Blairs, private company employees (341 | 87.7%), local government employees (23 | 5.9%), and self-employed (incorporated) (10 | 2.6%) make up the most common classes of employment.
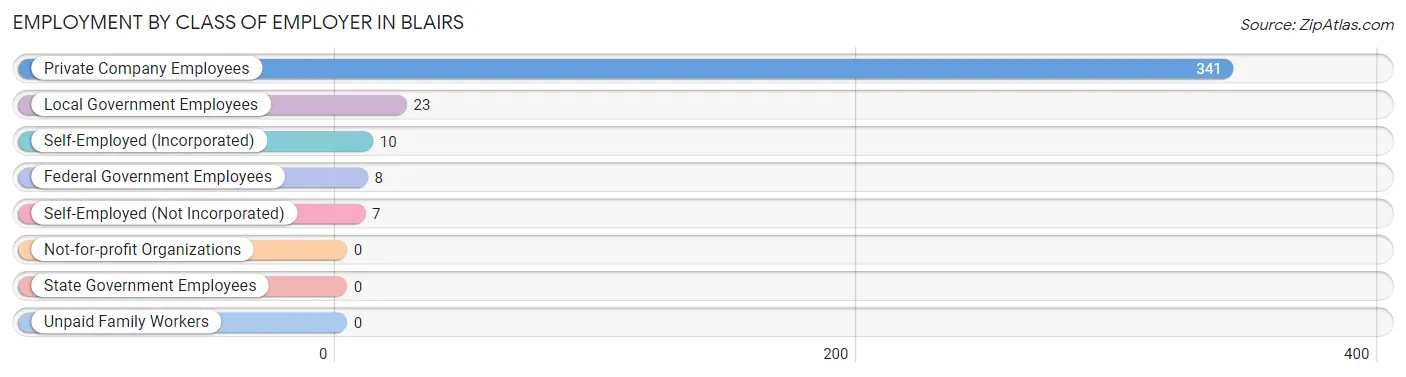
| Employer Class | # Employees | % Employees |
| Private Company Employees | 341 | 87.7% |
| Self-Employed (Incorporated) | 10 | 2.6% |
| Self-Employed (Not Incorporated) | 7 | 1.8% |
| Not-for-profit Organizations | 0 | 0.0% |
| Local Government Employees | 23 | 5.9% |
| State Government Employees | 0 | 0.0% |
| Federal Government Employees | 8 | 2.1% |
| Unpaid Family Workers | 0 | 0.0% |
| Total | 389 | 100.0% |
Employment Status by Age in Blairs
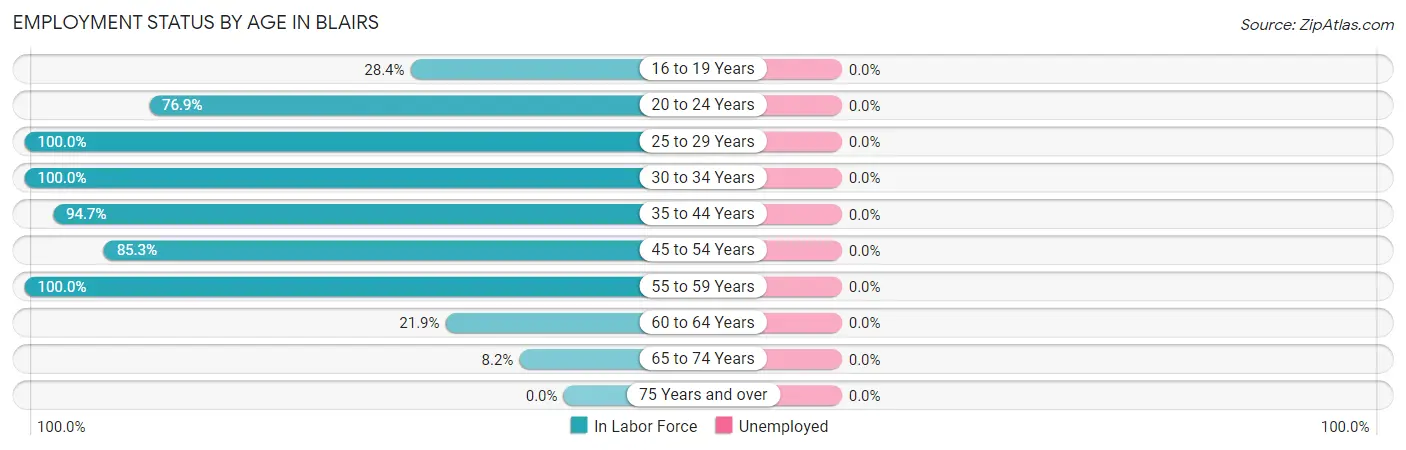
| Age Bracket | In Labor Force | Unemployed |
| 16 to 19 Years | 31 (28.4%) | 0 (0.0%) |
| 20 to 24 Years | 30 (76.9%) | 0 (0.0%) |
| 25 to 29 Years | 32 (100.0%) | 0 (0.0%) |
| 30 to 34 Years | 102 (100.0%) | 0 (0.0%) |
| 35 to 44 Years | 108 (94.7%) | 0 (0.0%) |
| 45 to 54 Years | 58 (85.3%) | 0 (0.0%) |
| 55 to 59 Years | 43 (100.0%) | 0 (0.0%) |
| 60 to 64 Years | 21 (21.9%) | 0 (0.0%) |
| 65 to 74 Years | 12 (8.2%) | 0 (0.0%) |
| 75 Years and over | 0 (0.0%) | 0 (0.0%) |
| Total | 437 (53.0%) | 0 (0.0%) |
Employment Status by Educational Attainment in Blairs
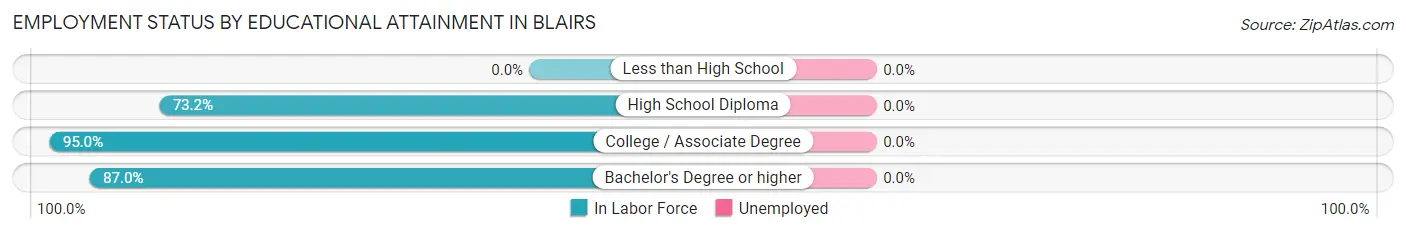
| Educational Attainment | In Labor Force | Unemployed |
| Less than High School | 0 (0.0%) | 0 (0.0%) |
| High School Diploma | 153 (73.2%) | 0 (0.0%) |
| College / Associate Degree | 171 (95.0%) | 0 (0.0%) |
| Bachelor's Degree or higher | 40 (87.0%) | 0 (0.0%) |
| Total | 364 (80.0%) | 0 (0.0%) |
Employment Occupations by Sex in Blairs
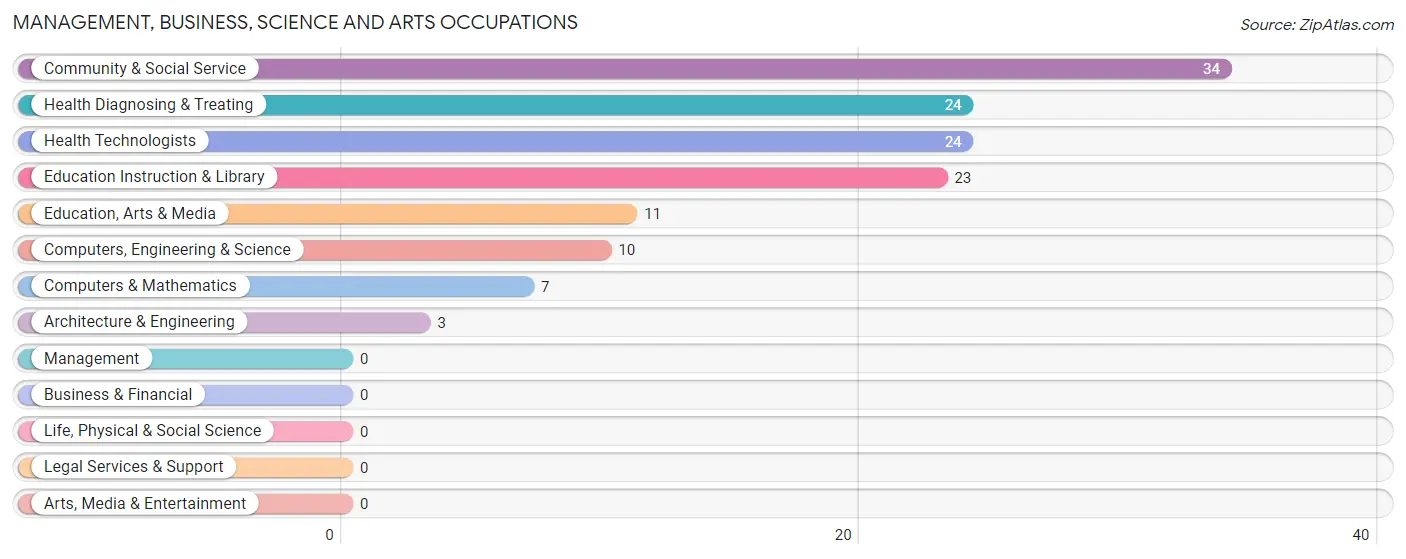
Management, Business, Science and Arts Occupations
The most common Management, Business, Science and Arts occupations in Blairs are Community & Social Service (34 | 7.8%), Health Diagnosing & Treating (24 | 5.5%), Health Technologists (24 | 5.5%), Education Instruction & Library (23 | 5.3%), and Education, Arts & Media (11 | 2.5%).
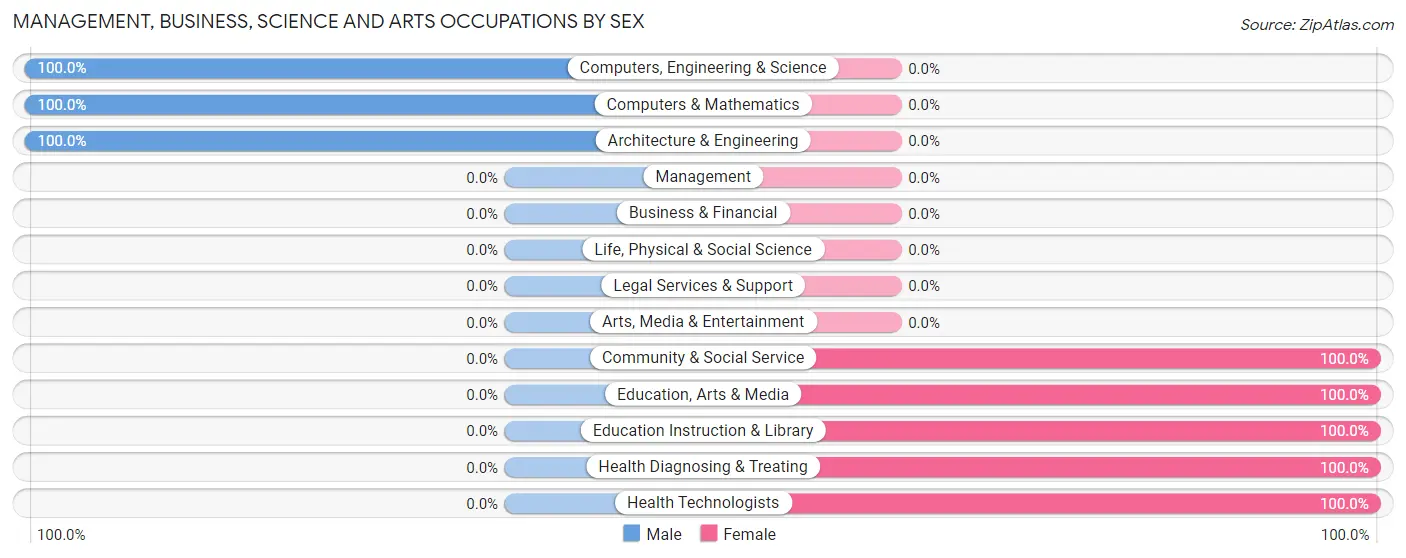
Management, Business, Science and Arts Occupations by Sex
Within the Management, Business, Science and Arts occupations in Blairs, the most male-oriented occupations are Computers, Engineering & Science (100.0%), Computers & Mathematics (100.0%), and Architecture & Engineering (100.0%), while the most female-oriented occupations are Community & Social Service (100.0%), Education, Arts & Media (100.0%), and Education Instruction & Library (100.0%).
| Occupation | Male | Female |
| Management | 0 (0.0%) | 0 (0.0%) |
| Business & Financial | 0 (0.0%) | 0 (0.0%) |
| Computers, Engineering & Science | 10 (100.0%) | 0 (0.0%) |
| Computers & Mathematics | 7 (100.0%) | 0 (0.0%) |
| Architecture & Engineering | 3 (100.0%) | 0 (0.0%) |
| Life, Physical & Social Science | 0 (0.0%) | 0 (0.0%) |
| Community & Social Service | 0 (0.0%) | 34 (100.0%) |
| Education, Arts & Media | 0 (0.0%) | 11 (100.0%) |
| Legal Services & Support | 0 (0.0%) | 0 (0.0%) |
| Education Instruction & Library | 0 (0.0%) | 23 (100.0%) |
| Arts, Media & Entertainment | 0 (0.0%) | 0 (0.0%) |
| Health Diagnosing & Treating | 0 (0.0%) | 24 (100.0%) |
| Health Technologists | 0 (0.0%) | 24 (100.0%) |
| Total (Category) | 10 (14.7%) | 58 (85.3%) |
| Total (Overall) | 195 (44.6%) | 242 (55.4%) |
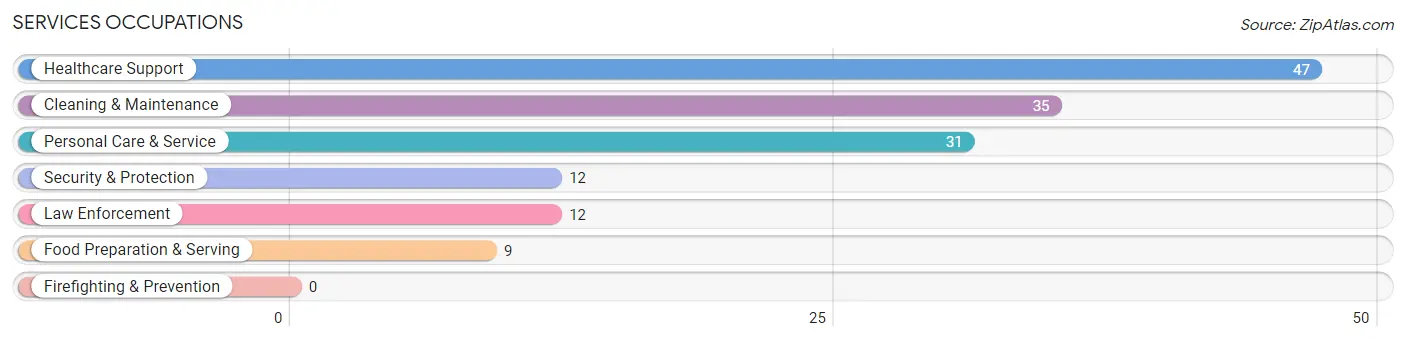
Services Occupations
The most common Services occupations in Blairs are Healthcare Support (47 | 10.8%), Cleaning & Maintenance (35 | 8.0%), Personal Care & Service (31 | 7.1%), Security & Protection (12 | 2.8%), and Law Enforcement (12 | 2.8%).
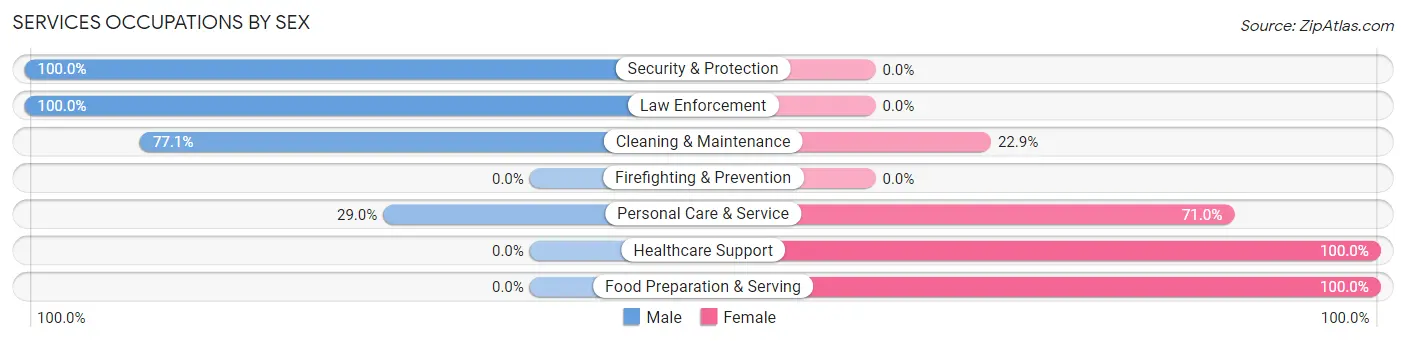
Services Occupations by Sex
Within the Services occupations in Blairs, the most male-oriented occupations are Security & Protection (100.0%), Law Enforcement (100.0%), and Cleaning & Maintenance (77.1%), while the most female-oriented occupations are Healthcare Support (100.0%), Food Preparation & Serving (100.0%), and Personal Care & Service (71.0%).
| Occupation | Male | Female |
| Healthcare Support | 0 (0.0%) | 47 (100.0%) |
| Security & Protection | 12 (100.0%) | 0 (0.0%) |
| Firefighting & Prevention | 0 (0.0%) | 0 (0.0%) |
| Law Enforcement | 12 (100.0%) | 0 (0.0%) |
| Food Preparation & Serving | 0 (0.0%) | 9 (100.0%) |
| Cleaning & Maintenance | 27 (77.1%) | 8 (22.9%) |
| Personal Care & Service | 9 (29.0%) | 22 (71.0%) |
| Total (Category) | 48 (35.8%) | 86 (64.2%) |
| Total (Overall) | 195 (44.6%) | 242 (55.4%) |
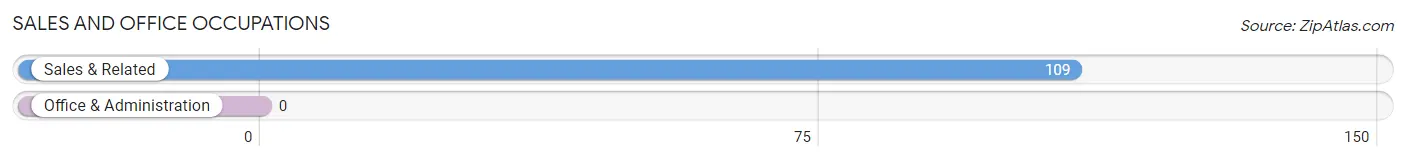
Sales and Office Occupations
The most common Sales and Office occupations in Blairs are , and Sales & Related (109 | 24.9%).
Sales and Office Occupations by Sex
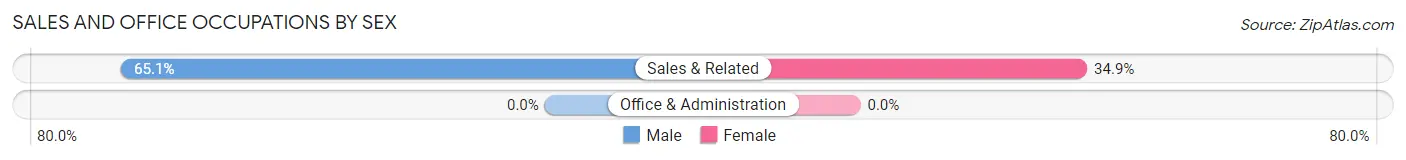
| Occupation | Male | Female |
| Sales & Related | 71 (65.1%) | 38 (34.9%) |
| Office & Administration | 0 (0.0%) | 0 (0.0%) |
| Total (Category) | 71 (65.1%) | 38 (34.9%) |
| Total (Overall) | 195 (44.6%) | 242 (55.4%) |
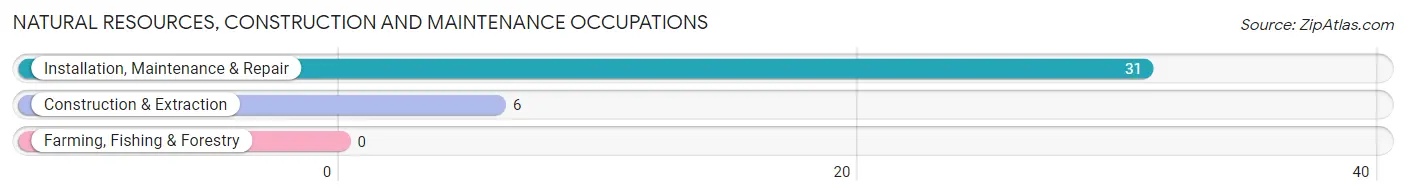
Natural Resources, Construction and Maintenance Occupations
The most common Natural Resources, Construction and Maintenance occupations in Blairs are Installation, Maintenance & Repair (31 | 7.1%), and Construction & Extraction (6 | 1.4%).
Natural Resources, Construction and Maintenance Occupations by Sex
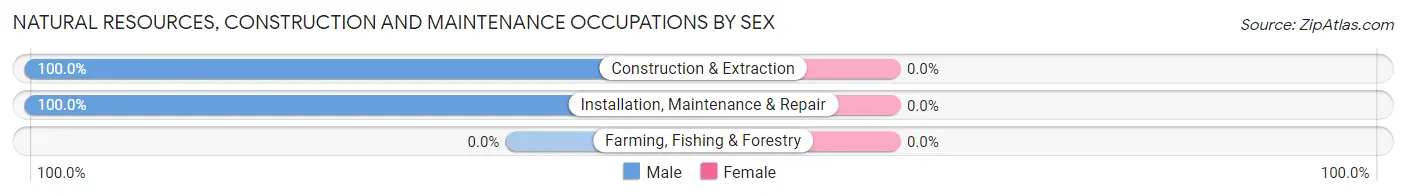
| Occupation | Male | Female |
| Farming, Fishing & Forestry | 0 (0.0%) | 0 (0.0%) |
| Construction & Extraction | 6 (100.0%) | 0 (0.0%) |
| Installation, Maintenance & Repair | 31 (100.0%) | 0 (0.0%) |
| Total (Category) | 37 (100.0%) | 0 (0.0%) |
| Total (Overall) | 195 (44.6%) | 242 (55.4%) |
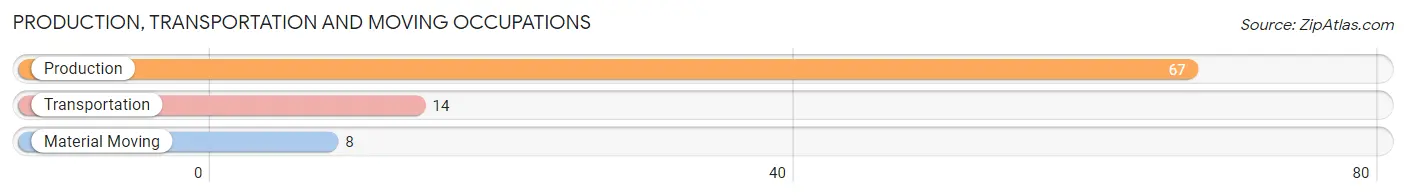
Production, Transportation and Moving Occupations
The most common Production, Transportation and Moving occupations in Blairs are Production (67 | 15.3%), Transportation (14 | 3.2%), and Material Moving (8 | 1.8%).
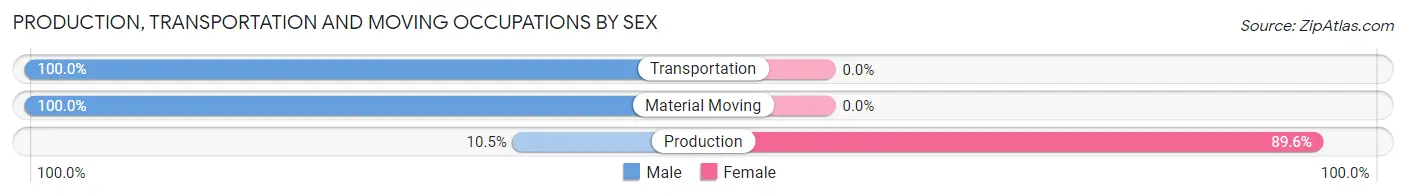
Production, Transportation and Moving Occupations by Sex
| Occupation | Male | Female |
| Production | 7 (10.4%) | 60 (89.5%) |
| Transportation | 14 (100.0%) | 0 (0.0%) |
| Material Moving | 8 (100.0%) | 0 (0.0%) |
| Total (Category) | 29 (32.6%) | 60 (67.4%) |
| Total (Overall) | 195 (44.6%) | 242 (55.4%) |
Employment Industries by Sex in Blairs
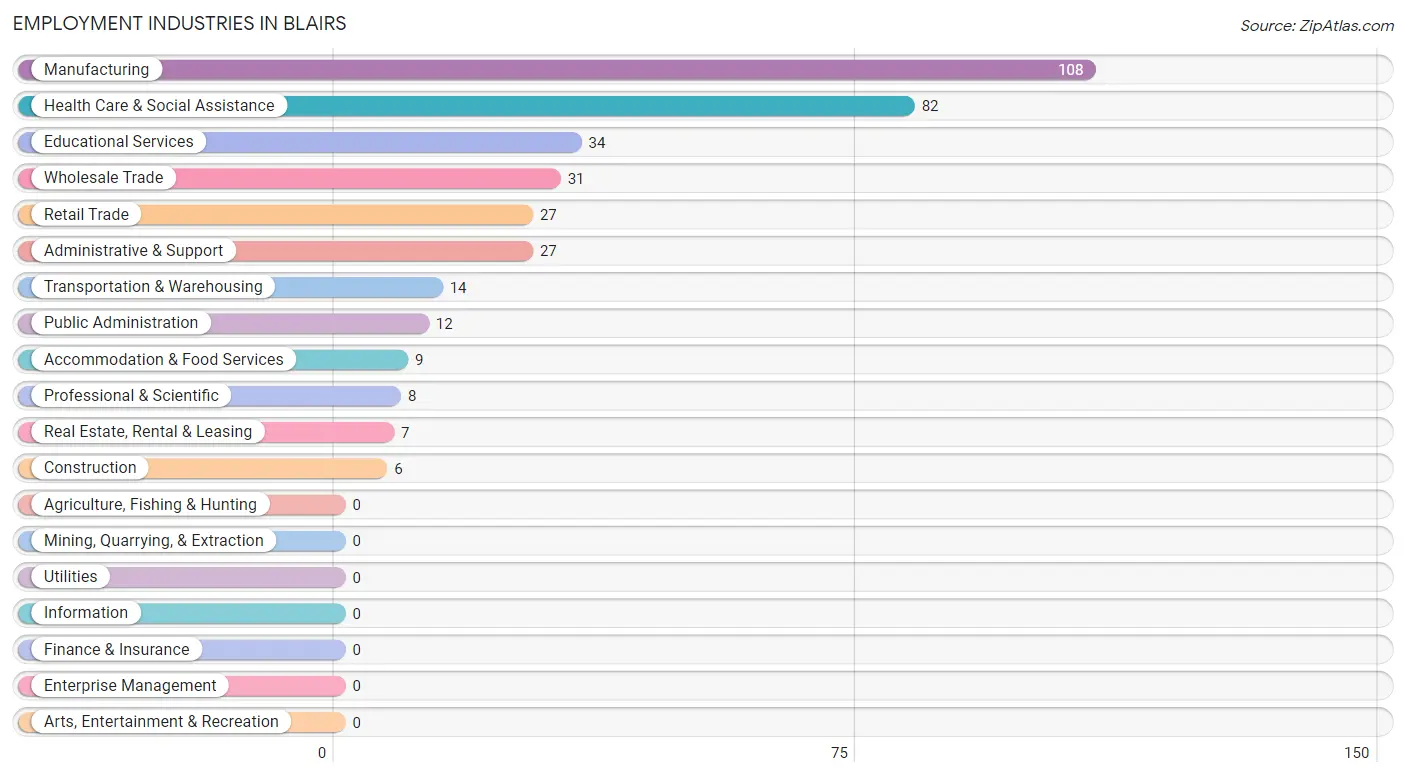
Employment Industries in Blairs
The major employment industries in Blairs include Manufacturing (108 | 24.7%), Health Care & Social Assistance (82 | 18.8%), Educational Services (34 | 7.8%), Wholesale Trade (31 | 7.1%), and Retail Trade (27 | 6.2%).
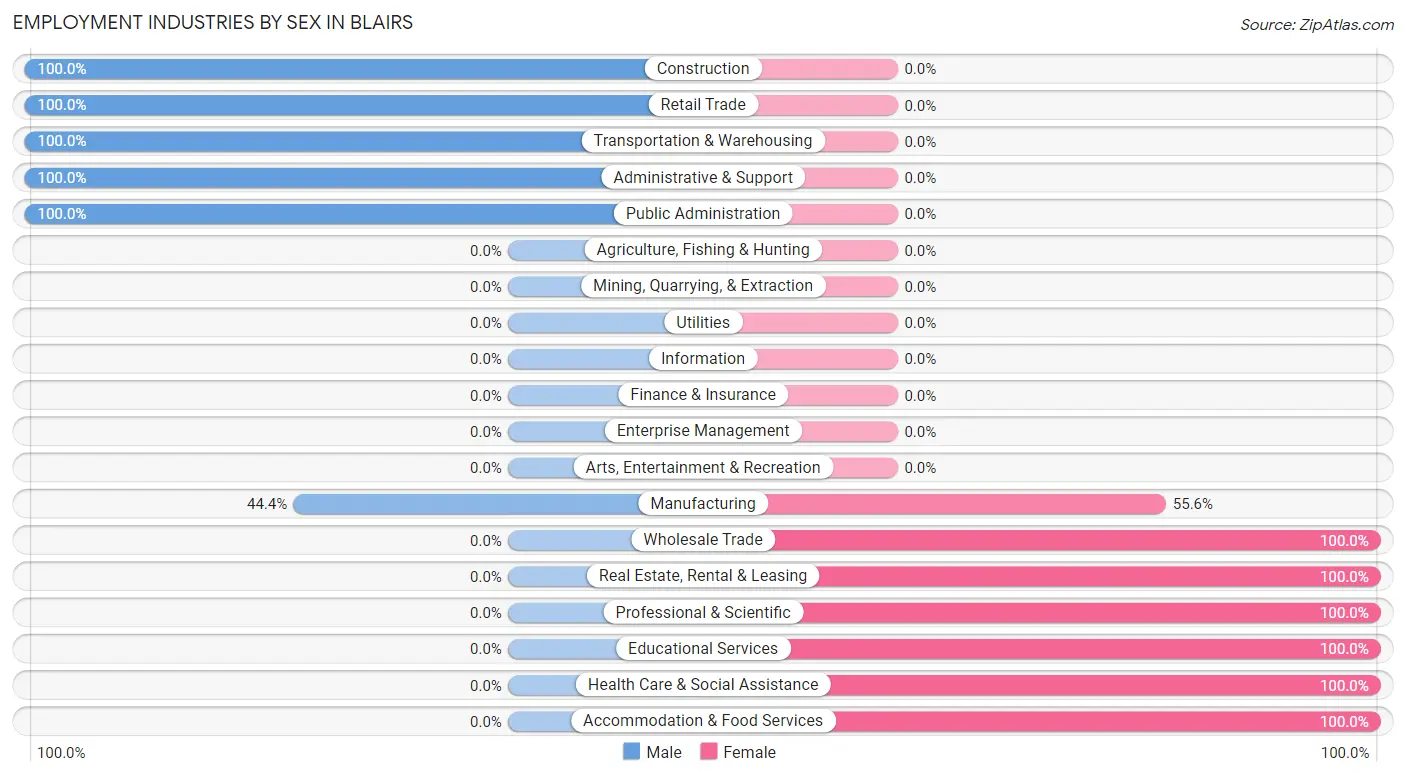
Employment Industries by Sex in Blairs
The Blairs industries that see more men than women are Construction (100.0%), Retail Trade (100.0%), and Transportation & Warehousing (100.0%), whereas the industries that tend to have a higher number of women are Wholesale Trade (100.0%), Real Estate, Rental & Leasing (100.0%), and Professional & Scientific (100.0%).
| Industry | Male | Female |
| Agriculture, Fishing & Hunting | 0 (0.0%) | 0 (0.0%) |
| Mining, Quarrying, & Extraction | 0 (0.0%) | 0 (0.0%) |
| Construction | 6 (100.0%) | 0 (0.0%) |
| Manufacturing | 48 (44.4%) | 60 (55.6%) |
| Wholesale Trade | 0 (0.0%) | 31 (100.0%) |
| Retail Trade | 27 (100.0%) | 0 (0.0%) |
| Transportation & Warehousing | 14 (100.0%) | 0 (0.0%) |
| Utilities | 0 (0.0%) | 0 (0.0%) |
| Information | 0 (0.0%) | 0 (0.0%) |
| Finance & Insurance | 0 (0.0%) | 0 (0.0%) |
| Real Estate, Rental & Leasing | 0 (0.0%) | 7 (100.0%) |
| Professional & Scientific | 0 (0.0%) | 8 (100.0%) |
| Enterprise Management | 0 (0.0%) | 0 (0.0%) |
| Administrative & Support | 27 (100.0%) | 0 (0.0%) |
| Educational Services | 0 (0.0%) | 34 (100.0%) |
| Health Care & Social Assistance | 0 (0.0%) | 82 (100.0%) |
| Arts, Entertainment & Recreation | 0 (0.0%) | 0 (0.0%) |
| Accommodation & Food Services | 0 (0.0%) | 9 (100.0%) |
| Public Administration | 12 (100.0%) | 0 (0.0%) |
| Total | 195 (44.6%) | 242 (55.4%) |
Education in Blairs
School Enrollment in Blairs
The most common levels of schooling among the 226 students in Blairs are high school (93 | 41.1%), nursery / preschool (51 | 22.6%), and college / undergraduate (47 | 20.8%).
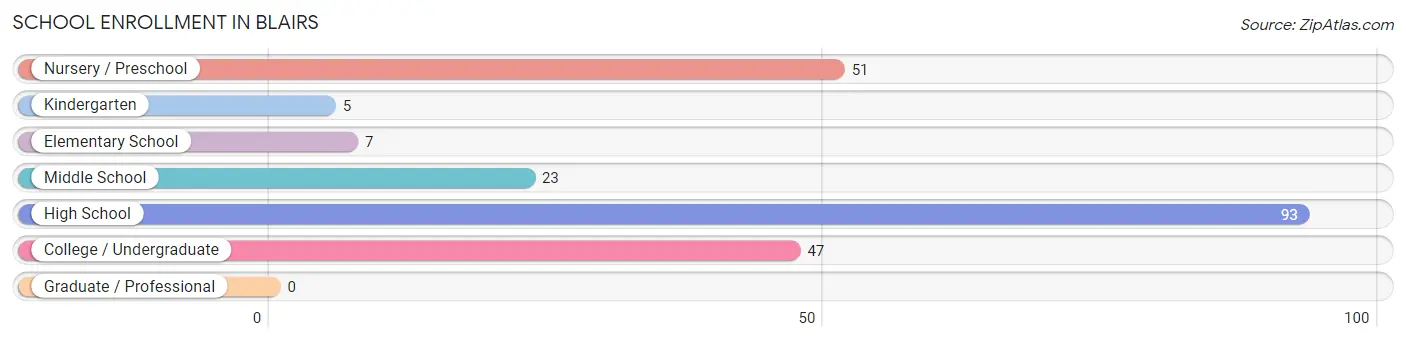
| School Level | # Students | % Students |
| Nursery / Preschool | 51 | 22.6% |
| Kindergarten | 5 | 2.2% |
| Elementary School | 7 | 3.1% |
| Middle School | 23 | 10.2% |
| High School | 93 | 41.1% |
| College / Undergraduate | 47 | 20.8% |
| Graduate / Professional | 0 | 0.0% |
| Total | 226 | 100.0% |
School Enrollment by Age by Funding Source in Blairs
Out of a total of 226 students who are enrolled in schools in Blairs, 6 (2.7%) attend a private institution, while the remaining 220 (97.3%) are enrolled in public schools. The age group of 15 to 17 year olds has the highest likelihood of being enrolled in private schools, with 6 (8.1% in the age bracket) enrolled. Conversely, the age group of 3 to 4 year olds has the lowest likelihood of being enrolled in a private school, with 51 (100.0% in the age bracket) attending a public institution.
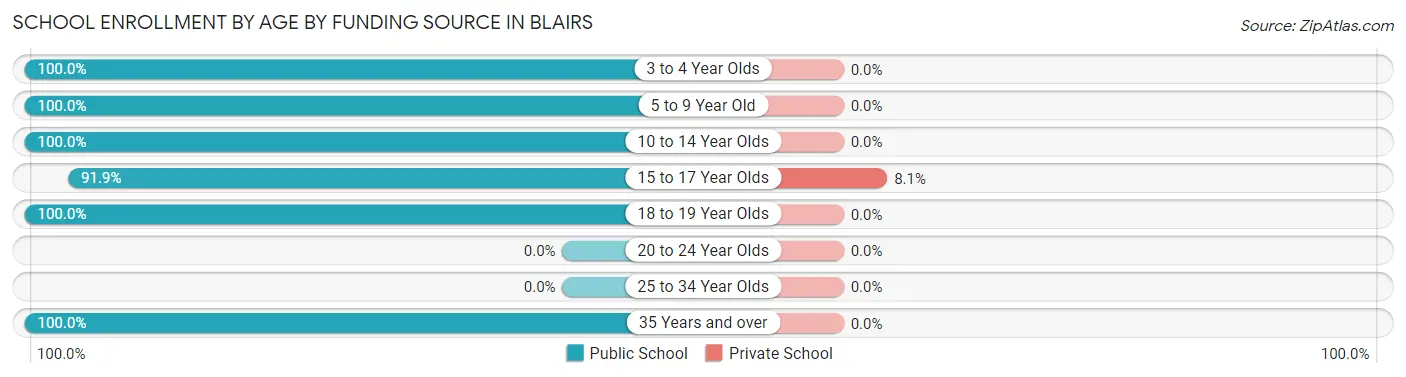
| Age Bracket | Public School | Private School |
| 3 to 4 Year Olds | 51 (100.0%) | 0 (0.0%) |
| 5 to 9 Year Old | 12 (100.0%) | 0 (0.0%) |
| 10 to 14 Year Olds | 23 (100.0%) | 0 (0.0%) |
| 15 to 17 Year Olds | 68 (91.9%) | 6 (8.1%) |
| 18 to 19 Year Olds | 50 (100.0%) | 0 (0.0%) |
| 20 to 24 Year Olds | 0 (0.0%) | 0 (0.0%) |
| 25 to 34 Year Olds | 0 (0.0%) | 0 (0.0%) |
| 35 Years and over | 16 (100.0%) | 0 (0.0%) |
| Total | 220 (97.3%) | 6 (2.7%) |
Educational Attainment by Field of Study in Blairs
Literature & languages (35 | 25.0%), arts & humanities (35 | 25.0%), education (22 | 15.7%), bio, nature & agricultural (14 | 10.0%), and psychology (11 | 7.9%) are the most common fields of study among 140 individuals in Blairs who have obtained a bachelor's degree or higher.
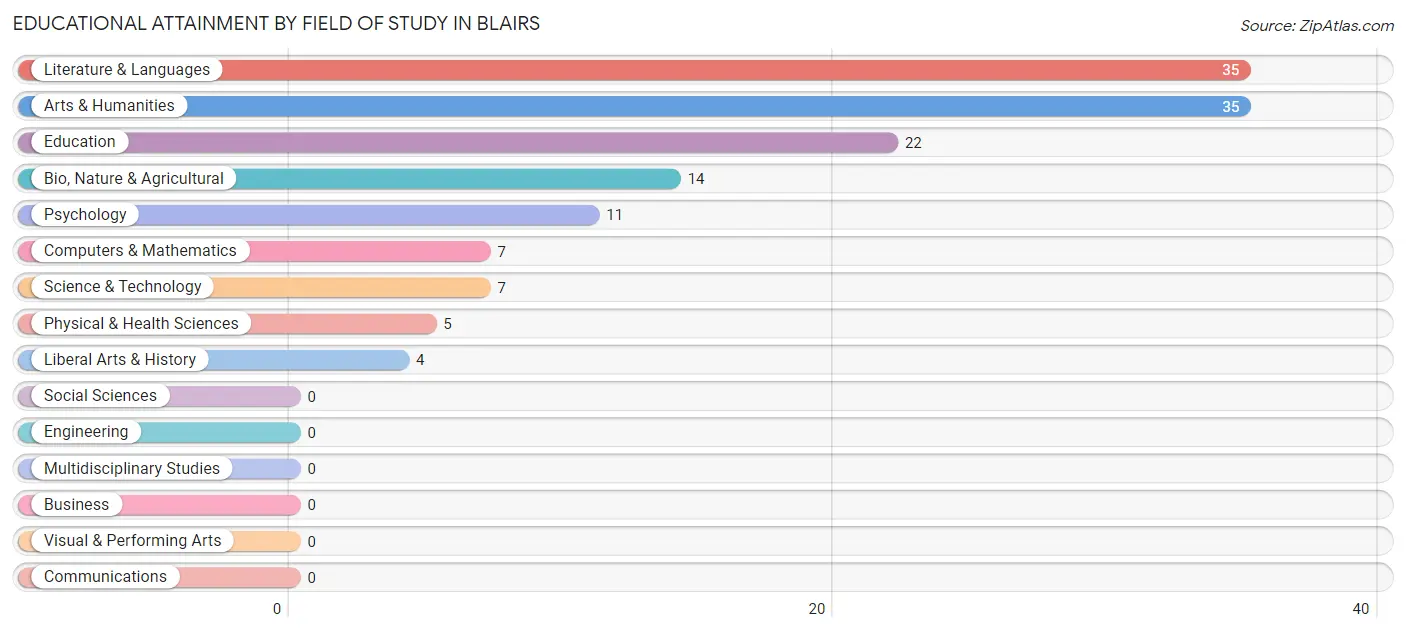
| Field of Study | # Graduates | % Graduates |
| Computers & Mathematics | 7 | 5.0% |
| Bio, Nature & Agricultural | 14 | 10.0% |
| Physical & Health Sciences | 5 | 3.6% |
| Psychology | 11 | 7.9% |
| Social Sciences | 0 | 0.0% |
| Engineering | 0 | 0.0% |
| Multidisciplinary Studies | 0 | 0.0% |
| Science & Technology | 7 | 5.0% |
| Business | 0 | 0.0% |
| Education | 22 | 15.7% |
| Literature & Languages | 35 | 25.0% |
| Liberal Arts & History | 4 | 2.9% |
| Visual & Performing Arts | 0 | 0.0% |
| Communications | 0 | 0.0% |
| Arts & Humanities | 35 | 25.0% |
| Total | 140 | 100.0% |
Transportation & Commute in Blairs
Vehicle Availability by Sex in Blairs
The most prevalent vehicle ownership categories in Blairs are males with 3 vehicles (84, accounting for 47.7%) and females with 3 vehicles (31, making up 39.4%).
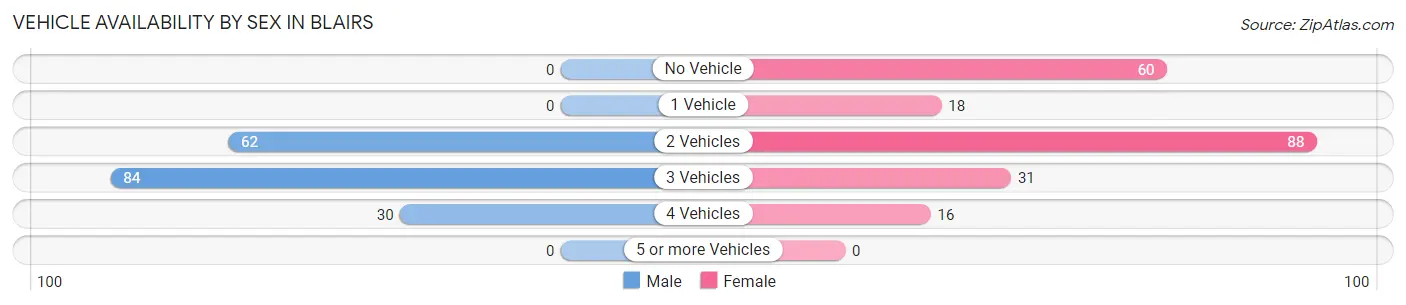
| Vehicles Available | Male | Female |
| No Vehicle | 0 (0.0%) | 60 (28.2%) |
| 1 Vehicle | 0 (0.0%) | 18 (8.5%) |
| 2 Vehicles | 62 (35.2%) | 88 (41.3%) |
| 3 Vehicles | 84 (47.7%) | 31 (14.5%) |
| 4 Vehicles | 30 (17.1%) | 16 (7.5%) |
| 5 or more Vehicles | 0 (0.0%) | 0 (0.0%) |
| Total | 176 (100.0%) | 213 (100.0%) |
Commute Time in Blairs
The most frequently occuring commute durations in Blairs are 15 to 19 minutes (154 commuters, 41.6%), 10 to 14 minutes (47 commuters, 12.7%), and 20 to 24 minutes (41 commuters, 11.1%).
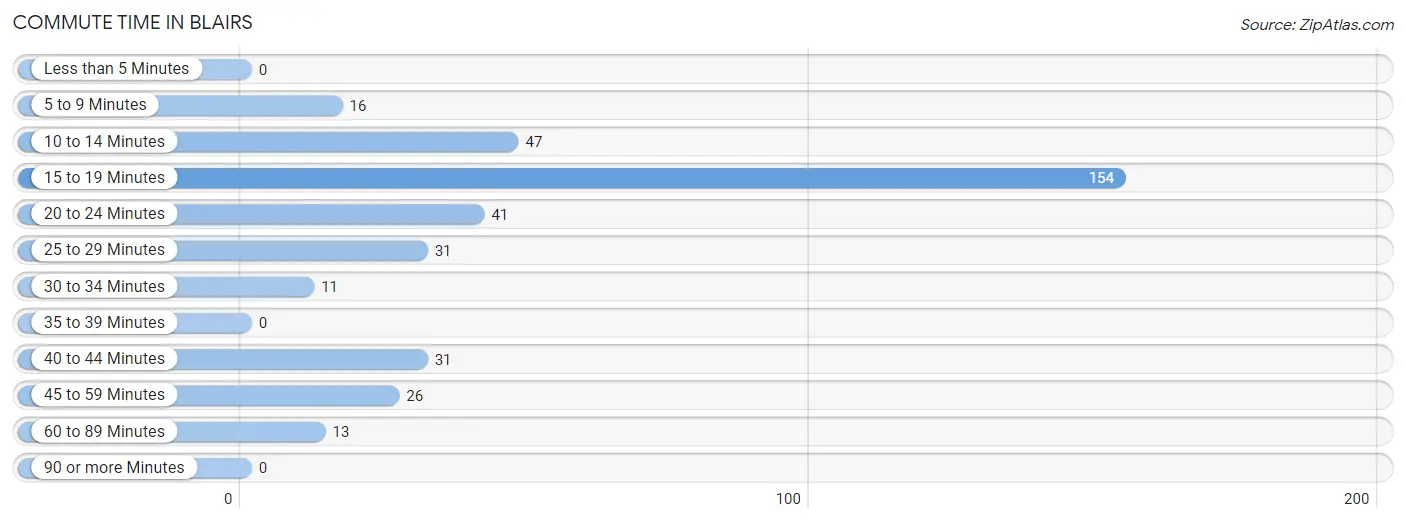
| Commute Time | # Commuters | % Commuters |
| Less than 5 Minutes | 0 | 0.0% |
| 5 to 9 Minutes | 16 | 4.3% |
| 10 to 14 Minutes | 47 | 12.7% |
| 15 to 19 Minutes | 154 | 41.6% |
| 20 to 24 Minutes | 41 | 11.1% |
| 25 to 29 Minutes | 31 | 8.4% |
| 30 to 34 Minutes | 11 | 3.0% |
| 35 to 39 Minutes | 0 | 0.0% |
| 40 to 44 Minutes | 31 | 8.4% |
| 45 to 59 Minutes | 26 | 7.0% |
| 60 to 89 Minutes | 13 | 3.5% |
| 90 or more Minutes | 0 | 0.0% |
Commute Time by Sex in Blairs
The most common commute times in Blairs are 15 to 19 minutes (59 commuters, 35.1%) for males and 15 to 19 minutes (95 commuters, 47.0%) for females.
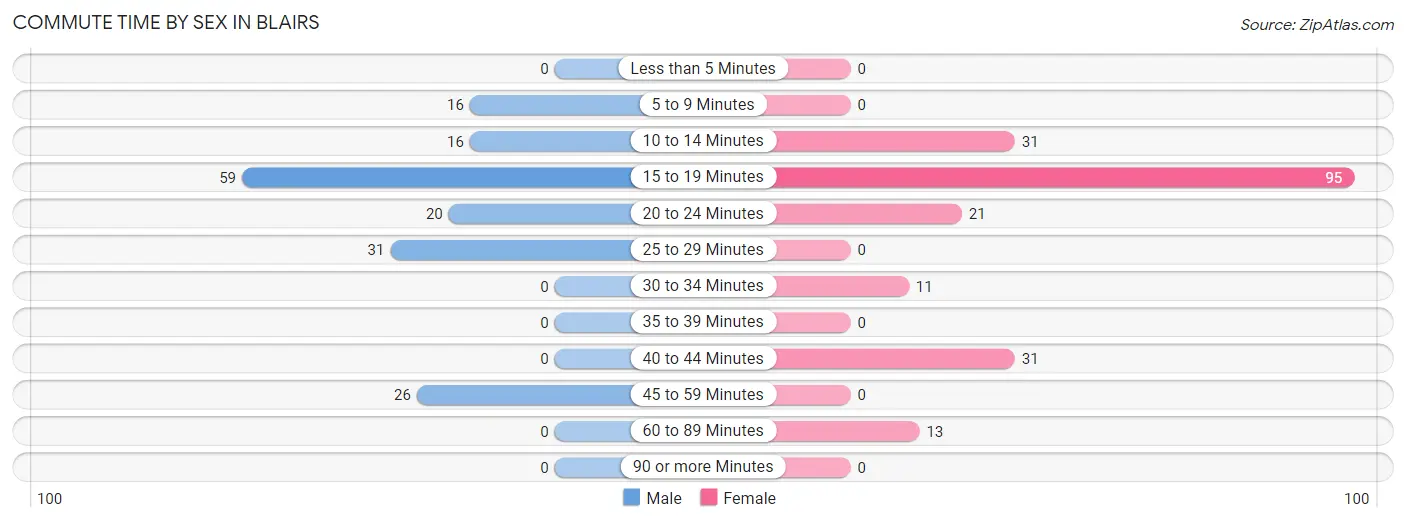
| Commute Time | Male | Female |
| Less than 5 Minutes | 0 (0.0%) | 0 (0.0%) |
| 5 to 9 Minutes | 16 (9.5%) | 0 (0.0%) |
| 10 to 14 Minutes | 16 (9.5%) | 31 (15.3%) |
| 15 to 19 Minutes | 59 (35.1%) | 95 (47.0%) |
| 20 to 24 Minutes | 20 (11.9%) | 21 (10.4%) |
| 25 to 29 Minutes | 31 (18.4%) | 0 (0.0%) |
| 30 to 34 Minutes | 0 (0.0%) | 11 (5.4%) |
| 35 to 39 Minutes | 0 (0.0%) | 0 (0.0%) |
| 40 to 44 Minutes | 0 (0.0%) | 31 (15.3%) |
| 45 to 59 Minutes | 26 (15.5%) | 0 (0.0%) |
| 60 to 89 Minutes | 0 (0.0%) | 13 (6.4%) |
| 90 or more Minutes | 0 (0.0%) | 0 (0.0%) |
Time of Departure to Work by Sex in Blairs
The most frequent times of departure to work in Blairs are 7:30 AM to 7:59 AM (51, 30.4%) for males and 7:00 AM to 7:29 AM (60, 29.7%) for females.
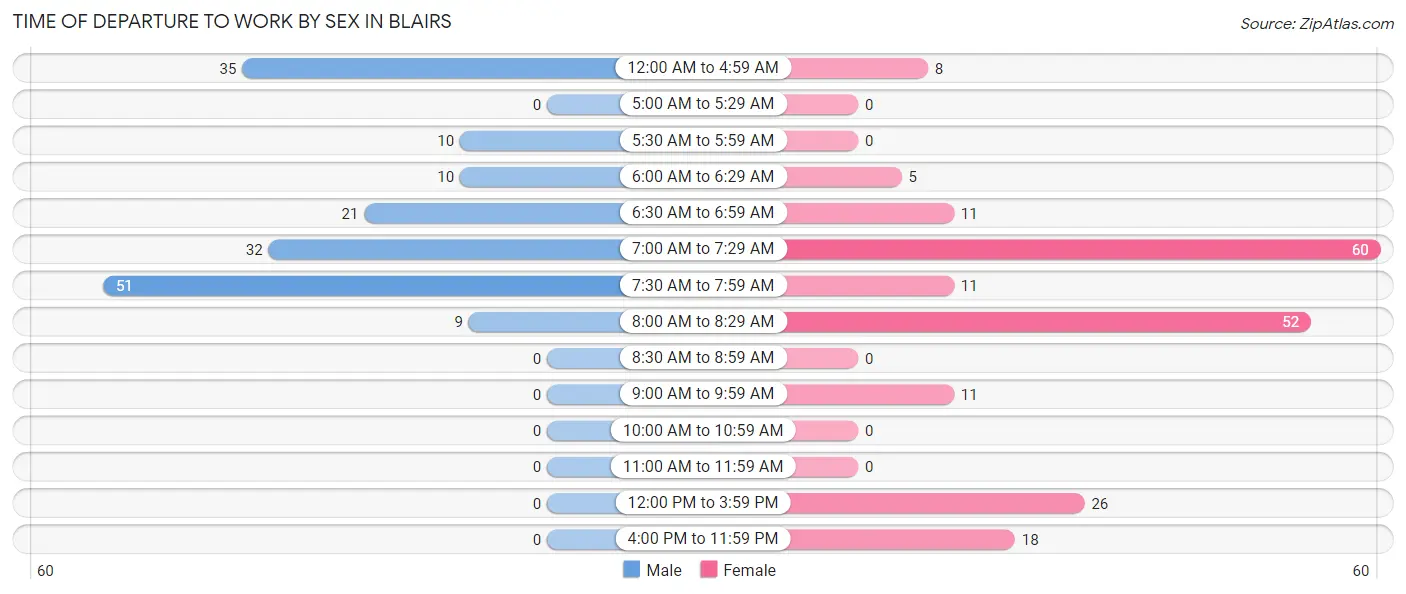
| Time of Departure | Male | Female |
| 12:00 AM to 4:59 AM | 35 (20.8%) | 8 (4.0%) |
| 5:00 AM to 5:29 AM | 0 (0.0%) | 0 (0.0%) |
| 5:30 AM to 5:59 AM | 10 (5.9%) | 0 (0.0%) |
| 6:00 AM to 6:29 AM | 10 (5.9%) | 5 (2.5%) |
| 6:30 AM to 6:59 AM | 21 (12.5%) | 11 (5.4%) |
| 7:00 AM to 7:29 AM | 32 (19.1%) | 60 (29.7%) |
| 7:30 AM to 7:59 AM | 51 (30.4%) | 11 (5.4%) |
| 8:00 AM to 8:29 AM | 9 (5.4%) | 52 (25.7%) |
| 8:30 AM to 8:59 AM | 0 (0.0%) | 0 (0.0%) |
| 9:00 AM to 9:59 AM | 0 (0.0%) | 11 (5.4%) |
| 10:00 AM to 10:59 AM | 0 (0.0%) | 0 (0.0%) |
| 11:00 AM to 11:59 AM | 0 (0.0%) | 0 (0.0%) |
| 12:00 PM to 3:59 PM | 0 (0.0%) | 26 (12.9%) |
| 4:00 PM to 11:59 PM | 0 (0.0%) | 18 (8.9%) |
| Total | 168 (100.0%) | 202 (100.0%) |
Housing Occupancy in Blairs
Occupancy by Ownership in Blairs
Of the total 356 dwellings in Blairs, owner-occupied units account for 279 (78.4%), while renter-occupied units make up 77 (21.6%).
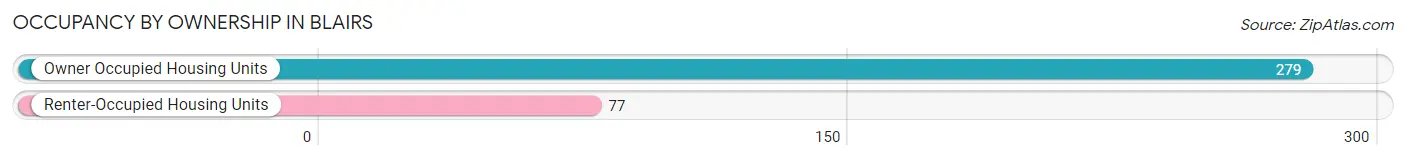
| Occupancy | # Housing Units | % Housing Units |
| Owner Occupied Housing Units | 279 | 78.4% |
| Renter-Occupied Housing Units | 77 | 21.6% |
| Total Occupied Housing Units | 356 | 100.0% |
Occupancy by Household Size in Blairs
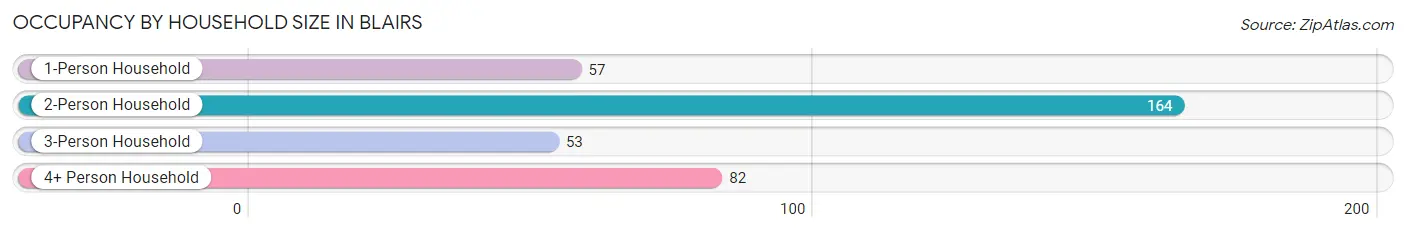
| Household Size | # Housing Units | % Housing Units |
| 1-Person Household | 57 | 16.0% |
| 2-Person Household | 164 | 46.1% |
| 3-Person Household | 53 | 14.9% |
| 4+ Person Household | 82 | 23.0% |
| Total Housing Units | 356 | 100.0% |
Occupancy by Ownership by Household Size in Blairs
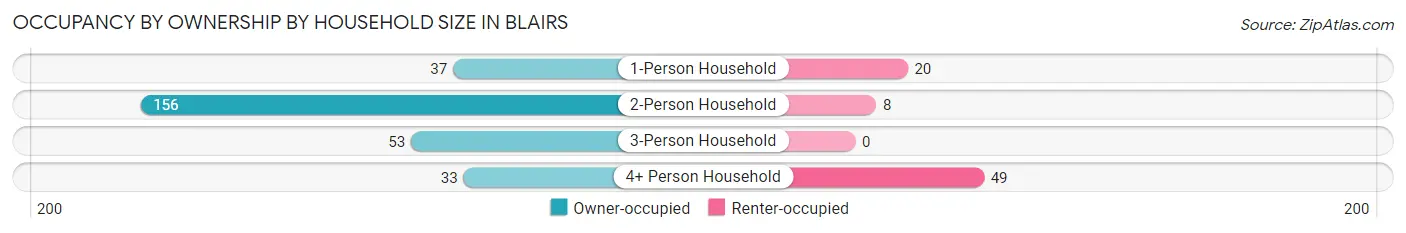
| Household Size | Owner-occupied | Renter-occupied |
| 1-Person Household | 37 (64.9%) | 20 (35.1%) |
| 2-Person Household | 156 (95.1%) | 8 (4.9%) |
| 3-Person Household | 53 (100.0%) | 0 (0.0%) |
| 4+ Person Household | 33 (40.2%) | 49 (59.8%) |
| Total Housing Units | 279 (78.4%) | 77 (21.6%) |
Occupancy by Educational Attainment in Blairs
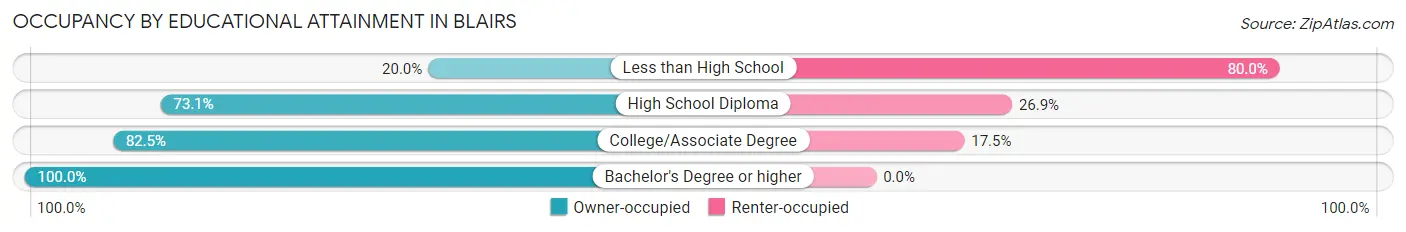
| Household Size | Owner-occupied | Renter-occupied |
| Less than High School | 5 (20.0%) | 20 (80.0%) |
| High School Diploma | 76 (73.1%) | 28 (26.9%) |
| College/Associate Degree | 137 (82.5%) | 29 (17.5%) |
| Bachelor's Degree or higher | 61 (100.0%) | 0 (0.0%) |
Occupancy by Age of Householder in Blairs
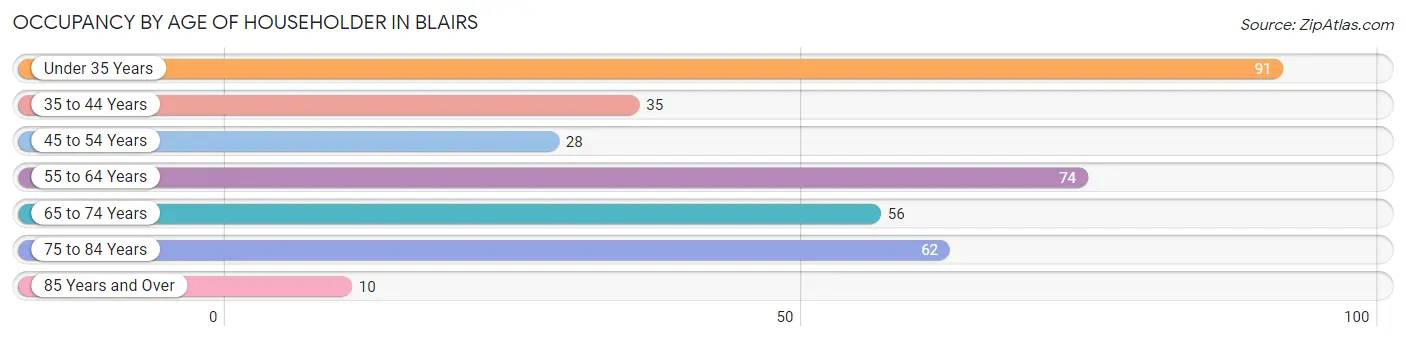
| Age Bracket | # Households | % Households |
| Under 35 Years | 91 | 25.6% |
| 35 to 44 Years | 35 | 9.8% |
| 45 to 54 Years | 28 | 7.9% |
| 55 to 64 Years | 74 | 20.8% |
| 65 to 74 Years | 56 | 15.7% |
| 75 to 84 Years | 62 | 17.4% |
| 85 Years and Over | 10 | 2.8% |
| Total | 356 | 100.0% |
Housing Finances in Blairs
Median Income by Occupancy in Blairs
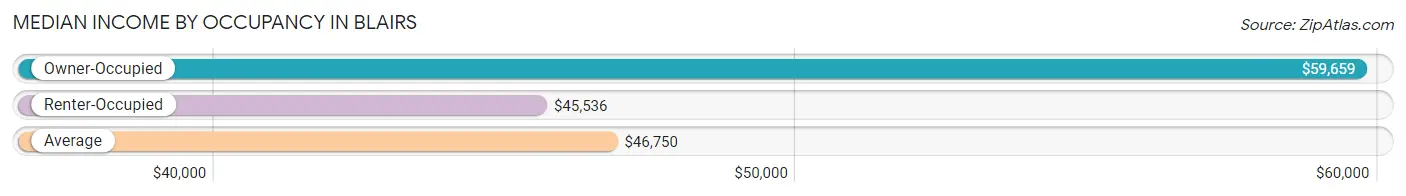
| Occupancy Type | # Households | Median Income |
| Owner-Occupied | 279 (78.4%) | $59,659 |
| Renter-Occupied | 77 (21.6%) | $45,536 |
| Average | 356 (100.0%) | $46,750 |
Occupancy by Householder Income Bracket in Blairs
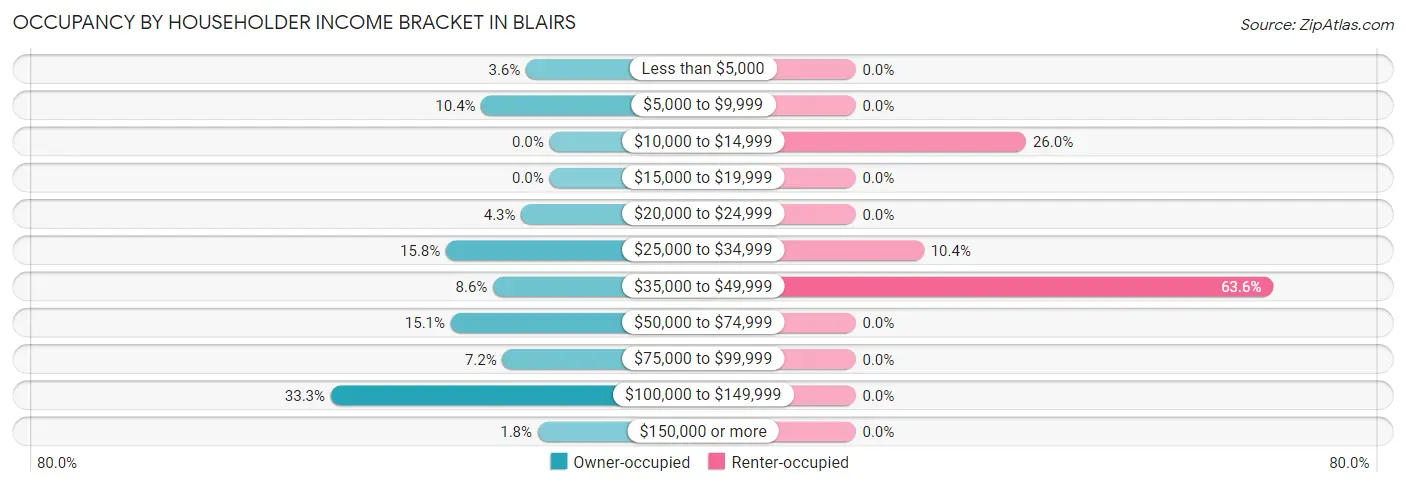
| Income Bracket | Owner-occupied | Renter-occupied |
| Less than $5,000 | 10 (3.6%) | 0 (0.0%) |
| $5,000 to $9,999 | 29 (10.4%) | 0 (0.0%) |
| $10,000 to $14,999 | 0 (0.0%) | 20 (26.0%) |
| $15,000 to $19,999 | 0 (0.0%) | 0 (0.0%) |
| $20,000 to $24,999 | 12 (4.3%) | 0 (0.0%) |
| $25,000 to $34,999 | 44 (15.8%) | 8 (10.4%) |
| $35,000 to $49,999 | 24 (8.6%) | 49 (63.6%) |
| $50,000 to $74,999 | 42 (15.0%) | 0 (0.0%) |
| $75,000 to $99,999 | 20 (7.2%) | 0 (0.0%) |
| $100,000 to $149,999 | 93 (33.3%) | 0 (0.0%) |
| $150,000 or more | 5 (1.8%) | 0 (0.0%) |
| Total | 279 (100.0%) | 77 (100.0%) |
Monthly Housing Cost Tiers in Blairs
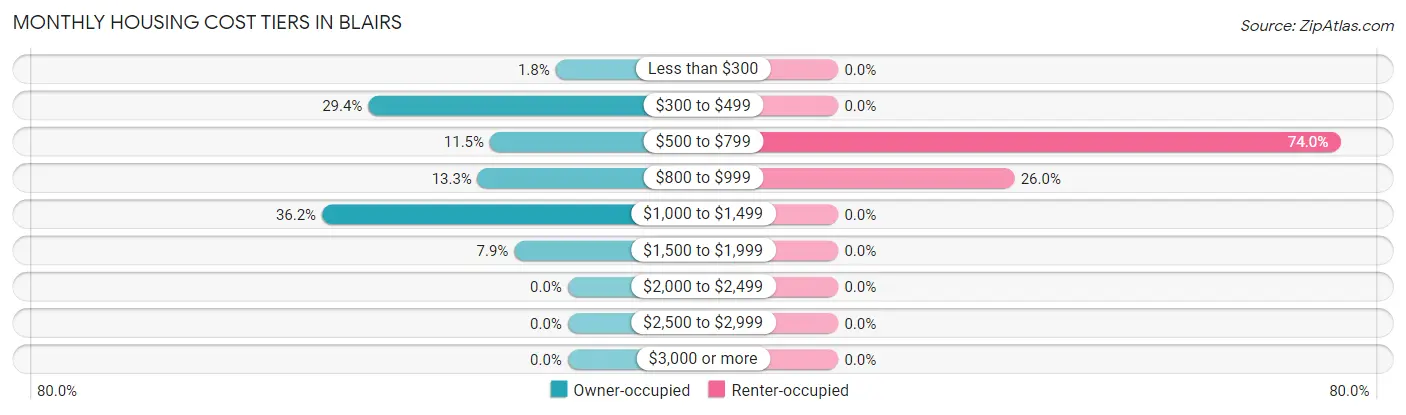
| Monthly Cost | Owner-occupied | Renter-occupied |
| Less than $300 | 5 (1.8%) | 0 (0.0%) |
| $300 to $499 | 82 (29.4%) | 0 (0.0%) |
| $500 to $799 | 32 (11.5%) | 57 (74.0%) |
| $800 to $999 | 37 (13.3%) | 20 (26.0%) |
| $1,000 to $1,499 | 101 (36.2%) | 0 (0.0%) |
| $1,500 to $1,999 | 22 (7.9%) | 0 (0.0%) |
| $2,000 to $2,499 | 0 (0.0%) | 0 (0.0%) |
| $2,500 to $2,999 | 0 (0.0%) | 0 (0.0%) |
| $3,000 or more | 0 (0.0%) | 0 (0.0%) |
| Total | 279 (100.0%) | 77 (100.0%) |
Physical Housing Characteristics in Blairs
Housing Structures in Blairs
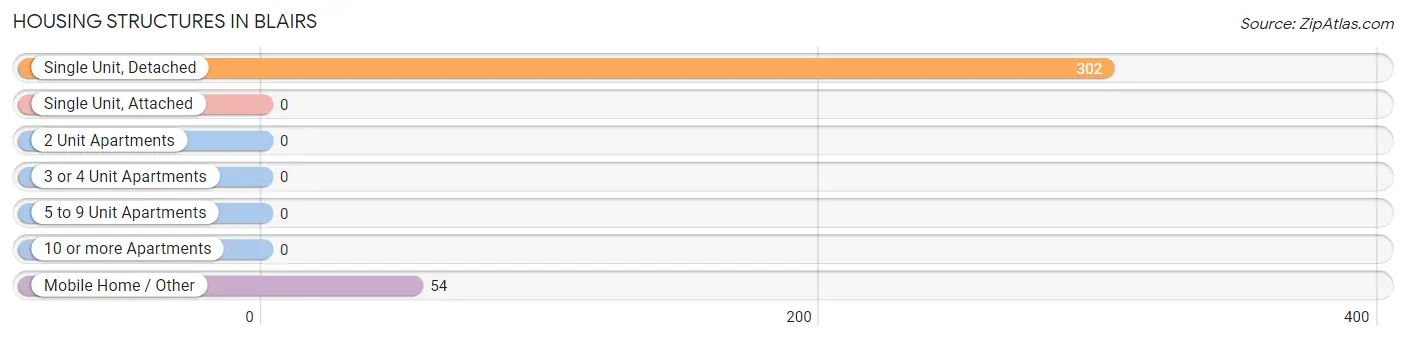
| Structure Type | # Housing Units | % Housing Units |
| Single Unit, Detached | 302 | 84.8% |
| Single Unit, Attached | 0 | 0.0% |
| 2 Unit Apartments | 0 | 0.0% |
| 3 or 4 Unit Apartments | 0 | 0.0% |
| 5 to 9 Unit Apartments | 0 | 0.0% |
| 10 or more Apartments | 0 | 0.0% |
| Mobile Home / Other | 54 | 15.2% |
| Total | 356 | 100.0% |
Housing Structures by Occupancy in Blairs
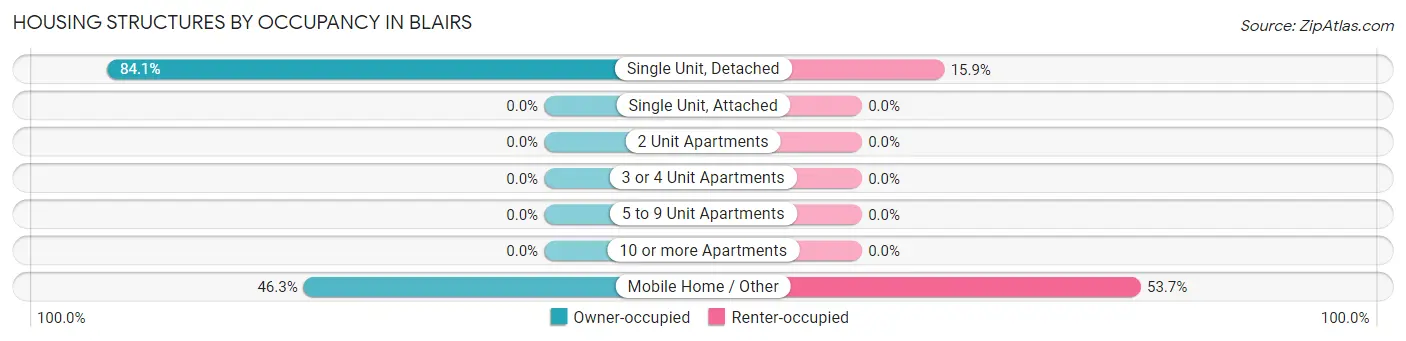
| Structure Type | Owner-occupied | Renter-occupied |
| Single Unit, Detached | 254 (84.1%) | 48 (15.9%) |
| Single Unit, Attached | 0 (0.0%) | 0 (0.0%) |
| 2 Unit Apartments | 0 (0.0%) | 0 (0.0%) |
| 3 or 4 Unit Apartments | 0 (0.0%) | 0 (0.0%) |
| 5 to 9 Unit Apartments | 0 (0.0%) | 0 (0.0%) |
| 10 or more Apartments | 0 (0.0%) | 0 (0.0%) |
| Mobile Home / Other | 25 (46.3%) | 29 (53.7%) |
| Total | 279 (78.4%) | 77 (21.6%) |
Housing Structures by Number of Rooms in Blairs
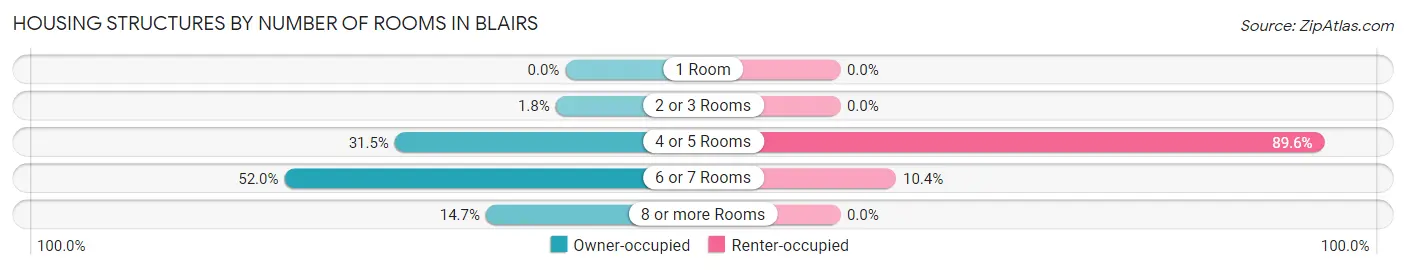
| Number of Rooms | Owner-occupied | Renter-occupied |
| 1 Room | 0 (0.0%) | 0 (0.0%) |
| 2 or 3 Rooms | 5 (1.8%) | 0 (0.0%) |
| 4 or 5 Rooms | 88 (31.5%) | 69 (89.6%) |
| 6 or 7 Rooms | 145 (52.0%) | 8 (10.4%) |
| 8 or more Rooms | 41 (14.7%) | 0 (0.0%) |
| Total | 279 (100.0%) | 77 (100.0%) |
Housing Structure by Heating Type in Blairs
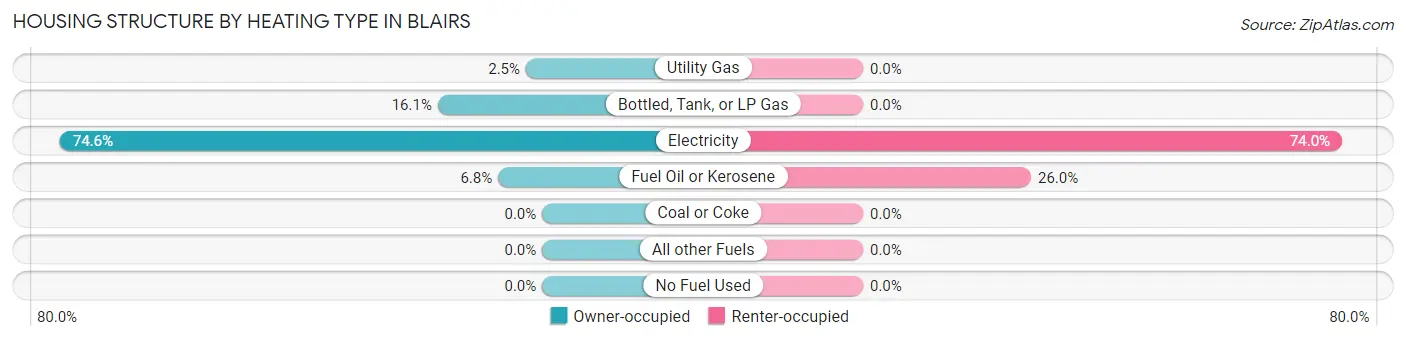
| Heating Type | Owner-occupied | Renter-occupied |
| Utility Gas | 7 (2.5%) | 0 (0.0%) |
| Bottled, Tank, or LP Gas | 45 (16.1%) | 0 (0.0%) |
| Electricity | 208 (74.6%) | 57 (74.0%) |
| Fuel Oil or Kerosene | 19 (6.8%) | 20 (26.0%) |
| Coal or Coke | 0 (0.0%) | 0 (0.0%) |
| All other Fuels | 0 (0.0%) | 0 (0.0%) |
| No Fuel Used | 0 (0.0%) | 0 (0.0%) |
| Total | 279 (100.0%) | 77 (100.0%) |
Household Vehicle Usage in Blairs
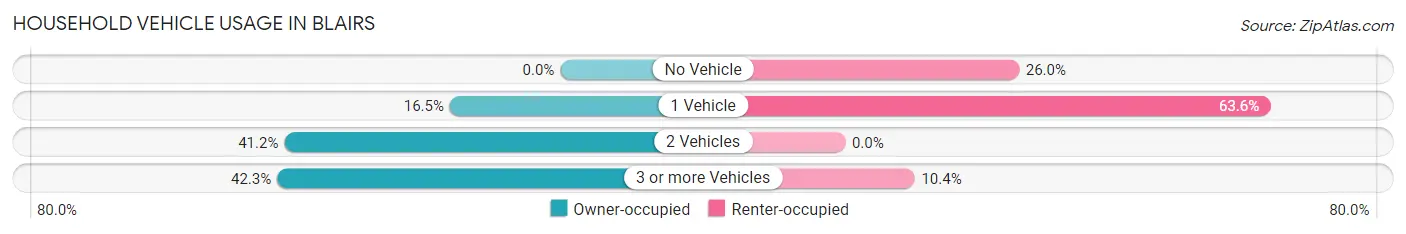
| Vehicles per Household | Owner-occupied | Renter-occupied |
| No Vehicle | 0 (0.0%) | 20 (26.0%) |
| 1 Vehicle | 46 (16.5%) | 49 (63.6%) |
| 2 Vehicles | 115 (41.2%) | 0 (0.0%) |
| 3 or more Vehicles | 118 (42.3%) | 8 (10.4%) |
| Total | 279 (100.0%) | 77 (100.0%) |
Real Estate & Mortgages in Blairs
Real Estate and Mortgage Overview in Blairs
| Characteristic | Without Mortgage | With Mortgage |
| Housing Units | 124 | 155 |
| Median Property Value | $122,600 | $186,500 |
| Median Household Income | $53,409 | $5 |
| Monthly Housing Costs | $346 | $0 |
| Real Estate Taxes | - | - |
Property Value by Mortgage Status in Blairs
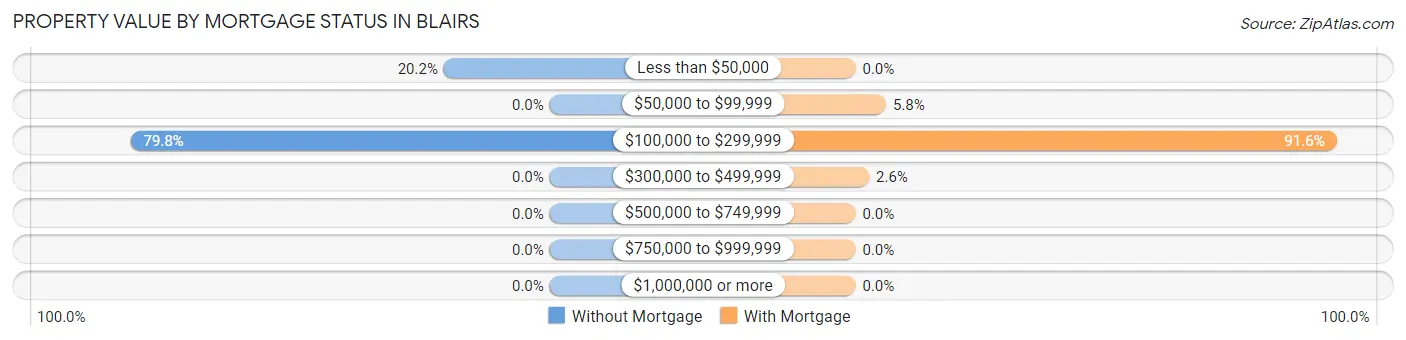
| Property Value | Without Mortgage | With Mortgage |
| Less than $50,000 | 25 (20.2%) | 0 (0.0%) |
| $50,000 to $99,999 | 0 (0.0%) | 9 (5.8%) |
| $100,000 to $299,999 | 99 (79.8%) | 142 (91.6%) |
| $300,000 to $499,999 | 0 (0.0%) | 4 (2.6%) |
| $500,000 to $749,999 | 0 (0.0%) | 0 (0.0%) |
| $750,000 to $999,999 | 0 (0.0%) | 0 (0.0%) |
| $1,000,000 or more | 0 (0.0%) | 0 (0.0%) |
| Total | 124 (100.0%) | 155 (100.0%) |
Household Income by Mortgage Status in Blairs
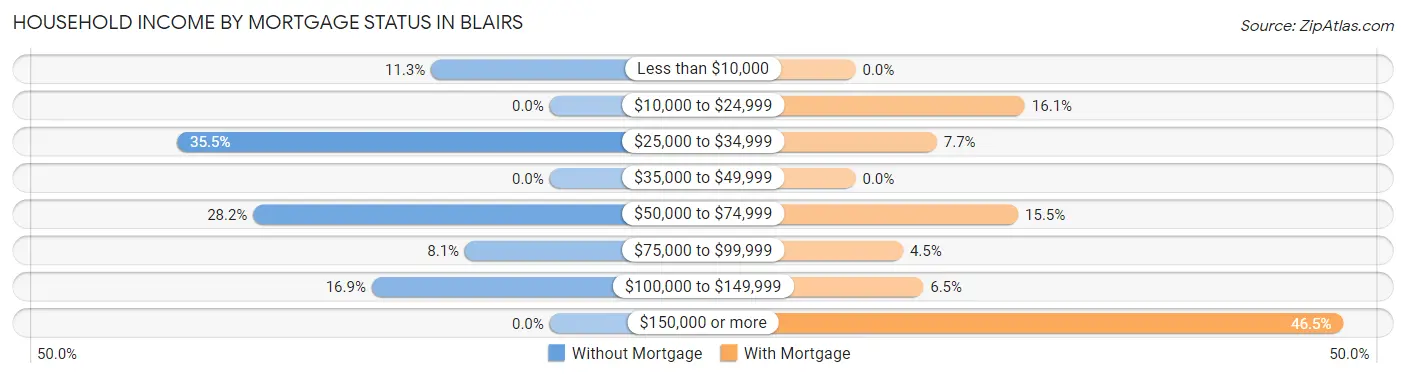
| Household Income | Without Mortgage | With Mortgage |
| Less than $10,000 | 14 (11.3%) | 0 (0.0%) |
| $10,000 to $24,999 | 0 (0.0%) | 25 (16.1%) |
| $25,000 to $34,999 | 44 (35.5%) | 12 (7.7%) |
| $35,000 to $49,999 | 0 (0.0%) | 0 (0.0%) |
| $50,000 to $74,999 | 35 (28.2%) | 24 (15.5%) |
| $75,000 to $99,999 | 10 (8.1%) | 7 (4.5%) |
| $100,000 to $149,999 | 21 (16.9%) | 10 (6.5%) |
| $150,000 or more | 0 (0.0%) | 72 (46.5%) |
| Total | 124 (100.0%) | 155 (100.0%) |
Property Value to Household Income Ratio in Blairs
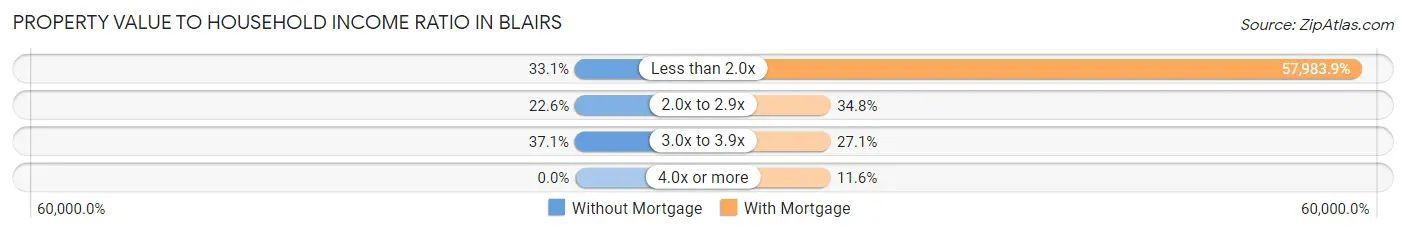
| Value-to-Income Ratio | Without Mortgage | With Mortgage |
| Less than 2.0x | 41 (33.1%) | 89,875 (57,983.9%) |
| 2.0x to 2.9x | 28 (22.6%) | 54 (34.8%) |
| 3.0x to 3.9x | 46 (37.1%) | 42 (27.1%) |
| 4.0x or more | 0 (0.0%) | 18 (11.6%) |
| Total | 124 (100.0%) | 155 (100.0%) |
Real Estate Taxes by Mortgage Status in Blairs
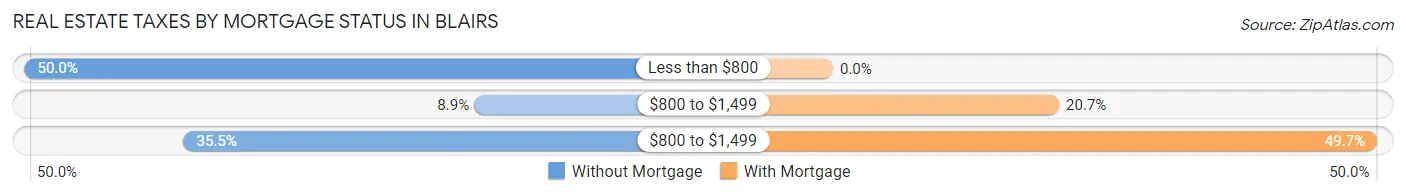
| Property Taxes | Without Mortgage | With Mortgage |
| Less than $800 | 62 (50.0%) | 0 (0.0%) |
| $800 to $1,499 | 11 (8.9%) | 32 (20.6%) |
| $800 to $1,499 | 44 (35.5%) | 77 (49.7%) |
| Total | 124 (100.0%) | 155 (100.0%) |
Health & Disability in Blairs
Health Insurance Coverage by Age in Blairs
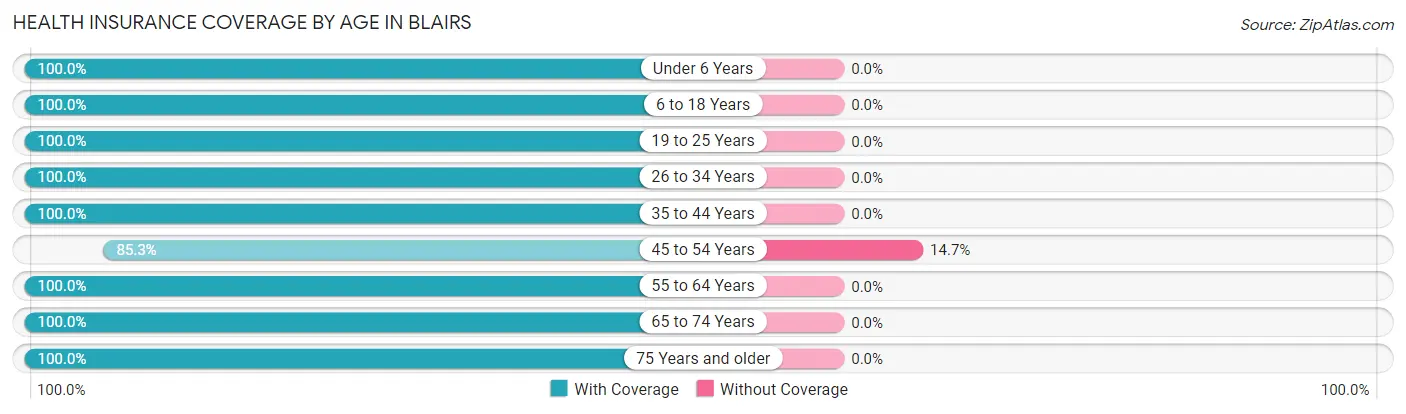
| Age Bracket | With Coverage | Without Coverage |
| Under 6 Years | 87 (100.0%) | 0 (0.0%) |
| 6 to 18 Years | 181 (100.0%) | 0 (0.0%) |
| 19 to 25 Years | 70 (100.0%) | 0 (0.0%) |
| 26 to 34 Years | 134 (100.0%) | 0 (0.0%) |
| 35 to 44 Years | 114 (100.0%) | 0 (0.0%) |
| 45 to 54 Years | 58 (85.3%) | 10 (14.7%) |
| 55 to 64 Years | 139 (100.0%) | 0 (0.0%) |
| 65 to 74 Years | 146 (100.0%) | 0 (0.0%) |
| 75 Years and older | 76 (100.0%) | 0 (0.0%) |
| Total | 1,005 (99.0%) | 10 (1.0%) |
Health Insurance Coverage by Citizenship Status in Blairs
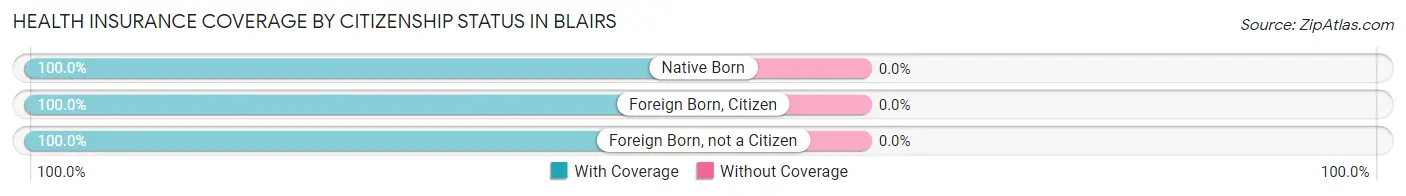
| Citizenship Status | With Coverage | Without Coverage |
| Native Born | 87 (100.0%) | 0 (0.0%) |
| Foreign Born, Citizen | 181 (100.0%) | 0 (0.0%) |
| Foreign Born, not a Citizen | 70 (100.0%) | 0 (0.0%) |
Health Insurance Coverage by Household Income in Blairs
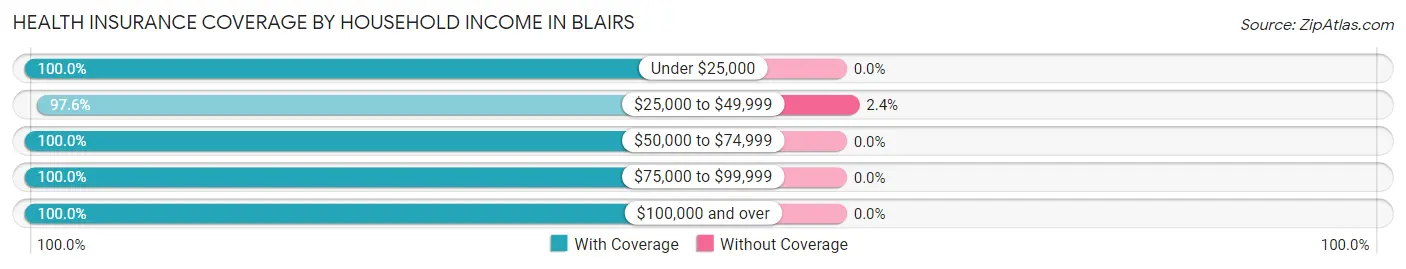
| Household Income | With Coverage | Without Coverage |
| Under $25,000 | 115 (100.0%) | 0 (0.0%) |
| $25,000 to $49,999 | 414 (97.6%) | 10 (2.4%) |
| $50,000 to $74,999 | 114 (100.0%) | 0 (0.0%) |
| $75,000 to $99,999 | 49 (100.0%) | 0 (0.0%) |
| $100,000 and over | 313 (100.0%) | 0 (0.0%) |
Public vs Private Health Insurance Coverage by Age in Blairs
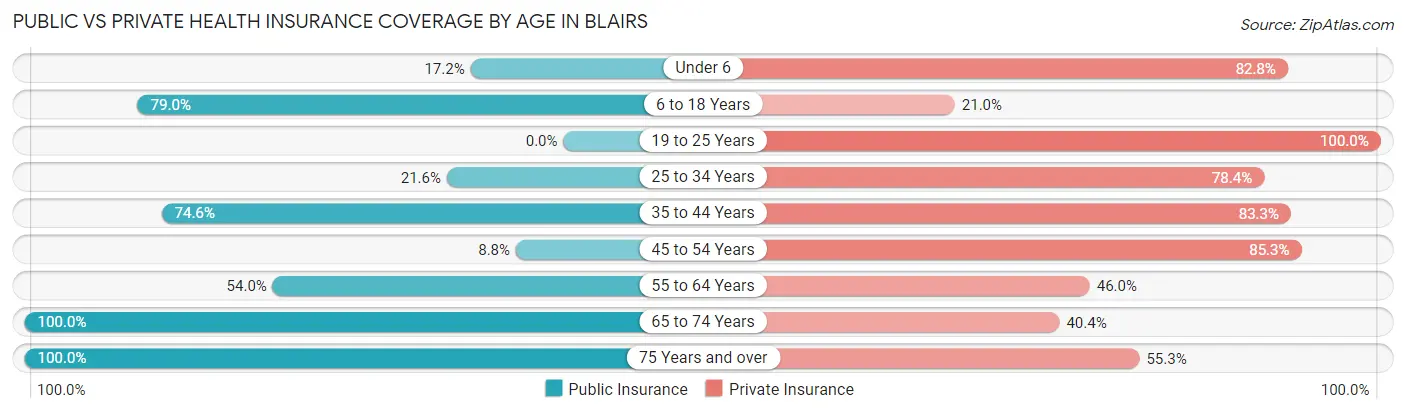
| Age Bracket | Public Insurance | Private Insurance |
| Under 6 | 15 (17.2%) | 72 (82.8%) |
| 6 to 18 Years | 143 (79.0%) | 38 (21.0%) |
| 19 to 25 Years | 0 (0.0%) | 70 (100.0%) |
| 25 to 34 Years | 29 (21.6%) | 105 (78.4%) |
| 35 to 44 Years | 85 (74.6%) | 95 (83.3%) |
| 45 to 54 Years | 6 (8.8%) | 58 (85.3%) |
| 55 to 64 Years | 75 (54.0%) | 64 (46.0%) |
| 65 to 74 Years | 146 (100.0%) | 59 (40.4%) |
| 75 Years and over | 76 (100.0%) | 42 (55.3%) |
| Total | 575 (56.7%) | 603 (59.4%) |
Disability Status by Sex by Age in Blairs
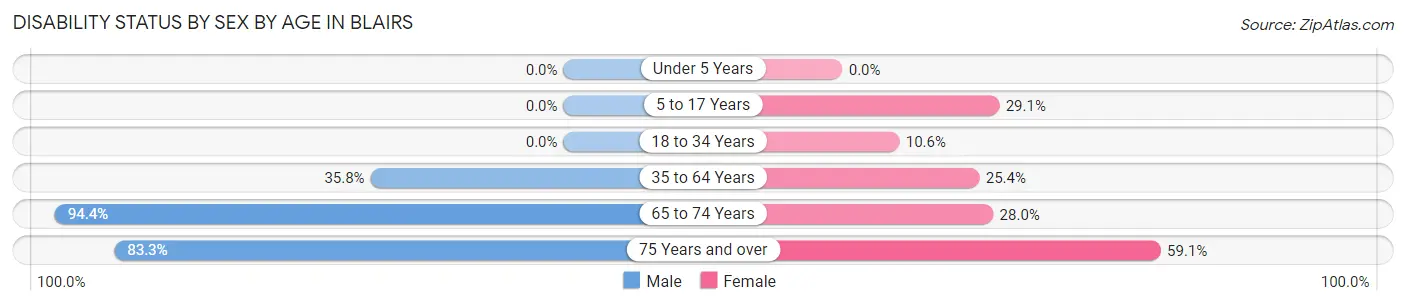
| Age Bracket | Male | Female |
| Under 5 Years | 0 (0.0%) | 0 (0.0%) |
| 5 to 17 Years | 0 (0.0%) | 30 (29.1%) |
| 18 to 34 Years | 0 (0.0%) | 11 (10.6%) |
| 35 to 64 Years | 53 (35.8%) | 44 (25.4%) |
| 65 to 74 Years | 67 (94.4%) | 21 (28.0%) |
| 75 Years and over | 45 (83.3%) | 13 (59.1%) |
Disability Class by Sex by Age in Blairs
Disability Class: Hearing Difficulty
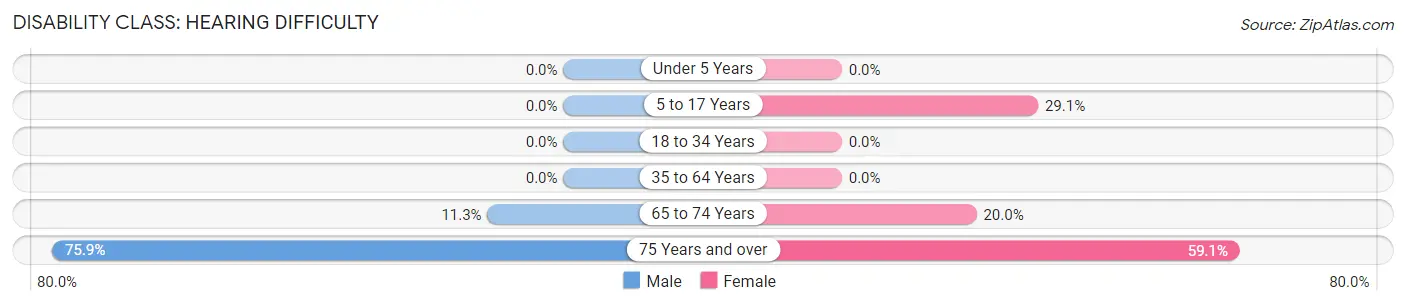
| Age Bracket | Male | Female |
| Under 5 Years | 0 (0.0%) | 0 (0.0%) |
| 5 to 17 Years | 0 (0.0%) | 30 (29.1%) |
| 18 to 34 Years | 0 (0.0%) | 0 (0.0%) |
| 35 to 64 Years | 0 (0.0%) | 0 (0.0%) |
| 65 to 74 Years | 8 (11.3%) | 15 (20.0%) |
| 75 Years and over | 41 (75.9%) | 13 (59.1%) |
Disability Class: Vision Difficulty
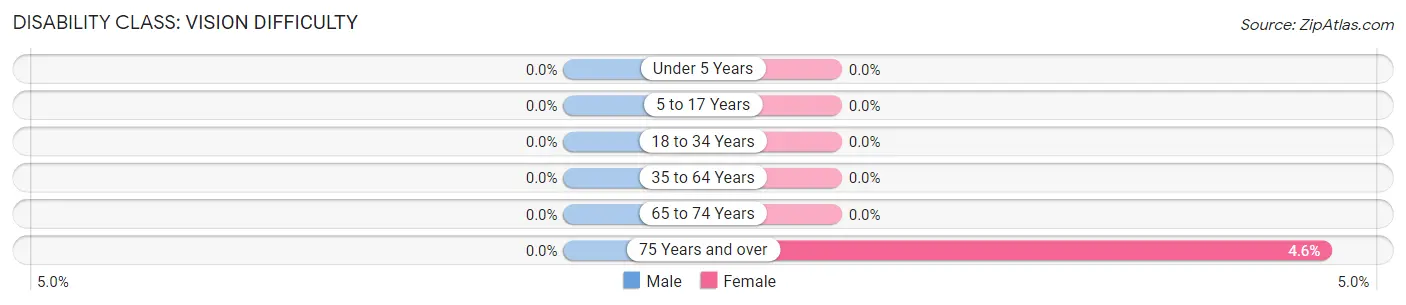
| Age Bracket | Male | Female |
| Under 5 Years | 0 (0.0%) | 0 (0.0%) |
| 5 to 17 Years | 0 (0.0%) | 0 (0.0%) |
| 18 to 34 Years | 0 (0.0%) | 0 (0.0%) |
| 35 to 64 Years | 0 (0.0%) | 0 (0.0%) |
| 65 to 74 Years | 0 (0.0%) | 0 (0.0%) |
| 75 Years and over | 0 (0.0%) | 1 (4.5%) |
Disability Class: Cognitive Difficulty
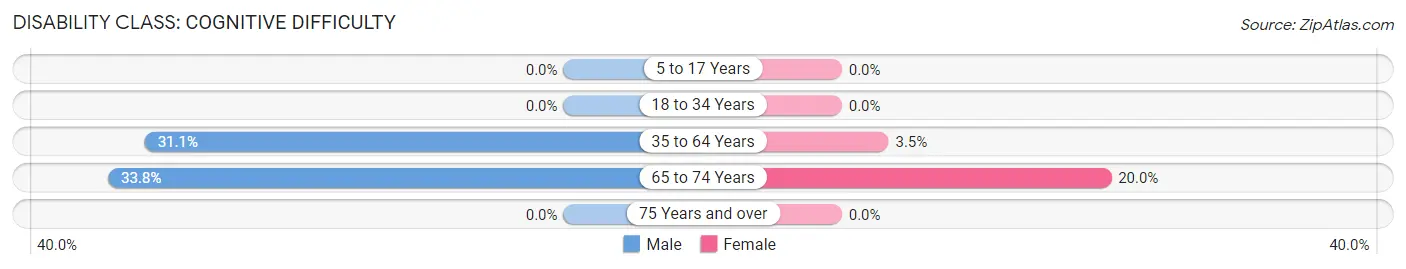
| Age Bracket | Male | Female |
| 5 to 17 Years | 0 (0.0%) | 0 (0.0%) |
| 18 to 34 Years | 0 (0.0%) | 0 (0.0%) |
| 35 to 64 Years | 46 (31.1%) | 6 (3.5%) |
| 65 to 74 Years | 24 (33.8%) | 15 (20.0%) |
| 75 Years and over | 0 (0.0%) | 0 (0.0%) |
Disability Class: Ambulatory Difficulty
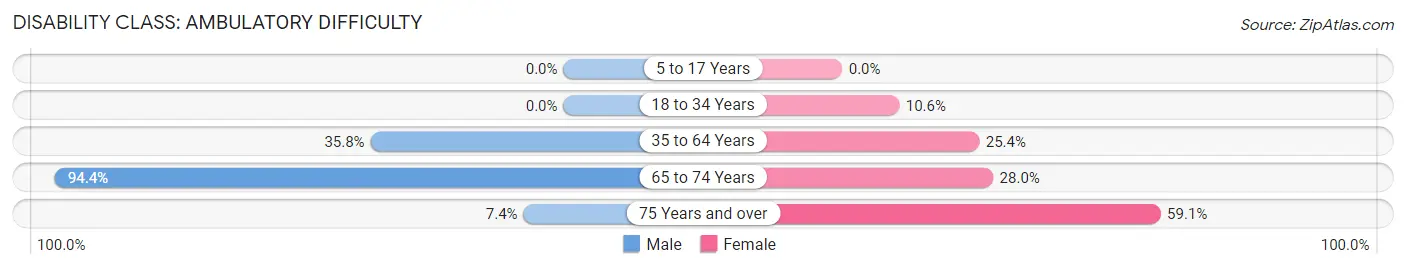
| Age Bracket | Male | Female |
| 5 to 17 Years | 0 (0.0%) | 0 (0.0%) |
| 18 to 34 Years | 0 (0.0%) | 11 (10.6%) |
| 35 to 64 Years | 53 (35.8%) | 44 (25.4%) |
| 65 to 74 Years | 67 (94.4%) | 21 (28.0%) |
| 75 Years and over | 4 (7.4%) | 13 (59.1%) |
Disability Class: Self-Care Difficulty
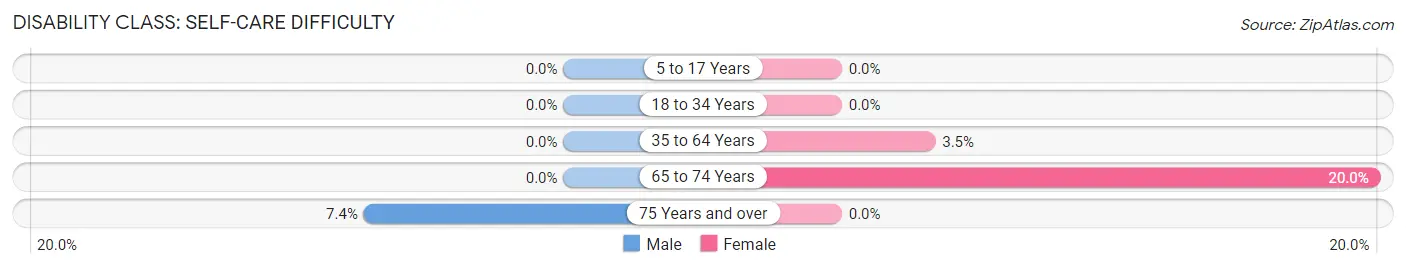
| Age Bracket | Male | Female |
| 5 to 17 Years | 0 (0.0%) | 0 (0.0%) |
| 18 to 34 Years | 0 (0.0%) | 0 (0.0%) |
| 35 to 64 Years | 0 (0.0%) | 6 (3.5%) |
| 65 to 74 Years | 0 (0.0%) | 15 (20.0%) |
| 75 Years and over | 4 (7.4%) | 0 (0.0%) |
Technology Access in Blairs
Computing Device Access in Blairs
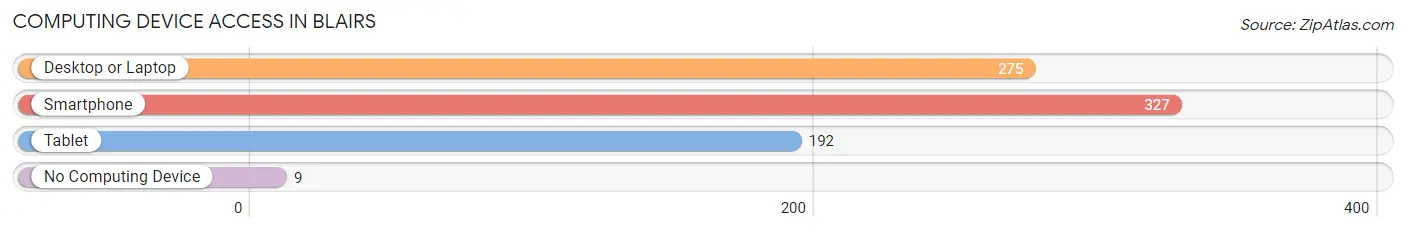
| Device Type | # Households | % Households |
| Desktop or Laptop | 275 | 77.2% |
| Smartphone | 327 | 91.8% |
| Tablet | 192 | 53.9% |
| No Computing Device | 9 | 2.5% |
| Total | 356 | 100.0% |
Internet Access in Blairs
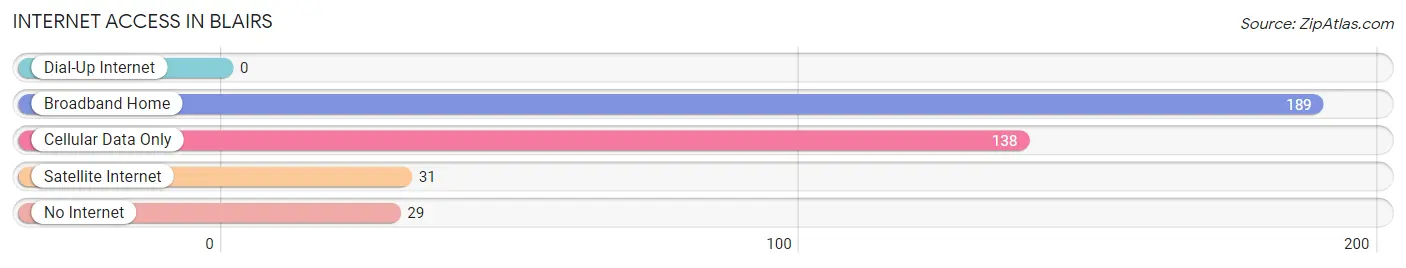
| Internet Type | # Households | % Households |
| Dial-Up Internet | 0 | 0.0% |
| Broadband Home | 189 | 53.1% |
| Cellular Data Only | 138 | 38.8% |
| Satellite Internet | 31 | 8.7% |
| No Internet | 29 | 8.2% |
| Total | 356 | 100.0% |
Blairs Summary
Blairs, Virginia is a small town located in the heart of Campbell County, Virginia. It is situated on the banks of the Staunton River, and is home to a population of approximately 1,000 people. The town is known for its rich history, beautiful scenery, and vibrant economy.
History
Blairs, Virginia was first settled in the late 1700s by a group of settlers from Scotland. The town was originally known as “Blair’s Station”, and was named after the family of William Blair, who was one of the original settlers. The town was officially incorporated in 1820, and has remained a small, rural community ever since.
Throughout its history, Blairs has been an important stop on the Staunton River. The town was a major hub for the transportation of goods and services, and was a popular destination for travelers. In the late 1800s, the town was home to a number of businesses, including a general store, a blacksmith, and a gristmill.
Geography
Blairs, Virginia is located in the heart of Campbell County, Virginia. The town is situated on the banks of the Staunton River, and is surrounded by rolling hills and lush forests. The town is located approximately 25 miles from Lynchburg, and is easily accessible by car or train.
The town is home to a number of parks and recreational areas, including the Blairs Recreation Area, which offers a variety of outdoor activities, such as fishing, camping, and hiking. The town is also home to a number of historic sites, including the Blairs Historic District, which is listed on the National Register of Historic Places.
Economy
Blairs, Virginia is home to a vibrant economy. The town is home to a number of businesses, including a grocery store, a hardware store, and a number of restaurants. The town is also home to a number of manufacturing companies, including a furniture factory and a textile mill.
The town is also home to a number of agricultural businesses, including a number of farms and orchards. The town is also home to a number of wineries, which produce a variety of wines.
Demographics
As of the 2010 census, Blairs, Virginia had a population of 1,000 people. The town is predominantly white, with a small African American population. The town is also home to a small Hispanic population. The median household income in the town is $45,000, and the median home value is $150,000.
Blairs, Virginia is a small town with a rich history, beautiful scenery, and a vibrant economy. The town is home to a number of businesses, parks, and historic sites, and is a popular destination for travelers. The town is also home to a diverse population, and is a great place to live and work.
Common Questions
What is Per Capita Income in Blairs?
Per Capita income in Blairs is $23,630.
What is the Median Family Income in Blairs?
Median Family Income in Blairs is $47,479.
What is the Median Household income in Blairs?
Median Household Income in Blairs is $46,750.
What is Income or Wage Gap in Blairs?
Income or Wage Gap in Blairs is 43.0%.
Women in Blairs earn 57.0 cents for every dollar earned by a man.
What is Inequality or Gini Index in Blairs?
Inequality or Gini Index in Blairs is 0.39.
What is the Total Population of Blairs?
Total Population of Blairs is 1,015.
What is the Total Male Population of Blairs?
Total Male Population of Blairs is 482.
What is the Total Female Population of Blairs?
Total Female Population of Blairs is 533.
What is the Ratio of Males per 100 Females in Blairs?
There are 90.43 Males per 100 Females in Blairs.
What is the Ratio of Females per 100 Males in Blairs?
There are 110.58 Females per 100 Males in Blairs.
What is the Median Population Age in Blairs?
Median Population Age in Blairs is 36.2 Years.
What is the Average Family Size in Blairs
Average Family Size in Blairs is 3.2 People.
What is the Average Household Size in Blairs
Average Household Size in Blairs is 2.9 People.
How Large is the Labor Force in Blairs?
There are 437 People in the Labor Forcein in Blairs.
What is the Percentage of People in the Labor Force in Blairs?
53.0% of People are in the Labor Force in Blairs.