Big Stone Gap, VA Map & Demographics
Big Stone Gap Map
Big Stone Gap Overview
$22,376
PER CAPITA INCOME
$70,370
AVG FAMILY INCOME
$52,663
AVG HOUSEHOLD INCOME
9.5%
WAGE / INCOME GAP [ % ]
90.5¢/ $1
WAGE / INCOME GAP [ $ ]
0.37
INEQUALITY / GINI INDEX
5,221
TOTAL POPULATION
3,093
MALE POPULATION
2,128
FEMALE POPULATION
145.35
MALES / 100 FEMALES
68.80
FEMALES / 100 MALES
38.3
MEDIAN AGE
2.9
AVG FAMILY SIZE
2.4
AVG HOUSEHOLD SIZE
1,922
LABOR FORCE [ PEOPLE ]
45.5%
PERCENT IN LABOR FORCE
11.7%
UNEMPLOYMENT RATE
Big Stone Gap Zip Codes
Big Stone Gap Area Codes
Income in Big Stone Gap
Income Overview in Big Stone Gap
Per Capita Income in Big Stone Gap is $22,376, while median incomes of families and households are $70,370 and $52,663 respectively.
| Characteristic | Number | Measure |
| Per Capita Income | 5,221 | $22,376 |
| Median Family Income | 1,110 | $70,370 |
| Mean Family Income | 1,110 | $75,522 |
| Median Household Income | 1,623 | $52,663 |
| Mean Household Income | 1,623 | $68,940 |
| Income Deficit | 1,110 | $0 |
| Wage / Income Gap (%) | 5,221 | 9.45% |
| Wage / Income Gap ($) | 5,221 | 90.55¢ per $1 |
| Gini / Inequality Index | 5,221 | 0.37 |
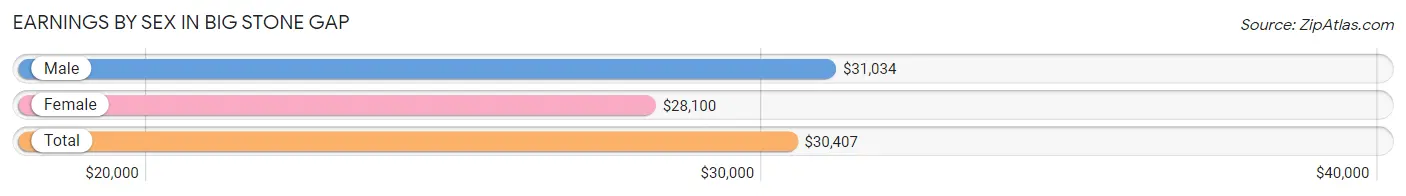
Earnings by Sex in Big Stone Gap
Average Earnings in Big Stone Gap are $30,407, $31,034 for men and $28,100 for women, a difference of 9.5%.
| Sex | Number | Average Earnings |
| Male | 1,363 (57.8%) | $31,034 |
| Female | 994 (42.2%) | $28,100 |
| Total | 2,357 (100.0%) | $30,407 |
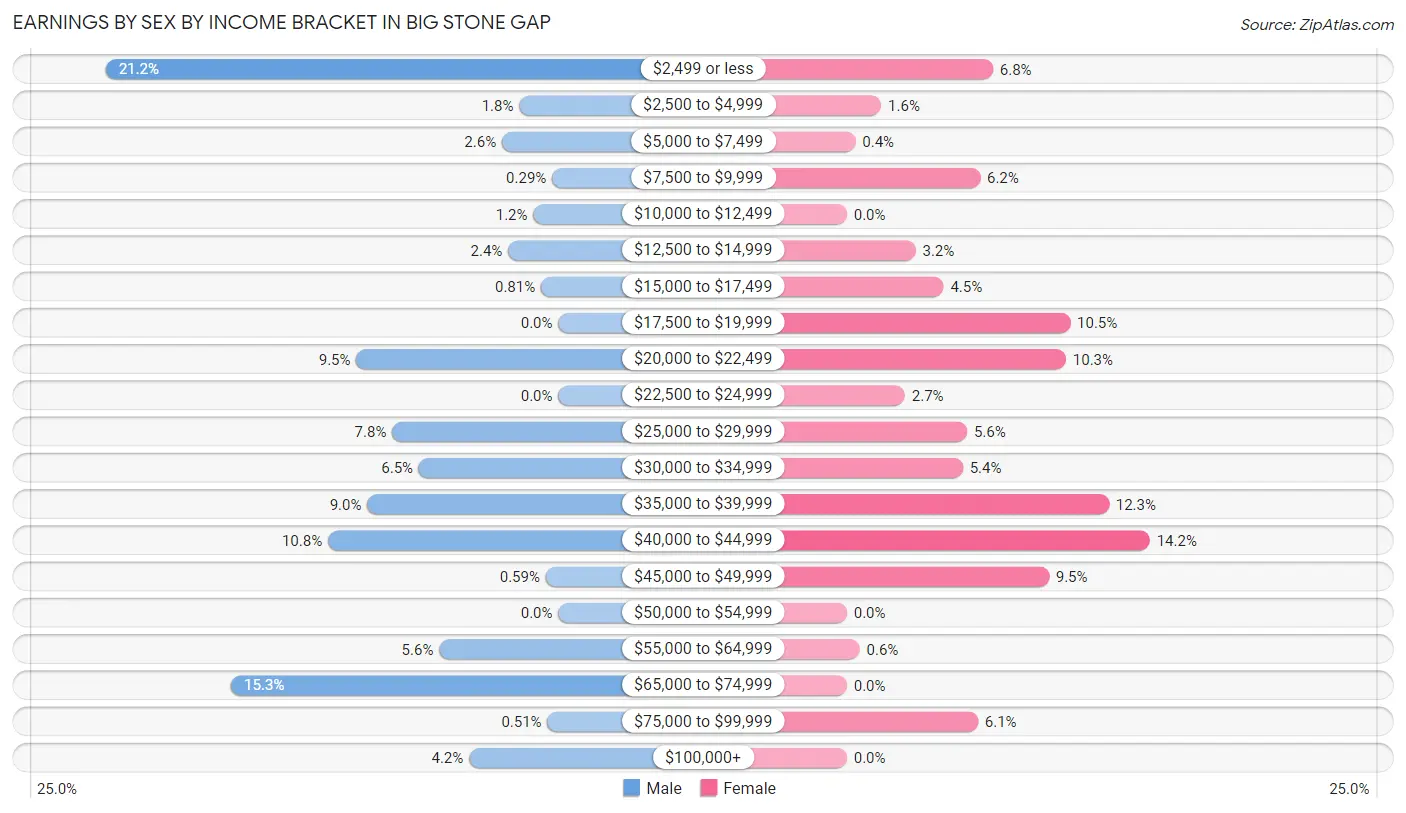
Earnings by Sex by Income Bracket in Big Stone Gap
The most common earnings brackets in Big Stone Gap are $2,499 or less for men (289 | 21.2%) and $40,000 to $44,999 for women (141 | 14.2%).
| Income | Male | Female |
| $2,499 or less | 289 (21.2%) | 68 (6.8%) |
| $2,500 to $4,999 | 25 (1.8%) | 16 (1.6%) |
| $5,000 to $7,499 | 36 (2.6%) | 4 (0.4%) |
| $7,500 to $9,999 | 4 (0.3%) | 62 (6.2%) |
| $10,000 to $12,499 | 16 (1.2%) | 0 (0.0%) |
| $12,500 to $14,999 | 32 (2.4%) | 32 (3.2%) |
| $15,000 to $17,499 | 11 (0.8%) | 45 (4.5%) |
| $17,500 to $19,999 | 0 (0.0%) | 104 (10.5%) |
| $20,000 to $22,499 | 129 (9.5%) | 102 (10.3%) |
| $22,500 to $24,999 | 0 (0.0%) | 27 (2.7%) |
| $25,000 to $29,999 | 106 (7.8%) | 56 (5.6%) |
| $30,000 to $34,999 | 89 (6.5%) | 54 (5.4%) |
| $35,000 to $39,999 | 122 (8.9%) | 122 (12.3%) |
| $40,000 to $44,999 | 147 (10.8%) | 141 (14.2%) |
| $45,000 to $49,999 | 8 (0.6%) | 94 (9.5%) |
| $50,000 to $54,999 | 0 (0.0%) | 0 (0.0%) |
| $55,000 to $64,999 | 76 (5.6%) | 6 (0.6%) |
| $65,000 to $74,999 | 209 (15.3%) | 0 (0.0%) |
| $75,000 to $99,999 | 7 (0.5%) | 61 (6.1%) |
| $100,000+ | 57 (4.2%) | 0 (0.0%) |
| Total | 1,363 (100.0%) | 994 (100.0%) |
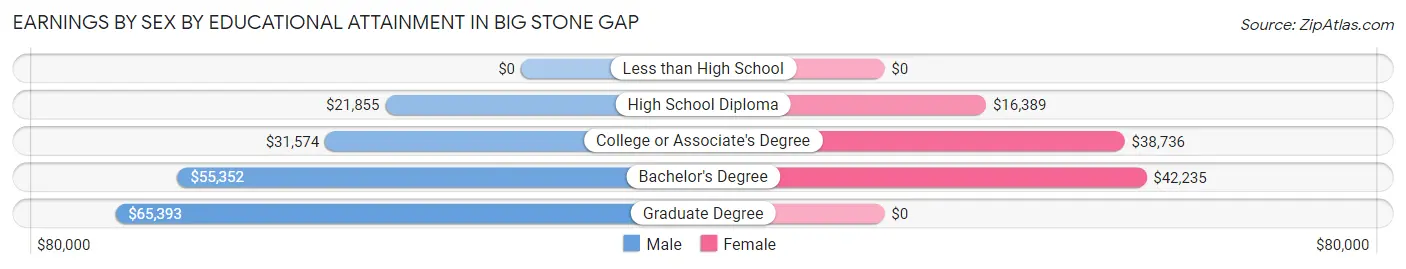
Earnings by Sex by Educational Attainment in Big Stone Gap
Average earnings in Big Stone Gap are $30,988 for men and $38,402 for women, a difference of 19.3%. Men with an educational attainment of graduate degree enjoy the highest average annual earnings of $65,393, while those with high school diploma education earn the least with $21,855. Women with an educational attainment of bachelor's degree earn the most with the average annual earnings of $42,235, while those with high school diploma education have the smallest earnings of $16,389.
| Educational Attainment | Male Income | Female Income |
| Less than High School | - | - |
| High School Diploma | $21,855 | $16,389 |
| College or Associate's Degree | $31,574 | $38,736 |
| Bachelor's Degree | $55,352 | $42,235 |
| Graduate Degree | $65,393 | $0 |
| Total | $30,988 | $38,402 |
Family Income in Big Stone Gap
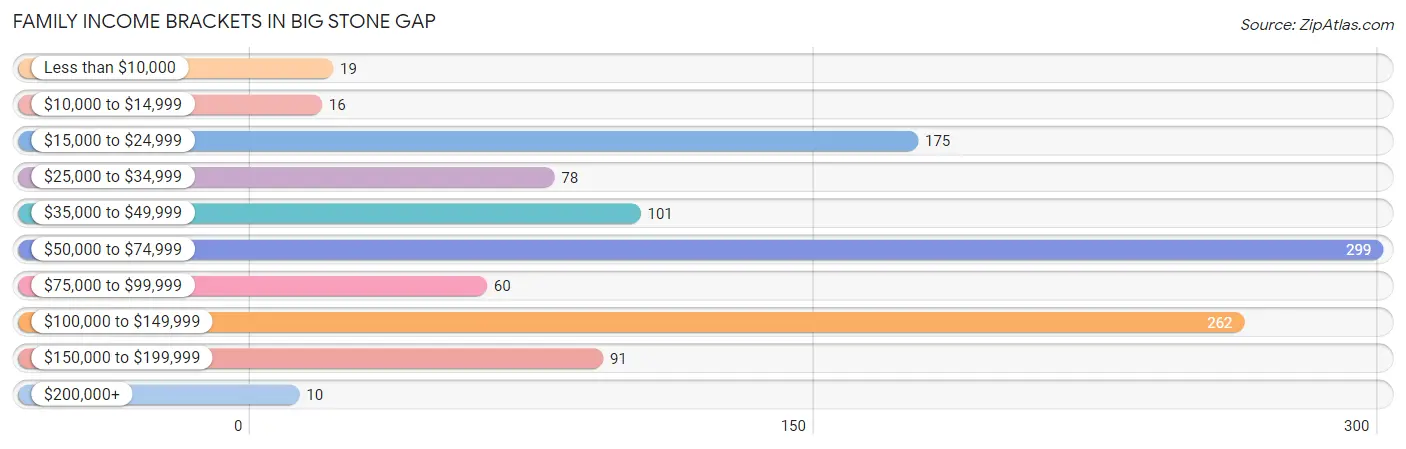
Family Income Brackets in Big Stone Gap
According to the Big Stone Gap family income data, there are 299 families falling into the $50,000 to $74,999 income range, which is the most common income bracket and makes up 26.9% of all families. Conversely, the $200,000+ income bracket is the least frequent group with only 10 families (0.9%) belonging to this category.
| Income Bracket | # Families | % Families |
| Less than $10,000 | 19 | 1.7% |
| $10,000 to $14,999 | 16 | 1.4% |
| $15,000 to $24,999 | 175 | 15.8% |
| $25,000 to $34,999 | 78 | 7.0% |
| $35,000 to $49,999 | 101 | 9.1% |
| $50,000 to $74,999 | 299 | 26.9% |
| $75,000 to $99,999 | 60 | 5.4% |
| $100,000 to $149,999 | 262 | 23.6% |
| $150,000 to $199,999 | 91 | 8.2% |
| $200,000+ | 10 | 0.9% |
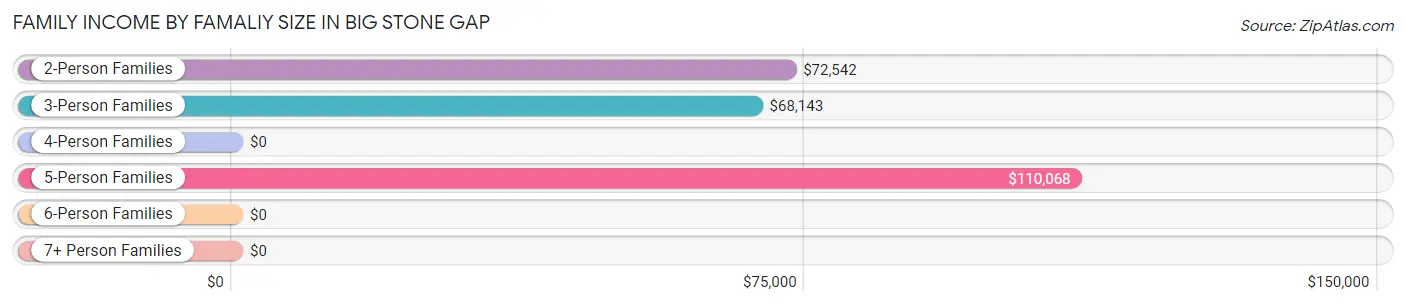
Family Income by Famaliy Size in Big Stone Gap
5-person families (144 | 13.0%) account for the highest median family income in Big Stone Gap with $110,068 per family, while 2-person families (559 | 50.4%) have the highest median income of $36,271 per family member.
| Income Bracket | # Families | Median Income |
| 2-Person Families | 559 (50.4%) | $72,542 |
| 3-Person Families | 236 (21.3%) | $68,143 |
| 4-Person Families | 157 (14.1%) | $0 |
| 5-Person Families | 144 (13.0%) | $110,068 |
| 6-Person Families | 0 (0.0%) | $0 |
| 7+ Person Families | 14 (1.3%) | $0 |
| Total | 1,110 (100.0%) | $70,370 |
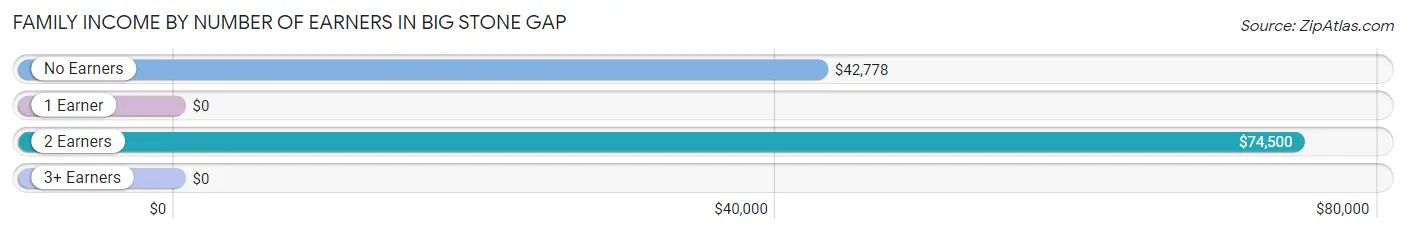
Family Income by Number of Earners in Big Stone Gap
| Number of Earners | # Families | Median Income |
| No Earners | 200 (18.0%) | $42,778 |
| 1 Earner | 354 (31.9%) | $0 |
| 2 Earners | 520 (46.9%) | $74,500 |
| 3+ Earners | 36 (3.2%) | $0 |
| Total | 1,110 (100.0%) | $70,370 |
Household Income in Big Stone Gap
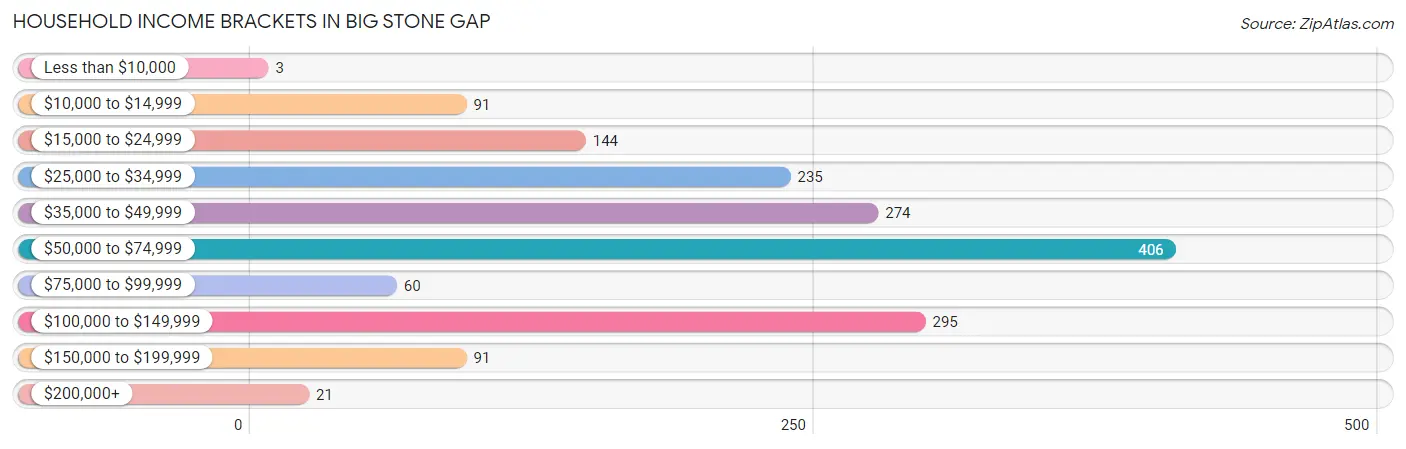
Household Income Brackets in Big Stone Gap
With 406 households falling in the category, the $50,000 to $74,999 income range is the most frequent in Big Stone Gap, accounting for 25.0% of all households. In contrast, only 3 households (0.2%) fall into the less than $10,000 income bracket, making it the least populous group.
| Income Bracket | # Households | % Households |
| Less than $10,000 | 3 | 0.2% |
| $10,000 to $14,999 | 91 | 5.6% |
| $15,000 to $24,999 | 144 | 8.9% |
| $25,000 to $34,999 | 235 | 14.5% |
| $35,000 to $49,999 | 274 | 16.9% |
| $50,000 to $74,999 | 406 | 25.0% |
| $75,000 to $99,999 | 60 | 3.7% |
| $100,000 to $149,999 | 295 | 18.2% |
| $150,000 to $199,999 | 91 | 5.6% |
| $200,000+ | 21 | 1.3% |
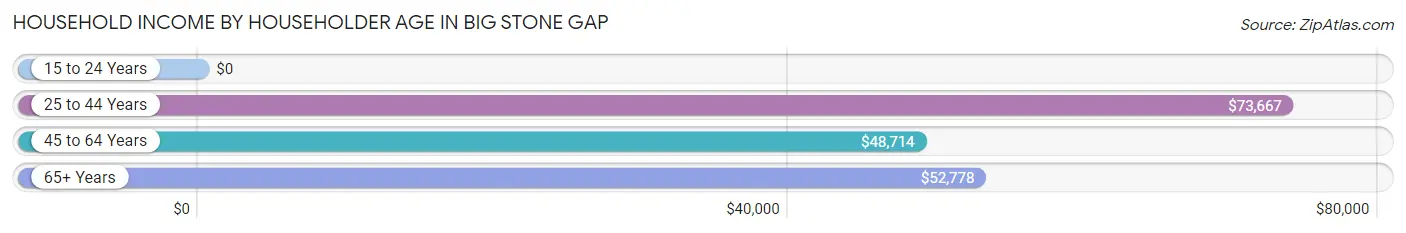
Household Income by Householder Age in Big Stone Gap
The median household income in Big Stone Gap is $52,663, with the highest median household income of $73,667 found in the 25 to 44 years age bracket for the primary householder. A total of 496 households (30.6%) fall into this category. Meanwhile, the 15 to 24 years age bracket for the primary householder has the lowest median household income of $0, with 181 households (11.2%) in this group.
| Income Bracket | # Households | Median Income |
| 15 to 24 Years | 181 (11.2%) | $0 |
| 25 to 44 Years | 496 (30.6%) | $73,667 |
| 45 to 64 Years | 546 (33.6%) | $48,714 |
| 65+ Years | 400 (24.6%) | $52,778 |
| Total | 1,623 (100.0%) | $52,663 |
Poverty in Big Stone Gap
Income Below Poverty by Sex and Age in Big Stone Gap
With 14.4% poverty level for males and 18.3% for females among the residents of Big Stone Gap, 25 to 34 year old males and under 5 year old females are the most vulnerable to poverty, with 131 males (52.4%) and 52 females (62.6%) in their respective age groups living below the poverty level.
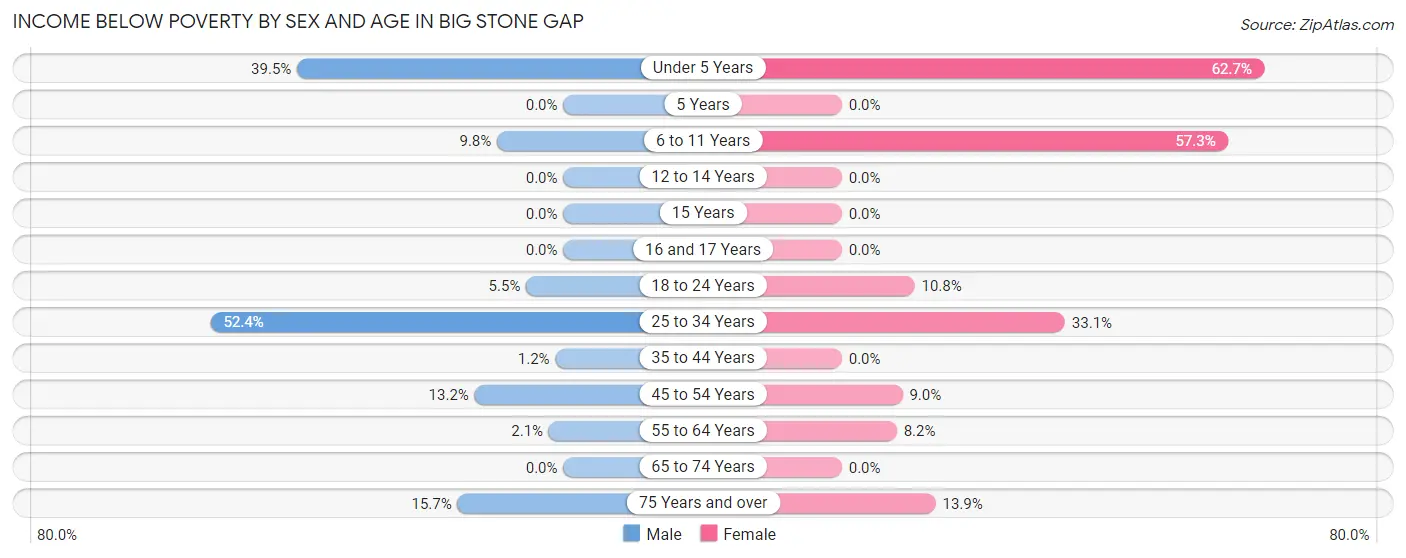
| Age Bracket | Male | Female |
| Under 5 Years | 68 (39.5%) | 52 (62.6%) |
| 5 Years | 0 (0.0%) | 0 (0.0%) |
| 6 to 11 Years | 12 (9.8%) | 181 (57.3%) |
| 12 to 14 Years | 0 (0.0%) | 0 (0.0%) |
| 15 Years | 0 (0.0%) | 0 (0.0%) |
| 16 and 17 Years | 0 (0.0%) | 0 (0.0%) |
| 18 to 24 Years | 7 (5.5%) | 23 (10.8%) |
| 25 to 34 Years | 131 (52.4%) | 55 (33.1%) |
| 35 to 44 Years | 4 (1.2%) | 0 (0.0%) |
| 45 to 54 Years | 37 (13.2%) | 20 (9.0%) |
| 55 to 64 Years | 3 (2.1%) | 24 (8.2%) |
| 65 to 74 Years | 0 (0.0%) | 0 (0.0%) |
| 75 Years and over | 11 (15.7%) | 11 (13.9%) |
| Total | 273 (14.4%) | 366 (18.3%) |
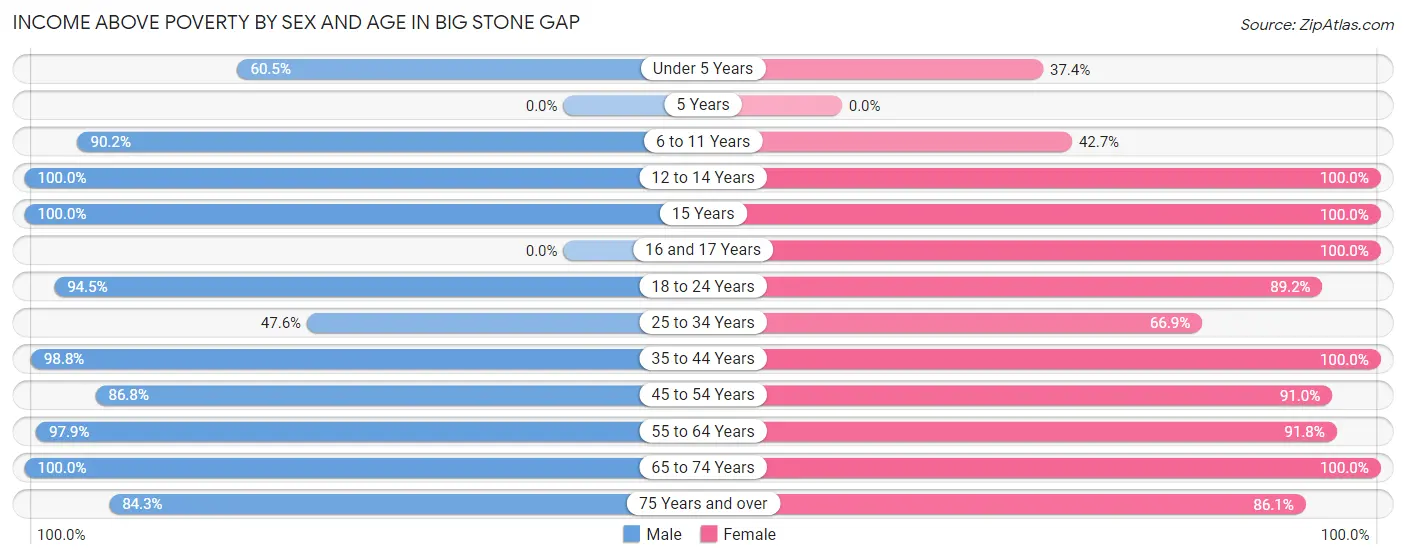
Income Above Poverty by Sex and Age in Big Stone Gap
According to the poverty statistics in Big Stone Gap, males aged 12 to 14 years and females aged 12 to 14 years are the age groups that are most secure financially, with 100.0% of males and 100.0% of females in these age groups living above the poverty line.
| Age Bracket | Male | Female |
| Under 5 Years | 104 (60.5%) | 31 (37.3%) |
| 5 Years | 0 (0.0%) | 0 (0.0%) |
| 6 to 11 Years | 110 (90.2%) | 135 (42.7%) |
| 12 to 14 Years | 76 (100.0%) | 76 (100.0%) |
| 15 Years | 94 (100.0%) | 58 (100.0%) |
| 16 and 17 Years | 0 (0.0%) | 56 (100.0%) |
| 18 to 24 Years | 120 (94.5%) | 190 (89.2%) |
| 25 to 34 Years | 119 (47.6%) | 111 (66.9%) |
| 35 to 44 Years | 334 (98.8%) | 243 (100.0%) |
| 45 to 54 Years | 244 (86.8%) | 202 (91.0%) |
| 55 to 64 Years | 137 (97.9%) | 270 (91.8%) |
| 65 to 74 Years | 227 (100.0%) | 189 (100.0%) |
| 75 Years and over | 59 (84.3%) | 68 (86.1%) |
| Total | 1,624 (85.6%) | 1,629 (81.7%) |
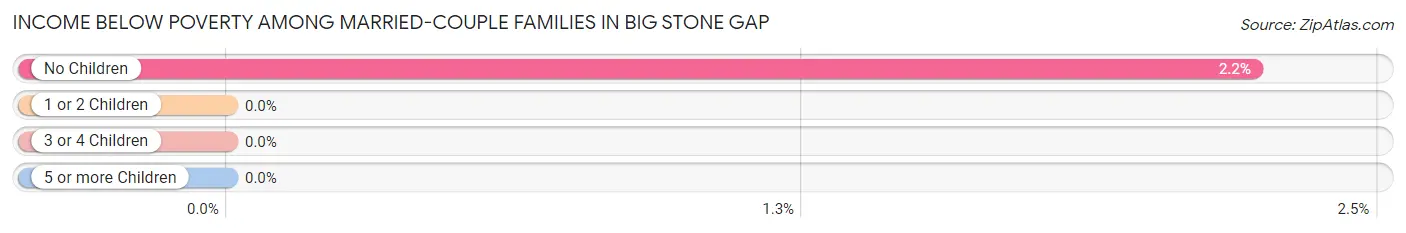
Income Below Poverty Among Married-Couple Families in Big Stone Gap
The poverty statistics for married-couple families in Big Stone Gap show that 1.4% or 11 of the total 770 families live below the poverty line. Families with no children have the highest poverty rate of 2.2%, comprising of 11 families. On the other hand, families with 1 or 2 children have the lowest poverty rate of 0.0%, which includes 0 families.
| Children | Above Poverty | Below Poverty |
| No Children | 482 (97.8%) | 11 (2.2%) |
| 1 or 2 Children | 171 (100.0%) | 0 (0.0%) |
| 3 or 4 Children | 92 (100.0%) | 0 (0.0%) |
| 5 or more Children | 14 (100.0%) | 0 (0.0%) |
| Total | 759 (98.6%) | 11 (1.4%) |
Income Below Poverty Among Single-Parent Households in Big Stone Gap
According to the poverty data in Big Stone Gap, 59.1% or 75 single-father households and 14.1% or 30 single-mother households are living below the poverty line. Among single-father households, those with 3 or 4 children have the highest poverty rate, with 75 households (100.0%) experiencing poverty. Likewise, among single-mother households, those with 3 or 4 children have the highest poverty rate, with 20 households (60.6%) falling below the poverty line.
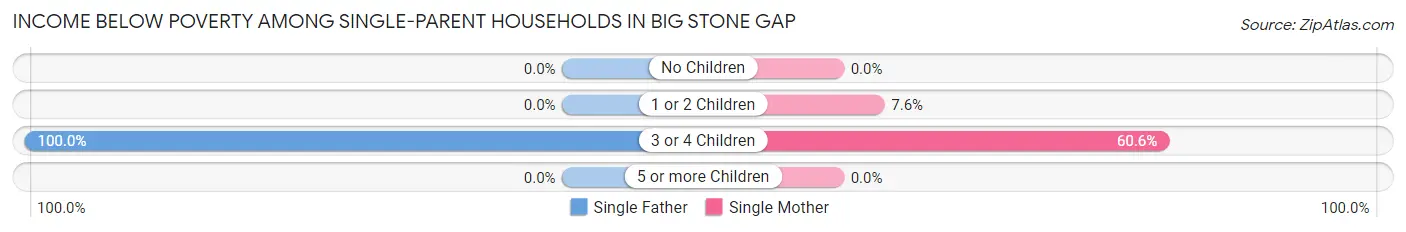
| Children | Single Father | Single Mother |
| No Children | 0 (0.0%) | 0 (0.0%) |
| 1 or 2 Children | 0 (0.0%) | 10 (7.6%) |
| 3 or 4 Children | 75 (100.0%) | 20 (60.6%) |
| 5 or more Children | 0 (0.0%) | 0 (0.0%) |
| Total | 75 (59.1%) | 30 (14.1%) |
Income Below Poverty Among Married-Couple vs Single-Parent Households in Big Stone Gap
The poverty data for Big Stone Gap shows that 11 of the married-couple family households (1.4%) and 105 of the single-parent households (30.9%) are living below the poverty level. Within the married-couple family households, those with no children have the highest poverty rate, with 11 households (2.2%) falling below the poverty line. Among the single-parent households, those with 3 or 4 children have the highest poverty rate, with 95 household (88.0%) living below poverty.
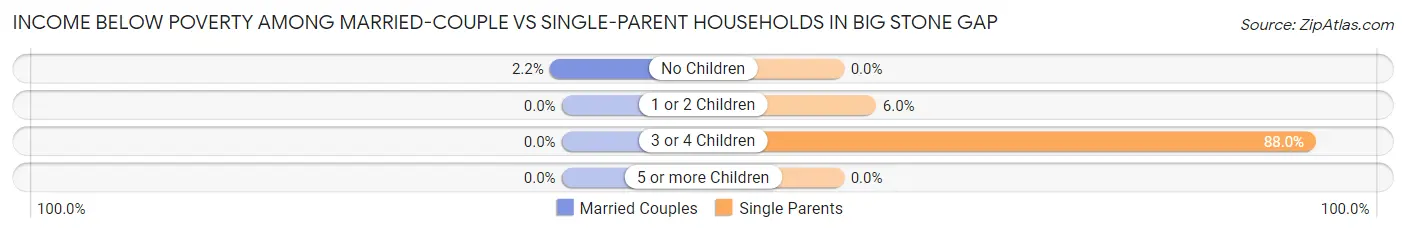
| Children | Married-Couple Families | Single-Parent Households |
| No Children | 11 (2.2%) | 0 (0.0%) |
| 1 or 2 Children | 0 (0.0%) | 10 (6.0%) |
| 3 or 4 Children | 0 (0.0%) | 95 (88.0%) |
| 5 or more Children | 0 (0.0%) | 0 (0.0%) |
| Total | 11 (1.4%) | 105 (30.9%) |
Race in Big Stone Gap
The most populous races in Big Stone Gap are White / Caucasian (4,055 | 77.7%), Black / African American (833 | 16.0%), and Two or more Races (157 | 3.0%).
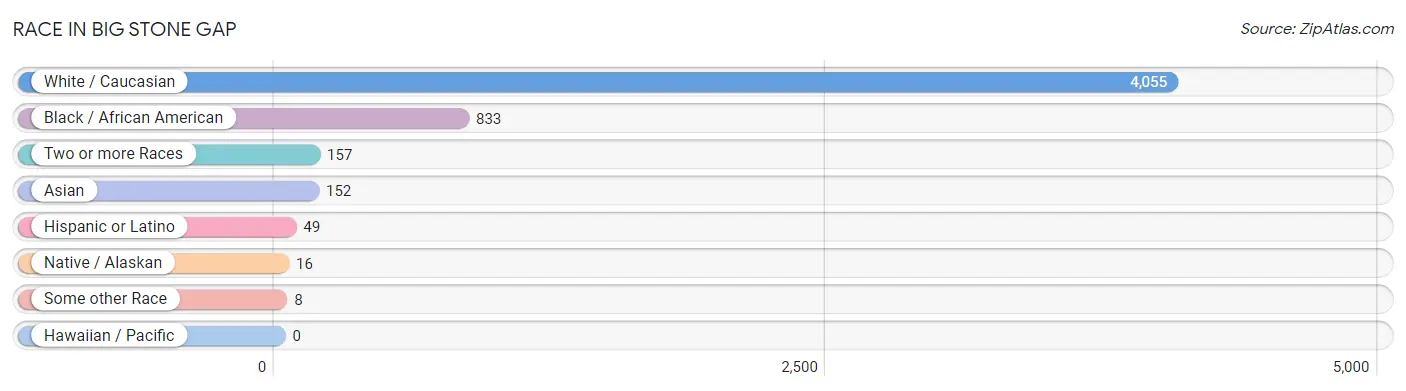
| Race | # Population | % Population |
| Asian | 152 | 2.9% |
| Black / African American | 833 | 16.0% |
| Hawaiian / Pacific | 0 | 0.0% |
| Hispanic or Latino | 49 | 0.9% |
| Native / Alaskan | 16 | 0.3% |
| White / Caucasian | 4,055 | 77.7% |
| Two or more Races | 157 | 3.0% |
| Some other Race | 8 | 0.2% |
| Total | 5,221 | 100.0% |
Ancestry in Big Stone Gap
The most populous ancestries reported in Big Stone Gap are American (1,139 | 21.8%), English (404 | 7.7%), Italian (404 | 7.7%), Irish (363 | 7.0%), and German (316 | 6.0%), together accounting for 50.3% of all Big Stone Gap residents.
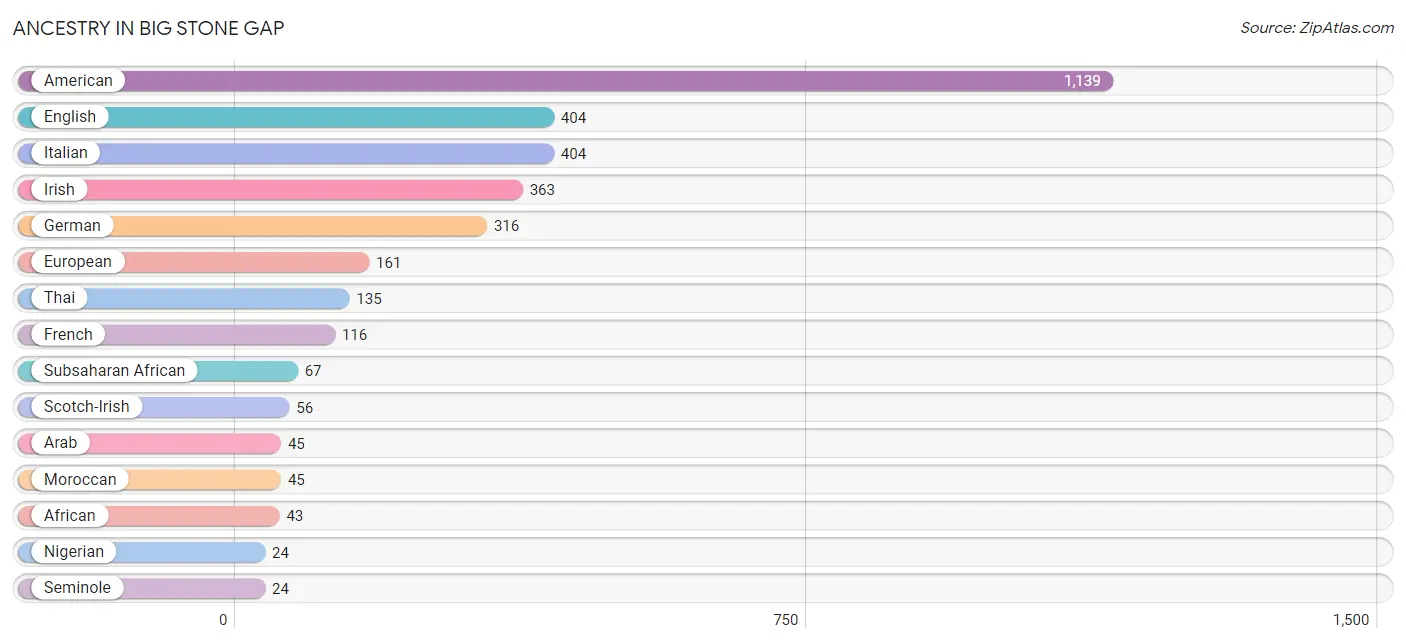
| Ancestry | # Population | % Population |
| African | 43 | 0.8% |
| American | 1,139 | 21.8% |
| Arab | 45 | 0.9% |
| Austrian | 12 | 0.2% |
| British | 13 | 0.3% |
| British West Indian | 4 | 0.1% |
| Cherokee | 4 | 0.1% |
| Dominican | 3 | 0.1% |
| Dutch | 3 | 0.1% |
| English | 404 | 7.7% |
| European | 161 | 3.1% |
| Finnish | 4 | 0.1% |
| French | 116 | 2.2% |
| German | 316 | 6.0% |
| Indian (Asian) | 5 | 0.1% |
| Irish | 363 | 7.0% |
| Italian | 404 | 7.7% |
| Jamaican | 8 | 0.2% |
| Lithuanian | 11 | 0.2% |
| Mexican | 4 | 0.1% |
| Moroccan | 45 | 0.9% |
| Nigerian | 24 | 0.5% |
| Norwegian | 15 | 0.3% |
| Polish | 4 | 0.1% |
| Puerto Rican | 16 | 0.3% |
| Scotch-Irish | 56 | 1.1% |
| Scottish | 21 | 0.4% |
| Seminole | 24 | 0.5% |
| Sioux | 12 | 0.2% |
| Spaniard | 3 | 0.1% |
| Sri Lankan | 4 | 0.1% |
| Subsaharan African | 67 | 1.3% |
| Swedish | 4 | 0.1% |
| Thai | 135 | 2.6% |
| U.S. Virgin Islander | 12 | 0.2% | View All 35 Rows |
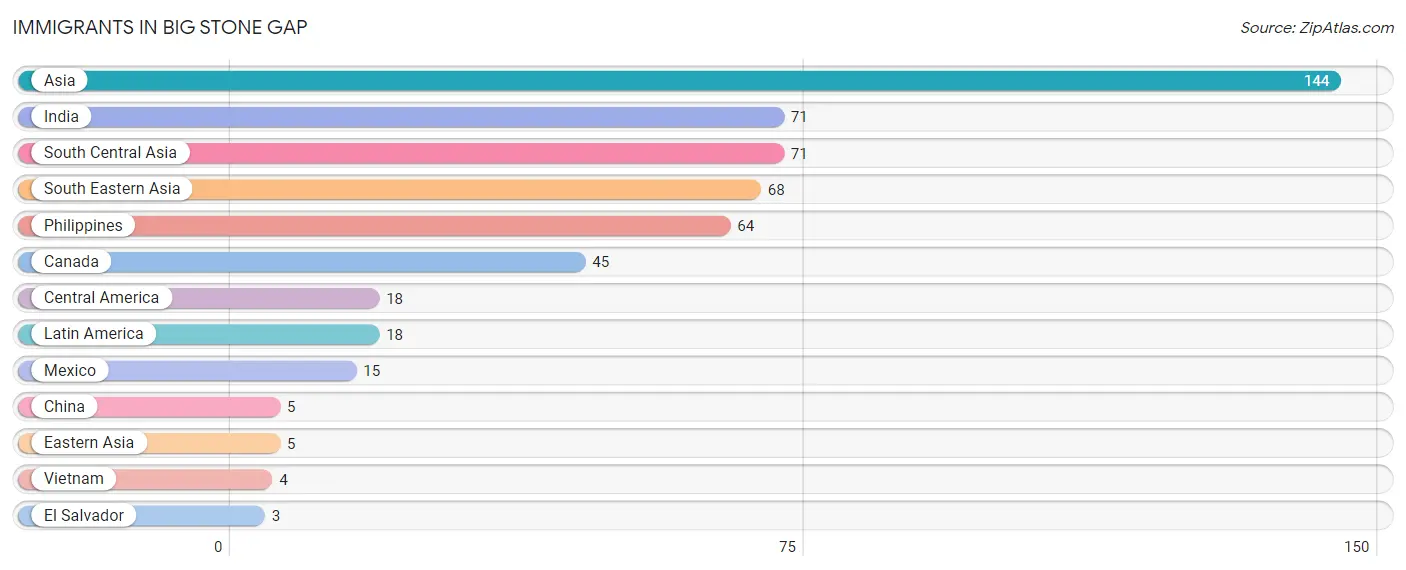
Immigrants in Big Stone Gap
The most numerous immigrant groups reported in Big Stone Gap came from Asia (144 | 2.8%), India (71 | 1.4%), South Central Asia (71 | 1.4%), South Eastern Asia (68 | 1.3%), and Philippines (64 | 1.2%), together accounting for 8.0% of all Big Stone Gap residents.
| Immigration Origin | # Population | % Population |
| Asia | 144 | 2.8% |
| Canada | 45 | 0.9% |
| Central America | 18 | 0.3% |
| China | 5 | 0.1% |
| Eastern Asia | 5 | 0.1% |
| El Salvador | 3 | 0.1% |
| India | 71 | 1.4% |
| Latin America | 18 | 0.3% |
| Mexico | 15 | 0.3% |
| Philippines | 64 | 1.2% |
| South Central Asia | 71 | 1.4% |
| South Eastern Asia | 68 | 1.3% |
| Vietnam | 4 | 0.1% | View All 13 Rows |
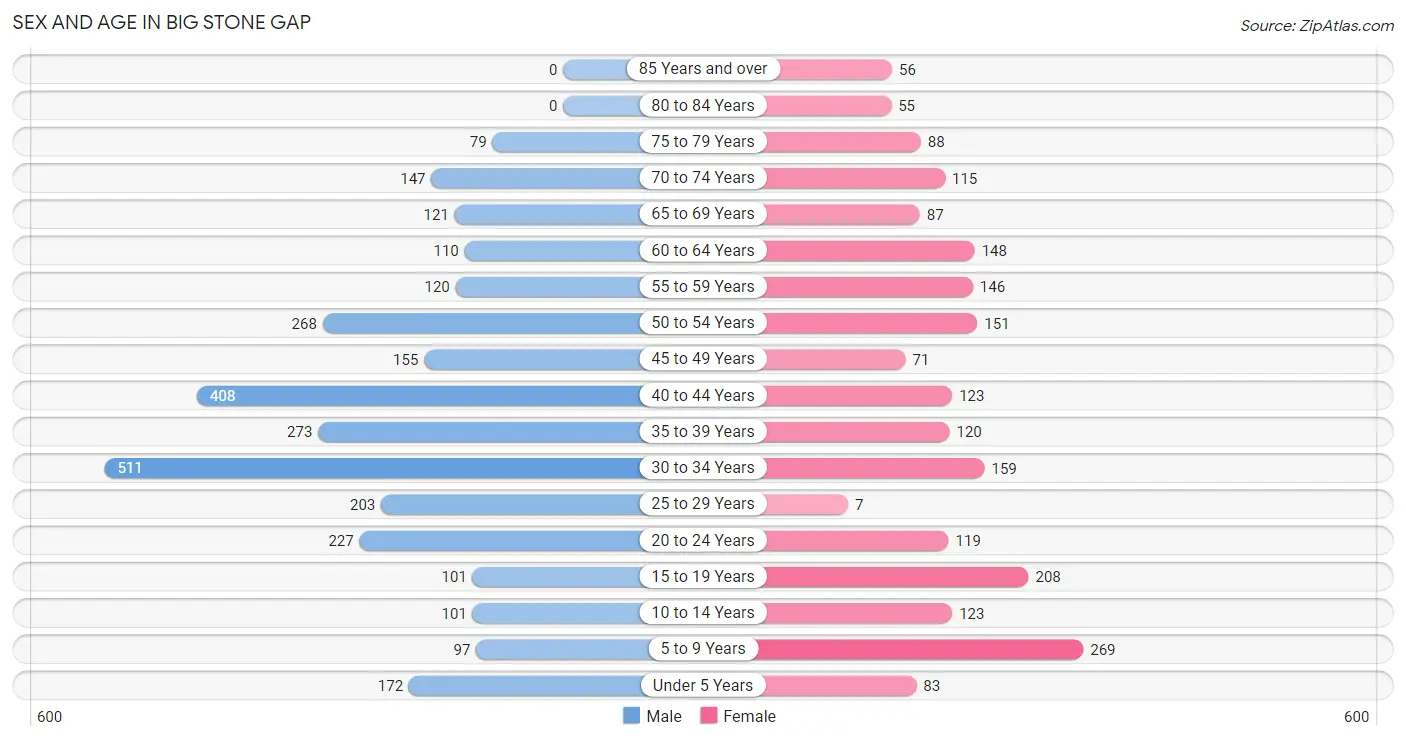
Sex and Age in Big Stone Gap
Sex and Age in Big Stone Gap
The most populous age groups in Big Stone Gap are 30 to 34 Years (511 | 16.5%) for men and 5 to 9 Years (269 | 12.6%) for women.
| Age Bracket | Male | Female |
| Under 5 Years | 172 (5.6%) | 83 (3.9%) |
| 5 to 9 Years | 97 (3.1%) | 269 (12.6%) |
| 10 to 14 Years | 101 (3.3%) | 123 (5.8%) |
| 15 to 19 Years | 101 (3.3%) | 208 (9.8%) |
| 20 to 24 Years | 227 (7.3%) | 119 (5.6%) |
| 25 to 29 Years | 203 (6.6%) | 7 (0.3%) |
| 30 to 34 Years | 511 (16.5%) | 159 (7.5%) |
| 35 to 39 Years | 273 (8.8%) | 120 (5.6%) |
| 40 to 44 Years | 408 (13.2%) | 123 (5.8%) |
| 45 to 49 Years | 155 (5.0%) | 71 (3.3%) |
| 50 to 54 Years | 268 (8.7%) | 151 (7.1%) |
| 55 to 59 Years | 120 (3.9%) | 146 (6.9%) |
| 60 to 64 Years | 110 (3.6%) | 148 (7.0%) |
| 65 to 69 Years | 121 (3.9%) | 87 (4.1%) |
| 70 to 74 Years | 147 (4.8%) | 115 (5.4%) |
| 75 to 79 Years | 79 (2.5%) | 88 (4.1%) |
| 80 to 84 Years | 0 (0.0%) | 55 (2.6%) |
| 85 Years and over | 0 (0.0%) | 56 (2.6%) |
| Total | 3,093 (100.0%) | 2,128 (100.0%) |
Families and Households in Big Stone Gap
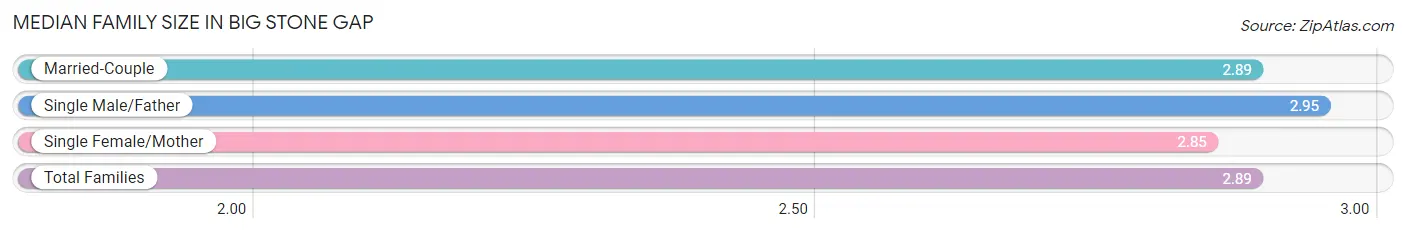
Median Family Size in Big Stone Gap
The median family size in Big Stone Gap is 2.89 persons per family, with single male/father families (127 | 11.4%) accounting for the largest median family size of 2.95 persons per family. On the other hand, single female/mother families (213 | 19.2%) represent the smallest median family size with 2.85 persons per family.
| Family Type | # Families | Family Size |
| Married-Couple | 770 (69.4%) | 2.89 |
| Single Male/Father | 127 (11.4%) | 2.95 |
| Single Female/Mother | 213 (19.2%) | 2.85 |
| Total Families | 1,110 (100.0%) | 2.89 |
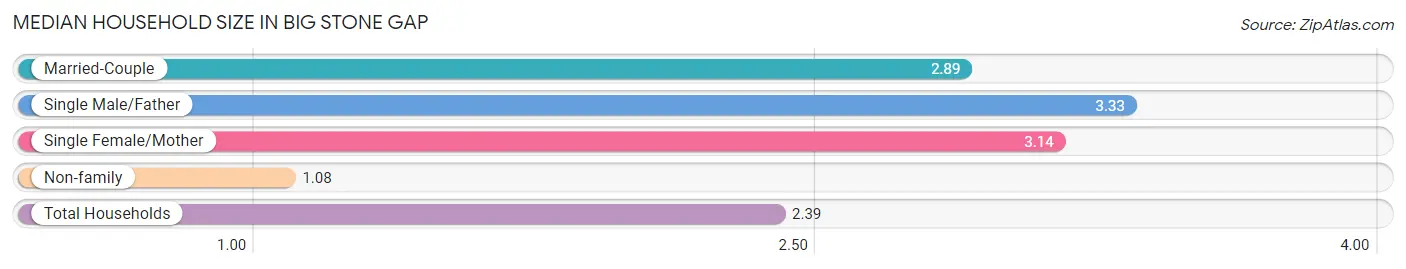
Median Household Size in Big Stone Gap
The median household size in Big Stone Gap is 2.39 persons per household, with single male/father households (127 | 7.8%) accounting for the largest median household size of 3.33 persons per household. non-family households (513 | 31.6%) represent the smallest median household size with 1.08 persons per household.
| Household Type | # Households | Household Size |
| Married-Couple | 770 (47.4%) | 2.89 |
| Single Male/Father | 127 (7.8%) | 3.33 |
| Single Female/Mother | 213 (13.1%) | 3.14 |
| Non-family | 513 (31.6%) | 1.08 |
| Total Households | 1,623 (100.0%) | 2.39 |
Household Size by Marriage Status in Big Stone Gap
Out of a total of 1,623 households in Big Stone Gap, 1,110 (68.4%) are family households, while 513 (31.6%) are nonfamily households. The most numerous type of family households are 2-person households, comprising 552, and the most common type of nonfamily households are 1-person households, comprising 474.
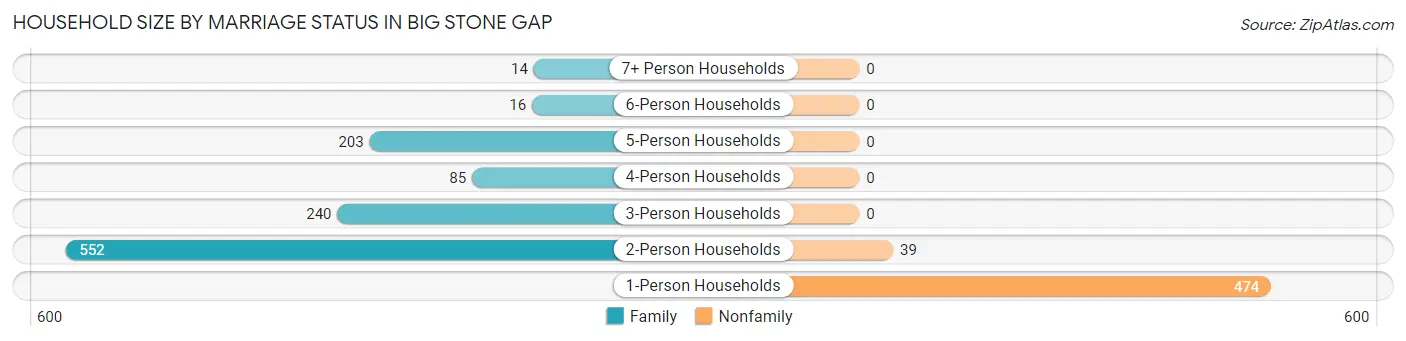
| Household Size | Family Households | Nonfamily Households |
| 1-Person Households | - | 474 (29.2%) |
| 2-Person Households | 552 (34.0%) | 39 (2.4%) |
| 3-Person Households | 240 (14.8%) | 0 (0.0%) |
| 4-Person Households | 85 (5.2%) | 0 (0.0%) |
| 5-Person Households | 203 (12.5%) | 0 (0.0%) |
| 6-Person Households | 16 (1.0%) | 0 (0.0%) |
| 7+ Person Households | 14 (0.9%) | 0 (0.0%) |
| Total | 1,110 (68.4%) | 513 (31.6%) |
Female Fertility in Big Stone Gap
Fertility by Age in Big Stone Gap
Average fertility rate in Big Stone Gap is 196.0 births per 1,000 women. Women in the age bracket of 15 to 19 years have the highest fertility rate with 409.0 births per 1,000 women. Women in the age bracket of 20 to 34 years acount for 50.3% of all women with births.
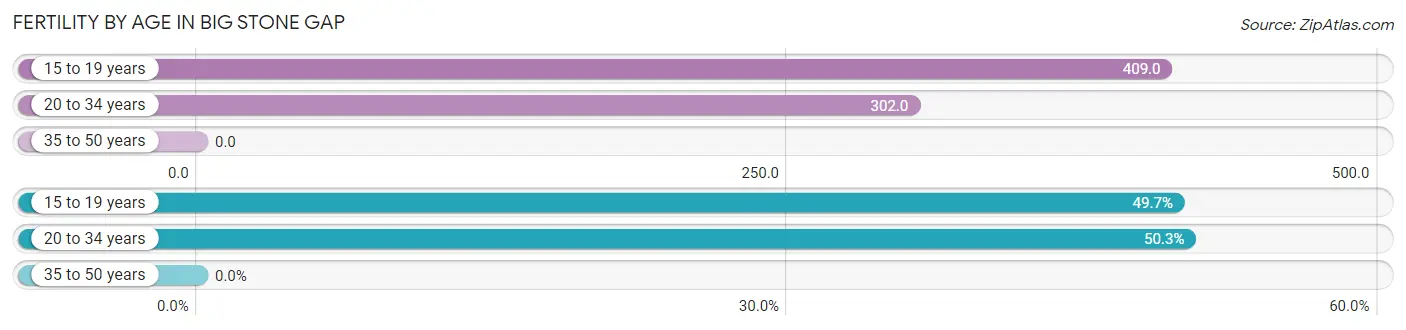
| Age Bracket | Women with Births | Births / 1,000 Women |
| 15 to 19 years | 85 (49.7%) | 409.0 |
| 20 to 34 years | 86 (50.3%) | 302.0 |
| 35 to 50 years | 0 (0.0%) | 0.0 |
| Total | 171 (100.0%) | 196.0 |
Fertility by Age by Marriage Status in Big Stone Gap
12.9% of women with births (171) in Big Stone Gap are married. The highest percentage of unmarried women with births falls into 15 to 19 years age bracket with 100.0% of them unmarried at the time of birth, while the lowest percentage of unmarried women with births belong to 20 to 34 years age bracket with 74.4% of them unmarried.
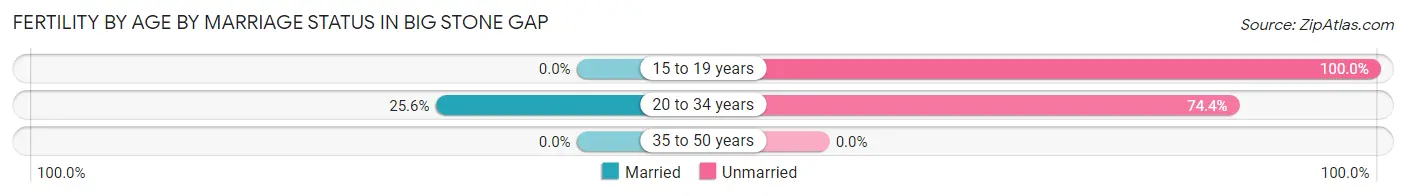
| Age Bracket | Married | Unmarried |
| 15 to 19 years | 0 (0.0%) | 85 (100.0%) |
| 20 to 34 years | 22 (25.6%) | 64 (74.4%) |
| 35 to 50 years | 0 (0.0%) | 0 (0.0%) |
| Total | 22 (12.9%) | 149 (87.1%) |
Fertility by Education in Big Stone Gap
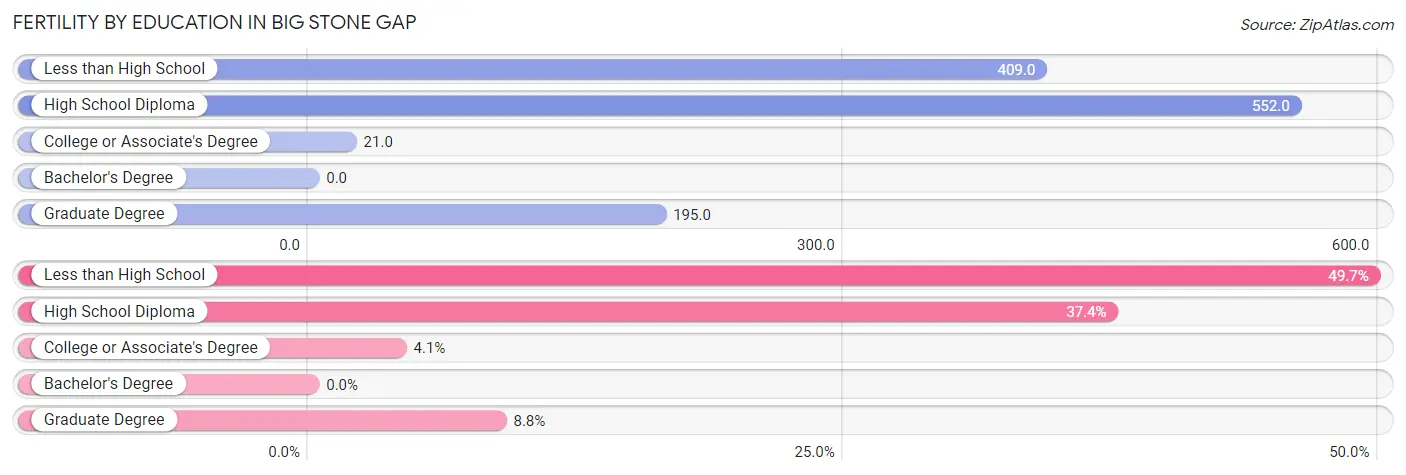
| Educational Attainment | Women with Births | Births / 1,000 Women |
| Less than High School | 85 (49.7%) | 409.0 |
| High School Diploma | 64 (37.4%) | 552.0 |
| College or Associate's Degree | 7 (4.1%) | 21.0 |
| Bachelor's Degree | 0 (0.0%) | 0.0 |
| Graduate Degree | 15 (8.8%) | 195.0 |
| Total | 171 (100.0%) | 196.0 |
Fertility by Education by Marriage Status in Big Stone Gap
87.1% of women with births in Big Stone Gap are unmarried. Women with the educational attainment of college or associate's degree are most likely to be married with 100.0% of them married at childbirth, while women with the educational attainment of less than high school are least likely to be married with 100.0% of them unmarried at childbirth.
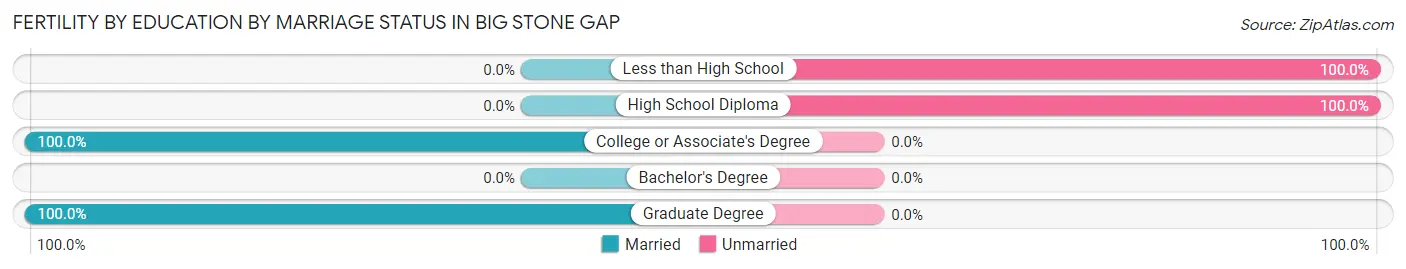
| Educational Attainment | Married | Unmarried |
| Less than High School | 0 (0.0%) | 85 (100.0%) |
| High School Diploma | 0 (0.0%) | 64 (100.0%) |
| College or Associate's Degree | 7 (100.0%) | 0 (0.0%) |
| Bachelor's Degree | 0 (0.0%) | 0 (0.0%) |
| Graduate Degree | 15 (100.0%) | 0 (0.0%) |
| Total | 22 (12.9%) | 149 (87.1%) |
Employment Characteristics in Big Stone Gap
Employment by Class of Employer in Big Stone Gap
Among the 1,695 employed individuals in Big Stone Gap, private company employees (1,157 | 68.3%), local government employees (214 | 12.6%), and not-for-profit organizations (173 | 10.2%) make up the most common classes of employment.
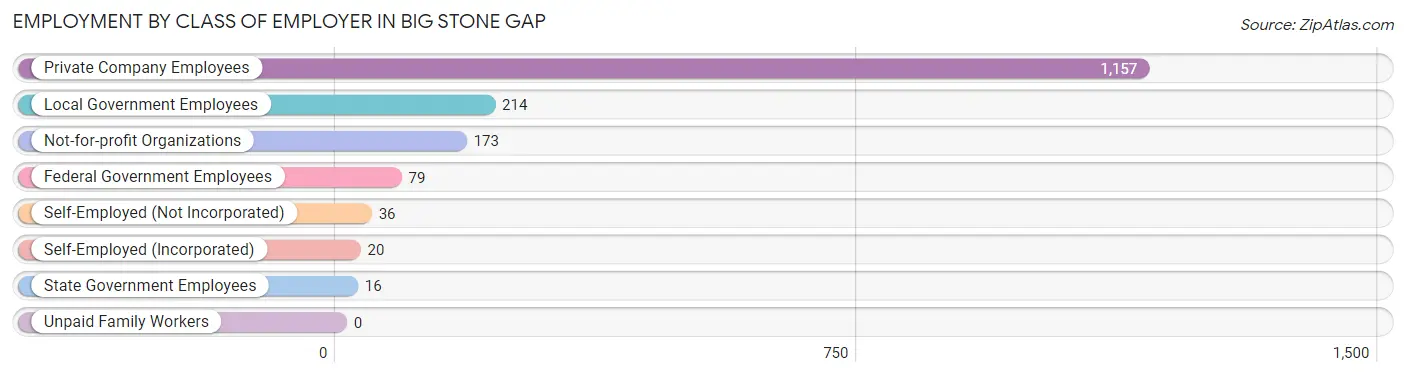
| Employer Class | # Employees | % Employees |
| Private Company Employees | 1,157 | 68.3% |
| Self-Employed (Incorporated) | 20 | 1.2% |
| Self-Employed (Not Incorporated) | 36 | 2.1% |
| Not-for-profit Organizations | 173 | 10.2% |
| Local Government Employees | 214 | 12.6% |
| State Government Employees | 16 | 0.9% |
| Federal Government Employees | 79 | 4.7% |
| Unpaid Family Workers | 0 | 0.0% |
| Total | 1,695 | 100.0% |
Employment Status by Age in Big Stone Gap
According to the labor force statistics for Big Stone Gap, out of the total population over 16 years of age (4,224), 45.5% or 1,922 individuals are in the labor force, with 11.7% or 225 of them unemployed. The age group with the highest labor force participation rate is 16 to 19 years, with 100.0% or 157 individuals in the labor force. Within the labor force, the 16 to 19 years age range has the highest percentage of unemployed individuals, with 59.9% or 94 of them being unemployed.
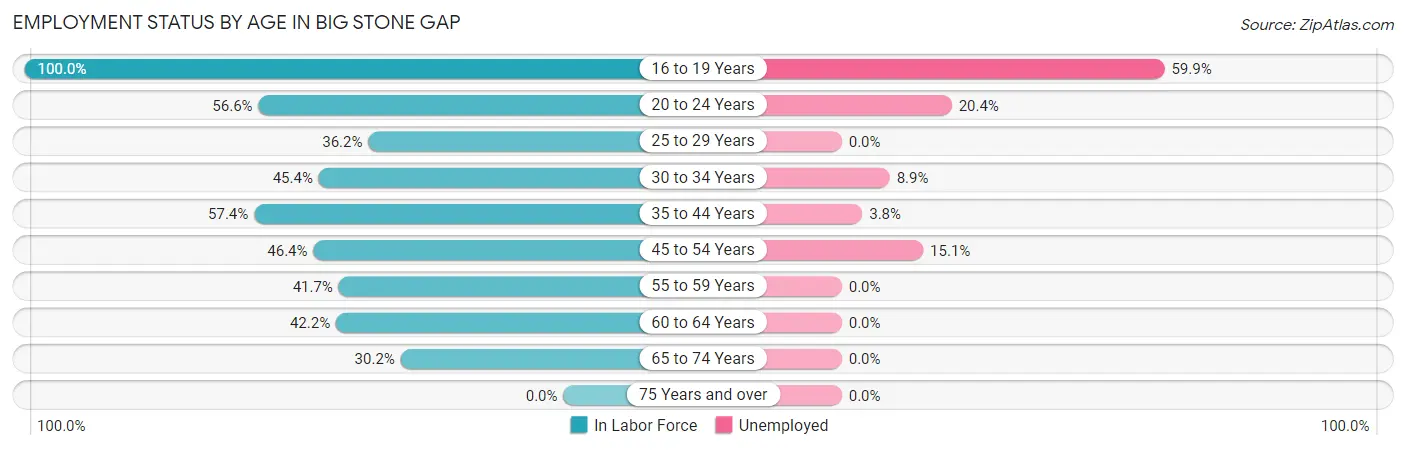
| Age Bracket | In Labor Force | Unemployed |
| 16 to 19 Years | 157 (100.0%) | 94 (59.9%) |
| 20 to 24 Years | 196 (56.6%) | 40 (20.4%) |
| 25 to 29 Years | 76 (36.2%) | 0 (0.0%) |
| 30 to 34 Years | 304 (45.4%) | 27 (8.9%) |
| 35 to 44 Years | 530 (57.4%) | 20 (3.8%) |
| 45 to 54 Years | 299 (46.4%) | 45 (15.1%) |
| 55 to 59 Years | 111 (41.7%) | 0 (0.0%) |
| 60 to 64 Years | 109 (42.2%) | 0 (0.0%) |
| 65 to 74 Years | 142 (30.2%) | 0 (0.0%) |
| 75 Years and over | 0 (0.0%) | 0 (0.0%) |
| Total | 1,922 (45.5%) | 225 (11.7%) |
Employment Status by Educational Attainment in Big Stone Gap
According to labor force statistics for Big Stone Gap, 48.1% of individuals (1,430) out of the total population between 25 and 64 years of age (2,973) are in the labor force, with 6.4% or 92 of them being unemployed. The group with the highest labor force participation rate are those with the educational attainment of bachelor's degree or higher, with 85.7% or 456 individuals in the labor force. Within the labor force, individuals with college / associate degree education have the highest percentage of unemployment, with 13.2% or 72 of them being unemployed.
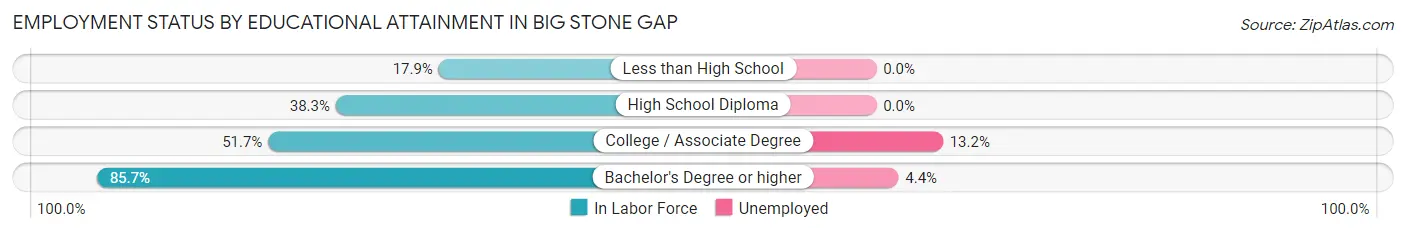
| Educational Attainment | In Labor Force | Unemployed |
| Less than High School | 91 (17.9%) | 0 (0.0%) |
| High School Diploma | 335 (38.3%) | 0 (0.0%) |
| College / Associate Degree | 547 (51.7%) | 140 (13.2%) |
| Bachelor's Degree or higher | 456 (85.7%) | 23 (4.4%) |
| Total | 1,430 (48.1%) | 190 (6.4%) |
Employment Occupations by Sex in Big Stone Gap
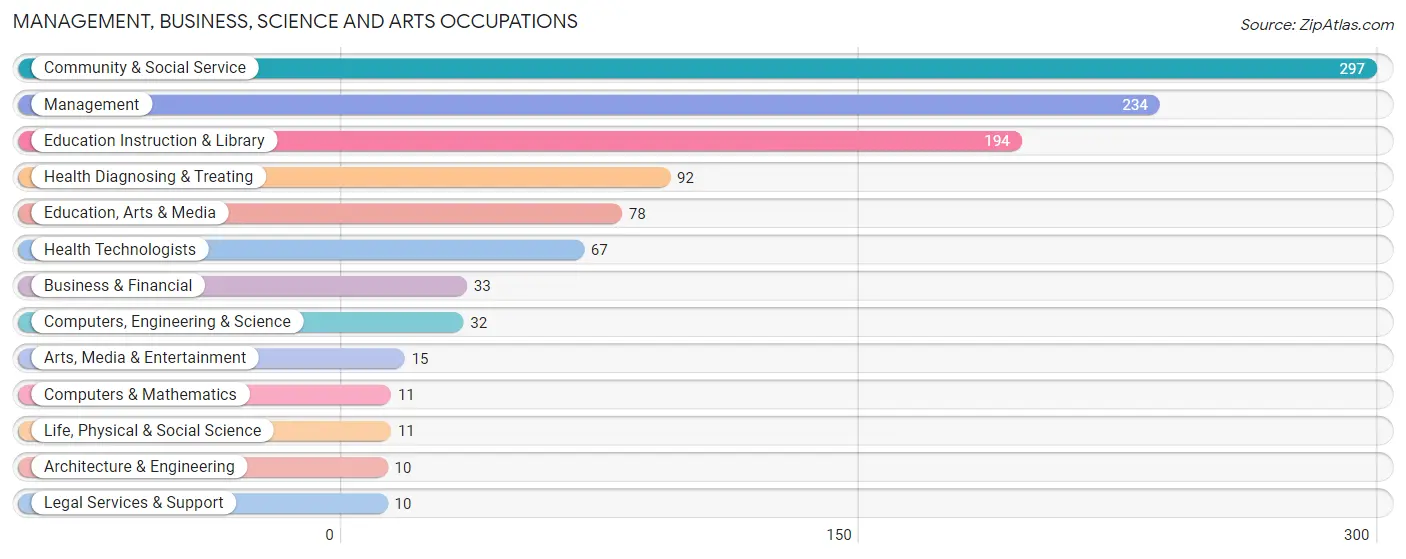
Management, Business, Science and Arts Occupations
The most common Management, Business, Science and Arts occupations in Big Stone Gap are Community & Social Service (297 | 17.5%), Management (234 | 13.8%), Education Instruction & Library (194 | 11.4%), Health Diagnosing & Treating (92 | 5.4%), and Education, Arts & Media (78 | 4.6%).
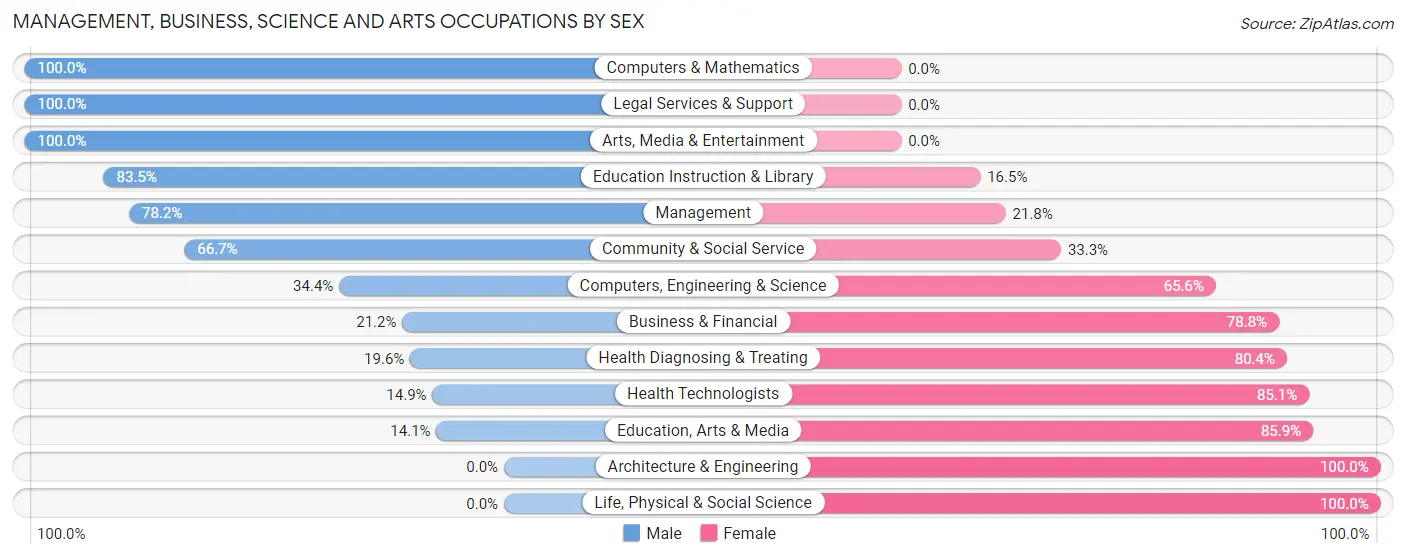
Management, Business, Science and Arts Occupations by Sex
Within the Management, Business, Science and Arts occupations in Big Stone Gap, the most male-oriented occupations are Computers & Mathematics (100.0%), Legal Services & Support (100.0%), and Arts, Media & Entertainment (100.0%), while the most female-oriented occupations are Architecture & Engineering (100.0%), Life, Physical & Social Science (100.0%), and Education, Arts & Media (85.9%).
| Occupation | Male | Female |
| Management | 183 (78.2%) | 51 (21.8%) |
| Business & Financial | 7 (21.2%) | 26 (78.8%) |
| Computers, Engineering & Science | 11 (34.4%) | 21 (65.6%) |
| Computers & Mathematics | 11 (100.0%) | 0 (0.0%) |
| Architecture & Engineering | 0 (0.0%) | 10 (100.0%) |
| Life, Physical & Social Science | 0 (0.0%) | 11 (100.0%) |
| Community & Social Service | 198 (66.7%) | 99 (33.3%) |
| Education, Arts & Media | 11 (14.1%) | 67 (85.9%) |
| Legal Services & Support | 10 (100.0%) | 0 (0.0%) |
| Education Instruction & Library | 162 (83.5%) | 32 (16.5%) |
| Arts, Media & Entertainment | 15 (100.0%) | 0 (0.0%) |
| Health Diagnosing & Treating | 18 (19.6%) | 74 (80.4%) |
| Health Technologists | 10 (14.9%) | 57 (85.1%) |
| Total (Category) | 417 (60.6%) | 271 (39.4%) |
| Total (Overall) | 818 (48.2%) | 880 (51.8%) |
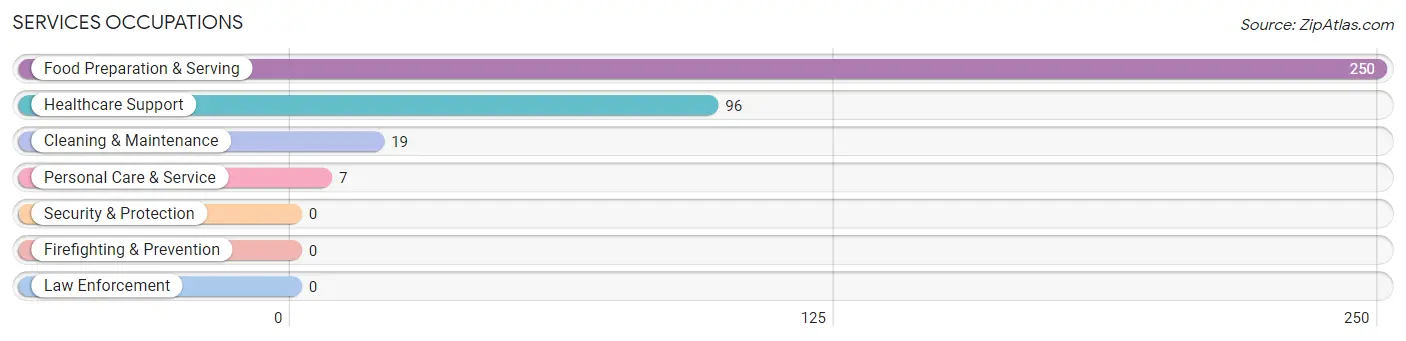
Services Occupations
The most common Services occupations in Big Stone Gap are Food Preparation & Serving (250 | 14.7%), Healthcare Support (96 | 5.7%), Cleaning & Maintenance (19 | 1.1%), and Personal Care & Service (7 | 0.4%).
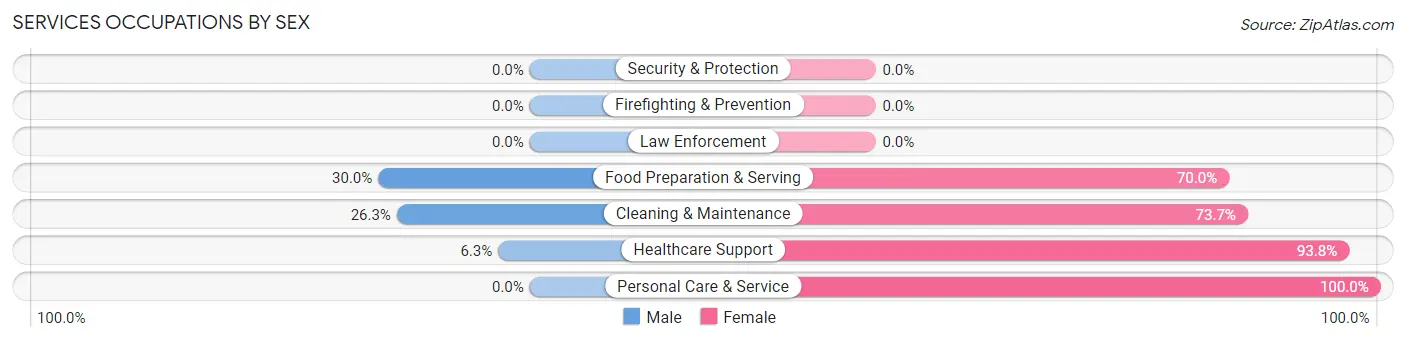
Services Occupations by Sex
Within the Services occupations in Big Stone Gap, the most male-oriented occupations are Food Preparation & Serving (30.0%), Cleaning & Maintenance (26.3%), and Healthcare Support (6.2%), while the most female-oriented occupations are Personal Care & Service (100.0%), Healthcare Support (93.8%), and Cleaning & Maintenance (73.7%).
| Occupation | Male | Female |
| Healthcare Support | 6 (6.2%) | 90 (93.8%) |
| Security & Protection | 0 (0.0%) | 0 (0.0%) |
| Firefighting & Prevention | 0 (0.0%) | 0 (0.0%) |
| Law Enforcement | 0 (0.0%) | 0 (0.0%) |
| Food Preparation & Serving | 75 (30.0%) | 175 (70.0%) |
| Cleaning & Maintenance | 5 (26.3%) | 14 (73.7%) |
| Personal Care & Service | 0 (0.0%) | 7 (100.0%) |
| Total (Category) | 86 (23.1%) | 286 (76.9%) |
| Total (Overall) | 818 (48.2%) | 880 (51.8%) |
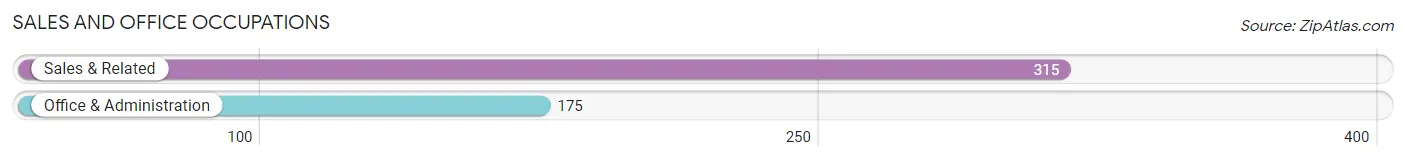
Sales and Office Occupations
The most common Sales and Office occupations in Big Stone Gap are Sales & Related (315 | 18.5%), and Office & Administration (175 | 10.3%).
Sales and Office Occupations by Sex
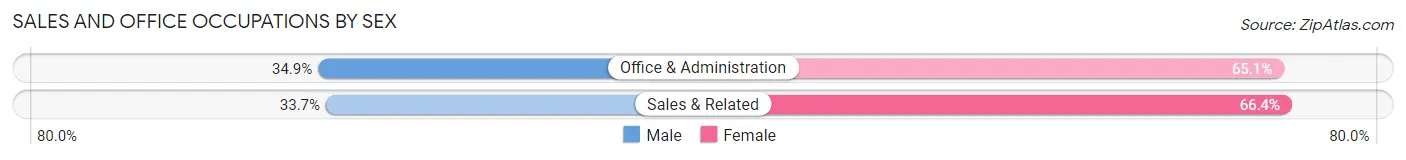
| Occupation | Male | Female |
| Sales & Related | 106 (33.7%) | 209 (66.3%) |
| Office & Administration | 61 (34.9%) | 114 (65.1%) |
| Total (Category) | 167 (34.1%) | 323 (65.9%) |
| Total (Overall) | 818 (48.2%) | 880 (51.8%) |
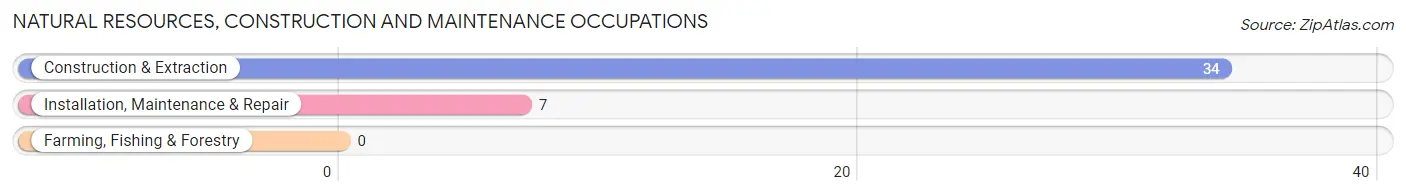
Natural Resources, Construction and Maintenance Occupations
The most common Natural Resources, Construction and Maintenance occupations in Big Stone Gap are Construction & Extraction (34 | 2.0%), and Installation, Maintenance & Repair (7 | 0.4%).
Natural Resources, Construction and Maintenance Occupations by Sex
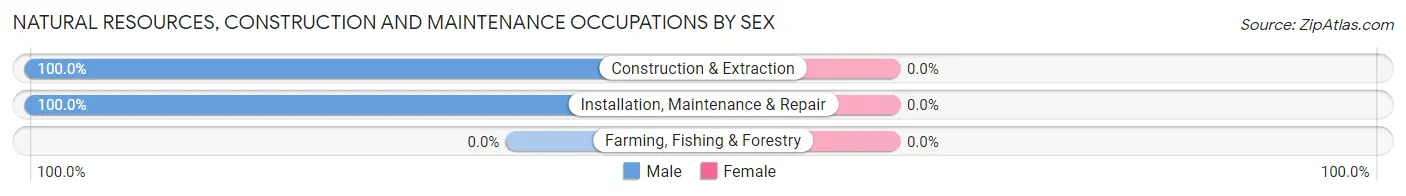
| Occupation | Male | Female |
| Farming, Fishing & Forestry | 0 (0.0%) | 0 (0.0%) |
| Construction & Extraction | 34 (100.0%) | 0 (0.0%) |
| Installation, Maintenance & Repair | 7 (100.0%) | 0 (0.0%) |
| Total (Category) | 41 (100.0%) | 0 (0.0%) |
| Total (Overall) | 818 (48.2%) | 880 (51.8%) |
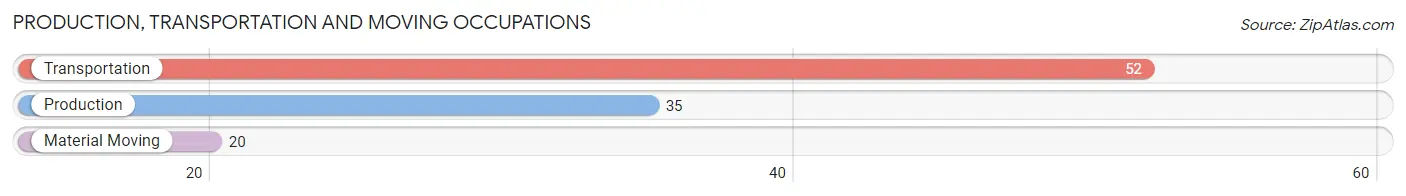
Production, Transportation and Moving Occupations
The most common Production, Transportation and Moving occupations in Big Stone Gap are Transportation (52 | 3.1%), Production (35 | 2.1%), and Material Moving (20 | 1.2%).
Production, Transportation and Moving Occupations by Sex
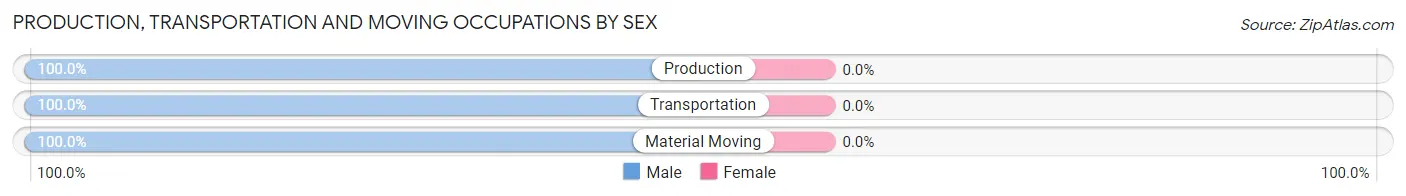
| Occupation | Male | Female |
| Production | 35 (100.0%) | 0 (0.0%) |
| Transportation | 52 (100.0%) | 0 (0.0%) |
| Material Moving | 20 (100.0%) | 0 (0.0%) |
| Total (Category) | 107 (100.0%) | 0 (0.0%) |
| Total (Overall) | 818 (48.2%) | 880 (51.8%) |
Employment Industries by Sex in Big Stone Gap
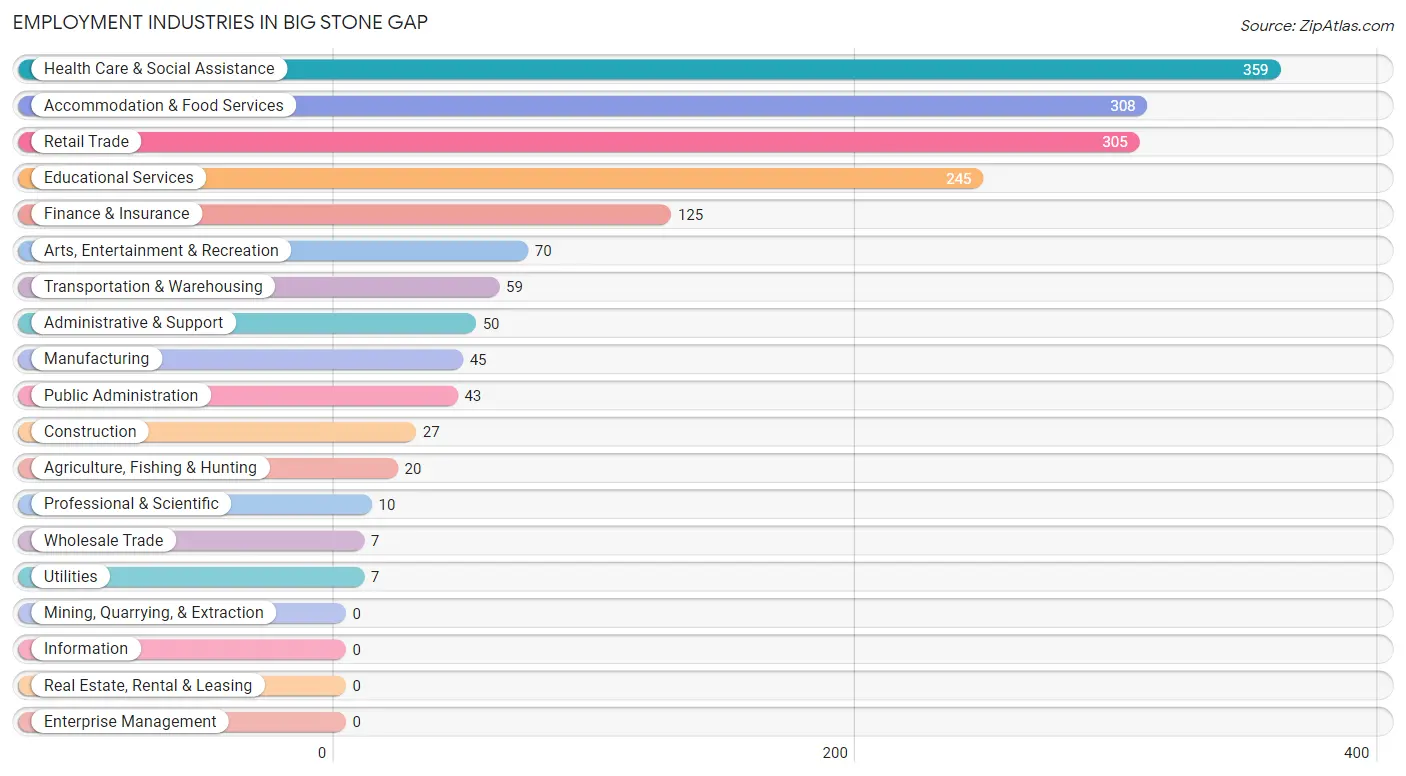
Employment Industries in Big Stone Gap
The major employment industries in Big Stone Gap include Health Care & Social Assistance (359 | 21.1%), Accommodation & Food Services (308 | 18.1%), Retail Trade (305 | 18.0%), Educational Services (245 | 14.4%), and Finance & Insurance (125 | 7.4%).
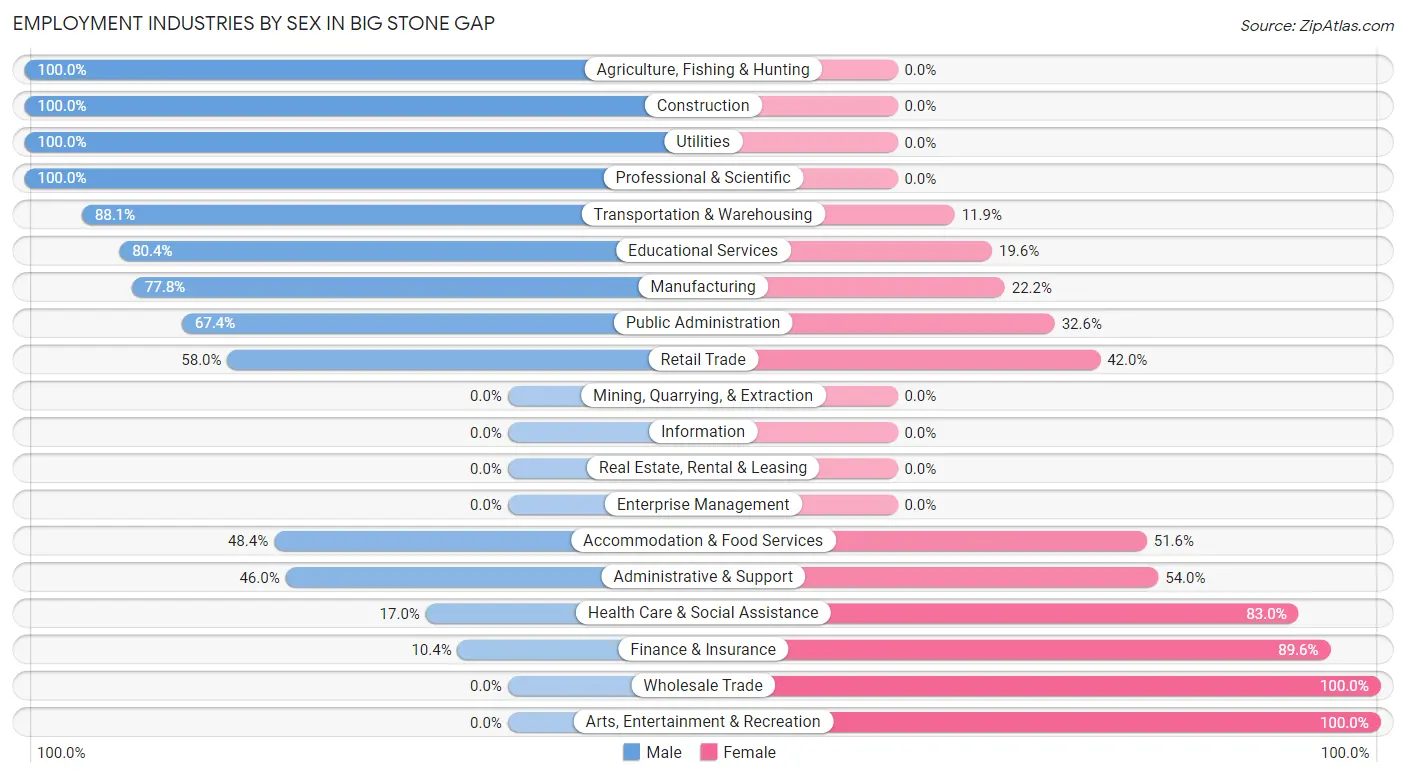
Employment Industries by Sex in Big Stone Gap
The Big Stone Gap industries that see more men than women are Agriculture, Fishing & Hunting (100.0%), Construction (100.0%), and Utilities (100.0%), whereas the industries that tend to have a higher number of women are Wholesale Trade (100.0%), Arts, Entertainment & Recreation (100.0%), and Finance & Insurance (89.6%).
| Industry | Male | Female |
| Agriculture, Fishing & Hunting | 20 (100.0%) | 0 (0.0%) |
| Mining, Quarrying, & Extraction | 0 (0.0%) | 0 (0.0%) |
| Construction | 27 (100.0%) | 0 (0.0%) |
| Manufacturing | 35 (77.8%) | 10 (22.2%) |
| Wholesale Trade | 0 (0.0%) | 7 (100.0%) |
| Retail Trade | 177 (58.0%) | 128 (42.0%) |
| Transportation & Warehousing | 52 (88.1%) | 7 (11.9%) |
| Utilities | 7 (100.0%) | 0 (0.0%) |
| Information | 0 (0.0%) | 0 (0.0%) |
| Finance & Insurance | 13 (10.4%) | 112 (89.6%) |
| Real Estate, Rental & Leasing | 0 (0.0%) | 0 (0.0%) |
| Professional & Scientific | 10 (100.0%) | 0 (0.0%) |
| Enterprise Management | 0 (0.0%) | 0 (0.0%) |
| Administrative & Support | 23 (46.0%) | 27 (54.0%) |
| Educational Services | 197 (80.4%) | 48 (19.6%) |
| Health Care & Social Assistance | 61 (17.0%) | 298 (83.0%) |
| Arts, Entertainment & Recreation | 0 (0.0%) | 70 (100.0%) |
| Accommodation & Food Services | 149 (48.4%) | 159 (51.6%) |
| Public Administration | 29 (67.4%) | 14 (32.6%) |
| Total | 818 (48.2%) | 880 (51.8%) |
Education in Big Stone Gap
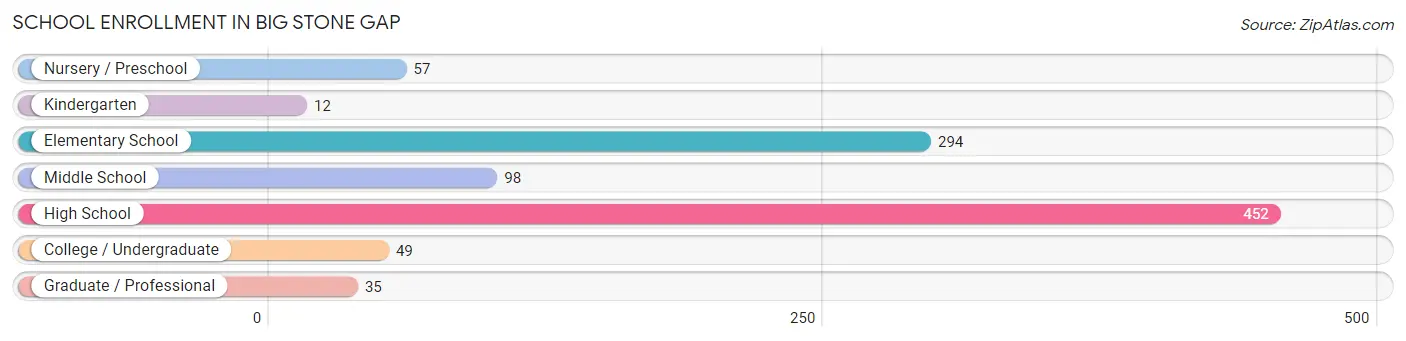
School Enrollment in Big Stone Gap
The most common levels of schooling among the 997 students in Big Stone Gap are high school (452 | 45.3%), elementary school (294 | 29.5%), and middle school (98 | 9.8%).
| School Level | # Students | % Students |
| Nursery / Preschool | 57 | 5.7% |
| Kindergarten | 12 | 1.2% |
| Elementary School | 294 | 29.5% |
| Middle School | 98 | 9.8% |
| High School | 452 | 45.3% |
| College / Undergraduate | 49 | 4.9% |
| Graduate / Professional | 35 | 3.5% |
| Total | 997 | 100.0% |
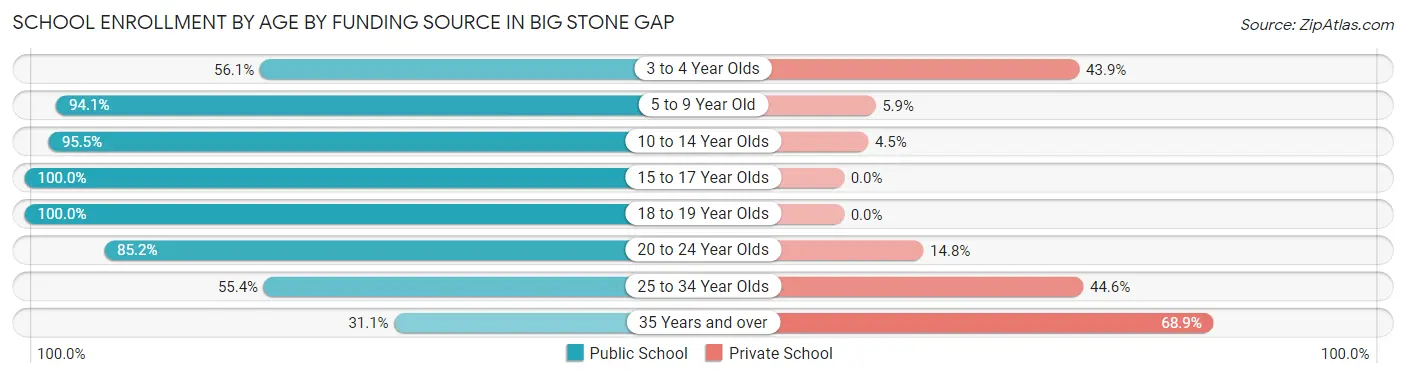
School Enrollment by Age by Funding Source in Big Stone Gap
Out of a total of 997 students who are enrolled in schools in Big Stone Gap, 123 (12.3%) attend a private institution, while the remaining 874 (87.7%) are enrolled in public schools. The age group of 35 years and over has the highest likelihood of being enrolled in private schools, with 31 (68.9% in the age bracket) enrolled. Conversely, the age group of 15 to 17 year olds has the lowest likelihood of being enrolled in a private school, with 208 (100.0% in the age bracket) attending a public institution.
| Age Bracket | Public School | Private School |
| 3 to 4 Year Olds | 32 (56.1%) | 25 (43.9%) |
| 5 to 9 Year Old | 288 (94.1%) | 18 (5.9%) |
| 10 to 14 Year Olds | 169 (95.5%) | 8 (4.5%) |
| 15 to 17 Year Olds | 208 (100.0%) | 0 (0.0%) |
| 18 to 19 Year Olds | 94 (100.0%) | 0 (0.0%) |
| 20 to 24 Year Olds | 23 (85.2%) | 4 (14.8%) |
| 25 to 34 Year Olds | 46 (55.4%) | 37 (44.6%) |
| 35 Years and over | 14 (31.1%) | 31 (68.9%) |
| Total | 874 (87.7%) | 123 (12.3%) |
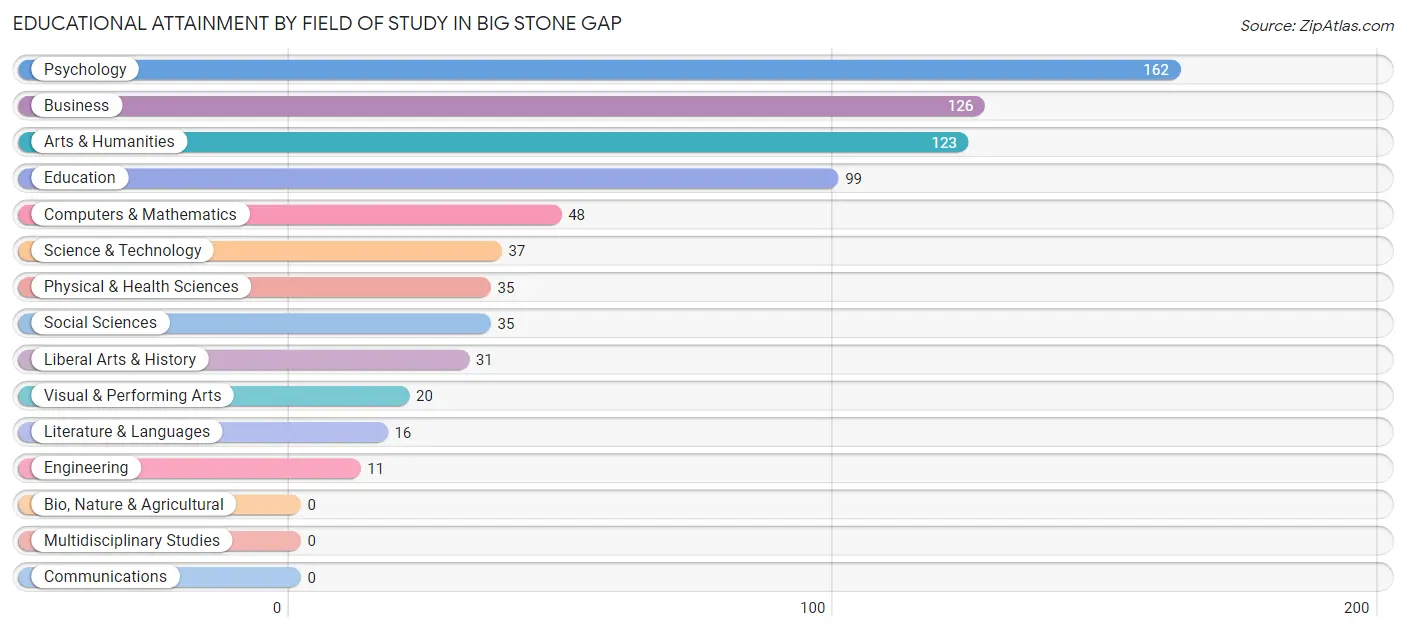
Educational Attainment by Field of Study in Big Stone Gap
Psychology (162 | 21.8%), business (126 | 17.0%), arts & humanities (123 | 16.6%), education (99 | 13.3%), and computers & mathematics (48 | 6.5%) are the most common fields of study among 743 individuals in Big Stone Gap who have obtained a bachelor's degree or higher.
| Field of Study | # Graduates | % Graduates |
| Computers & Mathematics | 48 | 6.5% |
| Bio, Nature & Agricultural | 0 | 0.0% |
| Physical & Health Sciences | 35 | 4.7% |
| Psychology | 162 | 21.8% |
| Social Sciences | 35 | 4.7% |
| Engineering | 11 | 1.5% |
| Multidisciplinary Studies | 0 | 0.0% |
| Science & Technology | 37 | 5.0% |
| Business | 126 | 17.0% |
| Education | 99 | 13.3% |
| Literature & Languages | 16 | 2.1% |
| Liberal Arts & History | 31 | 4.2% |
| Visual & Performing Arts | 20 | 2.7% |
| Communications | 0 | 0.0% |
| Arts & Humanities | 123 | 16.6% |
| Total | 743 | 100.0% |
Transportation & Commute in Big Stone Gap
Vehicle Availability by Sex in Big Stone Gap
The most prevalent vehicle ownership categories in Big Stone Gap are males with 2 vehicles (338, accounting for 41.3%) and females with 2 vehicles (287, making up 38.5%).
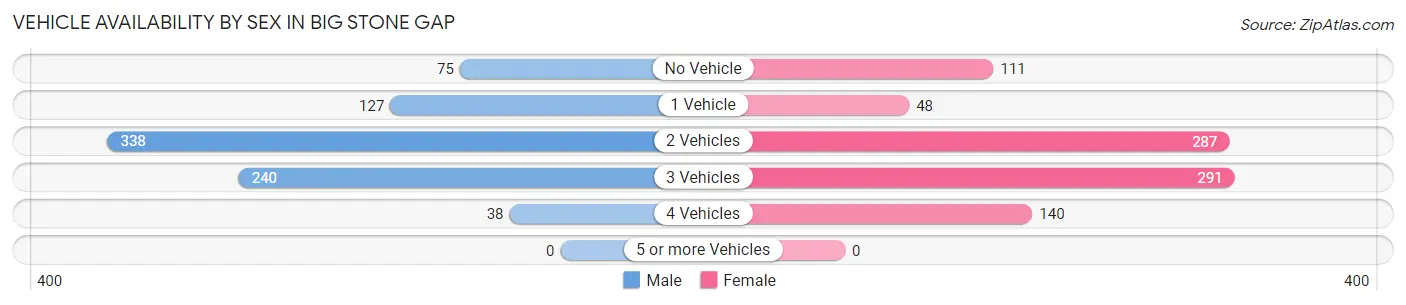
| Vehicles Available | Male | Female |
| No Vehicle | 75 (9.2%) | 111 (12.7%) |
| 1 Vehicle | 127 (15.5%) | 48 (5.5%) |
| 2 Vehicles | 338 (41.3%) | 287 (32.7%) |
| 3 Vehicles | 240 (29.3%) | 291 (33.2%) |
| 4 Vehicles | 38 (4.6%) | 140 (16.0%) |
| 5 or more Vehicles | 0 (0.0%) | 0 (0.0%) |
| Total | 818 (100.0%) | 877 (100.0%) |
Commute Time in Big Stone Gap
The most frequently occuring commute durations in Big Stone Gap are 10 to 14 minutes (354 commuters, 21.8%), less than 5 minutes (276 commuters, 17.0%), and 45 to 59 minutes (207 commuters, 12.8%).
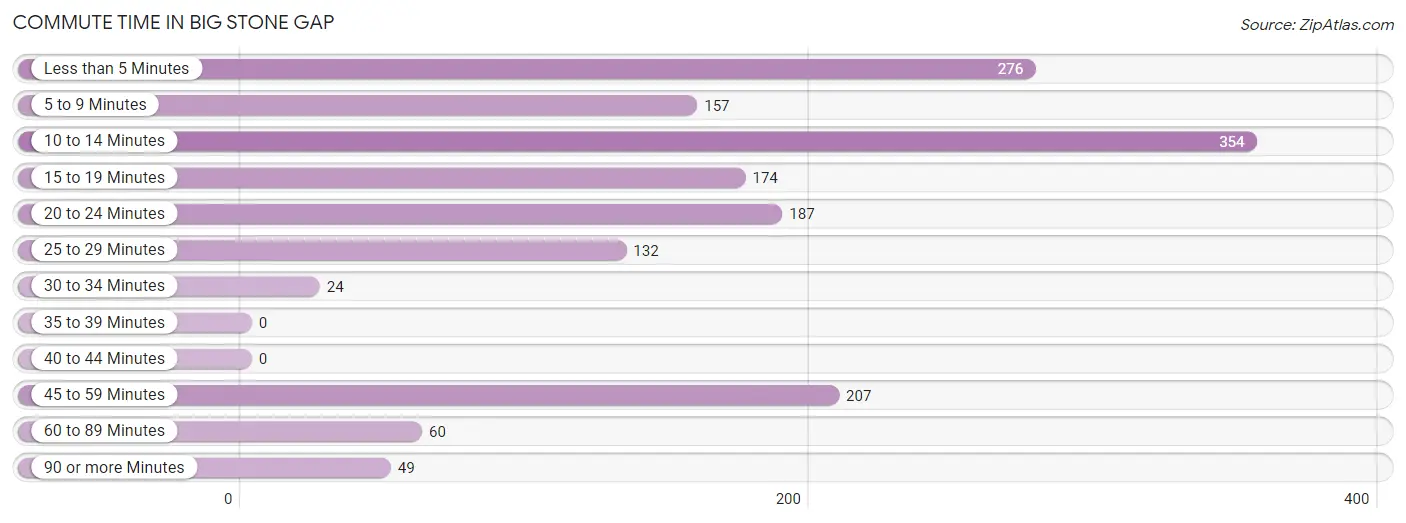
| Commute Time | # Commuters | % Commuters |
| Less than 5 Minutes | 276 | 17.0% |
| 5 to 9 Minutes | 157 | 9.7% |
| 10 to 14 Minutes | 354 | 21.8% |
| 15 to 19 Minutes | 174 | 10.7% |
| 20 to 24 Minutes | 187 | 11.5% |
| 25 to 29 Minutes | 132 | 8.2% |
| 30 to 34 Minutes | 24 | 1.5% |
| 35 to 39 Minutes | 0 | 0.0% |
| 40 to 44 Minutes | 0 | 0.0% |
| 45 to 59 Minutes | 207 | 12.8% |
| 60 to 89 Minutes | 60 | 3.7% |
| 90 or more Minutes | 49 | 3.0% |
Commute Time by Sex in Big Stone Gap
The most common commute times in Big Stone Gap are 10 to 14 minutes (225 commuters, 28.9%) for males and 20 to 24 minutes (155 commuters, 18.4%) for females.
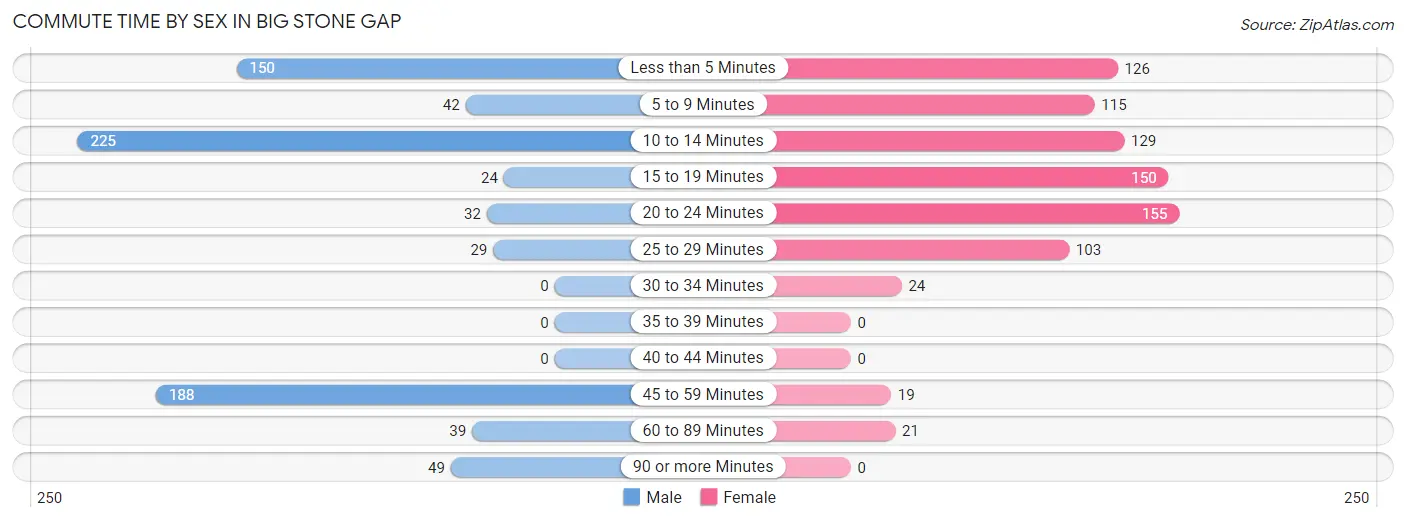
| Commute Time | Male | Female |
| Less than 5 Minutes | 150 (19.3%) | 126 (15.0%) |
| 5 to 9 Minutes | 42 (5.4%) | 115 (13.7%) |
| 10 to 14 Minutes | 225 (28.9%) | 129 (15.3%) |
| 15 to 19 Minutes | 24 (3.1%) | 150 (17.8%) |
| 20 to 24 Minutes | 32 (4.1%) | 155 (18.4%) |
| 25 to 29 Minutes | 29 (3.7%) | 103 (12.2%) |
| 30 to 34 Minutes | 0 (0.0%) | 24 (2.9%) |
| 35 to 39 Minutes | 0 (0.0%) | 0 (0.0%) |
| 40 to 44 Minutes | 0 (0.0%) | 0 (0.0%) |
| 45 to 59 Minutes | 188 (24.2%) | 19 (2.3%) |
| 60 to 89 Minutes | 39 (5.0%) | 21 (2.5%) |
| 90 or more Minutes | 49 (6.3%) | 0 (0.0%) |
Time of Departure to Work by Sex in Big Stone Gap
The most frequent times of departure to work in Big Stone Gap are 8:30 AM to 8:59 AM (118, 15.2%) for males and 7:30 AM to 7:59 AM (270, 32.1%) for females.
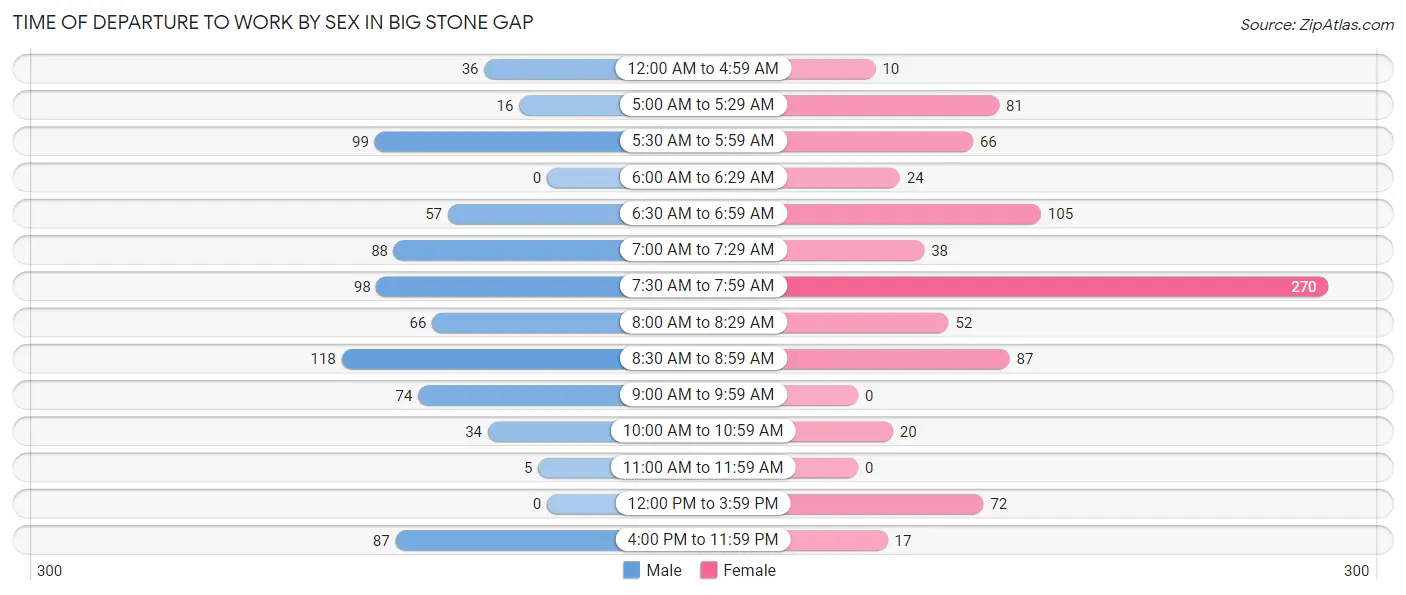
| Time of Departure | Male | Female |
| 12:00 AM to 4:59 AM | 36 (4.6%) | 10 (1.2%) |
| 5:00 AM to 5:29 AM | 16 (2.1%) | 81 (9.6%) |
| 5:30 AM to 5:59 AM | 99 (12.7%) | 66 (7.8%) |
| 6:00 AM to 6:29 AM | 0 (0.0%) | 24 (2.9%) |
| 6:30 AM to 6:59 AM | 57 (7.3%) | 105 (12.5%) |
| 7:00 AM to 7:29 AM | 88 (11.3%) | 38 (4.5%) |
| 7:30 AM to 7:59 AM | 98 (12.6%) | 270 (32.1%) |
| 8:00 AM to 8:29 AM | 66 (8.5%) | 52 (6.2%) |
| 8:30 AM to 8:59 AM | 118 (15.2%) | 87 (10.3%) |
| 9:00 AM to 9:59 AM | 74 (9.5%) | 0 (0.0%) |
| 10:00 AM to 10:59 AM | 34 (4.4%) | 20 (2.4%) |
| 11:00 AM to 11:59 AM | 5 (0.6%) | 0 (0.0%) |
| 12:00 PM to 3:59 PM | 0 (0.0%) | 72 (8.6%) |
| 4:00 PM to 11:59 PM | 87 (11.2%) | 17 (2.0%) |
| Total | 778 (100.0%) | 842 (100.0%) |
Housing Occupancy in Big Stone Gap
Occupancy by Ownership in Big Stone Gap
Of the total 1,623 dwellings in Big Stone Gap, owner-occupied units account for 801 (49.3%), while renter-occupied units make up 822 (50.6%).
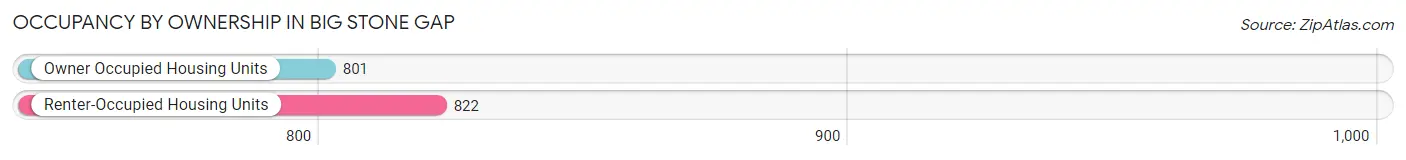
| Occupancy | # Housing Units | % Housing Units |
| Owner Occupied Housing Units | 801 | 49.3% |
| Renter-Occupied Housing Units | 822 | 50.6% |
| Total Occupied Housing Units | 1,623 | 100.0% |
Occupancy by Household Size in Big Stone Gap
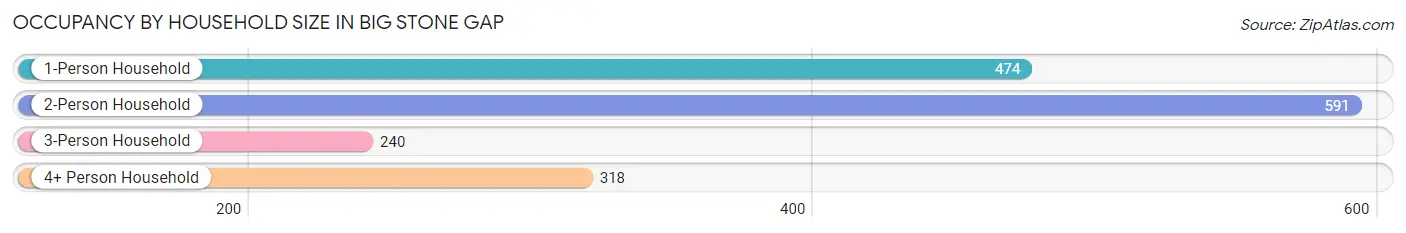
| Household Size | # Housing Units | % Housing Units |
| 1-Person Household | 474 | 29.2% |
| 2-Person Household | 591 | 36.4% |
| 3-Person Household | 240 | 14.8% |
| 4+ Person Household | 318 | 19.6% |
| Total Housing Units | 1,623 | 100.0% |
Occupancy by Ownership by Household Size in Big Stone Gap
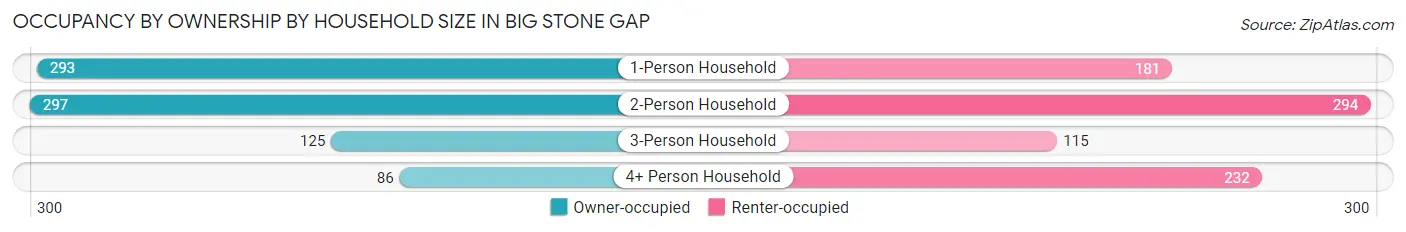
| Household Size | Owner-occupied | Renter-occupied |
| 1-Person Household | 293 (61.8%) | 181 (38.2%) |
| 2-Person Household | 297 (50.2%) | 294 (49.7%) |
| 3-Person Household | 125 (52.1%) | 115 (47.9%) |
| 4+ Person Household | 86 (27.0%) | 232 (73.0%) |
| Total Housing Units | 801 (49.3%) | 822 (50.6%) |
Occupancy by Educational Attainment in Big Stone Gap
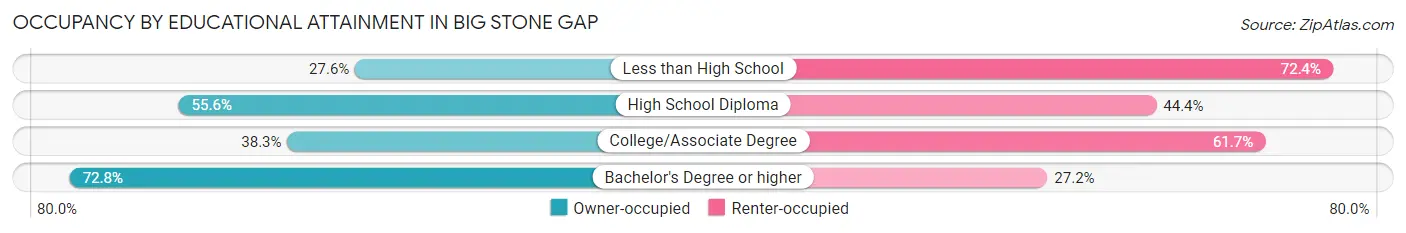
| Household Size | Owner-occupied | Renter-occupied |
| Less than High School | 67 (27.6%) | 176 (72.4%) |
| High School Diploma | 145 (55.6%) | 116 (44.4%) |
| College/Associate Degree | 251 (38.3%) | 404 (61.7%) |
| Bachelor's Degree or higher | 338 (72.8%) | 126 (27.2%) |
Occupancy by Age of Householder in Big Stone Gap
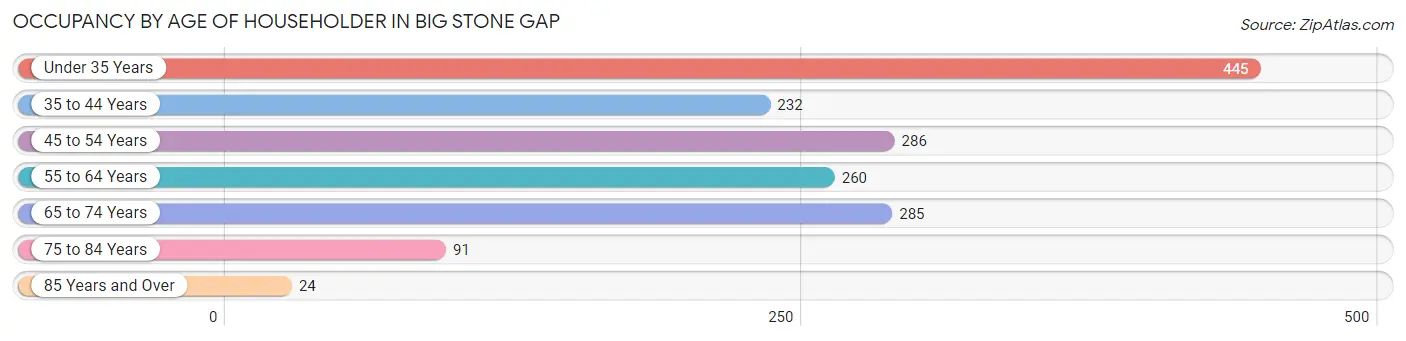
| Age Bracket | # Households | % Households |
| Under 35 Years | 445 | 27.4% |
| 35 to 44 Years | 232 | 14.3% |
| 45 to 54 Years | 286 | 17.6% |
| 55 to 64 Years | 260 | 16.0% |
| 65 to 74 Years | 285 | 17.6% |
| 75 to 84 Years | 91 | 5.6% |
| 85 Years and Over | 24 | 1.5% |
| Total | 1,623 | 100.0% |
Housing Finances in Big Stone Gap
Median Income by Occupancy in Big Stone Gap
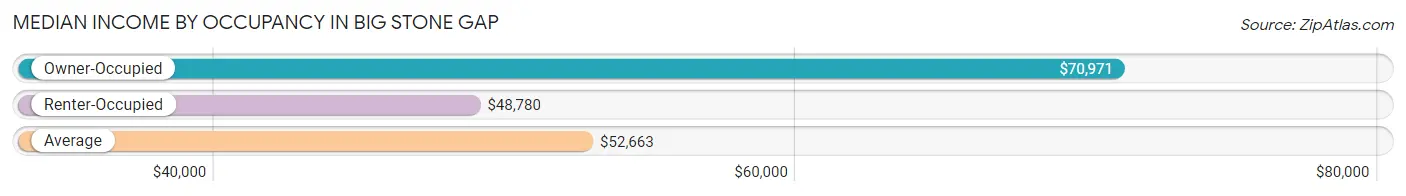
| Occupancy Type | # Households | Median Income |
| Owner-Occupied | 801 (49.3%) | $70,971 |
| Renter-Occupied | 822 (50.6%) | $48,780 |
| Average | 1,623 (100.0%) | $52,663 |
Occupancy by Householder Income Bracket in Big Stone Gap
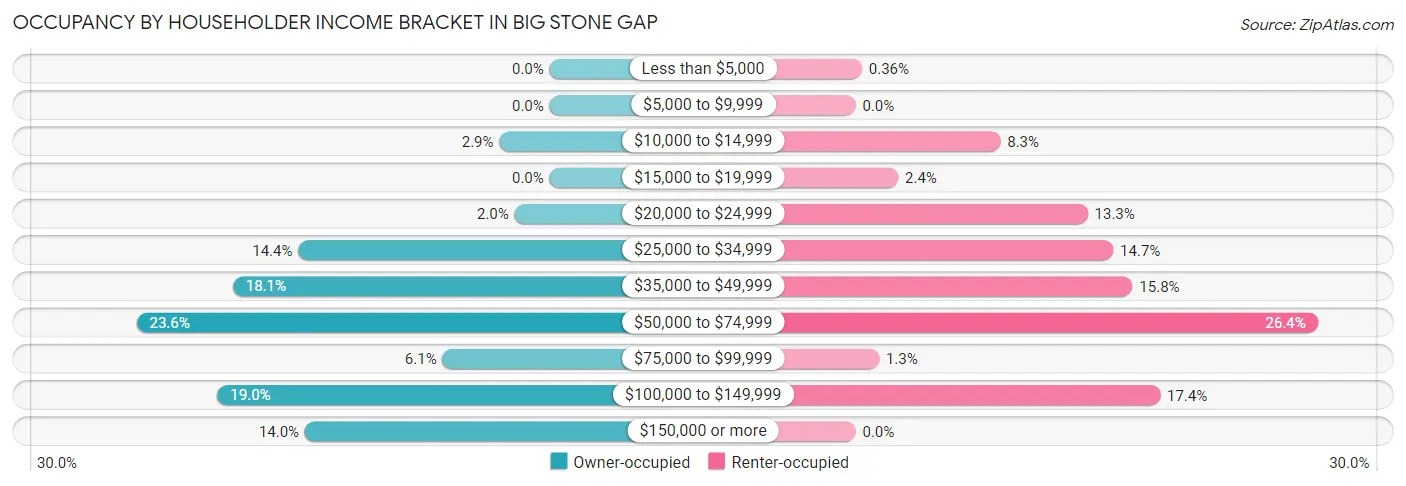
| Income Bracket | Owner-occupied | Renter-occupied |
| Less than $5,000 | 0 (0.0%) | 3 (0.4%) |
| $5,000 to $9,999 | 0 (0.0%) | 0 (0.0%) |
| $10,000 to $14,999 | 23 (2.9%) | 68 (8.3%) |
| $15,000 to $19,999 | 0 (0.0%) | 20 (2.4%) |
| $20,000 to $24,999 | 16 (2.0%) | 109 (13.3%) |
| $25,000 to $34,999 | 115 (14.4%) | 121 (14.7%) |
| $35,000 to $49,999 | 145 (18.1%) | 130 (15.8%) |
| $50,000 to $74,999 | 189 (23.6%) | 217 (26.4%) |
| $75,000 to $99,999 | 49 (6.1%) | 11 (1.3%) |
| $100,000 to $149,999 | 152 (19.0%) | 143 (17.4%) |
| $150,000 or more | 112 (14.0%) | 0 (0.0%) |
| Total | 801 (100.0%) | 822 (100.0%) |
Monthly Housing Cost Tiers in Big Stone Gap
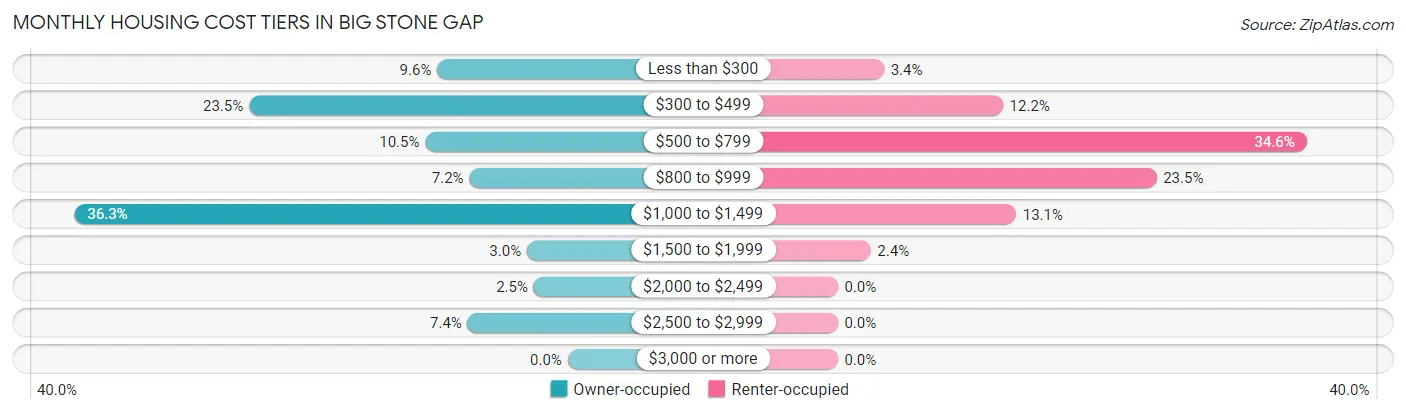
| Monthly Cost | Owner-occupied | Renter-occupied |
| Less than $300 | 77 (9.6%) | 28 (3.4%) |
| $300 to $499 | 188 (23.5%) | 100 (12.2%) |
| $500 to $799 | 84 (10.5%) | 284 (34.5%) |
| $800 to $999 | 58 (7.2%) | 193 (23.5%) |
| $1,000 to $1,499 | 291 (36.3%) | 108 (13.1%) |
| $1,500 to $1,999 | 24 (3.0%) | 20 (2.4%) |
| $2,000 to $2,499 | 20 (2.5%) | 0 (0.0%) |
| $2,500 to $2,999 | 59 (7.4%) | 0 (0.0%) |
| $3,000 or more | 0 (0.0%) | 0 (0.0%) |
| Total | 801 (100.0%) | 822 (100.0%) |
Physical Housing Characteristics in Big Stone Gap
Housing Structures in Big Stone Gap
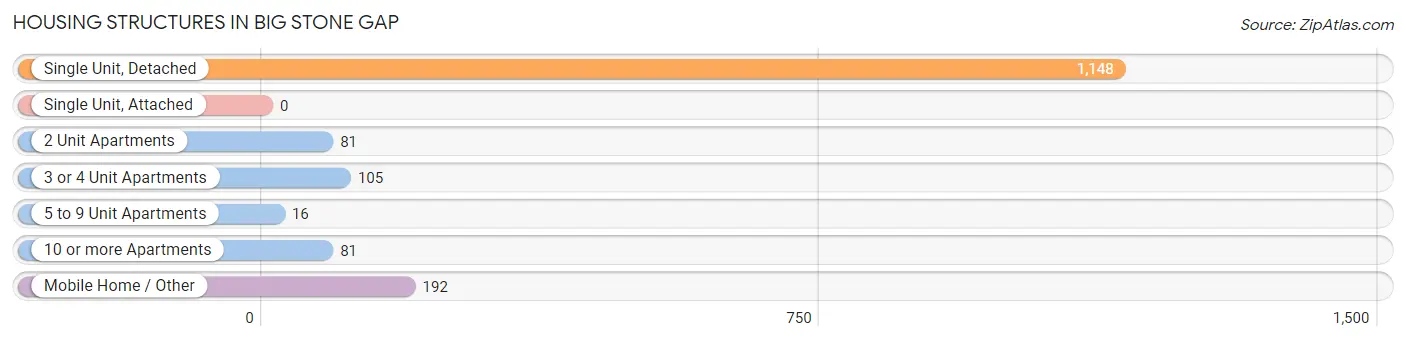
| Structure Type | # Housing Units | % Housing Units |
| Single Unit, Detached | 1,148 | 70.7% |
| Single Unit, Attached | 0 | 0.0% |
| 2 Unit Apartments | 81 | 5.0% |
| 3 or 4 Unit Apartments | 105 | 6.5% |
| 5 to 9 Unit Apartments | 16 | 1.0% |
| 10 or more Apartments | 81 | 5.0% |
| Mobile Home / Other | 192 | 11.8% |
| Total | 1,623 | 100.0% |
Housing Structures by Occupancy in Big Stone Gap
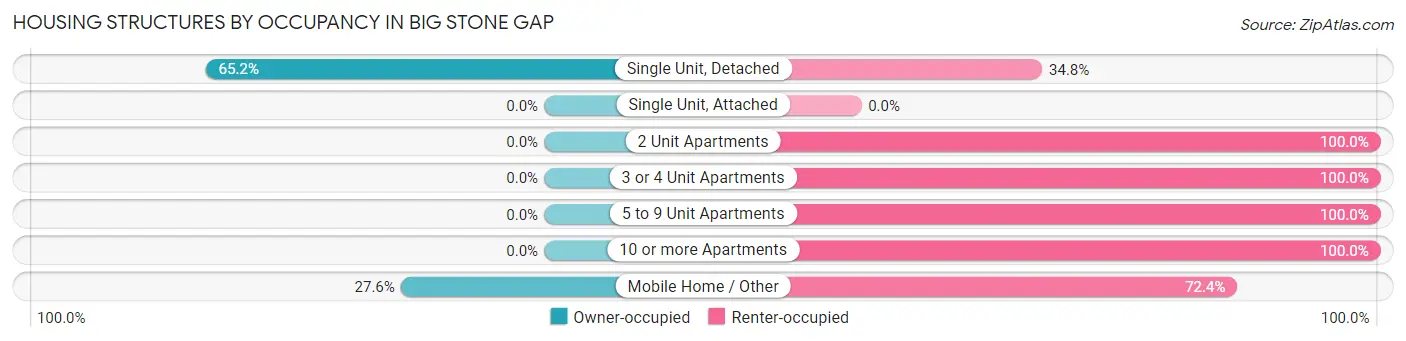
| Structure Type | Owner-occupied | Renter-occupied |
| Single Unit, Detached | 748 (65.2%) | 400 (34.8%) |
| Single Unit, Attached | 0 (0.0%) | 0 (0.0%) |
| 2 Unit Apartments | 0 (0.0%) | 81 (100.0%) |
| 3 or 4 Unit Apartments | 0 (0.0%) | 105 (100.0%) |
| 5 to 9 Unit Apartments | 0 (0.0%) | 16 (100.0%) |
| 10 or more Apartments | 0 (0.0%) | 81 (100.0%) |
| Mobile Home / Other | 53 (27.6%) | 139 (72.4%) |
| Total | 801 (49.3%) | 822 (50.6%) |
Housing Structures by Number of Rooms in Big Stone Gap
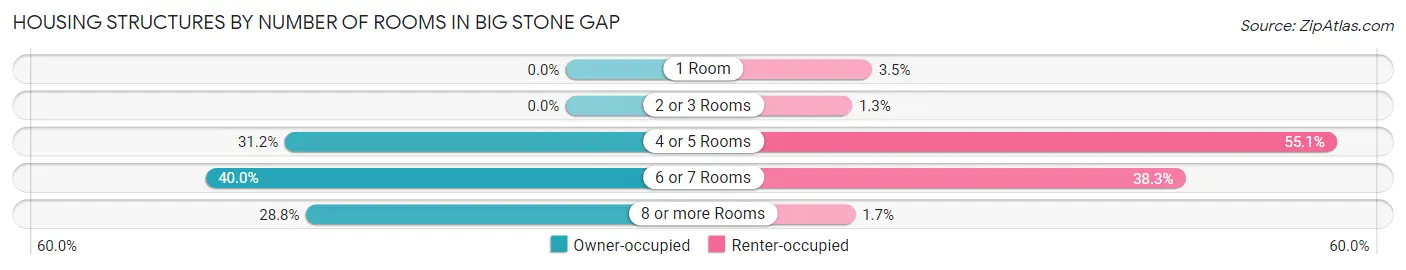
| Number of Rooms | Owner-occupied | Renter-occupied |
| 1 Room | 0 (0.0%) | 29 (3.5%) |
| 2 or 3 Rooms | 0 (0.0%) | 11 (1.3%) |
| 4 or 5 Rooms | 250 (31.2%) | 453 (55.1%) |
| 6 or 7 Rooms | 320 (40.0%) | 315 (38.3%) |
| 8 or more Rooms | 231 (28.8%) | 14 (1.7%) |
| Total | 801 (100.0%) | 822 (100.0%) |
Housing Structure by Heating Type in Big Stone Gap
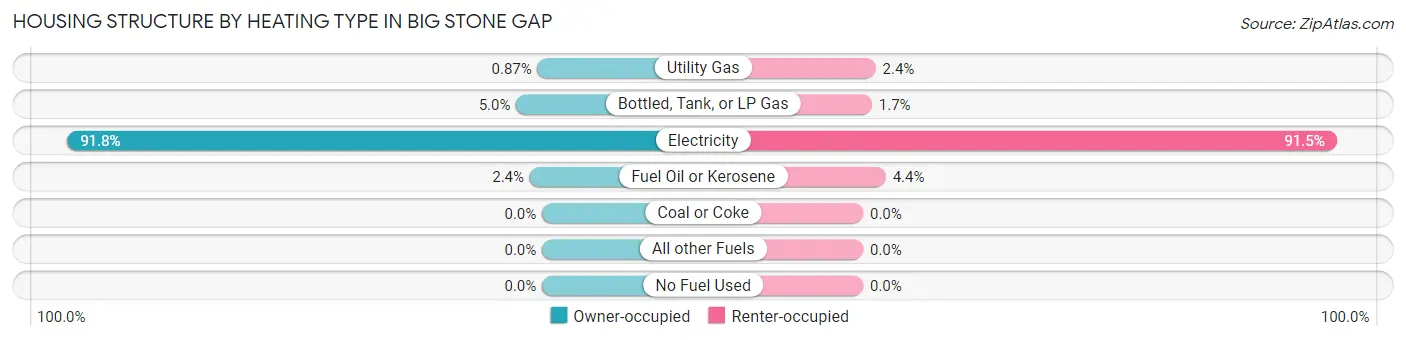
| Heating Type | Owner-occupied | Renter-occupied |
| Utility Gas | 7 (0.9%) | 20 (2.4%) |
| Bottled, Tank, or LP Gas | 40 (5.0%) | 14 (1.7%) |
| Electricity | 735 (91.8%) | 752 (91.5%) |
| Fuel Oil or Kerosene | 19 (2.4%) | 36 (4.4%) |
| Coal or Coke | 0 (0.0%) | 0 (0.0%) |
| All other Fuels | 0 (0.0%) | 0 (0.0%) |
| No Fuel Used | 0 (0.0%) | 0 (0.0%) |
| Total | 801 (100.0%) | 822 (100.0%) |
Household Vehicle Usage in Big Stone Gap
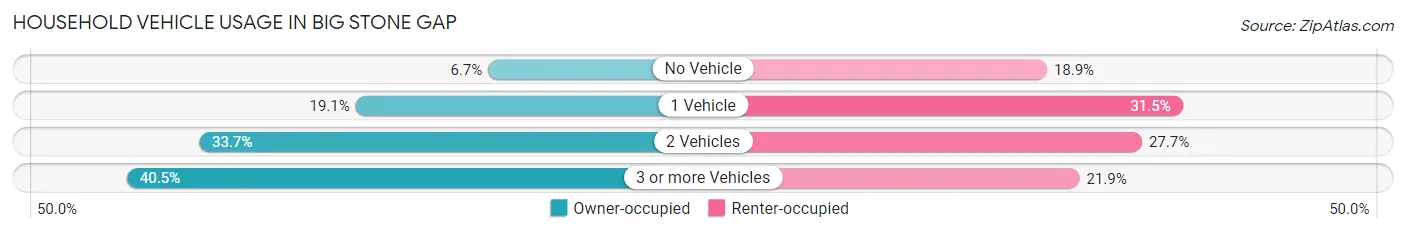
| Vehicles per Household | Owner-occupied | Renter-occupied |
| No Vehicle | 54 (6.7%) | 155 (18.9%) |
| 1 Vehicle | 153 (19.1%) | 259 (31.5%) |
| 2 Vehicles | 270 (33.7%) | 228 (27.7%) |
| 3 or more Vehicles | 324 (40.5%) | 180 (21.9%) |
| Total | 801 (100.0%) | 822 (100.0%) |
Real Estate & Mortgages in Big Stone Gap
Real Estate and Mortgage Overview in Big Stone Gap
| Characteristic | Without Mortgage | With Mortgage |
| Housing Units | 274 | 527 |
| Median Property Value | $86,700 | $181,400 |
| Median Household Income | $42,661 | $89 |
| Monthly Housing Costs | $379 | $0 |
| Real Estate Taxes | $590 | $0 |
Property Value by Mortgage Status in Big Stone Gap
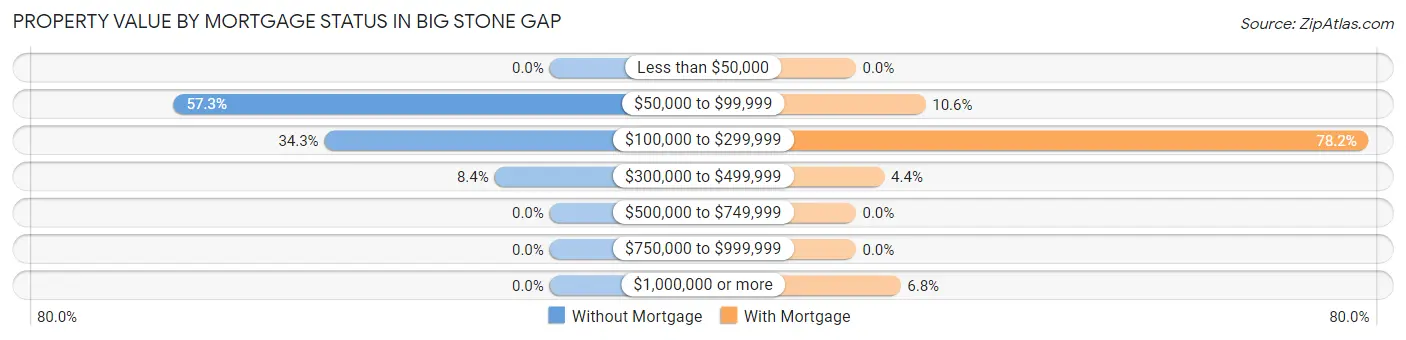
| Property Value | Without Mortgage | With Mortgage |
| Less than $50,000 | 0 (0.0%) | 0 (0.0%) |
| $50,000 to $99,999 | 157 (57.3%) | 56 (10.6%) |
| $100,000 to $299,999 | 94 (34.3%) | 412 (78.2%) |
| $300,000 to $499,999 | 23 (8.4%) | 23 (4.4%) |
| $500,000 to $749,999 | 0 (0.0%) | 0 (0.0%) |
| $750,000 to $999,999 | 0 (0.0%) | 0 (0.0%) |
| $1,000,000 or more | 0 (0.0%) | 36 (6.8%) |
| Total | 274 (100.0%) | 527 (100.0%) |
Household Income by Mortgage Status in Big Stone Gap
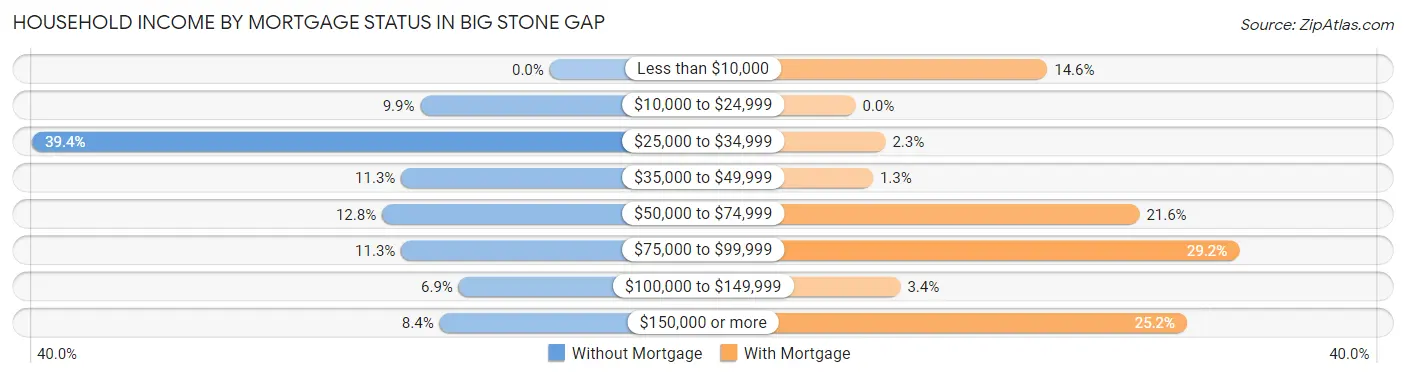
| Household Income | Without Mortgage | With Mortgage |
| Less than $10,000 | 0 (0.0%) | 77 (14.6%) |
| $10,000 to $24,999 | 27 (9.9%) | 0 (0.0%) |
| $25,000 to $34,999 | 108 (39.4%) | 12 (2.3%) |
| $35,000 to $49,999 | 31 (11.3%) | 7 (1.3%) |
| $50,000 to $74,999 | 35 (12.8%) | 114 (21.6%) |
| $75,000 to $99,999 | 31 (11.3%) | 154 (29.2%) |
| $100,000 to $149,999 | 19 (6.9%) | 18 (3.4%) |
| $150,000 or more | 23 (8.4%) | 133 (25.2%) |
| Total | 274 (100.0%) | 527 (100.0%) |
Property Value to Household Income Ratio in Big Stone Gap
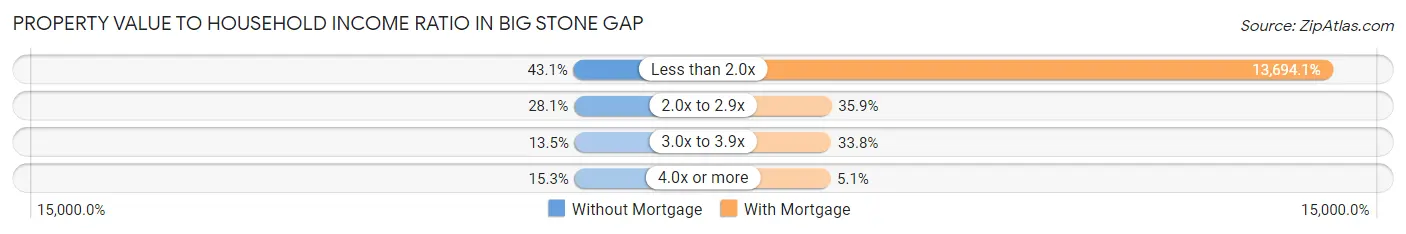
| Value-to-Income Ratio | Without Mortgage | With Mortgage |
| Less than 2.0x | 118 (43.1%) | 72,168 (13,694.1%) |
| 2.0x to 2.9x | 77 (28.1%) | 189 (35.9%) |
| 3.0x to 3.9x | 37 (13.5%) | 178 (33.8%) |
| 4.0x or more | 42 (15.3%) | 27 (5.1%) |
| Total | 274 (100.0%) | 527 (100.0%) |
Real Estate Taxes by Mortgage Status in Big Stone Gap
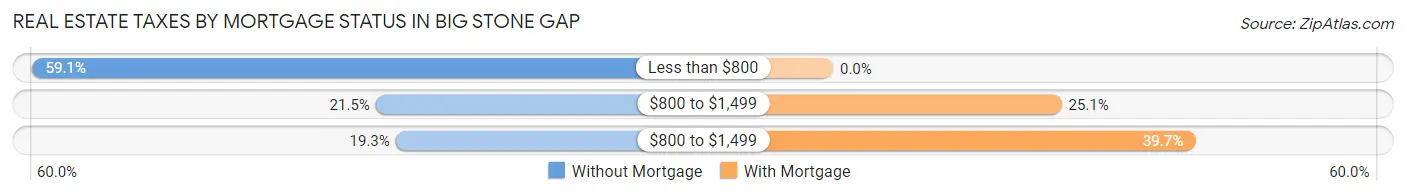
| Property Taxes | Without Mortgage | With Mortgage |
| Less than $800 | 162 (59.1%) | 0 (0.0%) |
| $800 to $1,499 | 59 (21.5%) | 132 (25.1%) |
| $800 to $1,499 | 53 (19.3%) | 209 (39.7%) |
| Total | 274 (100.0%) | 527 (100.0%) |
Health & Disability in Big Stone Gap
Health Insurance Coverage by Age in Big Stone Gap
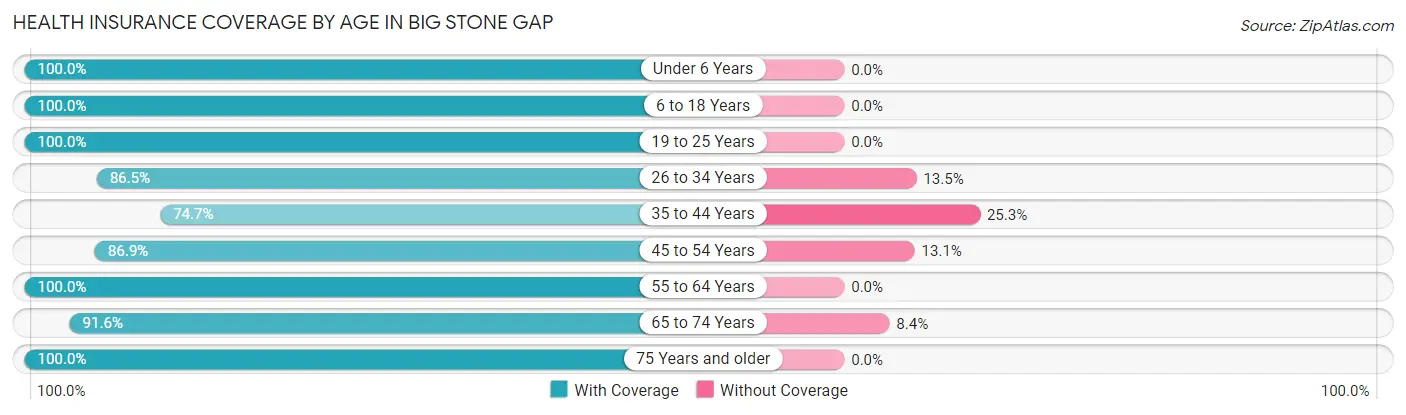
| Age Bracket | With Coverage | Without Coverage |
| Under 6 Years | 255 (100.0%) | 0 (0.0%) |
| 6 to 18 Years | 890 (100.0%) | 0 (0.0%) |
| 19 to 25 Years | 248 (100.0%) | 0 (0.0%) |
| 26 to 34 Years | 360 (86.5%) | 56 (13.5%) |
| 35 to 44 Years | 434 (74.7%) | 147 (25.3%) |
| 45 to 54 Years | 437 (86.9%) | 66 (13.1%) |
| 55 to 64 Years | 434 (100.0%) | 0 (0.0%) |
| 65 to 74 Years | 381 (91.6%) | 35 (8.4%) |
| 75 Years and older | 149 (100.0%) | 0 (0.0%) |
| Total | 3,588 (92.2%) | 304 (7.8%) |
Health Insurance Coverage by Citizenship Status in Big Stone Gap
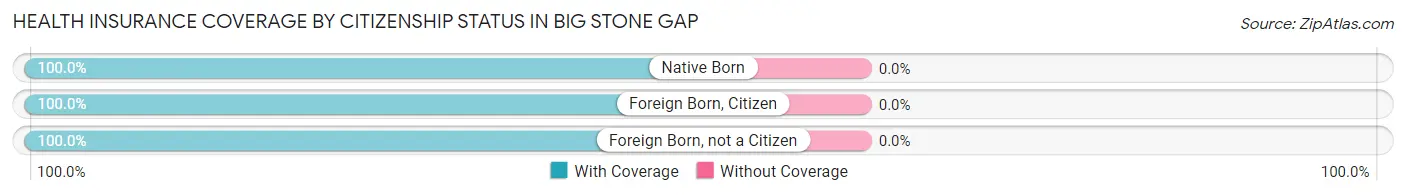
| Citizenship Status | With Coverage | Without Coverage |
| Native Born | 255 (100.0%) | 0 (0.0%) |
| Foreign Born, Citizen | 890 (100.0%) | 0 (0.0%) |
| Foreign Born, not a Citizen | 248 (100.0%) | 0 (0.0%) |
Health Insurance Coverage by Household Income in Big Stone Gap
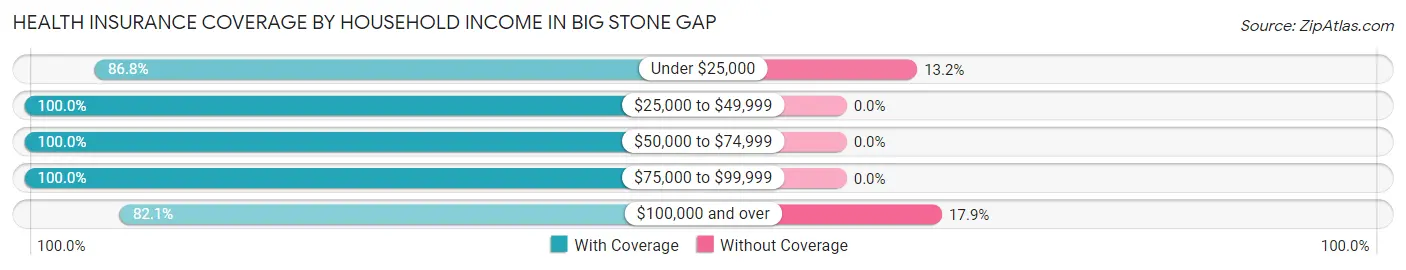
| Household Income | With Coverage | Without Coverage |
| Under $25,000 | 474 (86.8%) | 72 (13.2%) |
| $25,000 to $49,999 | 994 (100.0%) | 0 (0.0%) |
| $50,000 to $74,999 | 920 (100.0%) | 0 (0.0%) |
| $75,000 to $99,999 | 164 (100.0%) | 0 (0.0%) |
| $100,000 and over | 1,025 (82.1%) | 223 (17.9%) |
Public vs Private Health Insurance Coverage by Age in Big Stone Gap
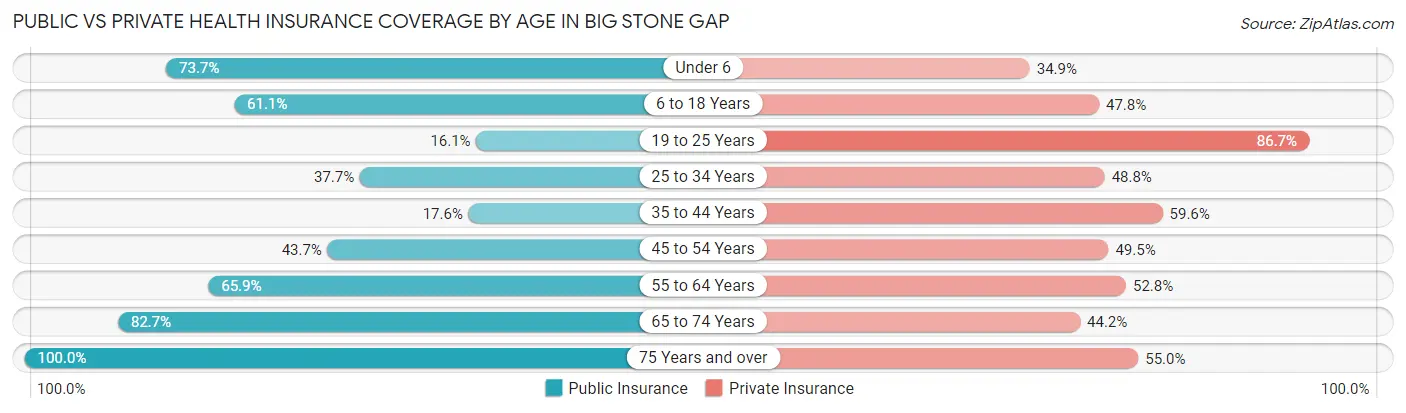
| Age Bracket | Public Insurance | Private Insurance |
| Under 6 | 188 (73.7%) | 89 (34.9%) |
| 6 to 18 Years | 544 (61.1%) | 425 (47.7%) |
| 19 to 25 Years | 40 (16.1%) | 215 (86.7%) |
| 25 to 34 Years | 157 (37.7%) | 203 (48.8%) |
| 35 to 44 Years | 102 (17.6%) | 346 (59.6%) |
| 45 to 54 Years | 220 (43.7%) | 249 (49.5%) |
| 55 to 64 Years | 286 (65.9%) | 229 (52.8%) |
| 65 to 74 Years | 344 (82.7%) | 184 (44.2%) |
| 75 Years and over | 149 (100.0%) | 82 (55.0%) |
| Total | 2,030 (52.2%) | 2,022 (51.9%) |
Disability Status by Sex by Age in Big Stone Gap
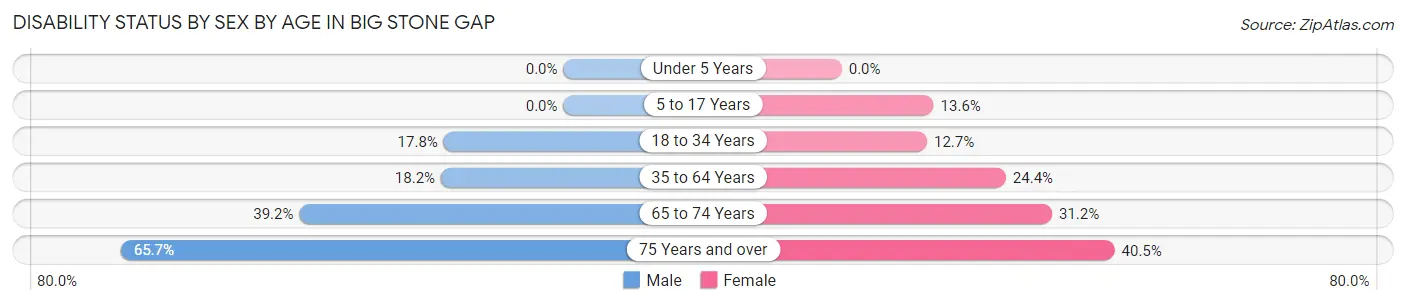
| Age Bracket | Male | Female |
| Under 5 Years | 0 (0.0%) | 0 (0.0%) |
| 5 to 17 Years | 0 (0.0%) | 69 (13.6%) |
| 18 to 34 Years | 67 (17.8%) | 48 (12.7%) |
| 35 to 64 Years | 138 (18.2%) | 185 (24.4%) |
| 65 to 74 Years | 89 (39.2%) | 59 (31.2%) |
| 75 Years and over | 46 (65.7%) | 32 (40.5%) |
Disability Class by Sex by Age in Big Stone Gap
Disability Class: Hearing Difficulty
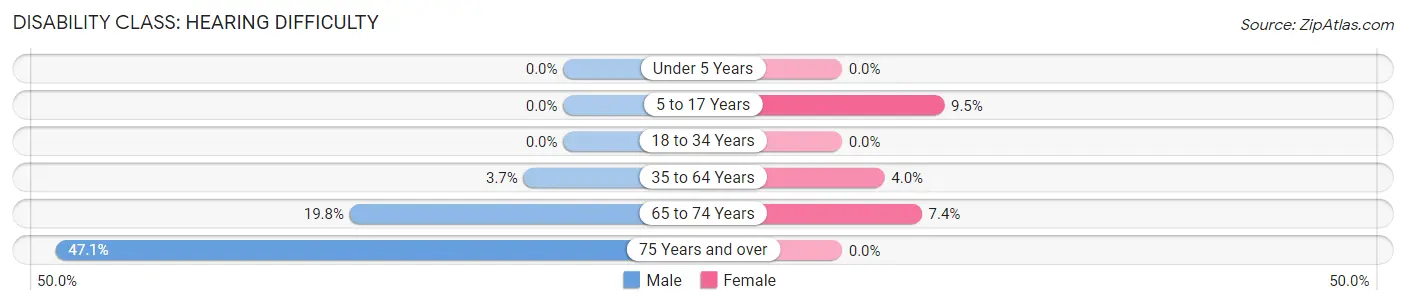
| Age Bracket | Male | Female |
| Under 5 Years | 0 (0.0%) | 0 (0.0%) |
| 5 to 17 Years | 0 (0.0%) | 48 (9.5%) |
| 18 to 34 Years | 0 (0.0%) | 0 (0.0%) |
| 35 to 64 Years | 28 (3.7%) | 30 (4.0%) |
| 65 to 74 Years | 45 (19.8%) | 14 (7.4%) |
| 75 Years and over | 33 (47.1%) | 0 (0.0%) |
Disability Class: Vision Difficulty
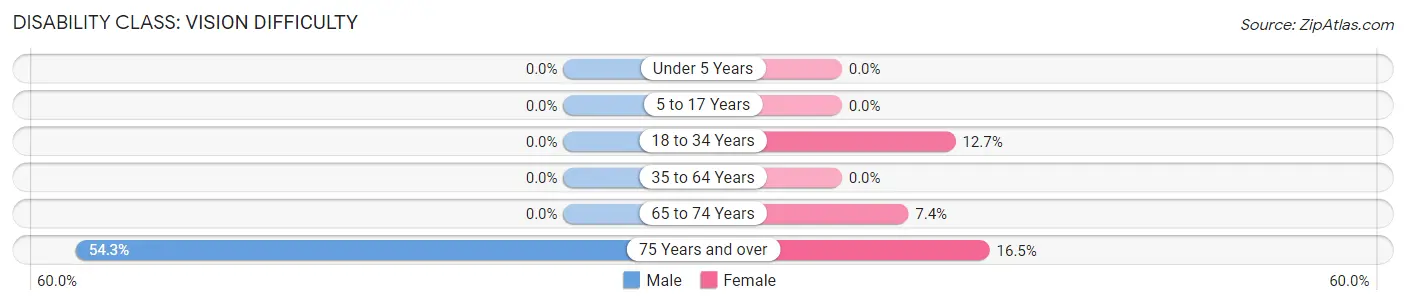
| Age Bracket | Male | Female |
| Under 5 Years | 0 (0.0%) | 0 (0.0%) |
| 5 to 17 Years | 0 (0.0%) | 0 (0.0%) |
| 18 to 34 Years | 0 (0.0%) | 48 (12.7%) |
| 35 to 64 Years | 0 (0.0%) | 0 (0.0%) |
| 65 to 74 Years | 0 (0.0%) | 14 (7.4%) |
| 75 Years and over | 38 (54.3%) | 13 (16.5%) |
Disability Class: Cognitive Difficulty
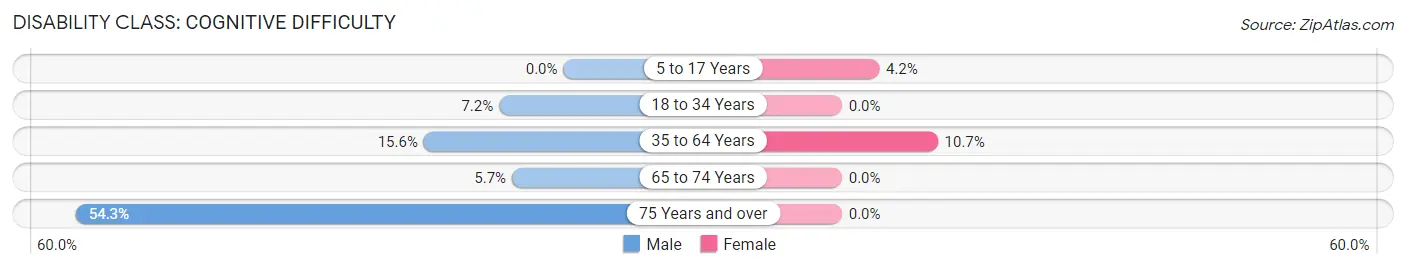
| Age Bracket | Male | Female |
| 5 to 17 Years | 0 (0.0%) | 21 (4.2%) |
| 18 to 34 Years | 27 (7.2%) | 0 (0.0%) |
| 35 to 64 Years | 118 (15.5%) | 81 (10.7%) |
| 65 to 74 Years | 13 (5.7%) | 0 (0.0%) |
| 75 Years and over | 38 (54.3%) | 0 (0.0%) |
Disability Class: Ambulatory Difficulty
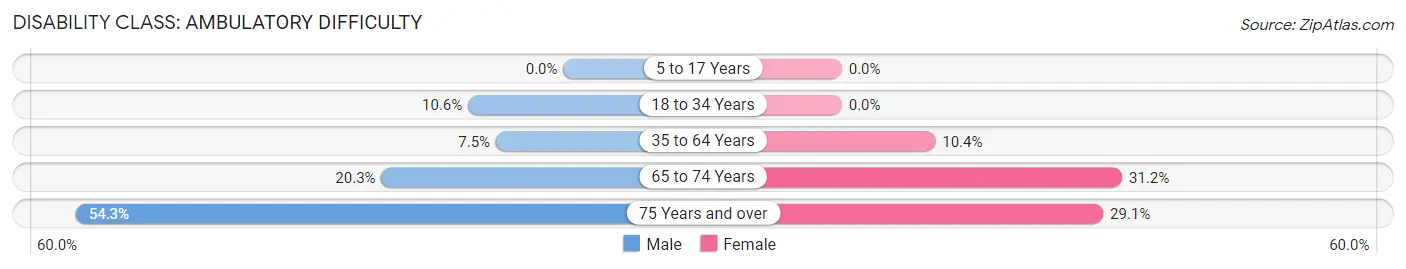
| Age Bracket | Male | Female |
| 5 to 17 Years | 0 (0.0%) | 0 (0.0%) |
| 18 to 34 Years | 40 (10.6%) | 0 (0.0%) |
| 35 to 64 Years | 57 (7.5%) | 79 (10.4%) |
| 65 to 74 Years | 46 (20.3%) | 59 (31.2%) |
| 75 Years and over | 38 (54.3%) | 23 (29.1%) |
Disability Class: Self-Care Difficulty
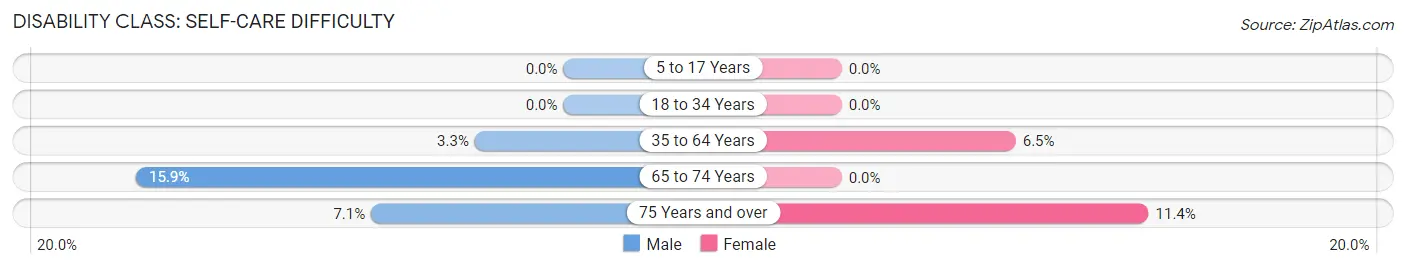
| Age Bracket | Male | Female |
| 5 to 17 Years | 0 (0.0%) | 0 (0.0%) |
| 18 to 34 Years | 0 (0.0%) | 0 (0.0%) |
| 35 to 64 Years | 25 (3.3%) | 49 (6.5%) |
| 65 to 74 Years | 36 (15.9%) | 0 (0.0%) |
| 75 Years and over | 5 (7.1%) | 9 (11.4%) |
Technology Access in Big Stone Gap
Computing Device Access in Big Stone Gap
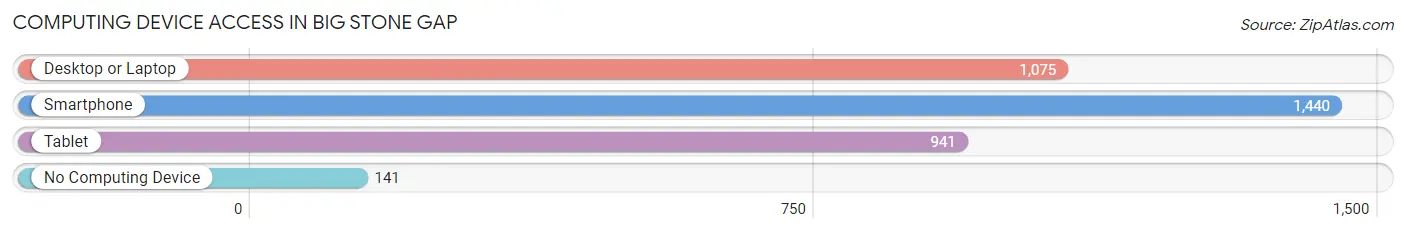
| Device Type | # Households | % Households |
| Desktop or Laptop | 1,075 | 66.2% |
| Smartphone | 1,440 | 88.7% |
| Tablet | 941 | 58.0% |
| No Computing Device | 141 | 8.7% |
| Total | 1,623 | 100.0% |
Internet Access in Big Stone Gap
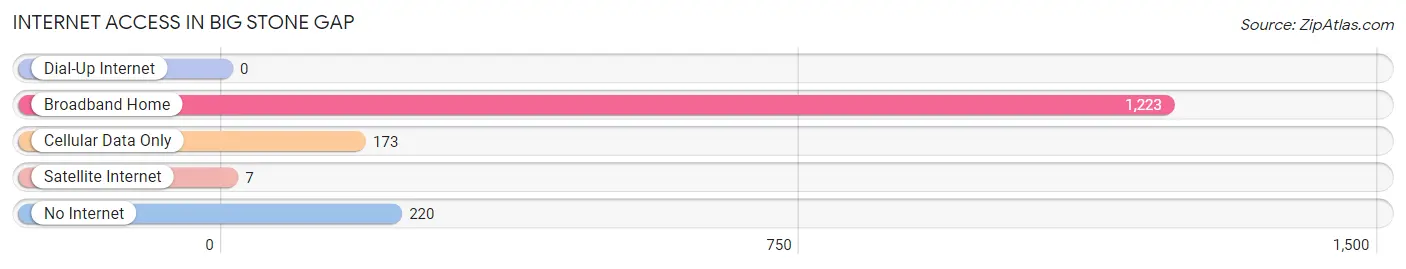
| Internet Type | # Households | % Households |
| Dial-Up Internet | 0 | 0.0% |
| Broadband Home | 1,223 | 75.3% |
| Cellular Data Only | 173 | 10.7% |
| Satellite Internet | 7 | 0.4% |
| No Internet | 220 | 13.6% |
| Total | 1,623 | 100.0% |
Big Stone Gap Summary
Stone Gap, Virginia is a small town located in Wise County in the Appalachian Mountains of Southwest Virginia. The town is situated in the Appalachian Plateau, which is a region of the Appalachian Mountains that is characterized by its rolling hills and valleys. The town is located at the intersection of US Route 23 and US Route 58, and is approximately 30 miles from the Kentucky border.
Stone Gap was founded in 1856 by a group of settlers from North Carolina. The town was named after a large boulder that was located near the original settlement. The town quickly grew and by the early 1900s, it had become a thriving coal mining town. The coal industry was the primary source of employment for the town’s residents, and the town was home to several coal mines.
The town’s economy was heavily dependent on the coal industry until the mid-1900s, when the industry began to decline. This led to a period of economic decline for the town, and many of the coal mines were closed. In the late 1970s, the town began to experience a resurgence in economic activity, as new businesses began to move into the area. Today, Stone Gap is home to a variety of businesses, including retail stores, restaurants, and professional services.
The population of Stone Gap in 2000 was 2,074. The town is predominantly white, with a small African American population. The median household income in 2000 was $25,945, and the median home value was $67,400. The town is served by the Wise County Public Schools system, and there are several private schools in the area.
Stone Gap is located in a rural area, and the town is surrounded by mountains and forests. The town is home to several parks and recreational areas, including the Big Stone Gap National Recreation Area. The town is also home to several historic sites, including the Big Stone Gap Historic District, which is listed on the National Register of Historic Places.
Stone Gap is a small town with a rich history and a vibrant economy. The town is home to a variety of businesses, and the town’s residents enjoy a high quality of life. The town is surrounded by beautiful scenery, and the town’s residents enjoy a variety of outdoor activities. Stone Gap is a great place to live, work, and play.
Common Questions
What is Per Capita Income in Big Stone Gap?
Per Capita income in Big Stone Gap is $22,376.
What is the Median Family Income in Big Stone Gap?
Median Family Income in Big Stone Gap is $70,370.
What is the Median Household income in Big Stone Gap?
Median Household Income in Big Stone Gap is $52,663.
What is Income or Wage Gap in Big Stone Gap?
Income or Wage Gap in Big Stone Gap is 9.5%.
Women in Big Stone Gap earn 90.5 cents for every dollar earned by a man.
What is Inequality or Gini Index in Big Stone Gap?
Inequality or Gini Index in Big Stone Gap is 0.37.
What is the Total Population of Big Stone Gap?
Total Population of Big Stone Gap is 5,221.
What is the Total Male Population of Big Stone Gap?
Total Male Population of Big Stone Gap is 3,093.
What is the Total Female Population of Big Stone Gap?
Total Female Population of Big Stone Gap is 2,128.
What is the Ratio of Males per 100 Females in Big Stone Gap?
There are 145.35 Males per 100 Females in Big Stone Gap.
What is the Ratio of Females per 100 Males in Big Stone Gap?
There are 68.80 Females per 100 Males in Big Stone Gap.
What is the Median Population Age in Big Stone Gap?
Median Population Age in Big Stone Gap is 38.3 Years.
What is the Average Family Size in Big Stone Gap
Average Family Size in Big Stone Gap is 2.9 People.
What is the Average Household Size in Big Stone Gap
Average Household Size in Big Stone Gap is 2.4 People.
How Large is the Labor Force in Big Stone Gap?
There are 1,922 People in the Labor Forcein in Big Stone Gap.
What is the Percentage of People in the Labor Force in Big Stone Gap?
45.5% of People are in the Labor Force in Big Stone Gap.
What is the Unemployment Rate in Big Stone Gap?
Unemployment Rate in Big Stone Gap is 11.7%.