Appomattox, VA Map & Demographics
Appomattox Map
Appomattox Overview
$23,615
PER CAPITA INCOME
$54,063
AVG FAMILY INCOME
$43,750
AVG HOUSEHOLD INCOME
47.0%
WAGE / INCOME GAP [ % ]
53.0¢/ $1
WAGE / INCOME GAP [ $ ]
0.40
INEQUALITY / GINI INDEX
2,157
TOTAL POPULATION
1,021
MALE POPULATION
1,136
FEMALE POPULATION
89.88
MALES / 100 FEMALES
111.26
FEMALES / 100 MALES
36.9
MEDIAN AGE
3.7
AVG FAMILY SIZE
2.5
AVG HOUSEHOLD SIZE
1,107
LABOR FORCE [ PEOPLE ]
64.7%
PERCENT IN LABOR FORCE
6.5%
UNEMPLOYMENT RATE
Appomattox Zip Codes
Appomattox Area Codes
Income in Appomattox
Income Overview in Appomattox
Per Capita Income in Appomattox is $23,615, while median incomes of families and households are $54,063 and $43,750 respectively.
| Characteristic | Number | Measure |
| Per Capita Income | 2,157 | $23,615 |
| Median Family Income | 447 | $54,063 |
| Mean Family Income | 447 | $64,413 |
| Median Household Income | 829 | $43,750 |
| Mean Household Income | 829 | $53,305 |
| Income Deficit | 447 | $0 |
| Wage / Income Gap (%) | 2,157 | 47.00% |
| Wage / Income Gap ($) | 2,157 | 53.00¢ per $1 |
| Gini / Inequality Index | 2,157 | 0.40 |
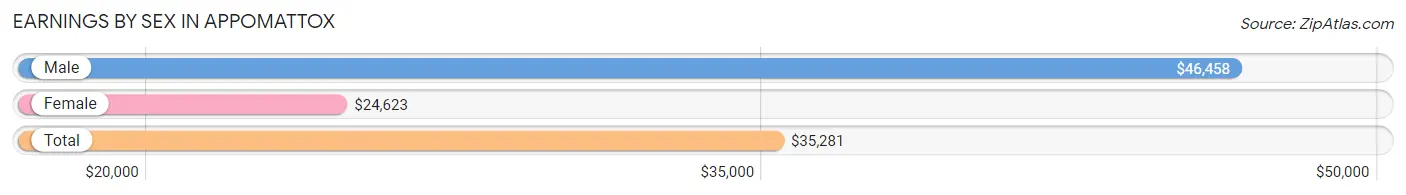
Earnings by Sex in Appomattox
Average Earnings in Appomattox are $35,281, $46,458 for men and $24,623 for women, a difference of 47.0%.
| Sex | Number | Average Earnings |
| Male | 510 (46.9%) | $46,458 |
| Female | 578 (53.1%) | $24,623 |
| Total | 1,088 (100.0%) | $35,281 |
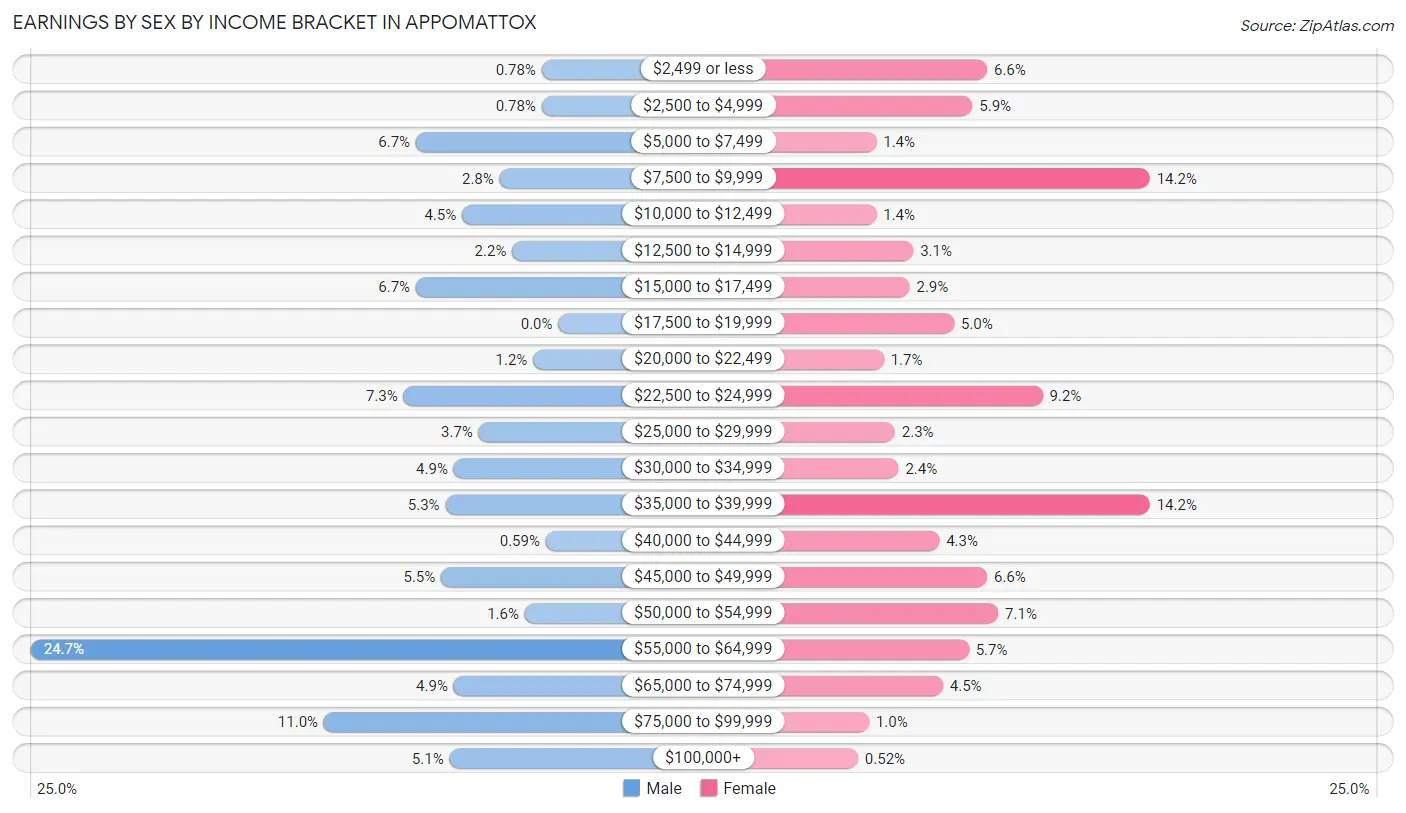
Earnings by Sex by Income Bracket in Appomattox
The most common earnings brackets in Appomattox are $55,000 to $64,999 for men (126 | 24.7%) and $7,500 to $9,999 for women (82 | 14.2%).
| Income | Male | Female |
| $2,499 or less | 4 (0.8%) | 38 (6.6%) |
| $2,500 to $4,999 | 4 (0.8%) | 34 (5.9%) |
| $5,000 to $7,499 | 34 (6.7%) | 8 (1.4%) |
| $7,500 to $9,999 | 14 (2.8%) | 82 (14.2%) |
| $10,000 to $12,499 | 23 (4.5%) | 8 (1.4%) |
| $12,500 to $14,999 | 11 (2.2%) | 18 (3.1%) |
| $15,000 to $17,499 | 34 (6.7%) | 17 (2.9%) |
| $17,500 to $19,999 | 0 (0.0%) | 29 (5.0%) |
| $20,000 to $22,499 | 6 (1.2%) | 10 (1.7%) |
| $22,500 to $24,999 | 37 (7.2%) | 53 (9.2%) |
| $25,000 to $29,999 | 19 (3.7%) | 13 (2.2%) |
| $30,000 to $34,999 | 25 (4.9%) | 14 (2.4%) |
| $35,000 to $39,999 | 27 (5.3%) | 82 (14.2%) |
| $40,000 to $44,999 | 3 (0.6%) | 25 (4.3%) |
| $45,000 to $49,999 | 28 (5.5%) | 38 (6.6%) |
| $50,000 to $54,999 | 8 (1.6%) | 41 (7.1%) |
| $55,000 to $64,999 | 126 (24.7%) | 33 (5.7%) |
| $65,000 to $74,999 | 25 (4.9%) | 26 (4.5%) |
| $75,000 to $99,999 | 56 (11.0%) | 6 (1.0%) |
| $100,000+ | 26 (5.1%) | 3 (0.5%) |
| Total | 510 (100.0%) | 578 (100.0%) |
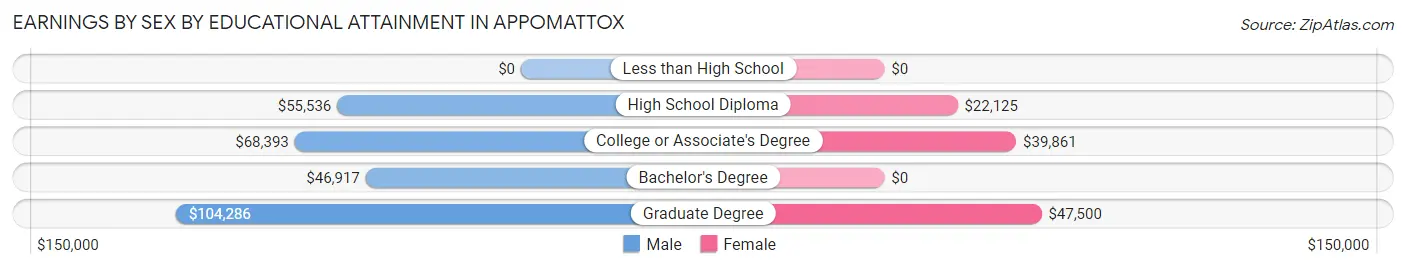
Earnings by Sex by Educational Attainment in Appomattox
Average earnings in Appomattox are $56,860 for men and $29,904 for women, a difference of 47.4%. Men with an educational attainment of graduate degree enjoy the highest average annual earnings of $104,286, while those with bachelor's degree education earn the least with $46,917. Women with an educational attainment of graduate degree earn the most with the average annual earnings of $47,500, while those with high school diploma education have the smallest earnings of $22,125.
| Educational Attainment | Male Income | Female Income |
| Less than High School | - | - |
| High School Diploma | $55,536 | $22,125 |
| College or Associate's Degree | $68,393 | $39,861 |
| Bachelor's Degree | $46,917 | $0 |
| Graduate Degree | $104,286 | $47,500 |
| Total | $56,860 | $29,904 |
Family Income in Appomattox
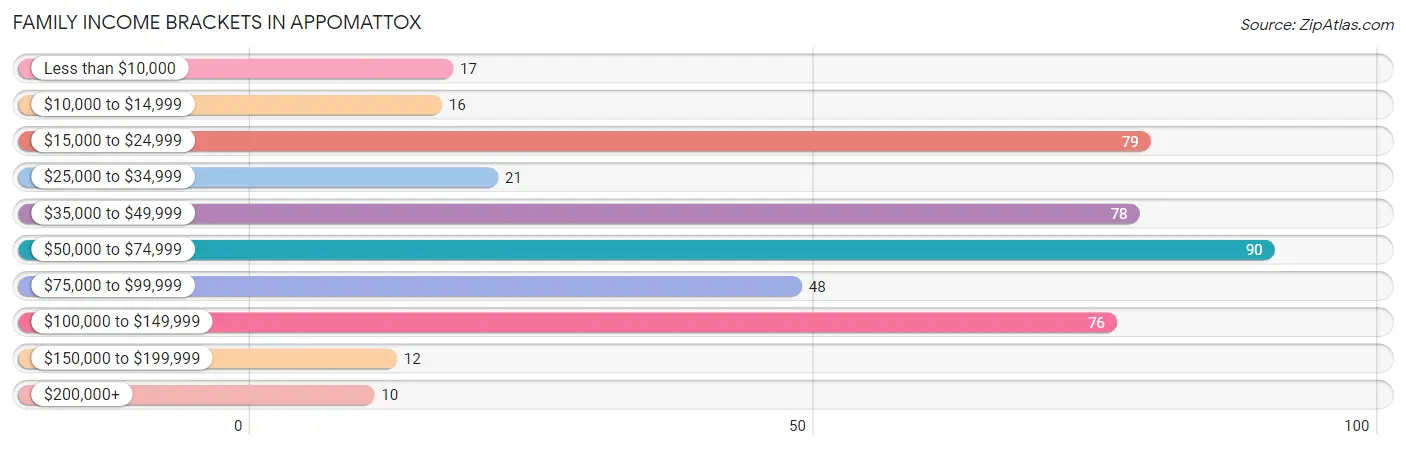
Family Income Brackets in Appomattox
According to the Appomattox family income data, there are 90 families falling into the $50,000 to $74,999 income range, which is the most common income bracket and makes up 20.1% of all families. Conversely, the $200,000+ income bracket is the least frequent group with only 10 families (2.2%) belonging to this category.
| Income Bracket | # Families | % Families |
| Less than $10,000 | 17 | 3.8% |
| $10,000 to $14,999 | 16 | 3.6% |
| $15,000 to $24,999 | 79 | 17.7% |
| $25,000 to $34,999 | 21 | 4.7% |
| $35,000 to $49,999 | 78 | 17.4% |
| $50,000 to $74,999 | 90 | 20.1% |
| $75,000 to $99,999 | 48 | 10.7% |
| $100,000 to $149,999 | 76 | 17.0% |
| $150,000 to $199,999 | 12 | 2.7% |
| $200,000+ | 10 | 2.2% |
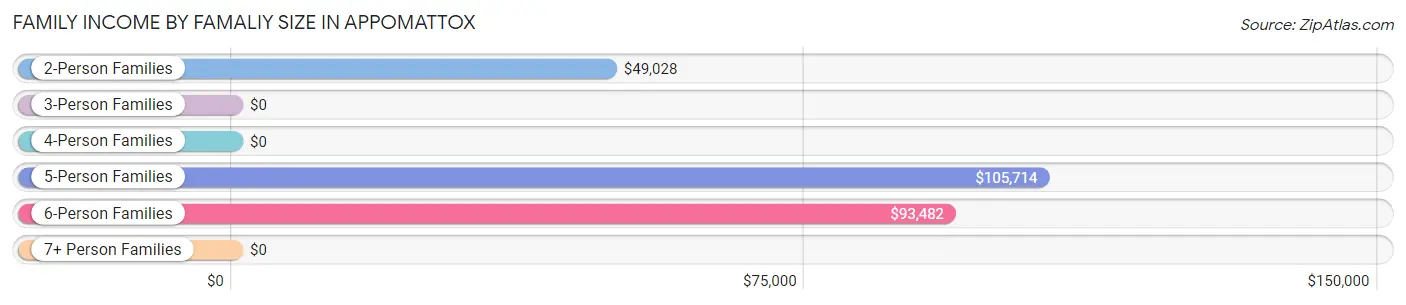
Family Income by Famaliy Size in Appomattox
5-person families (32 | 7.2%) account for the highest median family income in Appomattox with $105,714 per family, while 2-person families (187 | 41.8%) have the highest median income of $24,514 per family member.
| Income Bracket | # Families | Median Income |
| 2-Person Families | 187 (41.8%) | $49,028 |
| 3-Person Families | 89 (19.9%) | $0 |
| 4-Person Families | 98 (21.9%) | $0 |
| 5-Person Families | 32 (7.2%) | $105,714 |
| 6-Person Families | 23 (5.1%) | $93,482 |
| 7+ Person Families | 18 (4.0%) | $0 |
| Total | 447 (100.0%) | $54,063 |
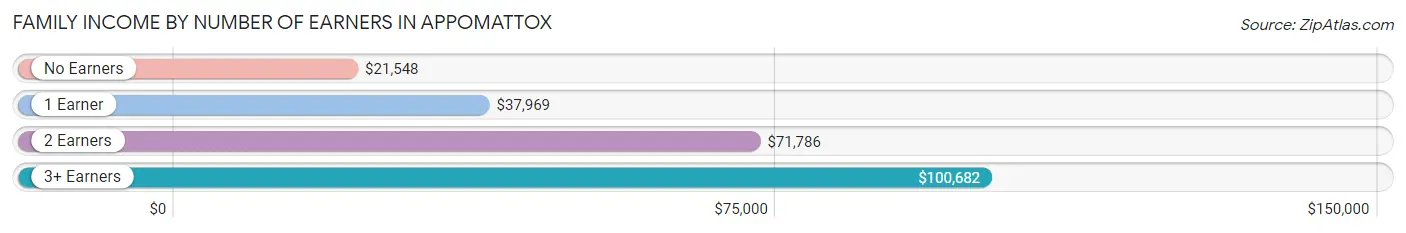
Family Income by Number of Earners in Appomattox
The median family income in Appomattox is $54,063, with families comprising 3+ earners (46) having the highest median family income of $100,682, while families with no earners (60) have the lowest median family income of $21,548, accounting for 10.3% and 13.4% of families, respectively.
| Number of Earners | # Families | Median Income |
| No Earners | 60 (13.4%) | $21,548 |
| 1 Earner | 161 (36.0%) | $37,969 |
| 2 Earners | 180 (40.3%) | $71,786 |
| 3+ Earners | 46 (10.3%) | $100,682 |
| Total | 447 (100.0%) | $54,063 |
Household Income in Appomattox
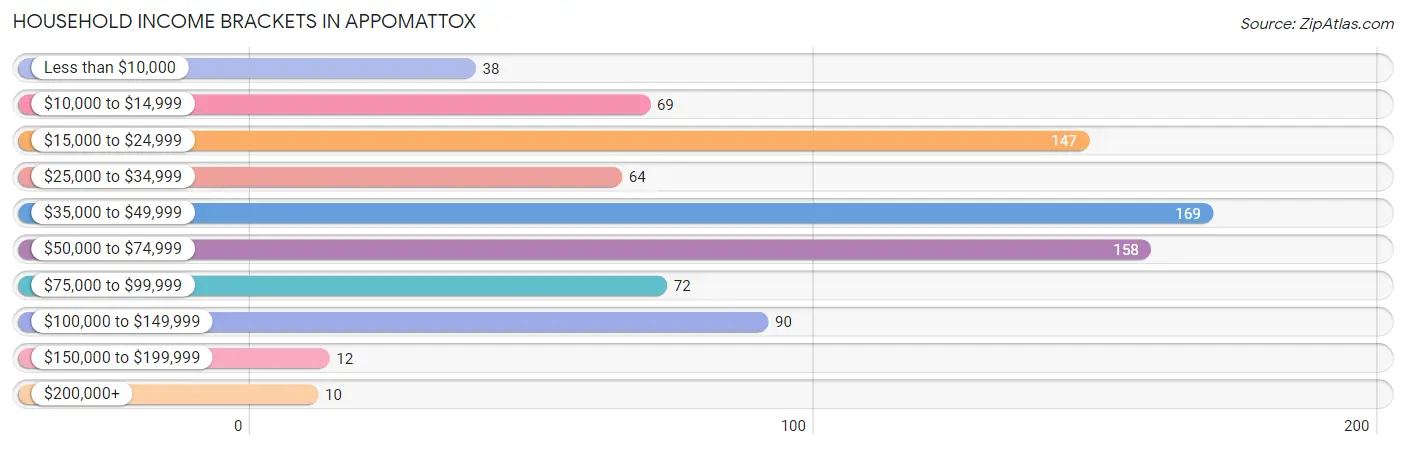
Household Income Brackets in Appomattox
With 169 households falling in the category, the $35,000 to $49,999 income range is the most frequent in Appomattox, accounting for 20.4% of all households. In contrast, only 10 households (1.2%) fall into the $200,000+ income bracket, making it the least populous group.
| Income Bracket | # Households | % Households |
| Less than $10,000 | 38 | 4.6% |
| $10,000 to $14,999 | 69 | 8.3% |
| $15,000 to $24,999 | 147 | 17.7% |
| $25,000 to $34,999 | 64 | 7.7% |
| $35,000 to $49,999 | 169 | 20.4% |
| $50,000 to $74,999 | 158 | 19.1% |
| $75,000 to $99,999 | 72 | 8.7% |
| $100,000 to $149,999 | 90 | 10.9% |
| $150,000 to $199,999 | 12 | 1.4% |
| $200,000+ | 10 | 1.2% |
Household Income by Householder Age in Appomattox
The median household income in Appomattox is $43,750, with the highest median household income of $67,337 found in the 25 to 44 years age bracket for the primary householder. A total of 223 households (26.9%) fall into this category. Meanwhile, the 15 to 24 years age bracket for the primary householder has the lowest median household income of $0, with 31 households (3.7%) in this group.
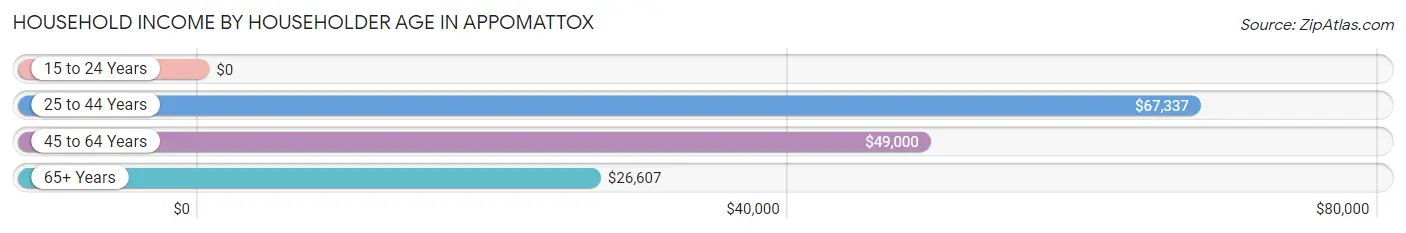
| Income Bracket | # Households | Median Income |
| 15 to 24 Years | 31 (3.7%) | $0 |
| 25 to 44 Years | 223 (26.9%) | $67,337 |
| 45 to 64 Years | 316 (38.1%) | $49,000 |
| 65+ Years | 259 (31.2%) | $26,607 |
| Total | 829 (100.0%) | $43,750 |
Poverty in Appomattox
Income Below Poverty by Sex and Age in Appomattox
With 17.4% poverty level for males and 21.3% for females among the residents of Appomattox, 15 year old males and under 5 year old females are the most vulnerable to poverty, with 11 males (64.7%) and 18 females (50.0%) in their respective age groups living below the poverty level.
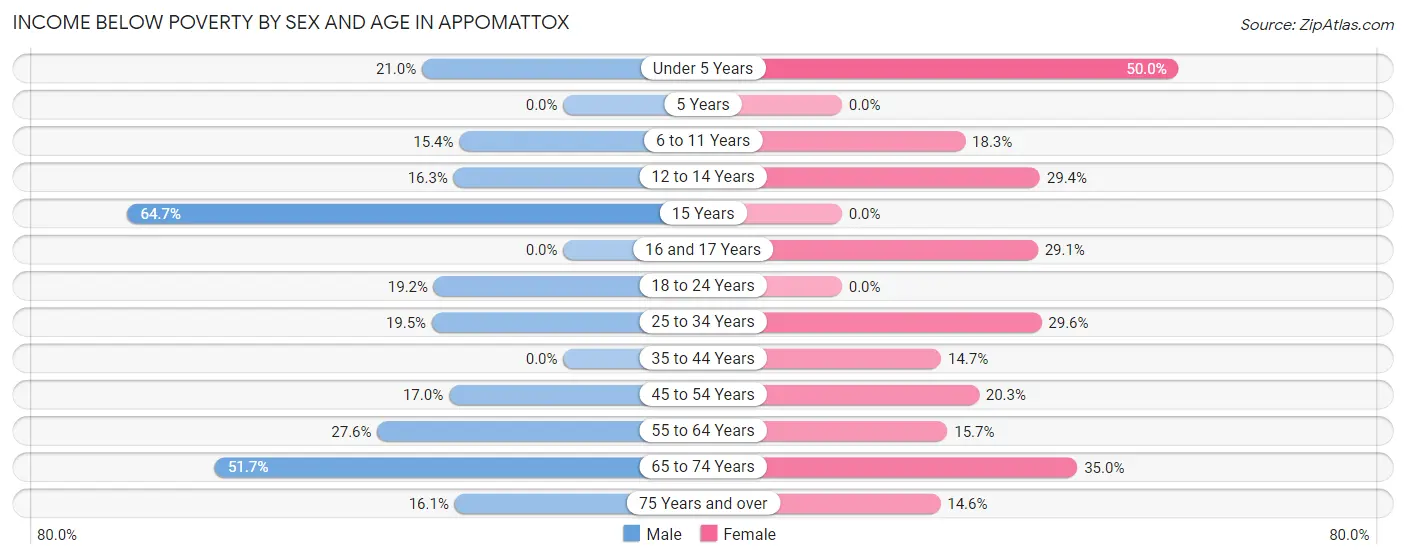
| Age Bracket | Male | Female |
| Under 5 Years | 17 (21.0%) | 18 (50.0%) |
| 5 Years | 0 (0.0%) | 0 (0.0%) |
| 6 to 11 Years | 21 (15.4%) | 13 (18.3%) |
| 12 to 14 Years | 7 (16.3%) | 5 (29.4%) |
| 15 Years | 11 (64.7%) | 0 (0.0%) |
| 16 and 17 Years | 0 (0.0%) | 16 (29.1%) |
| 18 to 24 Years | 20 (19.2%) | 0 (0.0%) |
| 25 to 34 Years | 24 (19.5%) | 40 (29.6%) |
| 35 to 44 Years | 0 (0.0%) | 14 (14.7%) |
| 45 to 54 Years | 18 (17.0%) | 48 (20.3%) |
| 55 to 64 Years | 29 (27.6%) | 21 (15.7%) |
| 65 to 74 Years | 15 (51.7%) | 43 (35.0%) |
| 75 Years and over | 10 (16.1%) | 12 (14.6%) |
| Total | 172 (17.4%) | 230 (21.3%) |
Income Above Poverty by Sex and Age in Appomattox
According to the poverty statistics in Appomattox, males aged 5 years and females aged 15 years are the age groups that are most secure financially, with 100.0% of males and 100.0% of females in these age groups living above the poverty line.
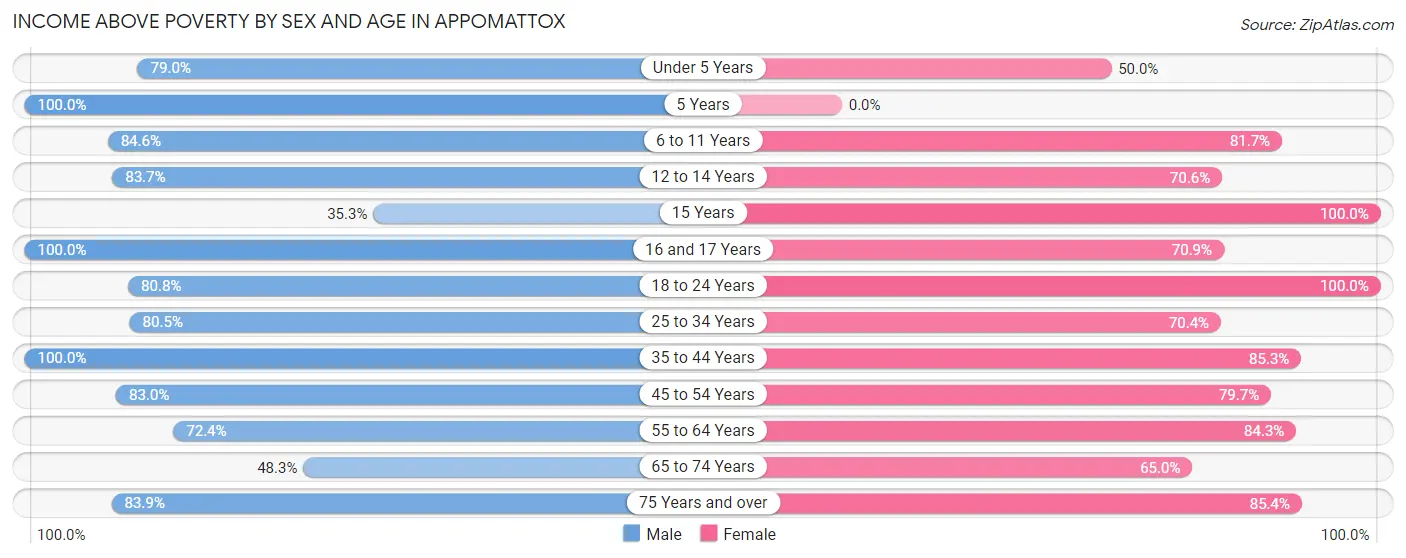
| Age Bracket | Male | Female |
| Under 5 Years | 64 (79.0%) | 18 (50.0%) |
| 5 Years | 6 (100.0%) | 0 (0.0%) |
| 6 to 11 Years | 115 (84.6%) | 58 (81.7%) |
| 12 to 14 Years | 36 (83.7%) | 12 (70.6%) |
| 15 Years | 6 (35.3%) | 14 (100.0%) |
| 16 and 17 Years | 38 (100.0%) | 39 (70.9%) |
| 18 to 24 Years | 84 (80.8%) | 82 (100.0%) |
| 25 to 34 Years | 99 (80.5%) | 95 (70.4%) |
| 35 to 44 Years | 140 (100.0%) | 81 (85.3%) |
| 45 to 54 Years | 88 (83.0%) | 188 (79.7%) |
| 55 to 64 Years | 76 (72.4%) | 113 (84.3%) |
| 65 to 74 Years | 14 (48.3%) | 80 (65.0%) |
| 75 Years and over | 52 (83.9%) | 70 (85.4%) |
| Total | 818 (82.6%) | 850 (78.7%) |
Income Below Poverty Among Married-Couple Families in Appomattox
The poverty statistics for married-couple families in Appomattox show that 12.1% or 33 of the total 273 families live below the poverty line. Families with 1 or 2 children have the highest poverty rate of 34.7%, comprising of 33 families. On the other hand, families with no children have the lowest poverty rate of 0.0%, which includes 0 families.
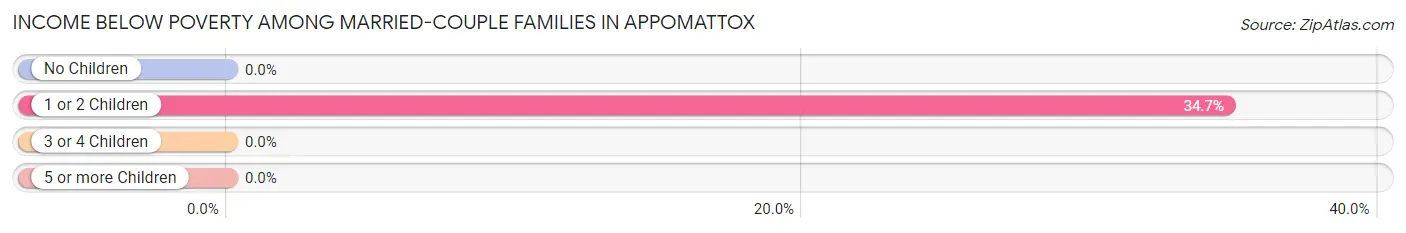
| Children | Above Poverty | Below Poverty |
| No Children | 137 (100.0%) | 0 (0.0%) |
| 1 or 2 Children | 62 (65.3%) | 33 (34.7%) |
| 3 or 4 Children | 36 (100.0%) | 0 (0.0%) |
| 5 or more Children | 5 (100.0%) | 0 (0.0%) |
| Total | 240 (87.9%) | 33 (12.1%) |
Income Below Poverty Among Single-Parent Households in Appomattox
According to the poverty data in Appomattox, 77.4% or 48 single-father households and 12.5% or 14 single-mother households are living below the poverty line. Among single-father households, those with no children have the highest poverty rate, with 31 households (100.0%) experiencing poverty. Likewise, among single-mother households, those with 1 or 2 children have the highest poverty rate, with 14 households (25.0%) falling below the poverty line.
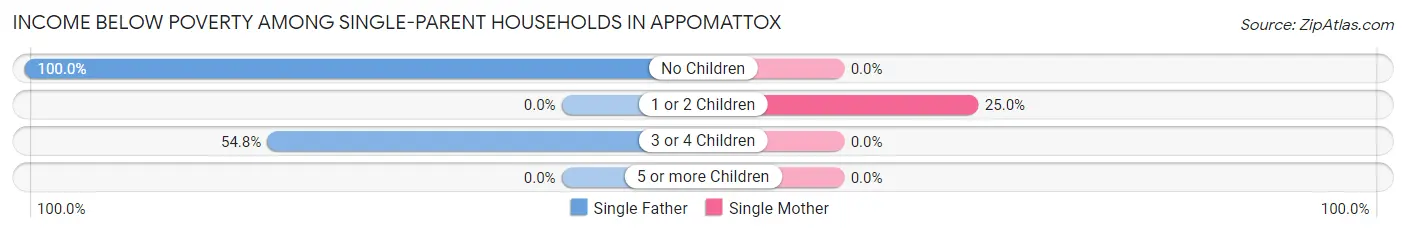
| Children | Single Father | Single Mother |
| No Children | 31 (100.0%) | 0 (0.0%) |
| 1 or 2 Children | 0 (0.0%) | 14 (25.0%) |
| 3 or 4 Children | 17 (54.8%) | 0 (0.0%) |
| 5 or more Children | 0 (0.0%) | 0 (0.0%) |
| Total | 48 (77.4%) | 14 (12.5%) |
Income Below Poverty Among Married-Couple vs Single-Parent Households in Appomattox
The poverty data for Appomattox shows that 33 of the married-couple family households (12.1%) and 62 of the single-parent households (35.6%) are living below the poverty level. Within the married-couple family households, those with 1 or 2 children have the highest poverty rate, with 33 households (34.7%) falling below the poverty line. Among the single-parent households, those with no children have the highest poverty rate, with 31 household (41.3%) living below poverty.
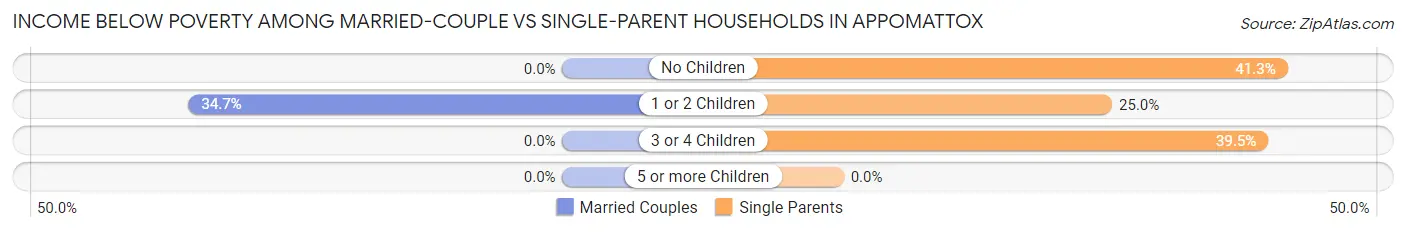
| Children | Married-Couple Families | Single-Parent Households |
| No Children | 0 (0.0%) | 31 (41.3%) |
| 1 or 2 Children | 33 (34.7%) | 14 (25.0%) |
| 3 or 4 Children | 0 (0.0%) | 17 (39.5%) |
| 5 or more Children | 0 (0.0%) | 0 (0.0%) |
| Total | 33 (12.1%) | 62 (35.6%) |
Race in Appomattox
The most populous races in Appomattox are White / Caucasian (1,421 | 65.9%), Black / African American (616 | 28.6%), and Some other Race (61 | 2.8%).
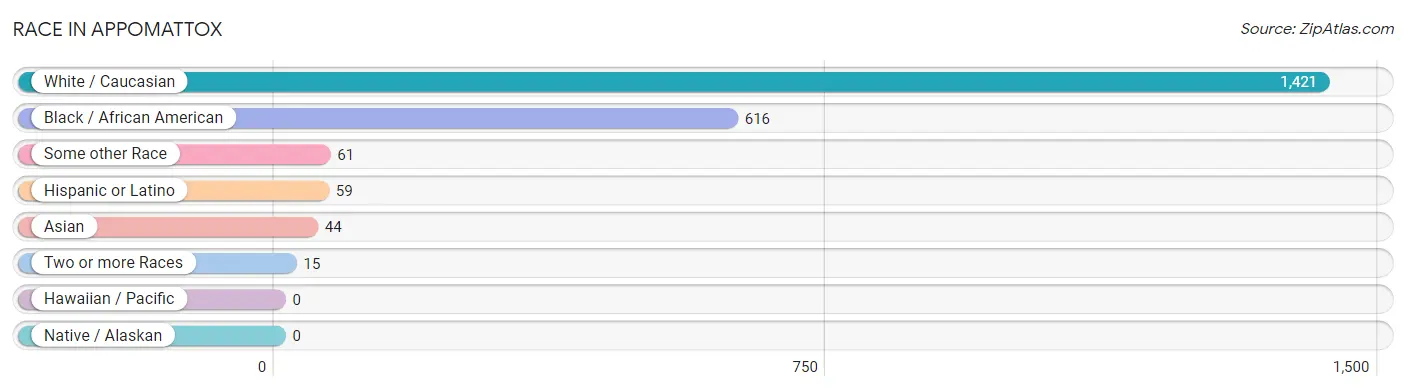
| Race | # Population | % Population |
| Asian | 44 | 2.0% |
| Black / African American | 616 | 28.6% |
| Hawaiian / Pacific | 0 | 0.0% |
| Hispanic or Latino | 59 | 2.7% |
| Native / Alaskan | 0 | 0.0% |
| White / Caucasian | 1,421 | 65.9% |
| Two or more Races | 15 | 0.7% |
| Some other Race | 61 | 2.8% |
| Total | 2,157 | 100.0% |
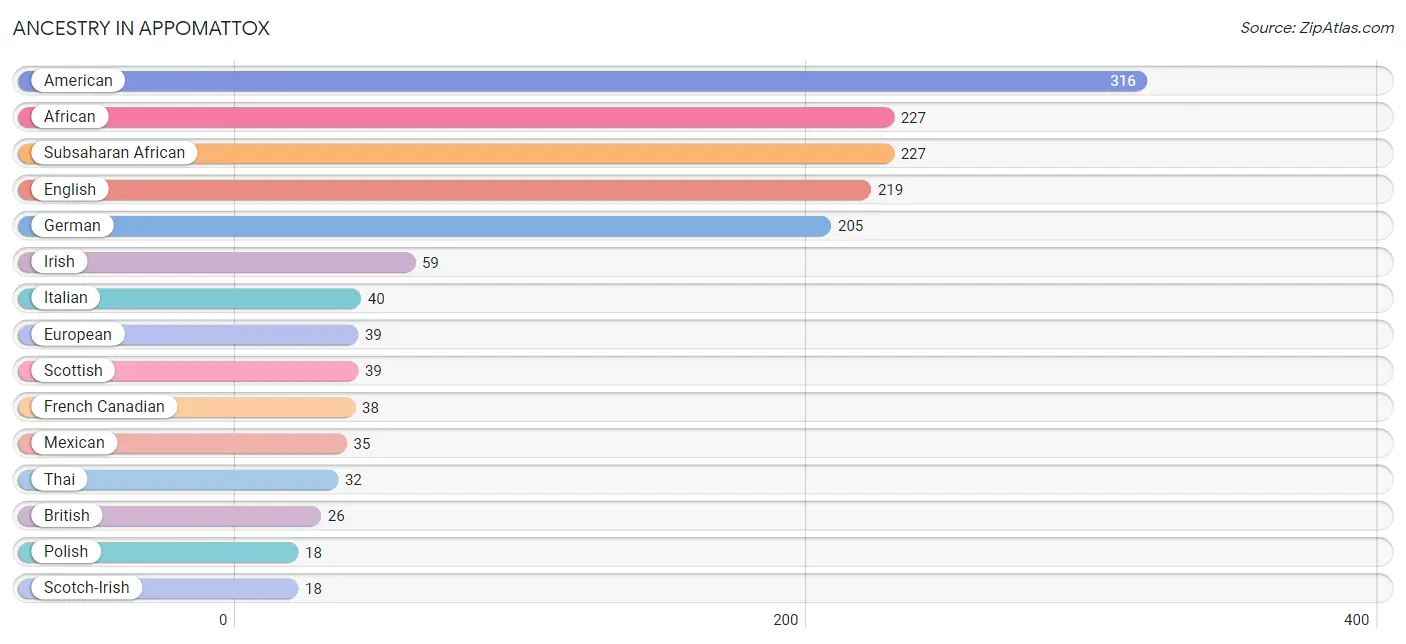
Ancestry in Appomattox
The most populous ancestries reported in Appomattox are American (316 | 14.6%), African (227 | 10.5%), Subsaharan African (227 | 10.5%), English (219 | 10.2%), and German (205 | 9.5%), together accounting for 55.3% of all Appomattox residents.
| Ancestry | # Population | % Population |
| African | 227 | 10.5% |
| American | 316 | 14.6% |
| British | 26 | 1.2% |
| Burmese | 12 | 0.6% |
| Canadian | 4 | 0.2% |
| Central American | 10 | 0.5% |
| Dutch | 13 | 0.6% |
| English | 219 | 10.2% |
| European | 39 | 1.8% |
| French | 11 | 0.5% |
| French Canadian | 38 | 1.8% |
| German | 205 | 9.5% |
| Guatemalan | 3 | 0.1% |
| Honduran | 7 | 0.3% |
| Irish | 59 | 2.7% |
| Italian | 40 | 1.8% |
| Korean | 10 | 0.5% |
| Mexican | 35 | 1.6% |
| Northern European | 10 | 0.5% |
| Polish | 18 | 0.8% |
| Puerto Rican | 14 | 0.6% |
| Scandinavian | 6 | 0.3% |
| Scotch-Irish | 18 | 0.8% |
| Scottish | 39 | 1.8% |
| Subsaharan African | 227 | 10.5% |
| Swedish | 14 | 0.6% |
| Thai | 32 | 1.5% |
| Welsh | 4 | 0.2% | View All 28 Rows |
Immigrants in Appomattox
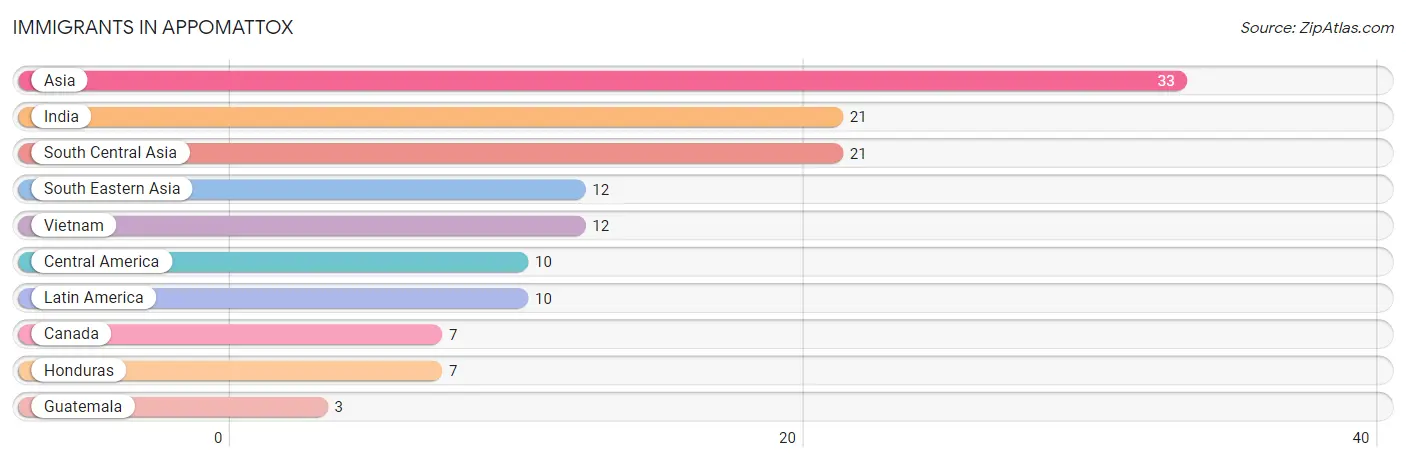
The most numerous immigrant groups reported in Appomattox came from Asia (33 | 1.5%), India (21 | 1.0%), South Central Asia (21 | 1.0%), South Eastern Asia (12 | 0.6%), and Vietnam (12 | 0.6%), together accounting for 4.6% of all Appomattox residents.
| Immigration Origin | # Population | % Population |
| Asia | 33 | 1.5% |
| Canada | 7 | 0.3% |
| Central America | 10 | 0.5% |
| Guatemala | 3 | 0.1% |
| Honduras | 7 | 0.3% |
| India | 21 | 1.0% |
| Latin America | 10 | 0.5% |
| South Central Asia | 21 | 1.0% |
| South Eastern Asia | 12 | 0.6% |
| Vietnam | 12 | 0.6% | View All 10 Rows |
Sex and Age in Appomattox
Sex and Age in Appomattox
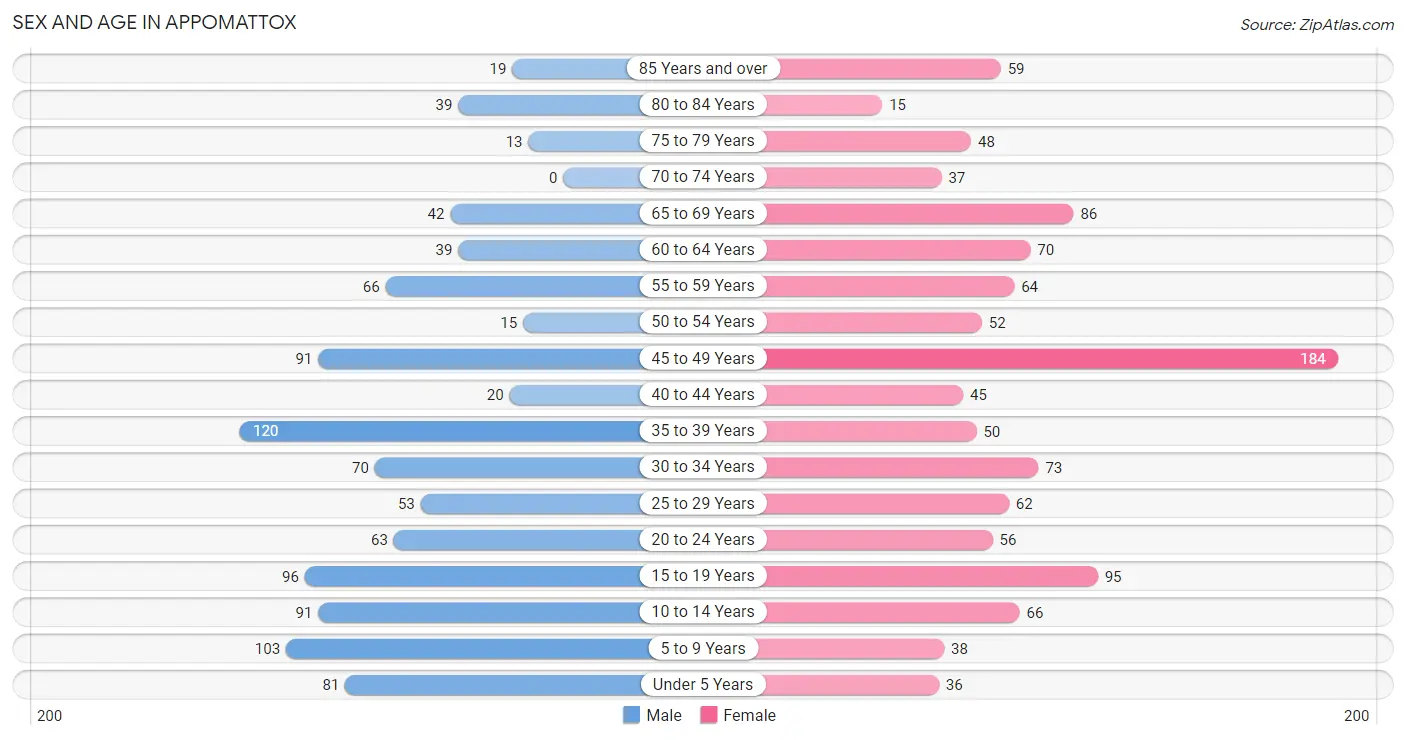
The most populous age groups in Appomattox are 35 to 39 Years (120 | 11.7%) for men and 45 to 49 Years (184 | 16.2%) for women.
| Age Bracket | Male | Female |
| Under 5 Years | 81 (7.9%) | 36 (3.2%) |
| 5 to 9 Years | 103 (10.1%) | 38 (3.4%) |
| 10 to 14 Years | 91 (8.9%) | 66 (5.8%) |
| 15 to 19 Years | 96 (9.4%) | 95 (8.4%) |
| 20 to 24 Years | 63 (6.2%) | 56 (4.9%) |
| 25 to 29 Years | 53 (5.2%) | 62 (5.5%) |
| 30 to 34 Years | 70 (6.9%) | 73 (6.4%) |
| 35 to 39 Years | 120 (11.7%) | 50 (4.4%) |
| 40 to 44 Years | 20 (2.0%) | 45 (4.0%) |
| 45 to 49 Years | 91 (8.9%) | 184 (16.2%) |
| 50 to 54 Years | 15 (1.5%) | 52 (4.6%) |
| 55 to 59 Years | 66 (6.5%) | 64 (5.6%) |
| 60 to 64 Years | 39 (3.8%) | 70 (6.2%) |
| 65 to 69 Years | 42 (4.1%) | 86 (7.6%) |
| 70 to 74 Years | 0 (0.0%) | 37 (3.3%) |
| 75 to 79 Years | 13 (1.3%) | 48 (4.2%) |
| 80 to 84 Years | 39 (3.8%) | 15 (1.3%) |
| 85 Years and over | 19 (1.9%) | 59 (5.2%) |
| Total | 1,021 (100.0%) | 1,136 (100.0%) |
Families and Households in Appomattox
Median Family Size in Appomattox
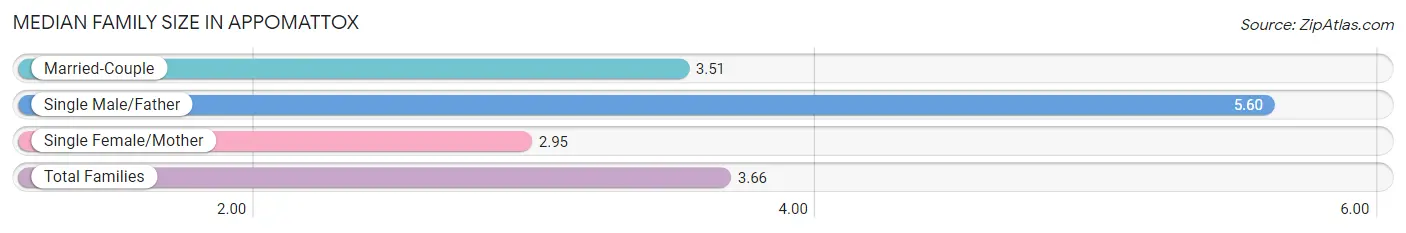
The median family size in Appomattox is 3.66 persons per family, with single male/father families (62 | 13.9%) accounting for the largest median family size of 5.6 persons per family. On the other hand, single female/mother families (112 | 25.1%) represent the smallest median family size with 2.95 persons per family.
| Family Type | # Families | Family Size |
| Married-Couple | 273 (61.1%) | 3.51 |
| Single Male/Father | 62 (13.9%) | 5.60 |
| Single Female/Mother | 112 (25.1%) | 2.95 |
| Total Families | 447 (100.0%) | 3.66 |
Median Household Size in Appomattox
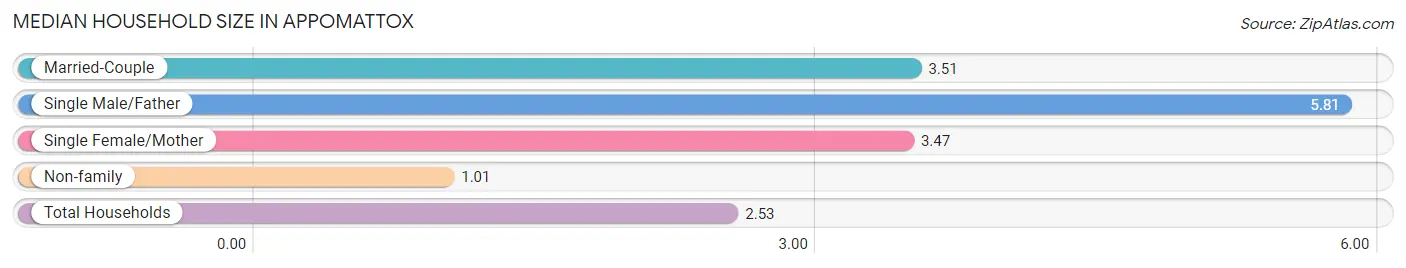
The median household size in Appomattox is 2.53 persons per household, with single male/father households (62 | 7.5%) accounting for the largest median household size of 5.81 persons per household. non-family households (382 | 46.1%) represent the smallest median household size with 1.01 persons per household.
| Household Type | # Households | Household Size |
| Married-Couple | 273 (32.9%) | 3.51 |
| Single Male/Father | 62 (7.5%) | 5.81 |
| Single Female/Mother | 112 (13.5%) | 3.47 |
| Non-family | 382 (46.1%) | 1.01 |
| Total Households | 829 (100.0%) | 2.53 |
Household Size by Marriage Status in Appomattox
Out of a total of 829 households in Appomattox, 447 (53.9%) are family households, while 382 (46.1%) are nonfamily households. The most numerous type of family households are 2-person households, comprising 175, and the most common type of nonfamily households are 1-person households, comprising 378.
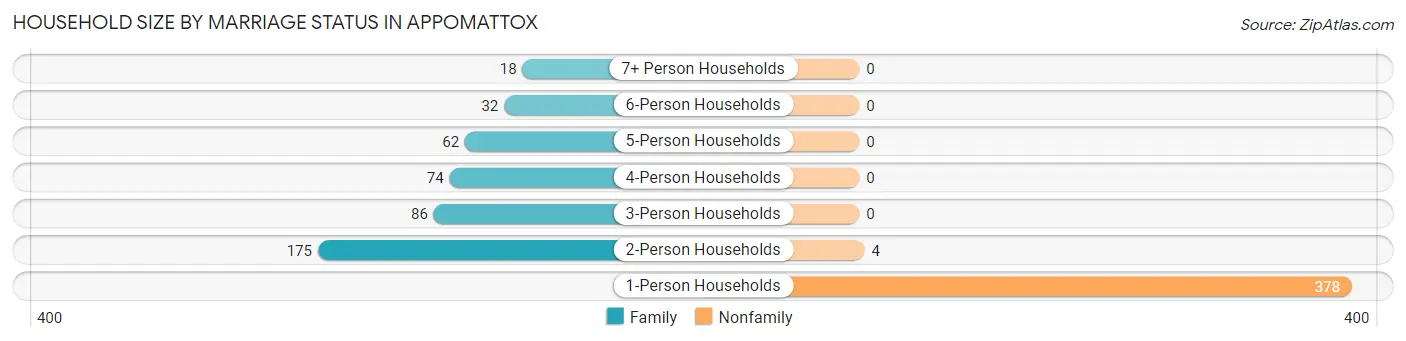
| Household Size | Family Households | Nonfamily Households |
| 1-Person Households | - | 378 (45.6%) |
| 2-Person Households | 175 (21.1%) | 4 (0.5%) |
| 3-Person Households | 86 (10.4%) | 0 (0.0%) |
| 4-Person Households | 74 (8.9%) | 0 (0.0%) |
| 5-Person Households | 62 (7.5%) | 0 (0.0%) |
| 6-Person Households | 32 (3.9%) | 0 (0.0%) |
| 7+ Person Households | 18 (2.2%) | 0 (0.0%) |
| Total | 447 (53.9%) | 382 (46.1%) |
Female Fertility in Appomattox
Fertility by Age in Appomattox
Average fertility rate in Appomattox is 56.0 births per 1,000 women. Women in the age bracket of 15 to 19 years have the highest fertility rate with 158.0 births per 1,000 women. Women in the age bracket of 20 to 34 years acount for 53.1% of all women with births.
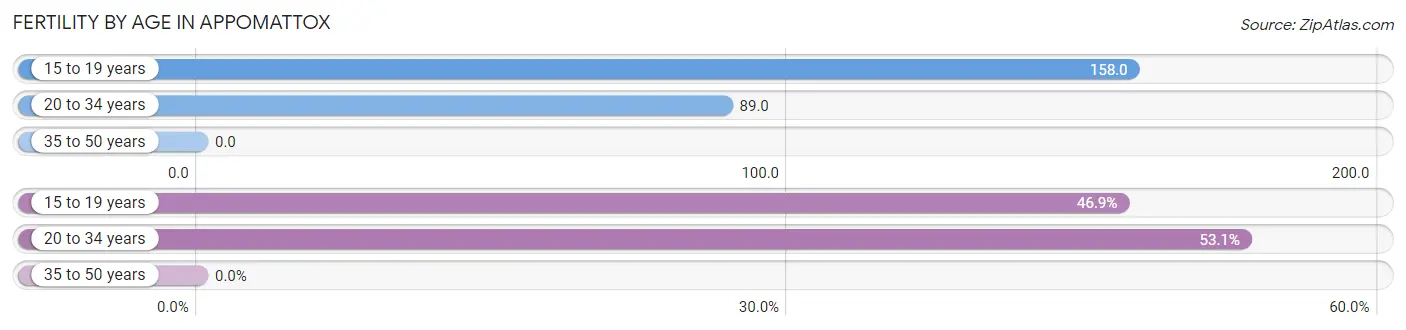
| Age Bracket | Women with Births | Births / 1,000 Women |
| 15 to 19 years | 15 (46.9%) | 158.0 |
| 20 to 34 years | 17 (53.1%) | 89.0 |
| 35 to 50 years | 0 (0.0%) | 0.0 |
| Total | 32 (100.0%) | 56.0 |
Fertility by Age by Marriage Status in Appomattox
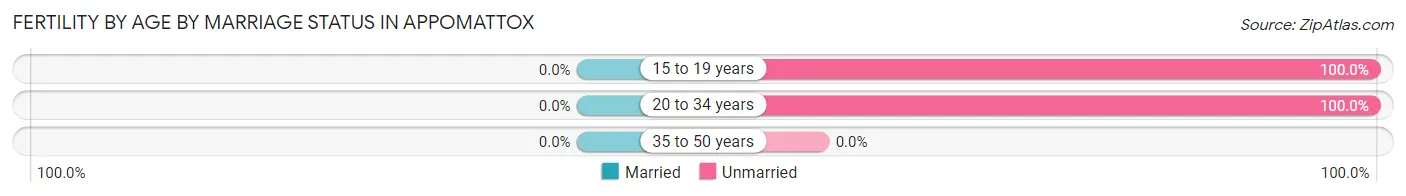
| Age Bracket | Married | Unmarried |
| 15 to 19 years | 0 (0.0%) | 15 (100.0%) |
| 20 to 34 years | 0 (0.0%) | 17 (100.0%) |
| 35 to 50 years | 0 (0.0%) | 0 (0.0%) |
| Total | 0 (0.0%) | 32 (100.0%) |
Fertility by Education in Appomattox
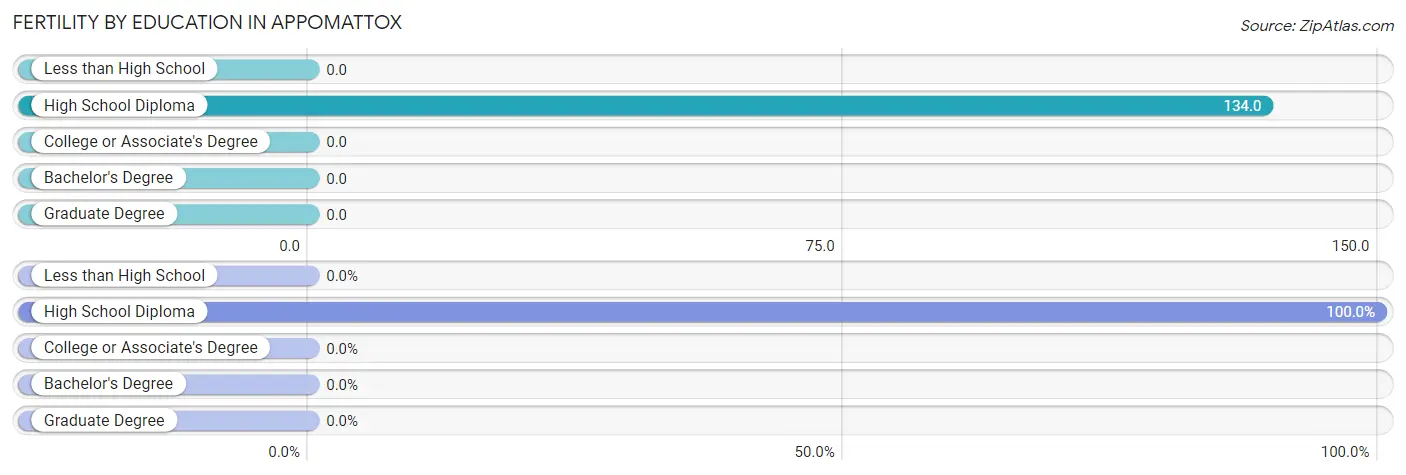
| Educational Attainment | Women with Births | Births / 1,000 Women |
| Less than High School | 0 (0.0%) | 0.0 |
| High School Diploma | 32 (100.0%) | 134.0 |
| College or Associate's Degree | 0 (0.0%) | 0.0 |
| Bachelor's Degree | 0 (0.0%) | 0.0 |
| Graduate Degree | 0 (0.0%) | 0.0 |
| Total | 32 (100.0%) | 56.0 |
Fertility by Education by Marriage Status in Appomattox
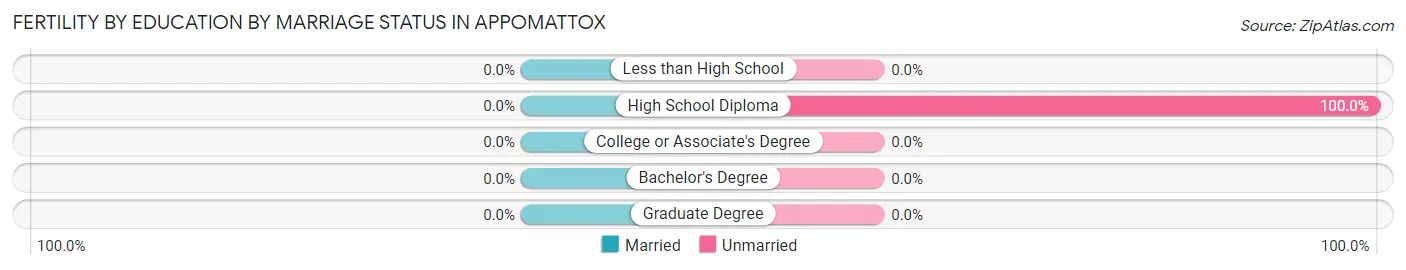
| Educational Attainment | Married | Unmarried |
| Less than High School | 0 (0.0%) | 0 (0.0%) |
| High School Diploma | 0 (0.0%) | 32 (100.0%) |
| College or Associate's Degree | 0 (0.0%) | 0 (0.0%) |
| Bachelor's Degree | 0 (0.0%) | 0 (0.0%) |
| Graduate Degree | 0 (0.0%) | 0 (0.0%) |
| Total | 0 (0.0%) | 32 (100.0%) |
Employment Characteristics in Appomattox
Employment by Class of Employer in Appomattox
Among the 1,032 employed individuals in Appomattox, private company employees (758 | 73.5%), local government employees (92 | 8.9%), and not-for-profit organizations (81 | 7.9%) make up the most common classes of employment.
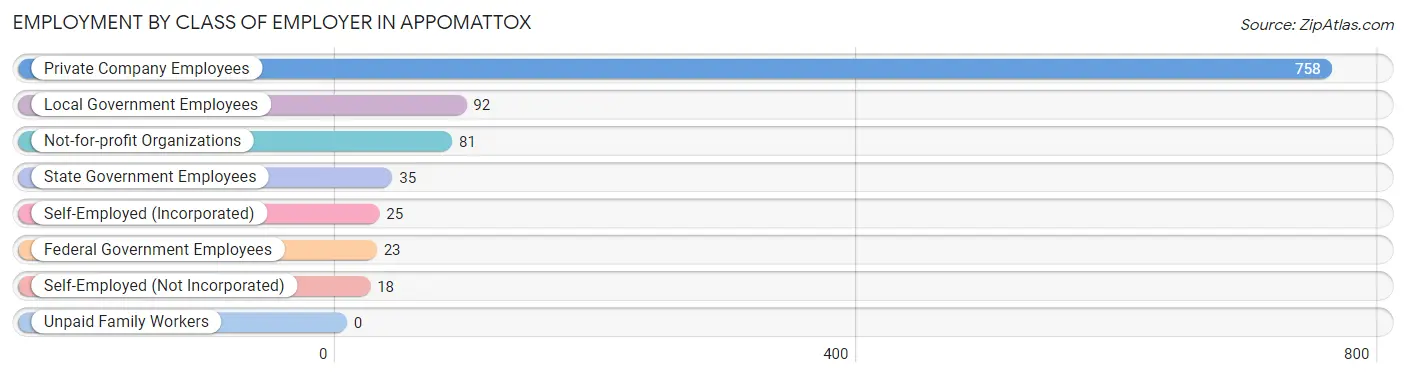
| Employer Class | # Employees | % Employees |
| Private Company Employees | 758 | 73.5% |
| Self-Employed (Incorporated) | 25 | 2.4% |
| Self-Employed (Not Incorporated) | 18 | 1.7% |
| Not-for-profit Organizations | 81 | 7.9% |
| Local Government Employees | 92 | 8.9% |
| State Government Employees | 35 | 3.4% |
| Federal Government Employees | 23 | 2.2% |
| Unpaid Family Workers | 0 | 0.0% |
| Total | 1,032 | 100.0% |
Employment Status by Age in Appomattox
According to the labor force statistics for Appomattox, out of the total population over 16 years of age (1,711), 64.7% or 1,107 individuals are in the labor force, with 6.5% or 72 of them unemployed. The age group with the highest labor force participation rate is 20 to 24 years, with 95.0% or 113 individuals in the labor force. Within the labor force, the 16 to 19 years age range has the highest percentage of unemployed individuals, with 31.7% or 20 of them being unemployed.
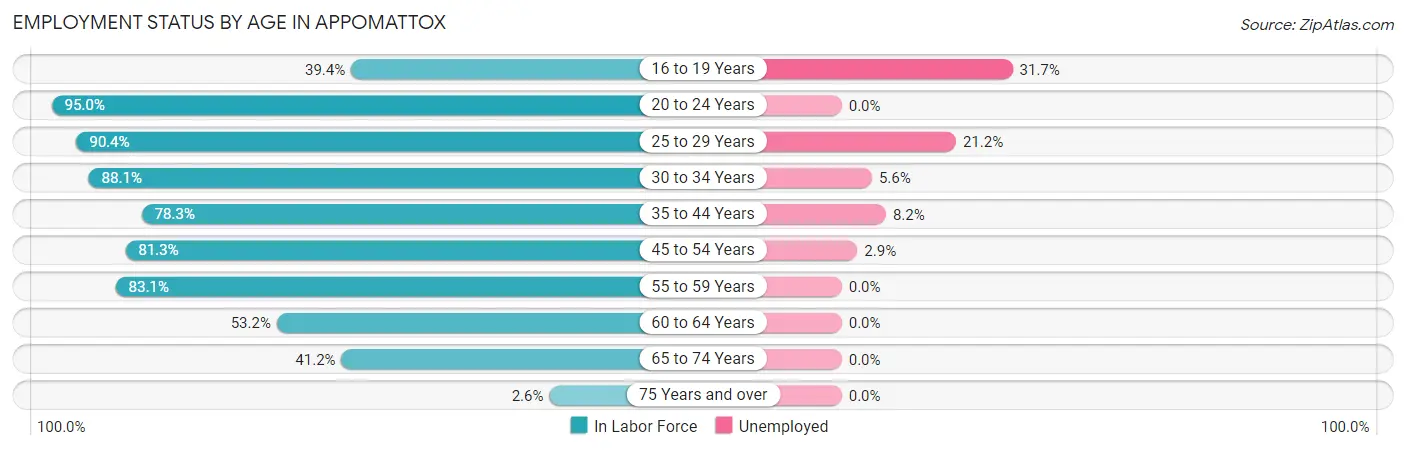
| Age Bracket | In Labor Force | Unemployed |
| 16 to 19 Years | 63 (39.4%) | 20 (31.7%) |
| 20 to 24 Years | 113 (95.0%) | 0 (0.0%) |
| 25 to 29 Years | 104 (90.4%) | 22 (21.2%) |
| 30 to 34 Years | 126 (88.1%) | 7 (5.6%) |
| 35 to 44 Years | 184 (78.3%) | 15 (8.2%) |
| 45 to 54 Years | 278 (81.3%) | 8 (2.9%) |
| 55 to 59 Years | 108 (83.1%) | 0 (0.0%) |
| 60 to 64 Years | 58 (53.2%) | 0 (0.0%) |
| 65 to 74 Years | 68 (41.2%) | 0 (0.0%) |
| 75 Years and over | 5 (2.6%) | 0 (0.0%) |
| Total | 1,107 (64.7%) | 72 (6.5%) |
Employment Status by Educational Attainment in Appomattox
According to labor force statistics for Appomattox, 79.9% of individuals (858) out of the total population between 25 and 64 years of age (1,074) are in the labor force, with 6.1% or 52 of them being unemployed. The group with the highest labor force participation rate are those with the educational attainment of college / associate degree, with 89.7% or 287 individuals in the labor force. Within the labor force, individuals with less than high school education have the highest percentage of unemployment, with 53.3% or 8 of them being unemployed.
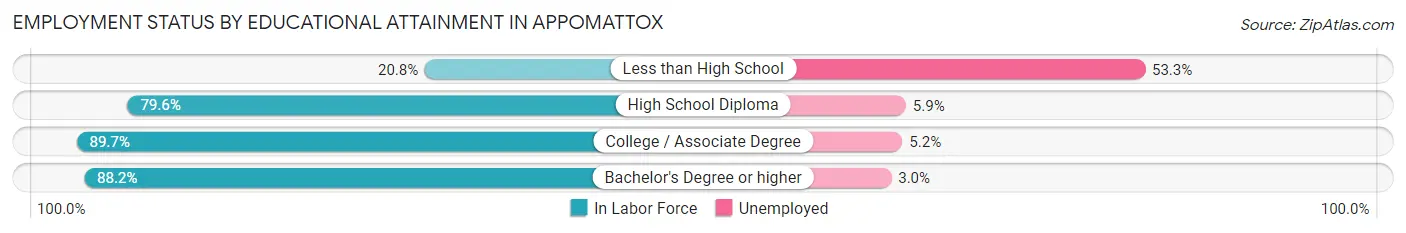
| Educational Attainment | In Labor Force | Unemployed |
| Less than High School | 15 (20.8%) | 38 (53.3%) |
| High School Diploma | 422 (79.6%) | 31 (5.9%) |
| College / Associate Degree | 287 (89.7%) | 17 (5.2%) |
| Bachelor's Degree or higher | 134 (88.2%) | 5 (3.0%) |
| Total | 858 (79.9%) | 66 (6.1%) |
Employment Occupations by Sex in Appomattox
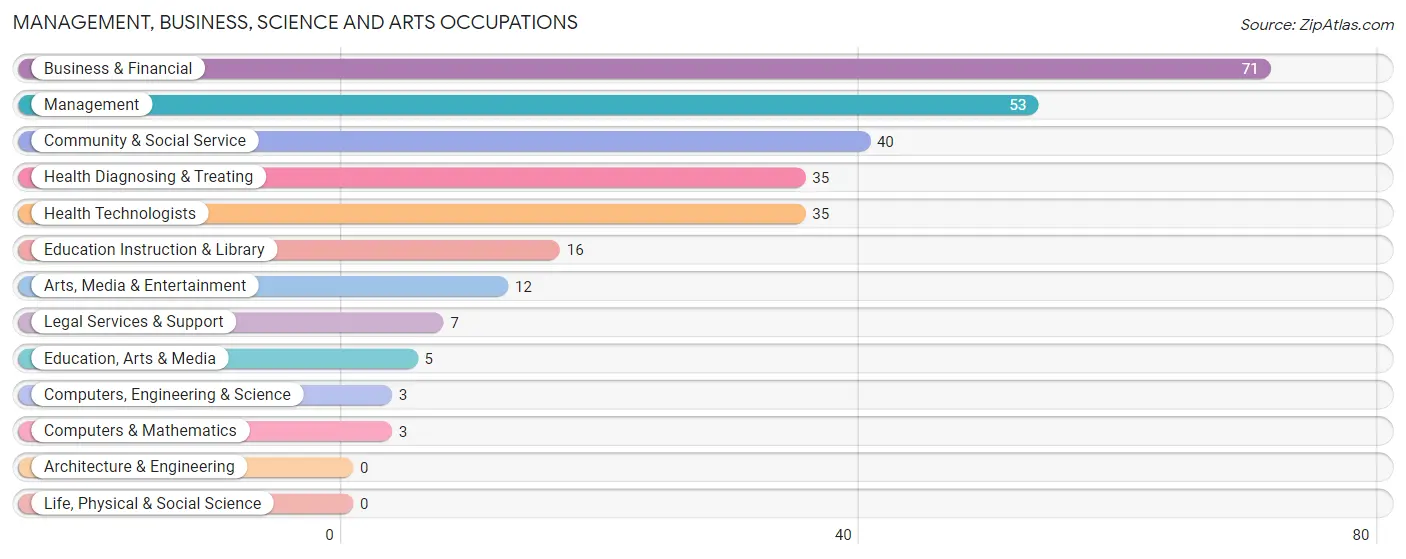
Management, Business, Science and Arts Occupations
The most common Management, Business, Science and Arts occupations in Appomattox are Business & Financial (71 | 6.9%), Management (53 | 5.1%), Community & Social Service (40 | 3.9%), Health Diagnosing & Treating (35 | 3.4%), and Health Technologists (35 | 3.4%).
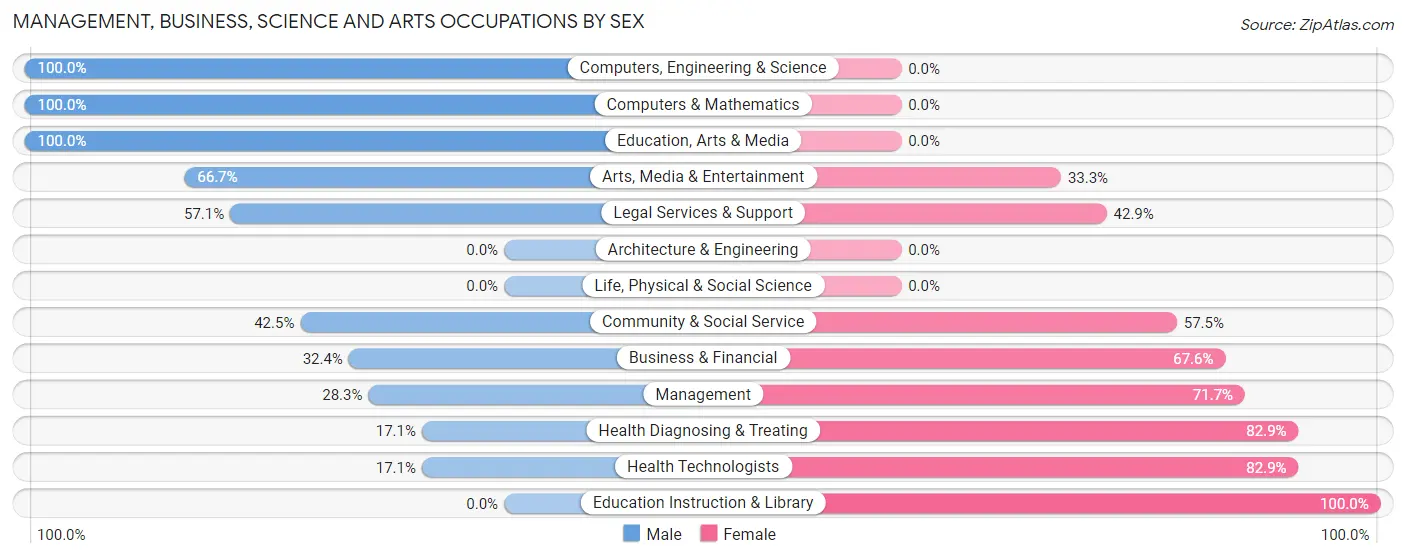
Management, Business, Science and Arts Occupations by Sex
Within the Management, Business, Science and Arts occupations in Appomattox, the most male-oriented occupations are Computers, Engineering & Science (100.0%), Computers & Mathematics (100.0%), and Education, Arts & Media (100.0%), while the most female-oriented occupations are Education Instruction & Library (100.0%), Health Diagnosing & Treating (82.9%), and Health Technologists (82.9%).
| Occupation | Male | Female |
| Management | 15 (28.3%) | 38 (71.7%) |
| Business & Financial | 23 (32.4%) | 48 (67.6%) |
| Computers, Engineering & Science | 3 (100.0%) | 0 (0.0%) |
| Computers & Mathematics | 3 (100.0%) | 0 (0.0%) |
| Architecture & Engineering | 0 (0.0%) | 0 (0.0%) |
| Life, Physical & Social Science | 0 (0.0%) | 0 (0.0%) |
| Community & Social Service | 17 (42.5%) | 23 (57.5%) |
| Education, Arts & Media | 5 (100.0%) | 0 (0.0%) |
| Legal Services & Support | 4 (57.1%) | 3 (42.9%) |
| Education Instruction & Library | 0 (0.0%) | 16 (100.0%) |
| Arts, Media & Entertainment | 8 (66.7%) | 4 (33.3%) |
| Health Diagnosing & Treating | 6 (17.1%) | 29 (82.9%) |
| Health Technologists | 6 (17.1%) | 29 (82.9%) |
| Total (Category) | 64 (31.7%) | 138 (68.3%) |
| Total (Overall) | 493 (47.6%) | 542 (52.4%) |
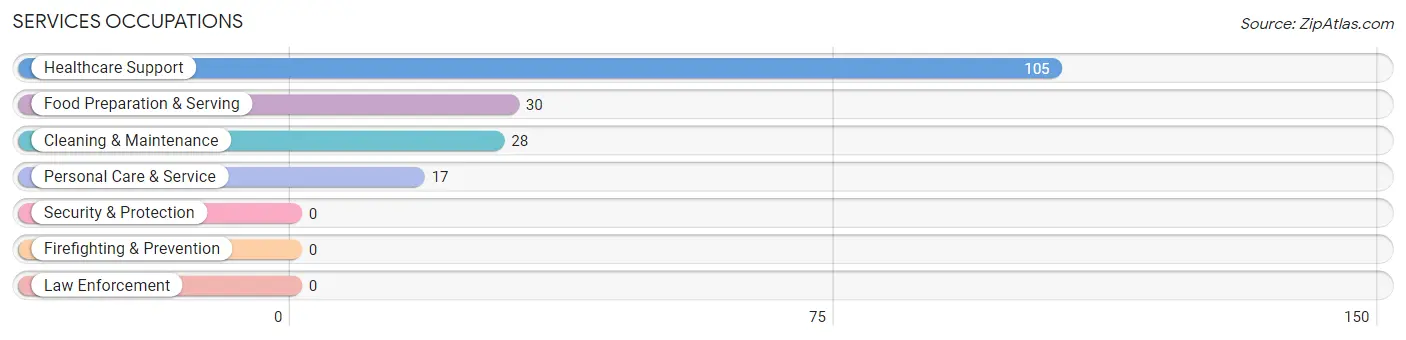
Services Occupations
The most common Services occupations in Appomattox are Healthcare Support (105 | 10.1%), Food Preparation & Serving (30 | 2.9%), Cleaning & Maintenance (28 | 2.7%), and Personal Care & Service (17 | 1.6%).
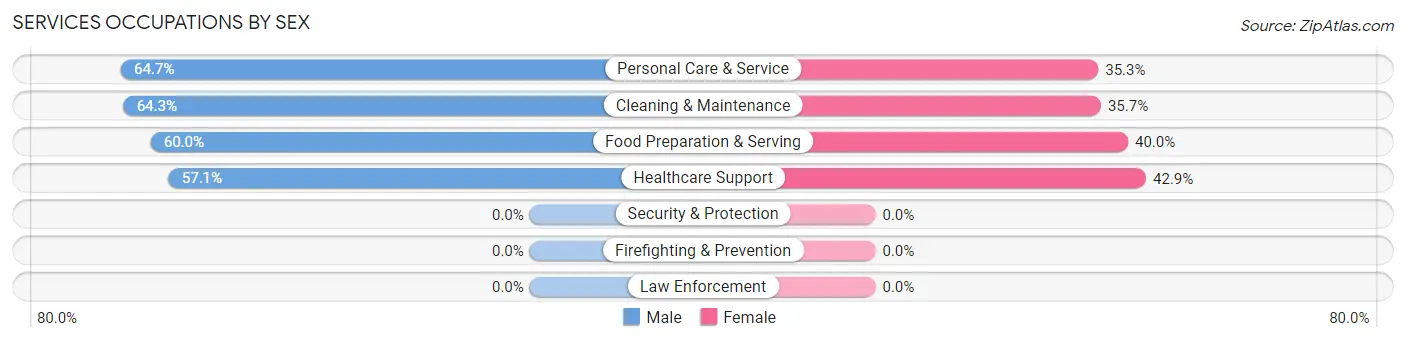
Services Occupations by Sex
Within the Services occupations in Appomattox, the most male-oriented occupations are Personal Care & Service (64.7%), Cleaning & Maintenance (64.3%), and Food Preparation & Serving (60.0%), while the most female-oriented occupations are Healthcare Support (42.9%), Food Preparation & Serving (40.0%), and Cleaning & Maintenance (35.7%).
| Occupation | Male | Female |
| Healthcare Support | 60 (57.1%) | 45 (42.9%) |
| Security & Protection | 0 (0.0%) | 0 (0.0%) |
| Firefighting & Prevention | 0 (0.0%) | 0 (0.0%) |
| Law Enforcement | 0 (0.0%) | 0 (0.0%) |
| Food Preparation & Serving | 18 (60.0%) | 12 (40.0%) |
| Cleaning & Maintenance | 18 (64.3%) | 10 (35.7%) |
| Personal Care & Service | 11 (64.7%) | 6 (35.3%) |
| Total (Category) | 107 (59.4%) | 73 (40.6%) |
| Total (Overall) | 493 (47.6%) | 542 (52.4%) |
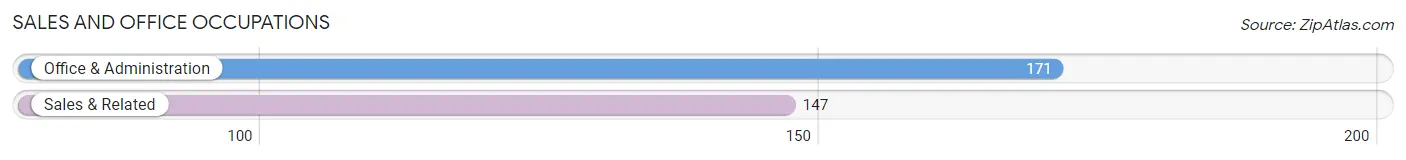
Sales and Office Occupations
The most common Sales and Office occupations in Appomattox are Office & Administration (171 | 16.5%), and Sales & Related (147 | 14.2%).
Sales and Office Occupations by Sex
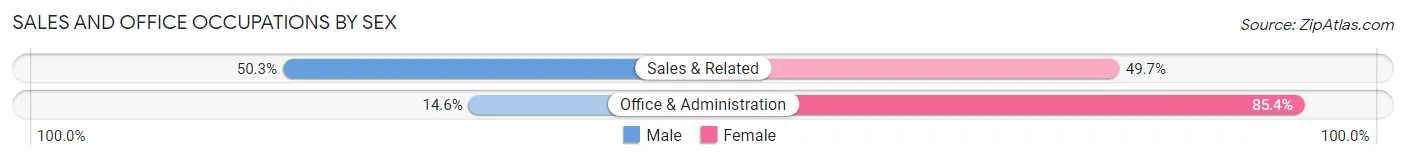
| Occupation | Male | Female |
| Sales & Related | 74 (50.3%) | 73 (49.7%) |
| Office & Administration | 25 (14.6%) | 146 (85.4%) |
| Total (Category) | 99 (31.1%) | 219 (68.9%) |
| Total (Overall) | 493 (47.6%) | 542 (52.4%) |
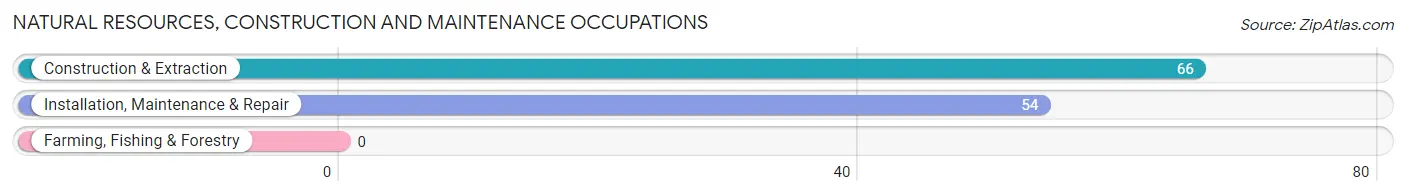
Natural Resources, Construction and Maintenance Occupations
The most common Natural Resources, Construction and Maintenance occupations in Appomattox are Construction & Extraction (66 | 6.4%), and Installation, Maintenance & Repair (54 | 5.2%).
Natural Resources, Construction and Maintenance Occupations by Sex
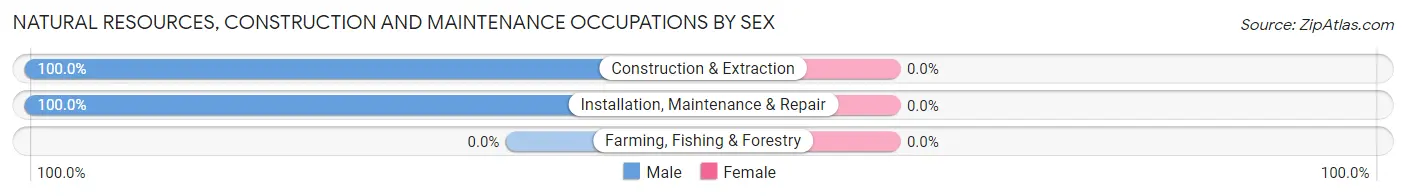
| Occupation | Male | Female |
| Farming, Fishing & Forestry | 0 (0.0%) | 0 (0.0%) |
| Construction & Extraction | 66 (100.0%) | 0 (0.0%) |
| Installation, Maintenance & Repair | 54 (100.0%) | 0 (0.0%) |
| Total (Category) | 120 (100.0%) | 0 (0.0%) |
| Total (Overall) | 493 (47.6%) | 542 (52.4%) |
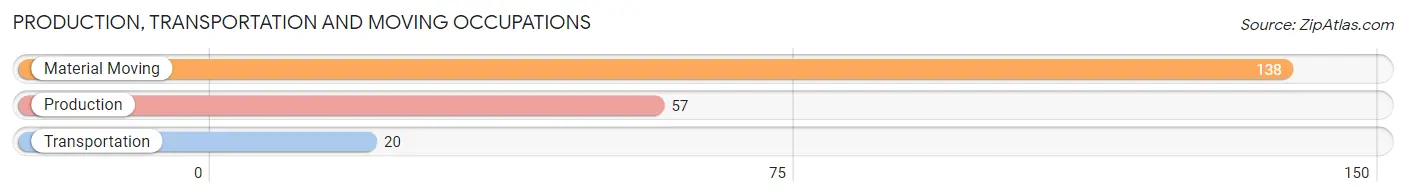
Production, Transportation and Moving Occupations
The most common Production, Transportation and Moving occupations in Appomattox are Material Moving (138 | 13.3%), Production (57 | 5.5%), and Transportation (20 | 1.9%).
Production, Transportation and Moving Occupations by Sex
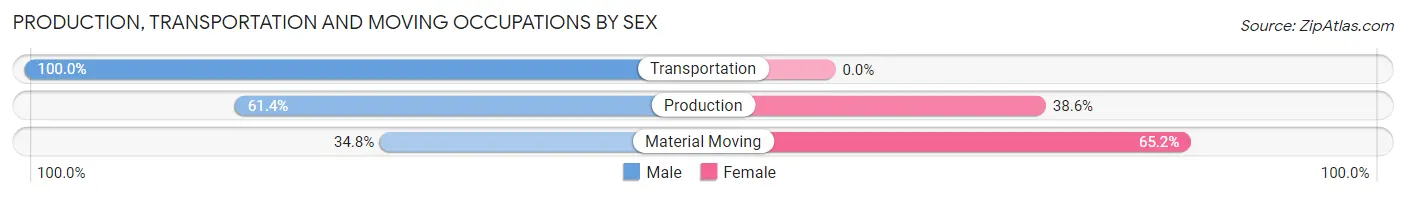
| Occupation | Male | Female |
| Production | 35 (61.4%) | 22 (38.6%) |
| Transportation | 20 (100.0%) | 0 (0.0%) |
| Material Moving | 48 (34.8%) | 90 (65.2%) |
| Total (Category) | 103 (47.9%) | 112 (52.1%) |
| Total (Overall) | 493 (47.6%) | 542 (52.4%) |
Employment Industries by Sex in Appomattox
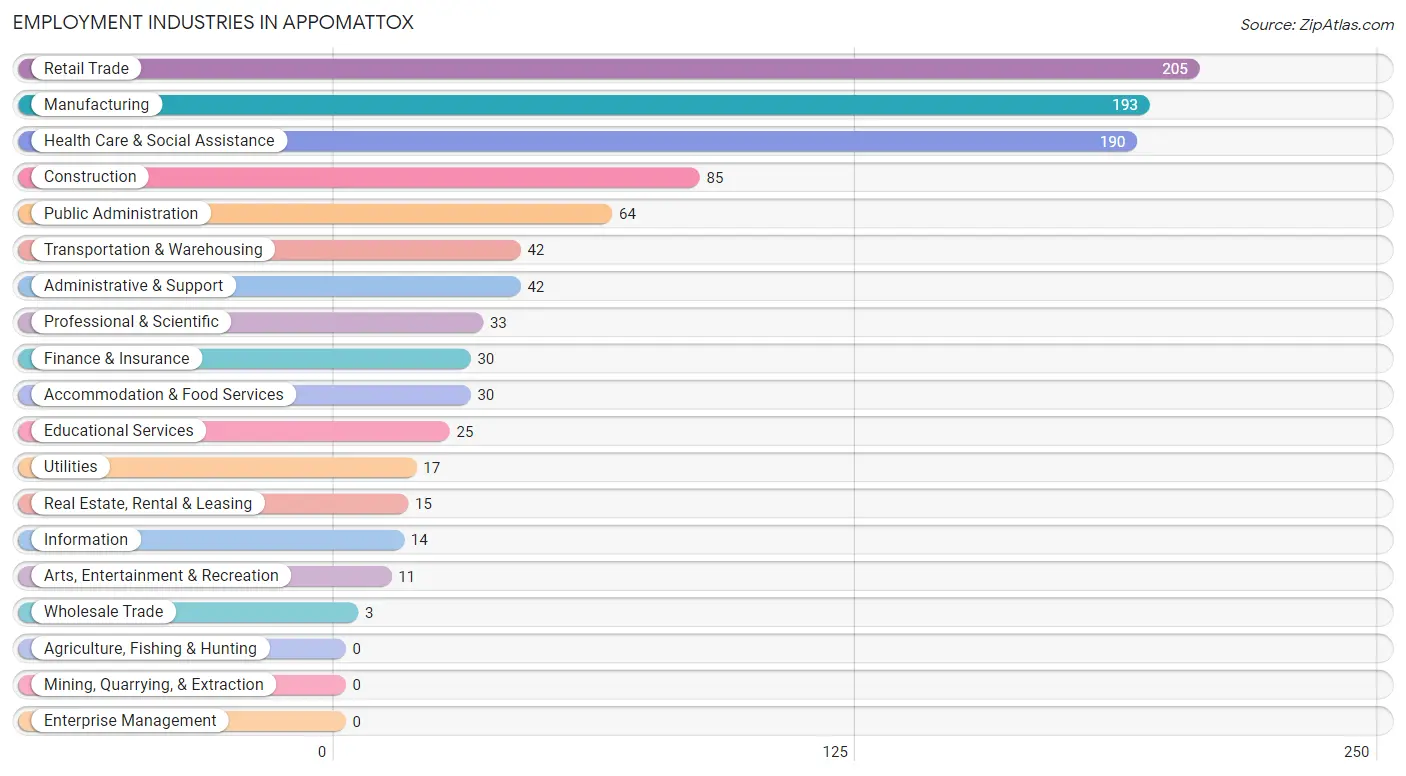
Employment Industries in Appomattox
The major employment industries in Appomattox include Retail Trade (205 | 19.8%), Manufacturing (193 | 18.6%), Health Care & Social Assistance (190 | 18.4%), Construction (85 | 8.2%), and Public Administration (64 | 6.2%).
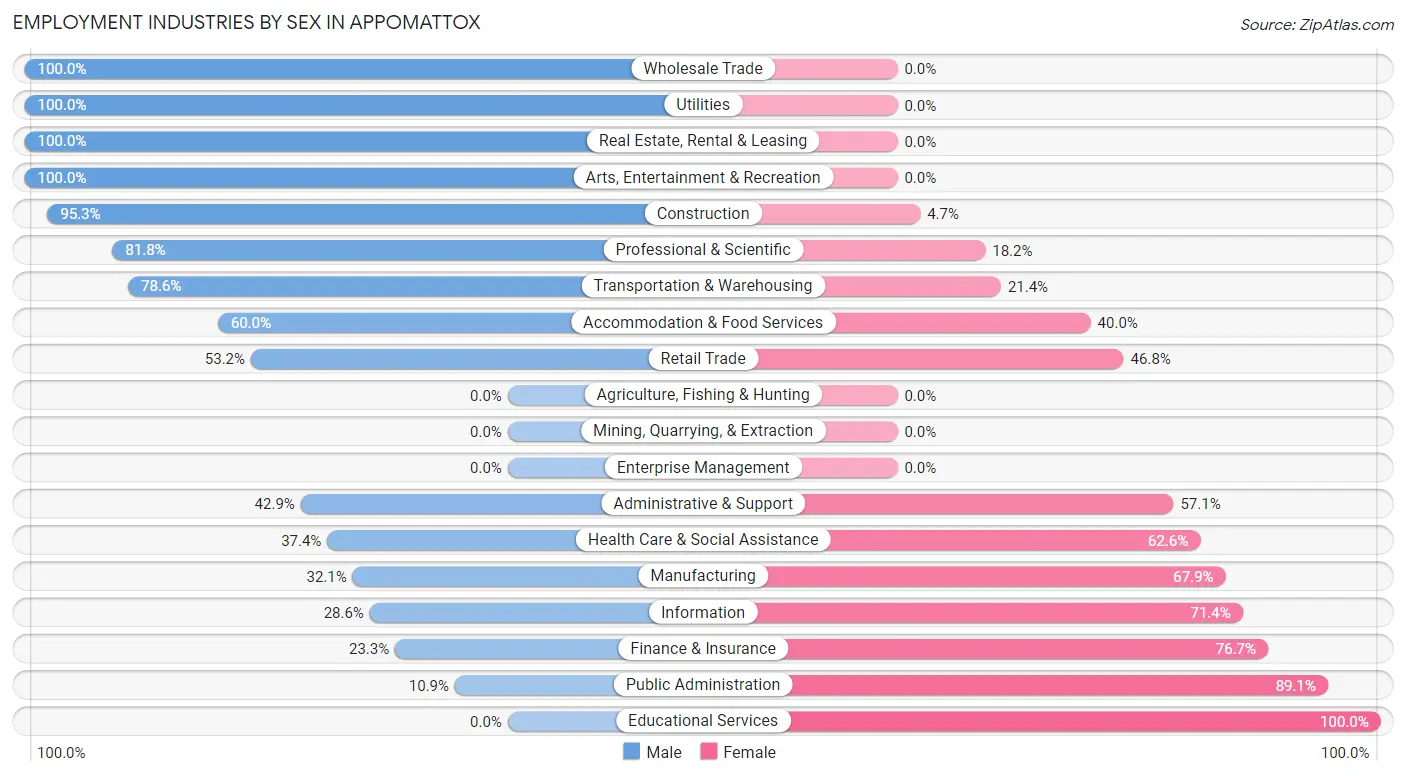
Employment Industries by Sex in Appomattox
The Appomattox industries that see more men than women are Wholesale Trade (100.0%), Utilities (100.0%), and Real Estate, Rental & Leasing (100.0%), whereas the industries that tend to have a higher number of women are Educational Services (100.0%), Public Administration (89.1%), and Finance & Insurance (76.7%).
| Industry | Male | Female |
| Agriculture, Fishing & Hunting | 0 (0.0%) | 0 (0.0%) |
| Mining, Quarrying, & Extraction | 0 (0.0%) | 0 (0.0%) |
| Construction | 81 (95.3%) | 4 (4.7%) |
| Manufacturing | 62 (32.1%) | 131 (67.9%) |
| Wholesale Trade | 3 (100.0%) | 0 (0.0%) |
| Retail Trade | 109 (53.2%) | 96 (46.8%) |
| Transportation & Warehousing | 33 (78.6%) | 9 (21.4%) |
| Utilities | 17 (100.0%) | 0 (0.0%) |
| Information | 4 (28.6%) | 10 (71.4%) |
| Finance & Insurance | 7 (23.3%) | 23 (76.7%) |
| Real Estate, Rental & Leasing | 15 (100.0%) | 0 (0.0%) |
| Professional & Scientific | 27 (81.8%) | 6 (18.2%) |
| Enterprise Management | 0 (0.0%) | 0 (0.0%) |
| Administrative & Support | 18 (42.9%) | 24 (57.1%) |
| Educational Services | 0 (0.0%) | 25 (100.0%) |
| Health Care & Social Assistance | 71 (37.4%) | 119 (62.6%) |
| Arts, Entertainment & Recreation | 11 (100.0%) | 0 (0.0%) |
| Accommodation & Food Services | 18 (60.0%) | 12 (40.0%) |
| Public Administration | 7 (10.9%) | 57 (89.1%) |
| Total | 493 (47.6%) | 542 (52.4%) |
Education in Appomattox
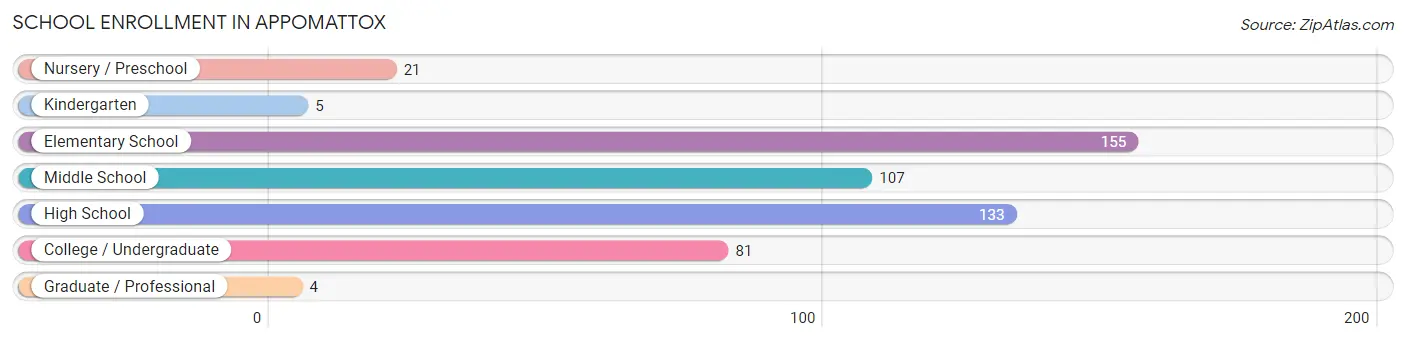
School Enrollment in Appomattox
The most common levels of schooling among the 506 students in Appomattox are elementary school (155 | 30.6%), high school (133 | 26.3%), and middle school (107 | 21.1%).
| School Level | # Students | % Students |
| Nursery / Preschool | 21 | 4.2% |
| Kindergarten | 5 | 1.0% |
| Elementary School | 155 | 30.6% |
| Middle School | 107 | 21.1% |
| High School | 133 | 26.3% |
| College / Undergraduate | 81 | 16.0% |
| Graduate / Professional | 4 | 0.8% |
| Total | 506 | 100.0% |
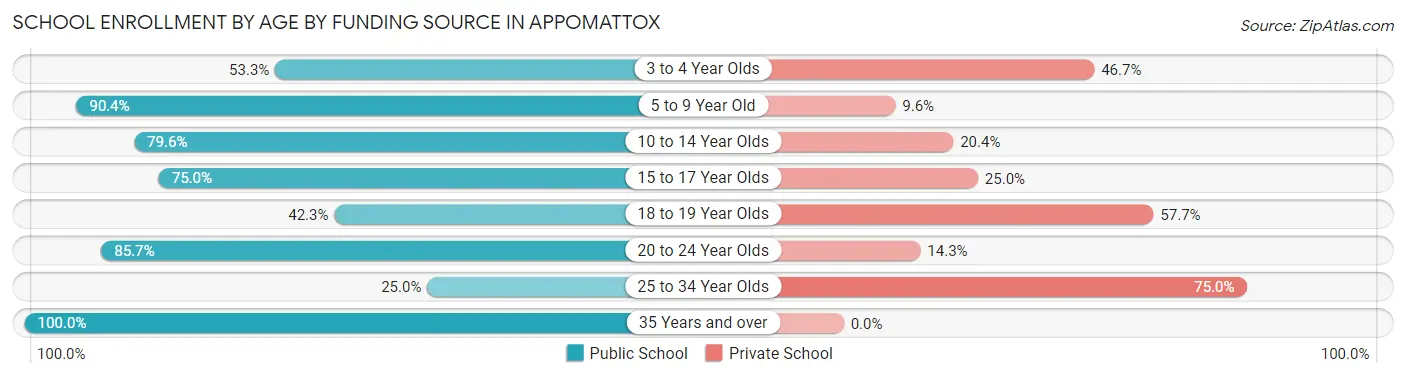
School Enrollment by Age by Funding Source in Appomattox
Out of a total of 506 students who are enrolled in schools in Appomattox, 117 (23.1%) attend a private institution, while the remaining 389 (76.9%) are enrolled in public schools. The age group of 25 to 34 year olds has the highest likelihood of being enrolled in private schools, with 18 (75.0% in the age bracket) enrolled. Conversely, the age group of 35 years and over has the lowest likelihood of being enrolled in a private school, with 14 (100.0% in the age bracket) attending a public institution.
| Age Bracket | Public School | Private School |
| 3 to 4 Year Olds | 8 (53.3%) | 7 (46.7%) |
| 5 to 9 Year Old | 122 (90.4%) | 13 (9.6%) |
| 10 to 14 Year Olds | 117 (79.6%) | 30 (20.4%) |
| 15 to 17 Year Olds | 93 (75.0%) | 31 (25.0%) |
| 18 to 19 Year Olds | 11 (42.3%) | 15 (57.7%) |
| 20 to 24 Year Olds | 18 (85.7%) | 3 (14.3%) |
| 25 to 34 Year Olds | 6 (25.0%) | 18 (75.0%) |
| 35 Years and over | 14 (100.0%) | 0 (0.0%) |
| Total | 389 (76.9%) | 117 (23.1%) |
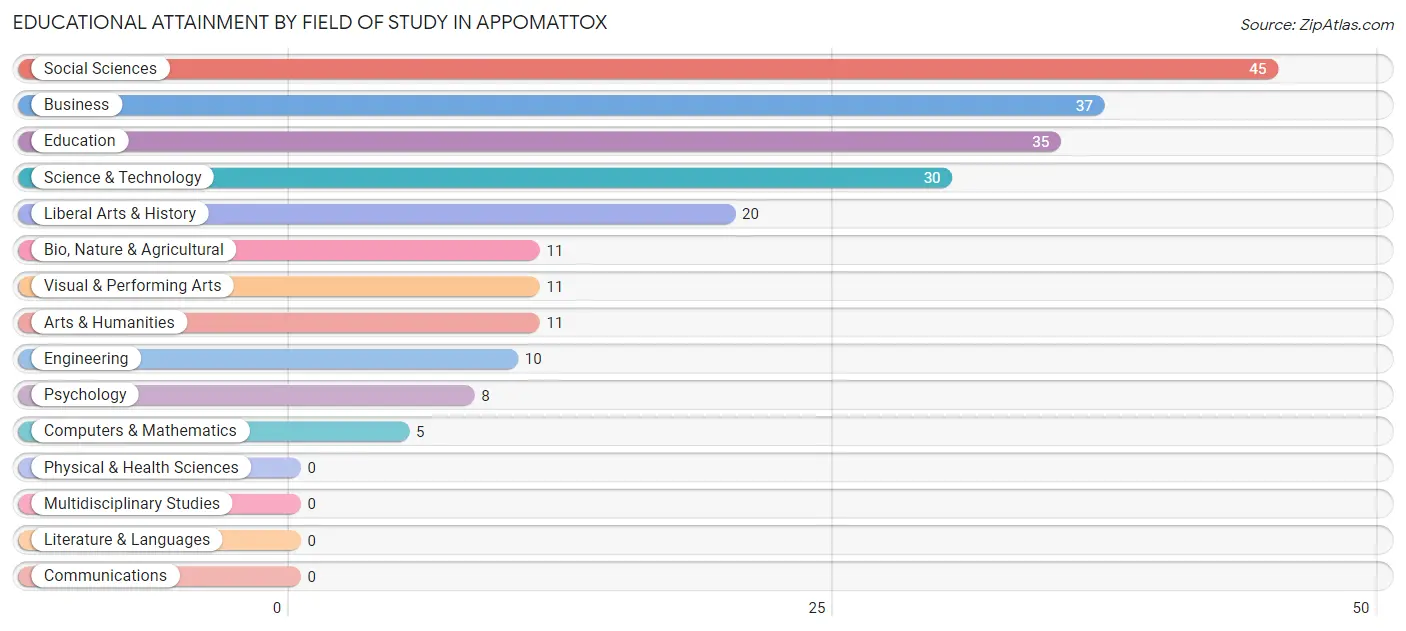
Educational Attainment by Field of Study in Appomattox
Social sciences (45 | 20.2%), business (37 | 16.6%), education (35 | 15.7%), science & technology (30 | 13.5%), and liberal arts & history (20 | 9.0%) are the most common fields of study among 223 individuals in Appomattox who have obtained a bachelor's degree or higher.
| Field of Study | # Graduates | % Graduates |
| Computers & Mathematics | 5 | 2.2% |
| Bio, Nature & Agricultural | 11 | 4.9% |
| Physical & Health Sciences | 0 | 0.0% |
| Psychology | 8 | 3.6% |
| Social Sciences | 45 | 20.2% |
| Engineering | 10 | 4.5% |
| Multidisciplinary Studies | 0 | 0.0% |
| Science & Technology | 30 | 13.5% |
| Business | 37 | 16.6% |
| Education | 35 | 15.7% |
| Literature & Languages | 0 | 0.0% |
| Liberal Arts & History | 20 | 9.0% |
| Visual & Performing Arts | 11 | 4.9% |
| Communications | 0 | 0.0% |
| Arts & Humanities | 11 | 4.9% |
| Total | 223 | 100.0% |
Transportation & Commute in Appomattox
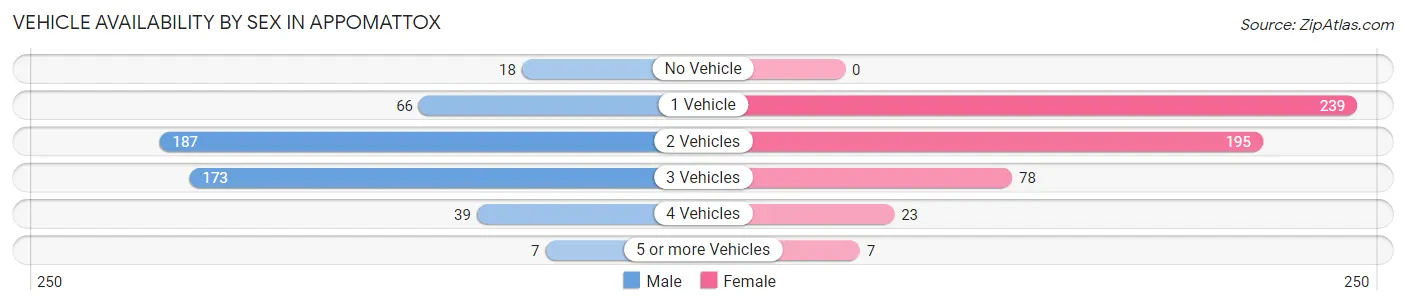
Vehicle Availability by Sex in Appomattox
The most prevalent vehicle ownership categories in Appomattox are males with 2 vehicles (187, accounting for 38.2%) and females with 2 vehicles (195, making up 34.5%).
| Vehicles Available | Male | Female |
| No Vehicle | 18 (3.7%) | 0 (0.0%) |
| 1 Vehicle | 66 (13.5%) | 239 (44.1%) |
| 2 Vehicles | 187 (38.2%) | 195 (36.0%) |
| 3 Vehicles | 173 (35.3%) | 78 (14.4%) |
| 4 Vehicles | 39 (8.0%) | 23 (4.2%) |
| 5 or more Vehicles | 7 (1.4%) | 7 (1.3%) |
| Total | 490 (100.0%) | 542 (100.0%) |
Commute Time in Appomattox
The most frequently occuring commute durations in Appomattox are 30 to 34 minutes (262 commuters, 26.7%), 5 to 9 minutes (138 commuters, 14.1%), and less than 5 minutes (130 commuters, 13.2%).
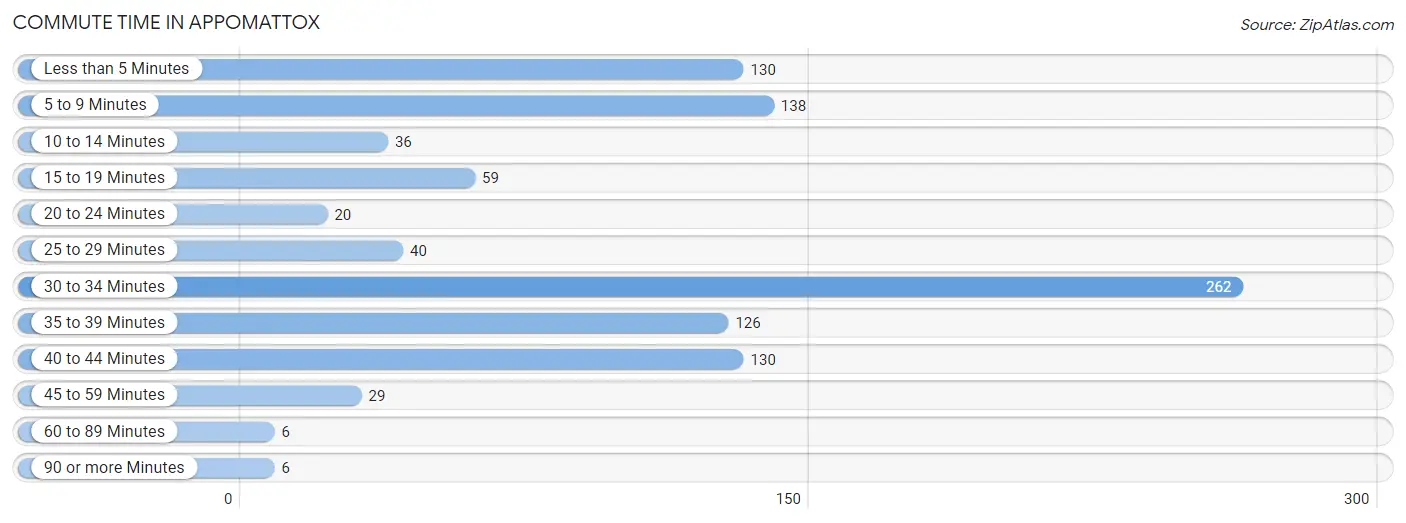
| Commute Time | # Commuters | % Commuters |
| Less than 5 Minutes | 130 | 13.2% |
| 5 to 9 Minutes | 138 | 14.1% |
| 10 to 14 Minutes | 36 | 3.7% |
| 15 to 19 Minutes | 59 | 6.0% |
| 20 to 24 Minutes | 20 | 2.0% |
| 25 to 29 Minutes | 40 | 4.1% |
| 30 to 34 Minutes | 262 | 26.7% |
| 35 to 39 Minutes | 126 | 12.8% |
| 40 to 44 Minutes | 130 | 13.2% |
| 45 to 59 Minutes | 29 | 2.9% |
| 60 to 89 Minutes | 6 | 0.6% |
| 90 or more Minutes | 6 | 0.6% |
Commute Time by Sex in Appomattox
The most common commute times in Appomattox are 30 to 34 minutes (170 commuters, 35.9%) for males and 40 to 44 minutes (118 commuters, 23.2%) for females.
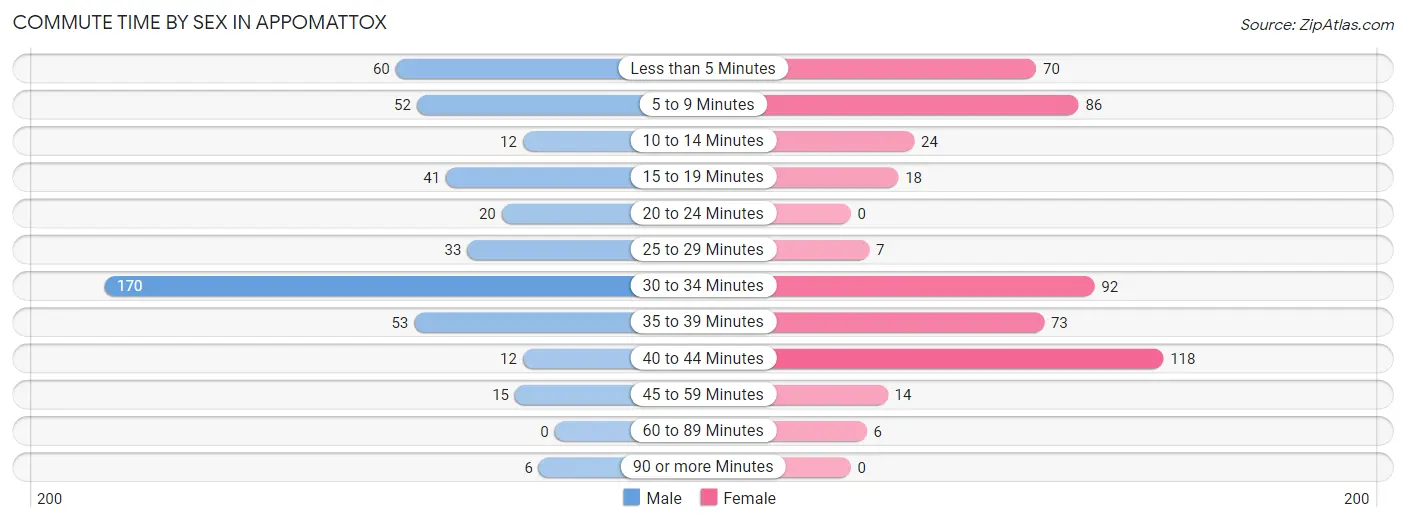
| Commute Time | Male | Female |
| Less than 5 Minutes | 60 (12.7%) | 70 (13.8%) |
| 5 to 9 Minutes | 52 (11.0%) | 86 (16.9%) |
| 10 to 14 Minutes | 12 (2.5%) | 24 (4.7%) |
| 15 to 19 Minutes | 41 (8.6%) | 18 (3.5%) |
| 20 to 24 Minutes | 20 (4.2%) | 0 (0.0%) |
| 25 to 29 Minutes | 33 (7.0%) | 7 (1.4%) |
| 30 to 34 Minutes | 170 (35.9%) | 92 (18.1%) |
| 35 to 39 Minutes | 53 (11.2%) | 73 (14.4%) |
| 40 to 44 Minutes | 12 (2.5%) | 118 (23.2%) |
| 45 to 59 Minutes | 15 (3.2%) | 14 (2.8%) |
| 60 to 89 Minutes | 0 (0.0%) | 6 (1.2%) |
| 90 or more Minutes | 6 (1.3%) | 0 (0.0%) |
Time of Departure to Work by Sex in Appomattox
The most frequent times of departure to work in Appomattox are 8:00 AM to 8:29 AM (108, 22.8%) for males and 12:00 AM to 4:59 AM (93, 18.3%) for females.
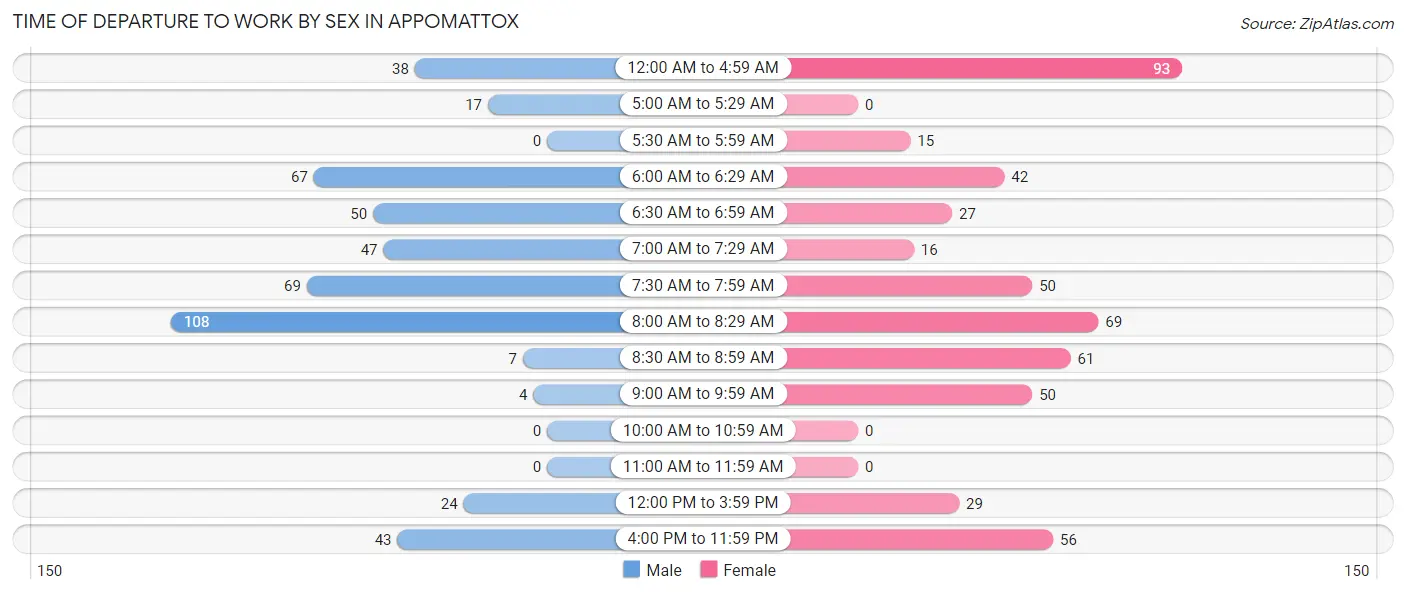
| Time of Departure | Male | Female |
| 12:00 AM to 4:59 AM | 38 (8.0%) | 93 (18.3%) |
| 5:00 AM to 5:29 AM | 17 (3.6%) | 0 (0.0%) |
| 5:30 AM to 5:59 AM | 0 (0.0%) | 15 (2.9%) |
| 6:00 AM to 6:29 AM | 67 (14.1%) | 42 (8.3%) |
| 6:30 AM to 6:59 AM | 50 (10.5%) | 27 (5.3%) |
| 7:00 AM to 7:29 AM | 47 (9.9%) | 16 (3.2%) |
| 7:30 AM to 7:59 AM | 69 (14.6%) | 50 (9.8%) |
| 8:00 AM to 8:29 AM | 108 (22.8%) | 69 (13.6%) |
| 8:30 AM to 8:59 AM | 7 (1.5%) | 61 (12.0%) |
| 9:00 AM to 9:59 AM | 4 (0.8%) | 50 (9.8%) |
| 10:00 AM to 10:59 AM | 0 (0.0%) | 0 (0.0%) |
| 11:00 AM to 11:59 AM | 0 (0.0%) | 0 (0.0%) |
| 12:00 PM to 3:59 PM | 24 (5.1%) | 29 (5.7%) |
| 4:00 PM to 11:59 PM | 43 (9.1%) | 56 (11.0%) |
| Total | 474 (100.0%) | 508 (100.0%) |
Housing Occupancy in Appomattox
Occupancy by Ownership in Appomattox
Of the total 829 dwellings in Appomattox, owner-occupied units account for 566 (68.3%), while renter-occupied units make up 263 (31.7%).
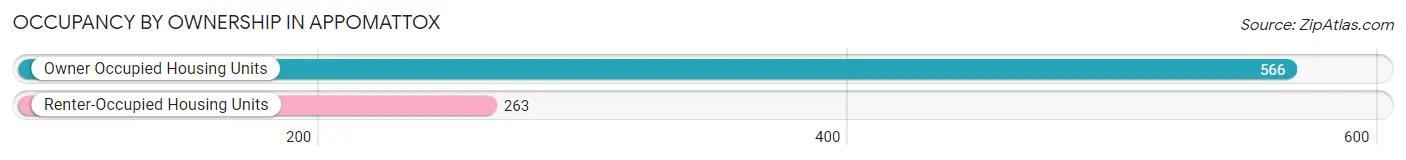
| Occupancy | # Housing Units | % Housing Units |
| Owner Occupied Housing Units | 566 | 68.3% |
| Renter-Occupied Housing Units | 263 | 31.7% |
| Total Occupied Housing Units | 829 | 100.0% |
Occupancy by Household Size in Appomattox
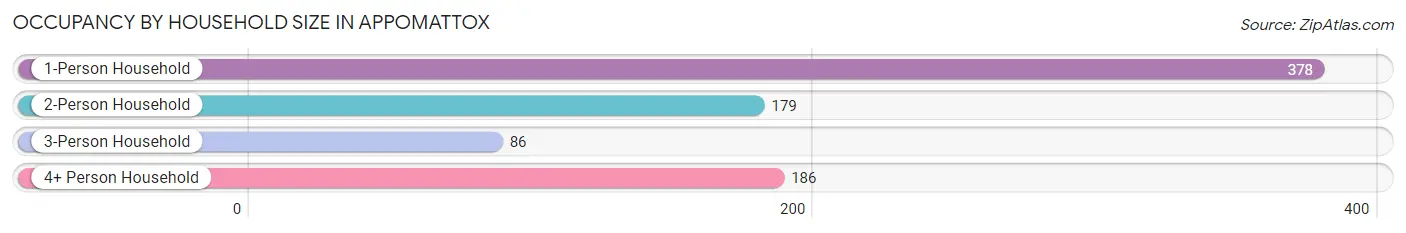
| Household Size | # Housing Units | % Housing Units |
| 1-Person Household | 378 | 45.6% |
| 2-Person Household | 179 | 21.6% |
| 3-Person Household | 86 | 10.4% |
| 4+ Person Household | 186 | 22.4% |
| Total Housing Units | 829 | 100.0% |
Occupancy by Ownership by Household Size in Appomattox
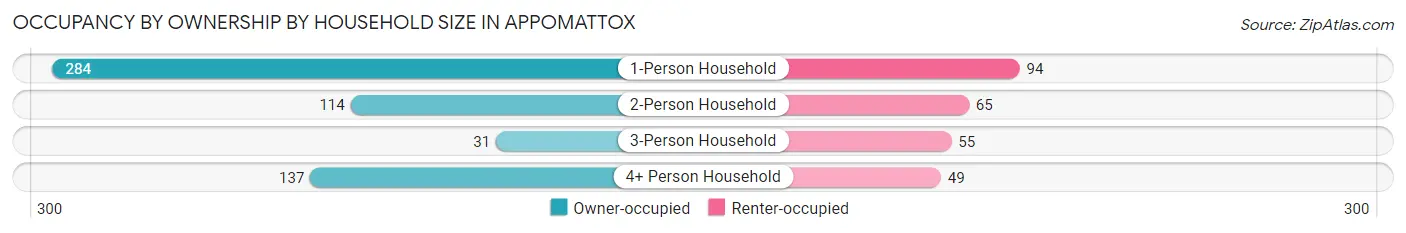
| Household Size | Owner-occupied | Renter-occupied |
| 1-Person Household | 284 (75.1%) | 94 (24.9%) |
| 2-Person Household | 114 (63.7%) | 65 (36.3%) |
| 3-Person Household | 31 (36.0%) | 55 (63.9%) |
| 4+ Person Household | 137 (73.7%) | 49 (26.3%) |
| Total Housing Units | 566 (68.3%) | 263 (31.7%) |
Occupancy by Educational Attainment in Appomattox
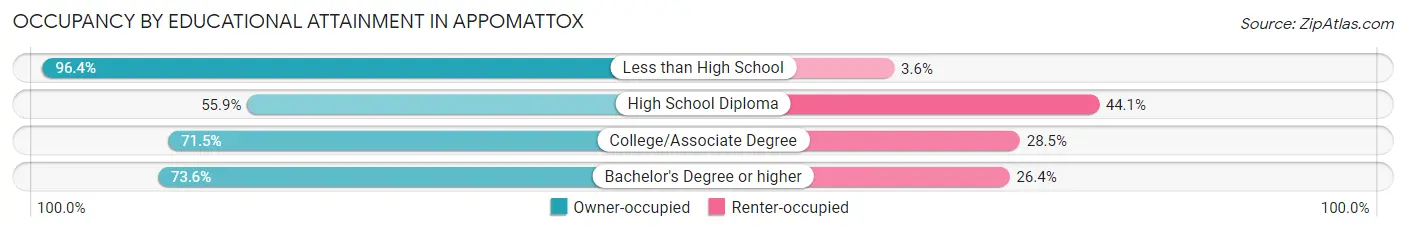
| Household Size | Owner-occupied | Renter-occupied |
| Less than High School | 81 (96.4%) | 3 (3.6%) |
| High School Diploma | 181 (55.9%) | 143 (44.1%) |
| College/Associate Degree | 201 (71.5%) | 80 (28.5%) |
| Bachelor's Degree or higher | 103 (73.6%) | 37 (26.4%) |
Occupancy by Age of Householder in Appomattox
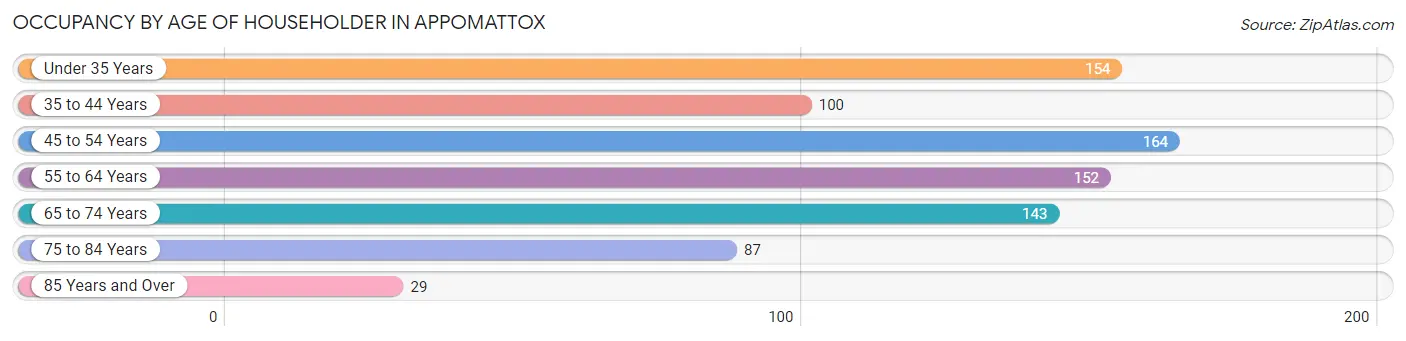
| Age Bracket | # Households | % Households |
| Under 35 Years | 154 | 18.6% |
| 35 to 44 Years | 100 | 12.1% |
| 45 to 54 Years | 164 | 19.8% |
| 55 to 64 Years | 152 | 18.3% |
| 65 to 74 Years | 143 | 17.2% |
| 75 to 84 Years | 87 | 10.5% |
| 85 Years and Over | 29 | 3.5% |
| Total | 829 | 100.0% |
Housing Finances in Appomattox
Median Income by Occupancy in Appomattox
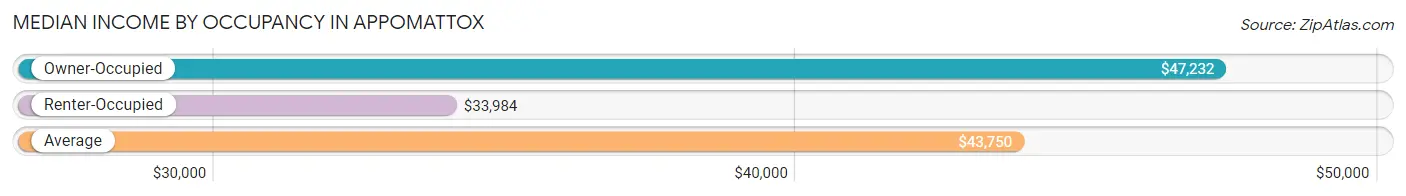
| Occupancy Type | # Households | Median Income |
| Owner-Occupied | 566 (68.3%) | $47,232 |
| Renter-Occupied | 263 (31.7%) | $33,984 |
| Average | 829 (100.0%) | $43,750 |
Occupancy by Householder Income Bracket in Appomattox
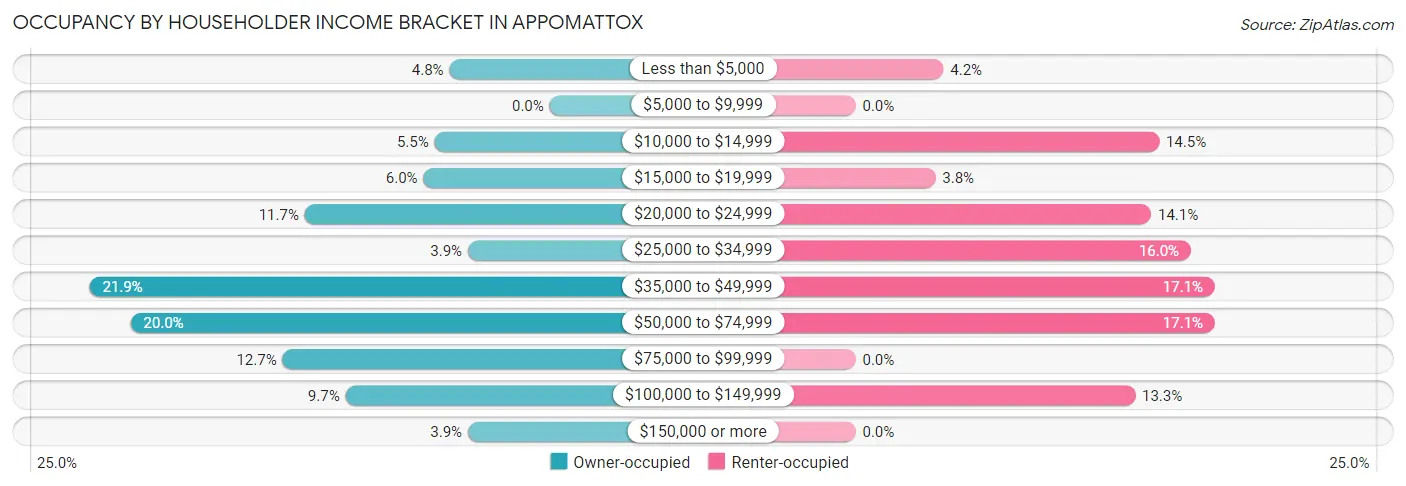
| Income Bracket | Owner-occupied | Renter-occupied |
| Less than $5,000 | 27 (4.8%) | 11 (4.2%) |
| $5,000 to $9,999 | 0 (0.0%) | 0 (0.0%) |
| $10,000 to $14,999 | 31 (5.5%) | 38 (14.4%) |
| $15,000 to $19,999 | 34 (6.0%) | 10 (3.8%) |
| $20,000 to $24,999 | 66 (11.7%) | 37 (14.1%) |
| $25,000 to $34,999 | 22 (3.9%) | 42 (16.0%) |
| $35,000 to $49,999 | 124 (21.9%) | 45 (17.1%) |
| $50,000 to $74,999 | 113 (20.0%) | 45 (17.1%) |
| $75,000 to $99,999 | 72 (12.7%) | 0 (0.0%) |
| $100,000 to $149,999 | 55 (9.7%) | 35 (13.3%) |
| $150,000 or more | 22 (3.9%) | 0 (0.0%) |
| Total | 566 (100.0%) | 263 (100.0%) |
Monthly Housing Cost Tiers in Appomattox
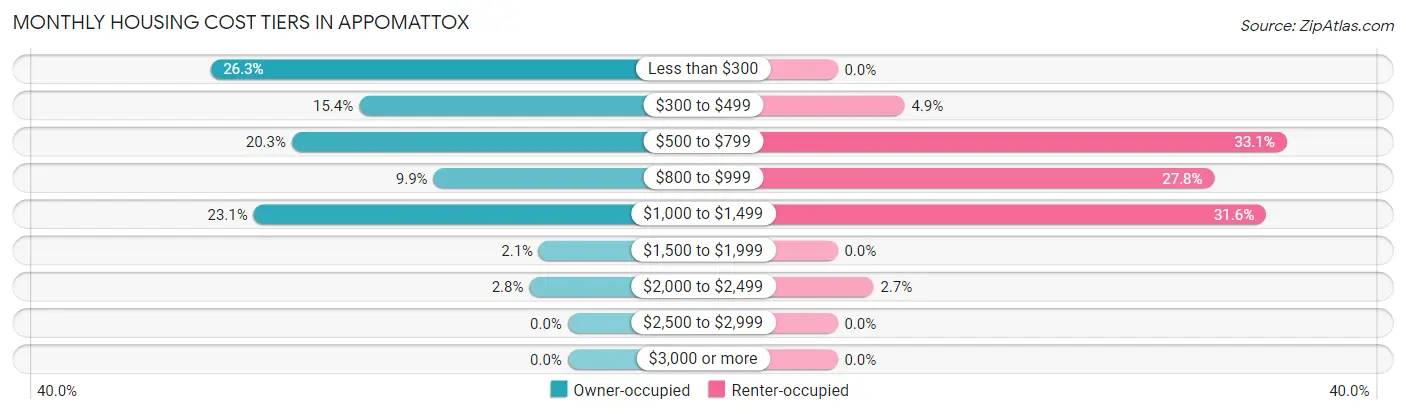
| Monthly Cost | Owner-occupied | Renter-occupied |
| Less than $300 | 149 (26.3%) | 0 (0.0%) |
| $300 to $499 | 87 (15.4%) | 13 (4.9%) |
| $500 to $799 | 115 (20.3%) | 87 (33.1%) |
| $800 to $999 | 56 (9.9%) | 73 (27.8%) |
| $1,000 to $1,499 | 131 (23.1%) | 83 (31.6%) |
| $1,500 to $1,999 | 12 (2.1%) | 0 (0.0%) |
| $2,000 to $2,499 | 16 (2.8%) | 7 (2.7%) |
| $2,500 to $2,999 | 0 (0.0%) | 0 (0.0%) |
| $3,000 or more | 0 (0.0%) | 0 (0.0%) |
| Total | 566 (100.0%) | 263 (100.0%) |
Physical Housing Characteristics in Appomattox
Housing Structures in Appomattox
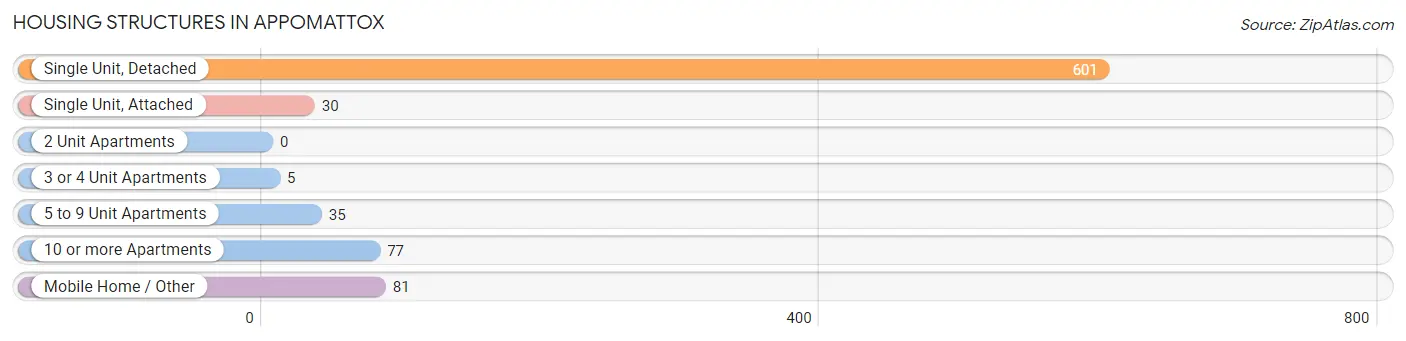
| Structure Type | # Housing Units | % Housing Units |
| Single Unit, Detached | 601 | 72.5% |
| Single Unit, Attached | 30 | 3.6% |
| 2 Unit Apartments | 0 | 0.0% |
| 3 or 4 Unit Apartments | 5 | 0.6% |
| 5 to 9 Unit Apartments | 35 | 4.2% |
| 10 or more Apartments | 77 | 9.3% |
| Mobile Home / Other | 81 | 9.8% |
| Total | 829 | 100.0% |
Housing Structures by Occupancy in Appomattox
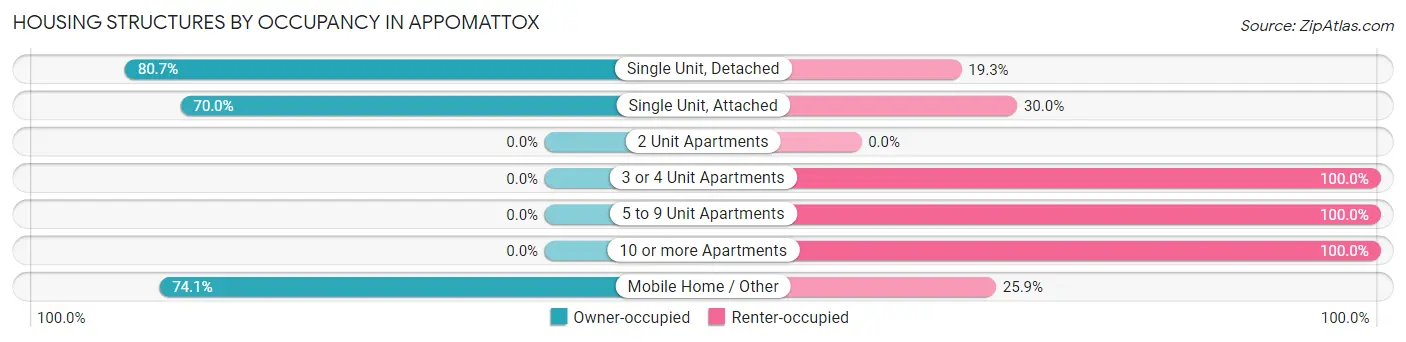
| Structure Type | Owner-occupied | Renter-occupied |
| Single Unit, Detached | 485 (80.7%) | 116 (19.3%) |
| Single Unit, Attached | 21 (70.0%) | 9 (30.0%) |
| 2 Unit Apartments | 0 (0.0%) | 0 (0.0%) |
| 3 or 4 Unit Apartments | 0 (0.0%) | 5 (100.0%) |
| 5 to 9 Unit Apartments | 0 (0.0%) | 35 (100.0%) |
| 10 or more Apartments | 0 (0.0%) | 77 (100.0%) |
| Mobile Home / Other | 60 (74.1%) | 21 (25.9%) |
| Total | 566 (68.3%) | 263 (31.7%) |
Housing Structures by Number of Rooms in Appomattox
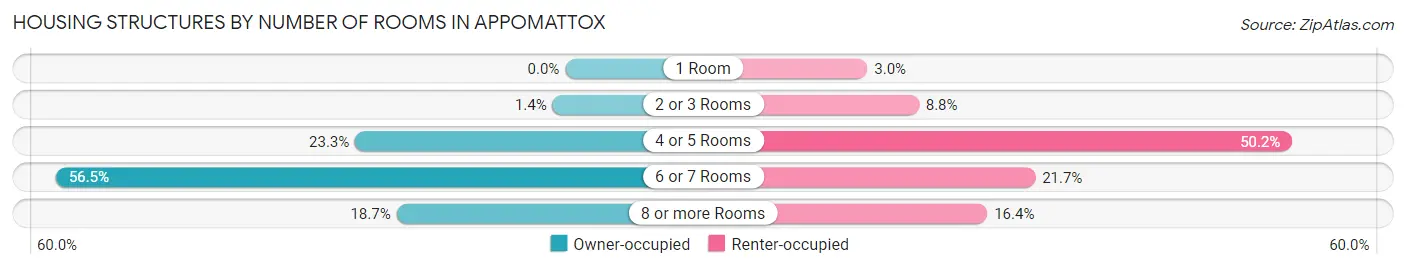
| Number of Rooms | Owner-occupied | Renter-occupied |
| 1 Room | 0 (0.0%) | 8 (3.0%) |
| 2 or 3 Rooms | 8 (1.4%) | 23 (8.7%) |
| 4 or 5 Rooms | 132 (23.3%) | 132 (50.2%) |
| 6 or 7 Rooms | 320 (56.5%) | 57 (21.7%) |
| 8 or more Rooms | 106 (18.7%) | 43 (16.4%) |
| Total | 566 (100.0%) | 263 (100.0%) |
Housing Structure by Heating Type in Appomattox
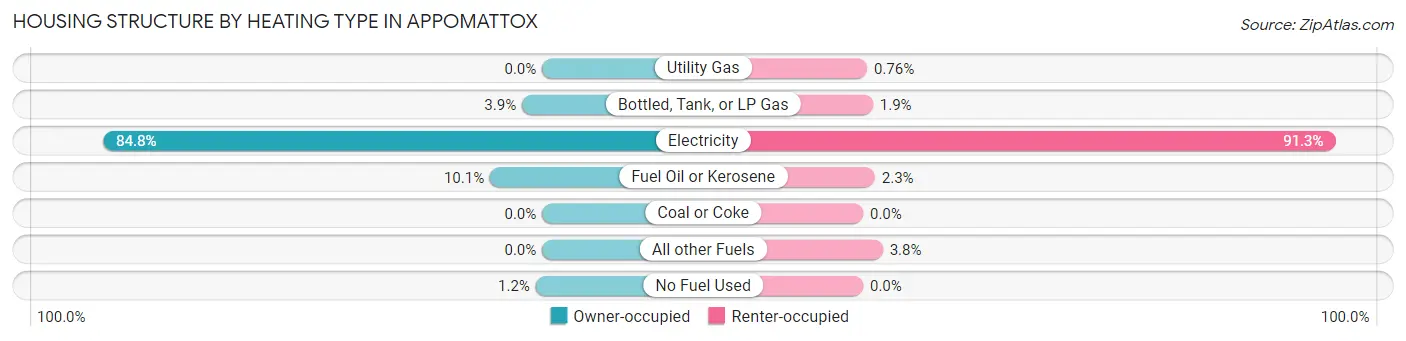
| Heating Type | Owner-occupied | Renter-occupied |
| Utility Gas | 0 (0.0%) | 2 (0.8%) |
| Bottled, Tank, or LP Gas | 22 (3.9%) | 5 (1.9%) |
| Electricity | 480 (84.8%) | 240 (91.2%) |
| Fuel Oil or Kerosene | 57 (10.1%) | 6 (2.3%) |
| Coal or Coke | 0 (0.0%) | 0 (0.0%) |
| All other Fuels | 0 (0.0%) | 10 (3.8%) |
| No Fuel Used | 7 (1.2%) | 0 (0.0%) |
| Total | 566 (100.0%) | 263 (100.0%) |
Household Vehicle Usage in Appomattox
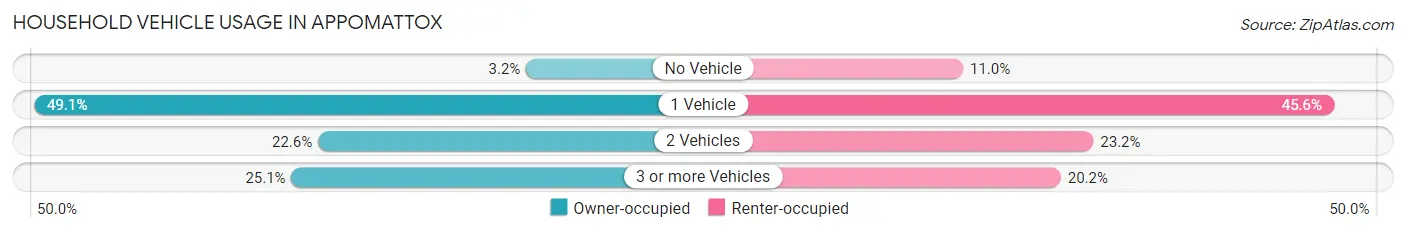
| Vehicles per Household | Owner-occupied | Renter-occupied |
| No Vehicle | 18 (3.2%) | 29 (11.0%) |
| 1 Vehicle | 278 (49.1%) | 120 (45.6%) |
| 2 Vehicles | 128 (22.6%) | 61 (23.2%) |
| 3 or more Vehicles | 142 (25.1%) | 53 (20.2%) |
| Total | 566 (100.0%) | 263 (100.0%) |
Real Estate & Mortgages in Appomattox
Real Estate and Mortgage Overview in Appomattox
| Characteristic | Without Mortgage | With Mortgage |
| Housing Units | 302 | 264 |
| Median Property Value | $121,100 | $142,400 |
| Median Household Income | $30,000 | $22 |
| Monthly Housing Costs | $313 | $0 |
| Real Estate Taxes | $572 | $0 |
Property Value by Mortgage Status in Appomattox
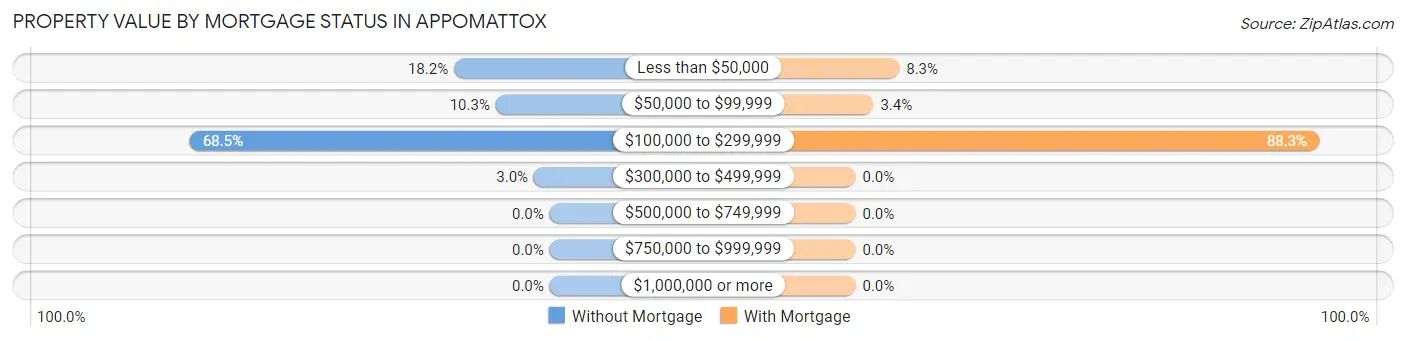
| Property Value | Without Mortgage | With Mortgage |
| Less than $50,000 | 55 (18.2%) | 22 (8.3%) |
| $50,000 to $99,999 | 31 (10.3%) | 9 (3.4%) |
| $100,000 to $299,999 | 207 (68.5%) | 233 (88.3%) |
| $300,000 to $499,999 | 9 (3.0%) | 0 (0.0%) |
| $500,000 to $749,999 | 0 (0.0%) | 0 (0.0%) |
| $750,000 to $999,999 | 0 (0.0%) | 0 (0.0%) |
| $1,000,000 or more | 0 (0.0%) | 0 (0.0%) |
| Total | 302 (100.0%) | 264 (100.0%) |
Household Income by Mortgage Status in Appomattox
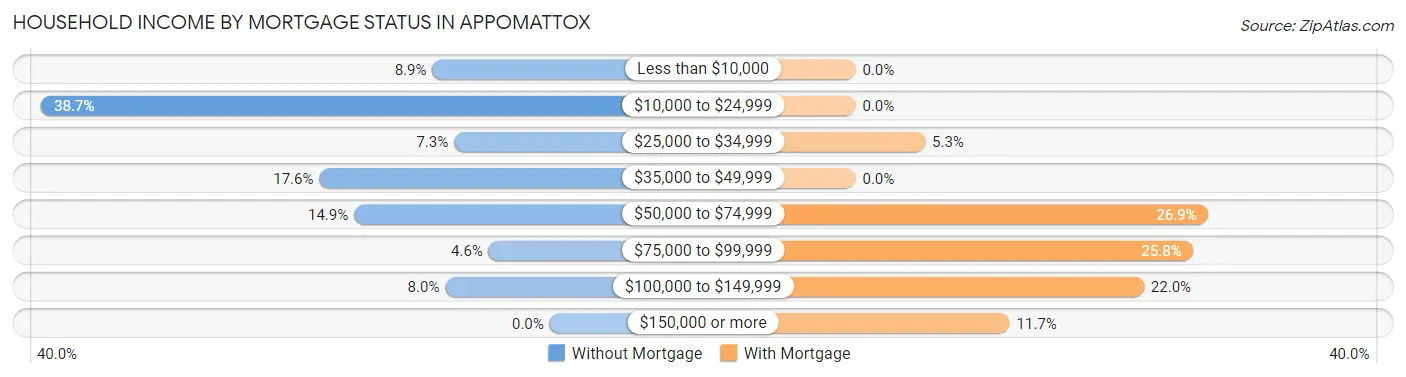
| Household Income | Without Mortgage | With Mortgage |
| Less than $10,000 | 27 (8.9%) | 0 (0.0%) |
| $10,000 to $24,999 | 117 (38.7%) | 0 (0.0%) |
| $25,000 to $34,999 | 22 (7.3%) | 14 (5.3%) |
| $35,000 to $49,999 | 53 (17.5%) | 0 (0.0%) |
| $50,000 to $74,999 | 45 (14.9%) | 71 (26.9%) |
| $75,000 to $99,999 | 14 (4.6%) | 68 (25.8%) |
| $100,000 to $149,999 | 24 (8.0%) | 58 (22.0%) |
| $150,000 or more | 0 (0.0%) | 31 (11.7%) |
| Total | 302 (100.0%) | 264 (100.0%) |
Property Value to Household Income Ratio in Appomattox
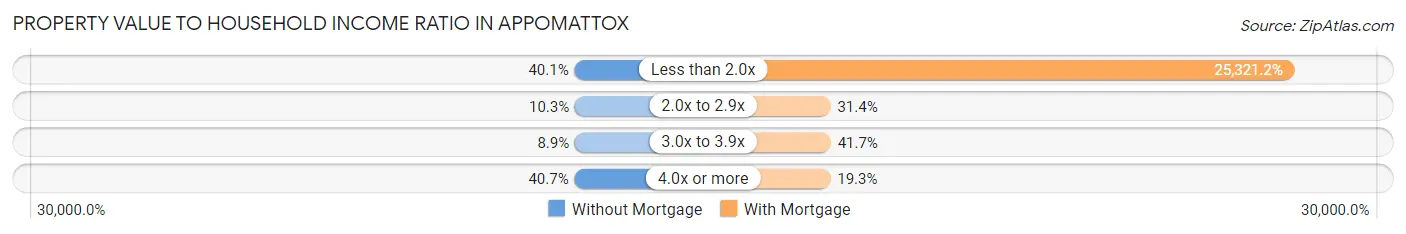
| Value-to-Income Ratio | Without Mortgage | With Mortgage |
| Less than 2.0x | 121 (40.1%) | 66,848 (25,321.2%) |
| 2.0x to 2.9x | 31 (10.3%) | 83 (31.4%) |
| 3.0x to 3.9x | 27 (8.9%) | 110 (41.7%) |
| 4.0x or more | 123 (40.7%) | 51 (19.3%) |
| Total | 302 (100.0%) | 264 (100.0%) |
Real Estate Taxes by Mortgage Status in Appomattox
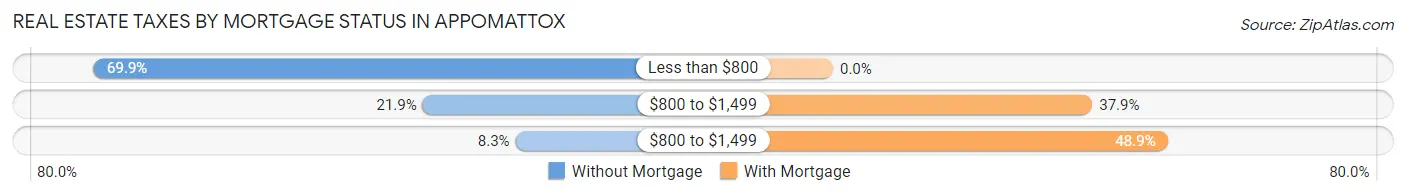
| Property Taxes | Without Mortgage | With Mortgage |
| Less than $800 | 211 (69.9%) | 0 (0.0%) |
| $800 to $1,499 | 66 (21.8%) | 100 (37.9%) |
| $800 to $1,499 | 25 (8.3%) | 129 (48.9%) |
| Total | 302 (100.0%) | 264 (100.0%) |
Health & Disability in Appomattox
Health Insurance Coverage by Age in Appomattox
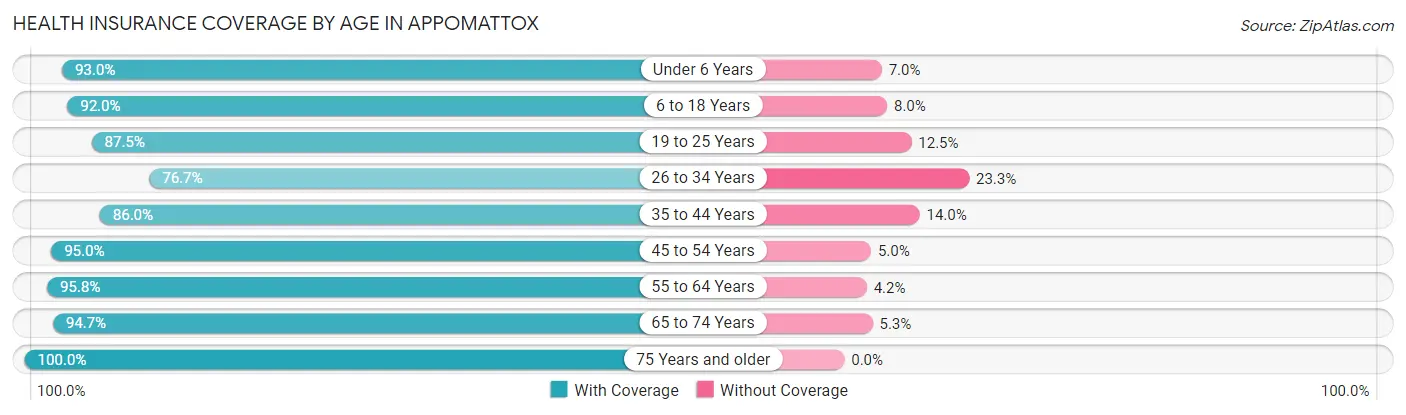
| Age Bracket | With Coverage | Without Coverage |
| Under 6 Years | 120 (93.0%) | 9 (7.0%) |
| 6 to 18 Years | 404 (92.0%) | 35 (8.0%) |
| 19 to 25 Years | 175 (87.5%) | 25 (12.5%) |
| 26 to 34 Years | 165 (76.7%) | 50 (23.3%) |
| 35 to 44 Years | 202 (86.0%) | 33 (14.0%) |
| 45 to 54 Years | 325 (95.0%) | 17 (5.0%) |
| 55 to 64 Years | 229 (95.8%) | 10 (4.2%) |
| 65 to 74 Years | 144 (94.7%) | 8 (5.3%) |
| 75 Years and older | 144 (100.0%) | 0 (0.0%) |
| Total | 1,908 (91.1%) | 187 (8.9%) |
Health Insurance Coverage by Citizenship Status in Appomattox
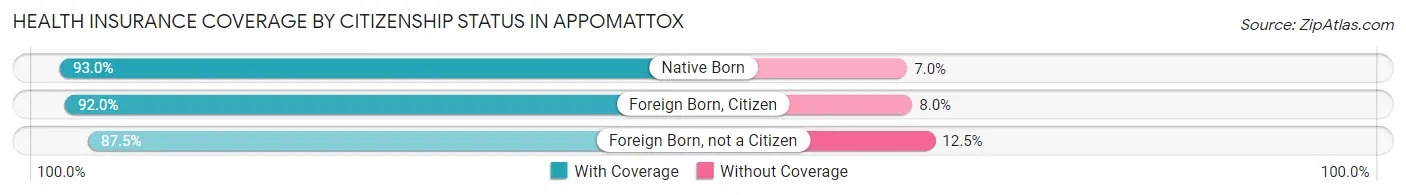
| Citizenship Status | With Coverage | Without Coverage |
| Native Born | 120 (93.0%) | 9 (7.0%) |
| Foreign Born, Citizen | 404 (92.0%) | 35 (8.0%) |
| Foreign Born, not a Citizen | 175 (87.5%) | 25 (12.5%) |
Health Insurance Coverage by Household Income in Appomattox
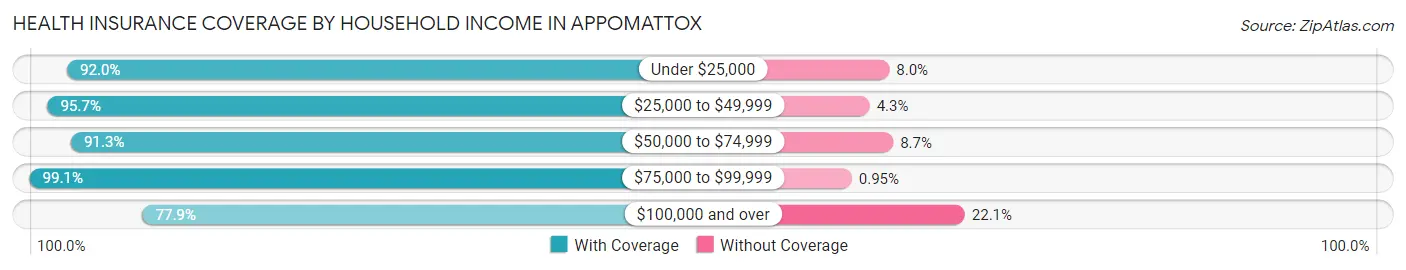
| Household Income | With Coverage | Without Coverage |
| Under $25,000 | 427 (92.0%) | 37 (8.0%) |
| $25,000 to $49,999 | 402 (95.7%) | 18 (4.3%) |
| $50,000 to $74,999 | 315 (91.3%) | 30 (8.7%) |
| $75,000 to $99,999 | 419 (99.1%) | 4 (0.9%) |
| $100,000 and over | 345 (77.9%) | 98 (22.1%) |
Public vs Private Health Insurance Coverage by Age in Appomattox
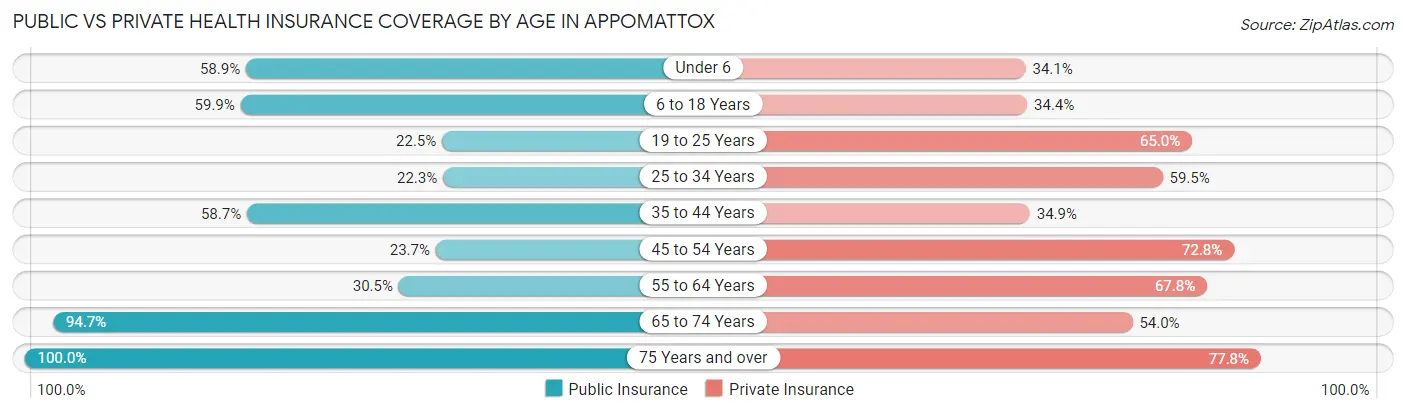
| Age Bracket | Public Insurance | Private Insurance |
| Under 6 | 76 (58.9%) | 44 (34.1%) |
| 6 to 18 Years | 263 (59.9%) | 151 (34.4%) |
| 19 to 25 Years | 45 (22.5%) | 130 (65.0%) |
| 25 to 34 Years | 48 (22.3%) | 128 (59.5%) |
| 35 to 44 Years | 138 (58.7%) | 82 (34.9%) |
| 45 to 54 Years | 81 (23.7%) | 249 (72.8%) |
| 55 to 64 Years | 73 (30.5%) | 162 (67.8%) |
| 65 to 74 Years | 144 (94.7%) | 82 (53.9%) |
| 75 Years and over | 144 (100.0%) | 112 (77.8%) |
| Total | 1,012 (48.3%) | 1,140 (54.4%) |
Disability Status by Sex by Age in Appomattox
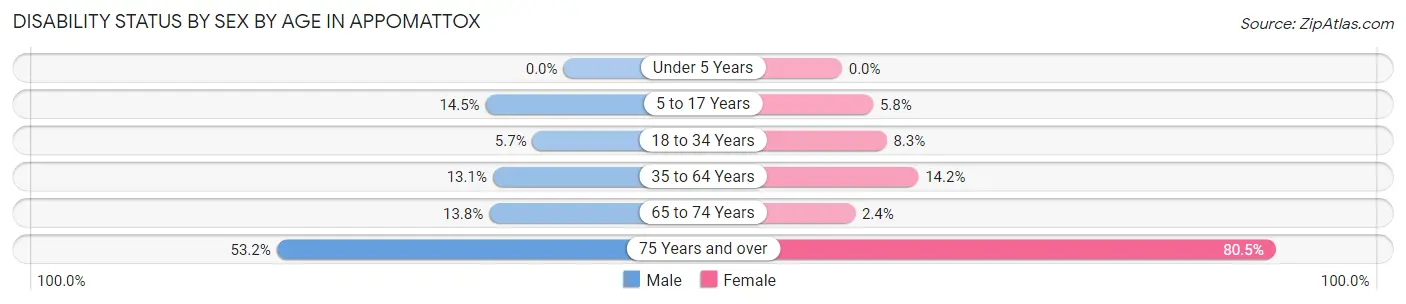
| Age Bracket | Male | Female |
| Under 5 Years | 0 (0.0%) | 0 (0.0%) |
| 5 to 17 Years | 36 (14.5%) | 10 (5.8%) |
| 18 to 34 Years | 13 (5.7%) | 18 (8.3%) |
| 35 to 64 Years | 46 (13.1%) | 66 (14.2%) |
| 65 to 74 Years | 4 (13.8%) | 3 (2.4%) |
| 75 Years and over | 33 (53.2%) | 66 (80.5%) |
Disability Class by Sex by Age in Appomattox
Disability Class: Hearing Difficulty
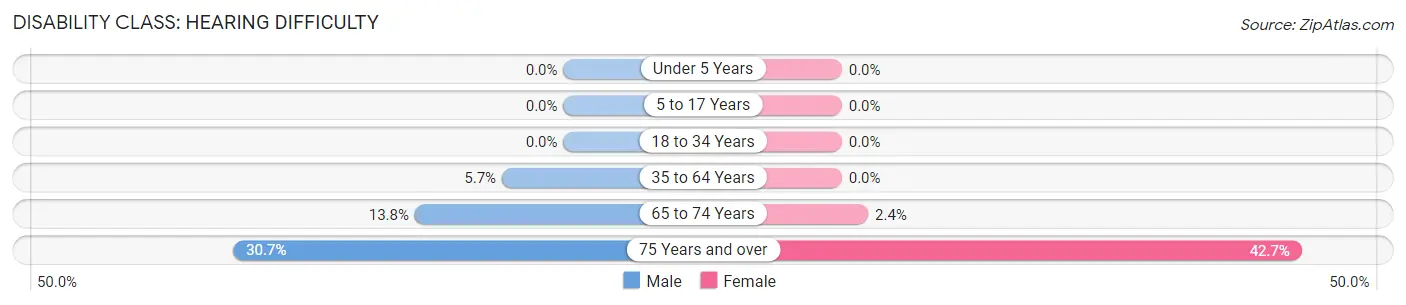
| Age Bracket | Male | Female |
| Under 5 Years | 0 (0.0%) | 0 (0.0%) |
| 5 to 17 Years | 0 (0.0%) | 0 (0.0%) |
| 18 to 34 Years | 0 (0.0%) | 0 (0.0%) |
| 35 to 64 Years | 20 (5.7%) | 0 (0.0%) |
| 65 to 74 Years | 4 (13.8%) | 3 (2.4%) |
| 75 Years and over | 19 (30.6%) | 35 (42.7%) |
Disability Class: Vision Difficulty
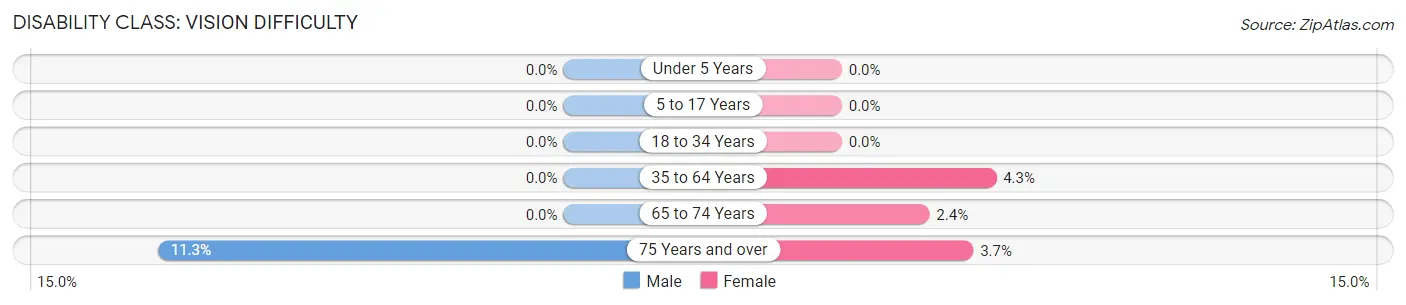
| Age Bracket | Male | Female |
| Under 5 Years | 0 (0.0%) | 0 (0.0%) |
| 5 to 17 Years | 0 (0.0%) | 0 (0.0%) |
| 18 to 34 Years | 0 (0.0%) | 0 (0.0%) |
| 35 to 64 Years | 0 (0.0%) | 20 (4.3%) |
| 65 to 74 Years | 0 (0.0%) | 3 (2.4%) |
| 75 Years and over | 7 (11.3%) | 3 (3.7%) |
Disability Class: Cognitive Difficulty
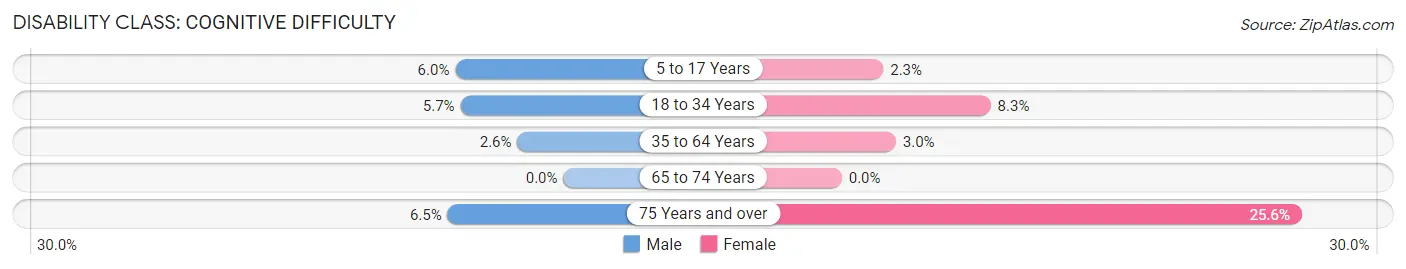
| Age Bracket | Male | Female |
| 5 to 17 Years | 15 (6.0%) | 4 (2.3%) |
| 18 to 34 Years | 13 (5.7%) | 18 (8.3%) |
| 35 to 64 Years | 9 (2.6%) | 14 (3.0%) |
| 65 to 74 Years | 0 (0.0%) | 0 (0.0%) |
| 75 Years and over | 4 (6.5%) | 21 (25.6%) |
Disability Class: Ambulatory Difficulty
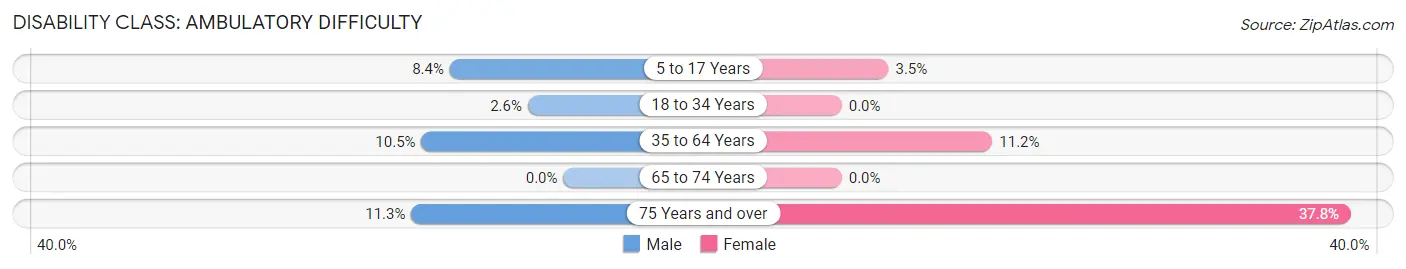
| Age Bracket | Male | Female |
| 5 to 17 Years | 21 (8.4%) | 6 (3.5%) |
| 18 to 34 Years | 6 (2.6%) | 0 (0.0%) |
| 35 to 64 Years | 37 (10.5%) | 52 (11.2%) |
| 65 to 74 Years | 0 (0.0%) | 0 (0.0%) |
| 75 Years and over | 7 (11.3%) | 31 (37.8%) |
Disability Class: Self-Care Difficulty
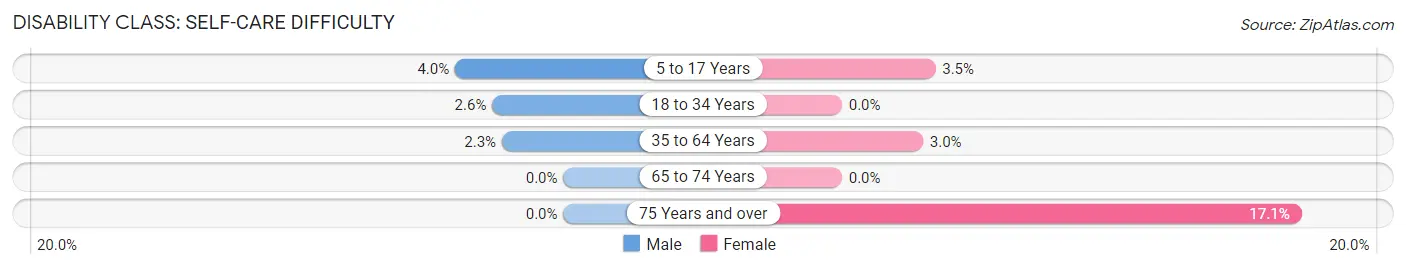
| Age Bracket | Male | Female |
| 5 to 17 Years | 10 (4.0%) | 6 (3.5%) |
| 18 to 34 Years | 6 (2.6%) | 0 (0.0%) |
| 35 to 64 Years | 8 (2.3%) | 14 (3.0%) |
| 65 to 74 Years | 0 (0.0%) | 0 (0.0%) |
| 75 Years and over | 0 (0.0%) | 14 (17.1%) |
Technology Access in Appomattox
Computing Device Access in Appomattox
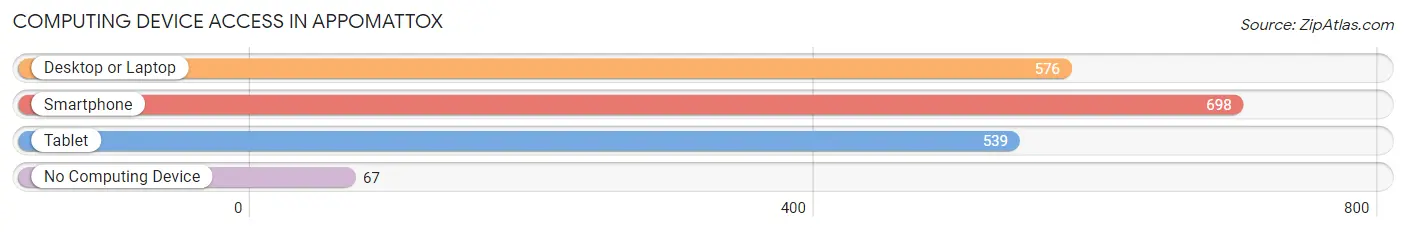
| Device Type | # Households | % Households |
| Desktop or Laptop | 576 | 69.5% |
| Smartphone | 698 | 84.2% |
| Tablet | 539 | 65.0% |
| No Computing Device | 67 | 8.1% |
| Total | 829 | 100.0% |
Internet Access in Appomattox
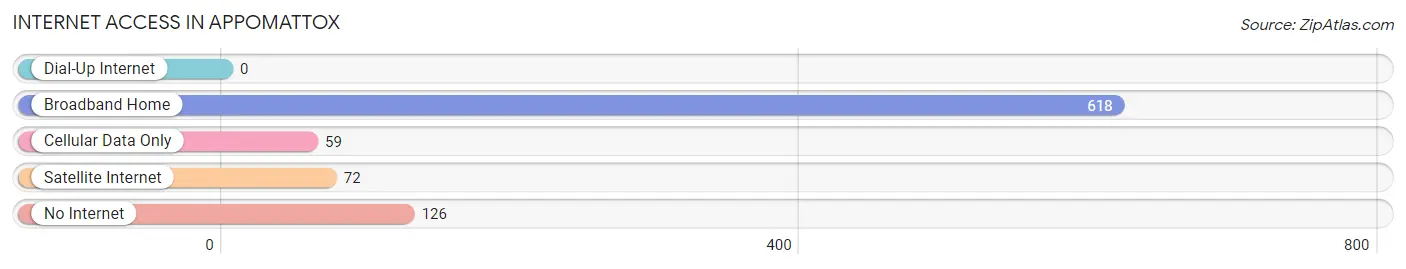
| Internet Type | # Households | % Households |
| Dial-Up Internet | 0 | 0.0% |
| Broadband Home | 618 | 74.6% |
| Cellular Data Only | 59 | 7.1% |
| Satellite Internet | 72 | 8.7% |
| No Internet | 126 | 15.2% |
| Total | 829 | 100.0% |
Appomattox Summary
Appomattox, Virginia is a small town located in Appomattox County, Virginia. It is best known as the site of the surrender of General Robert E. Lee to General Ulysses S. Grant, effectively ending the American Civil War. The town has a population of approximately 1,743 people, according to the 2010 census.
Geography
Appomattox is located in the Piedmont region of Virginia, approximately 40 miles east of Lynchburg. The town is situated in a valley between the Blue Ridge Mountains and the Appalachian Mountains. The Appomattox River runs through the town, and the Appomattox Court House National Historical Park is located nearby. The town is also close to the Appomattox-Buckingham State Forest.
Economy
The economy of Appomattox is largely based on agriculture and tourism. The town is home to several farms, and the Appomattox Farmers Market is held every Saturday from May to October. The town is also home to several small businesses, including restaurants, antique stores, and a winery. Tourism is a major part of the local economy, as the town is home to the Appomattox Court House National Historical Park, which attracts visitors from all over the world.
Demographics
According to the 2010 census, the population of Appomattox was 1,743. The racial makeup of the town was 87.3% White, 10.3% African American, 0.3% Native American, 0.2% Asian, 0.1% Pacific Islander, 0.7% from other races, and 1.1% from two or more races. Hispanic or Latino of any race were 1.7% of the population.
The median income for a household in Appomattox was $37,917, and the median income for a family was $45,000. The per capita income for the town was $18,945. About 11.2% of families and 14.2% of the population were below the poverty line, including 18.2% of those under age 18 and 11.2% of those age 65 or over.
History
Appomattox was founded in 1845 and named after the Appomattox River. The town was originally a small farming community, but it gained national attention in 1865 when General Robert E. Lee surrendered to General Ulysses S. Grant at the Appomattox Court House, effectively ending the American Civil War. The town was also the site of the Appomattox Station, a major supply depot for the Confederate Army.
In the years following the Civil War, Appomattox experienced a period of growth and prosperity. The town was home to several mills, a railroad, and a number of businesses. The town also became a popular tourist destination, as visitors flocked to the town to visit the Appomattox Court House National Historical Park.
Today, Appomattox is a small town with a rich history. The town is home to several historic sites, including the Appomattox Court House National Historical Park, the Appomattox Station, and the Appomattox Iron Works. The town is also home to several small businesses, farms, and the Appomattox Farmers Market. The town is a popular tourist destination, as visitors come to learn about the history of the town and the events that took place here during the Civil War.
Common Questions
What is Per Capita Income in Appomattox?
Per Capita income in Appomattox is $23,615.
What is the Median Family Income in Appomattox?
Median Family Income in Appomattox is $54,063.
What is the Median Household income in Appomattox?
Median Household Income in Appomattox is $43,750.
What is Income or Wage Gap in Appomattox?
Income or Wage Gap in Appomattox is 47.0%.
Women in Appomattox earn 53.0 cents for every dollar earned by a man.
What is Inequality or Gini Index in Appomattox?
Inequality or Gini Index in Appomattox is 0.40.
What is the Total Population of Appomattox?
Total Population of Appomattox is 2,157.
What is the Total Male Population of Appomattox?
Total Male Population of Appomattox is 1,021.
What is the Total Female Population of Appomattox?
Total Female Population of Appomattox is 1,136.
What is the Ratio of Males per 100 Females in Appomattox?
There are 89.88 Males per 100 Females in Appomattox.
What is the Ratio of Females per 100 Males in Appomattox?
There are 111.26 Females per 100 Males in Appomattox.
What is the Median Population Age in Appomattox?
Median Population Age in Appomattox is 36.9 Years.
What is the Average Family Size in Appomattox
Average Family Size in Appomattox is 3.7 People.
What is the Average Household Size in Appomattox
Average Household Size in Appomattox is 2.5 People.
How Large is the Labor Force in Appomattox?
There are 1,107 People in the Labor Forcein in Appomattox.
What is the Percentage of People in the Labor Force in Appomattox?
64.7% of People are in the Labor Force in Appomattox.
What is the Unemployment Rate in Appomattox?
Unemployment Rate in Appomattox is 6.5%.