Appalachia, VA Map & Demographics
Appalachia Map
Appalachia Overview
$16,659
PER CAPITA INCOME
$39,306
AVG FAMILY INCOME
$34,896
AVG HOUSEHOLD INCOME
57.6%
WAGE / INCOME GAP [ % ]
42.4¢/ $1
WAGE / INCOME GAP [ $ ]
0.46
INEQUALITY / GINI INDEX
1,585
TOTAL POPULATION
773
MALE POPULATION
812
FEMALE POPULATION
95.20
MALES / 100 FEMALES
105.05
FEMALES / 100 MALES
32.4
MEDIAN AGE
3.2
AVG FAMILY SIZE
2.5
AVG HOUSEHOLD SIZE
568
LABOR FORCE [ PEOPLE ]
48.4%
PERCENT IN LABOR FORCE
10.2%
UNEMPLOYMENT RATE
Appalachia Zip Codes
Appalachia Area Codes
Income in Appalachia
Income Overview in Appalachia
Per Capita Income in Appalachia is $16,659, while median incomes of families and households are $39,306 and $34,896 respectively.
| Characteristic | Number | Measure |
| Per Capita Income | 1,585 | $16,659 |
| Median Family Income | 407 | $39,306 |
| Mean Family Income | 407 | $47,836 |
| Median Household Income | 623 | $34,896 |
| Mean Household Income | 623 | $41,689 |
| Income Deficit | 407 | $0 |
| Wage / Income Gap (%) | 1,585 | 57.61% |
| Wage / Income Gap ($) | 1,585 | 42.39¢ per $1 |
| Gini / Inequality Index | 1,585 | 0.46 |
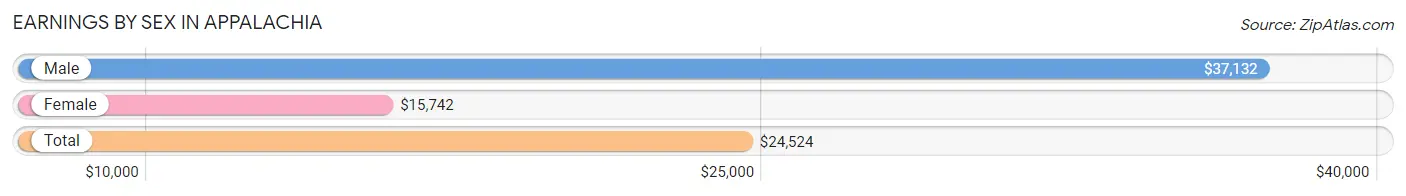
Earnings by Sex in Appalachia
Average Earnings in Appalachia are $24,524, $37,132 for men and $15,742 for women, a difference of 57.6%.
| Sex | Number | Average Earnings |
| Male | 323 (55.7%) | $37,132 |
| Female | 257 (44.3%) | $15,742 |
| Total | 580 (100.0%) | $24,524 |
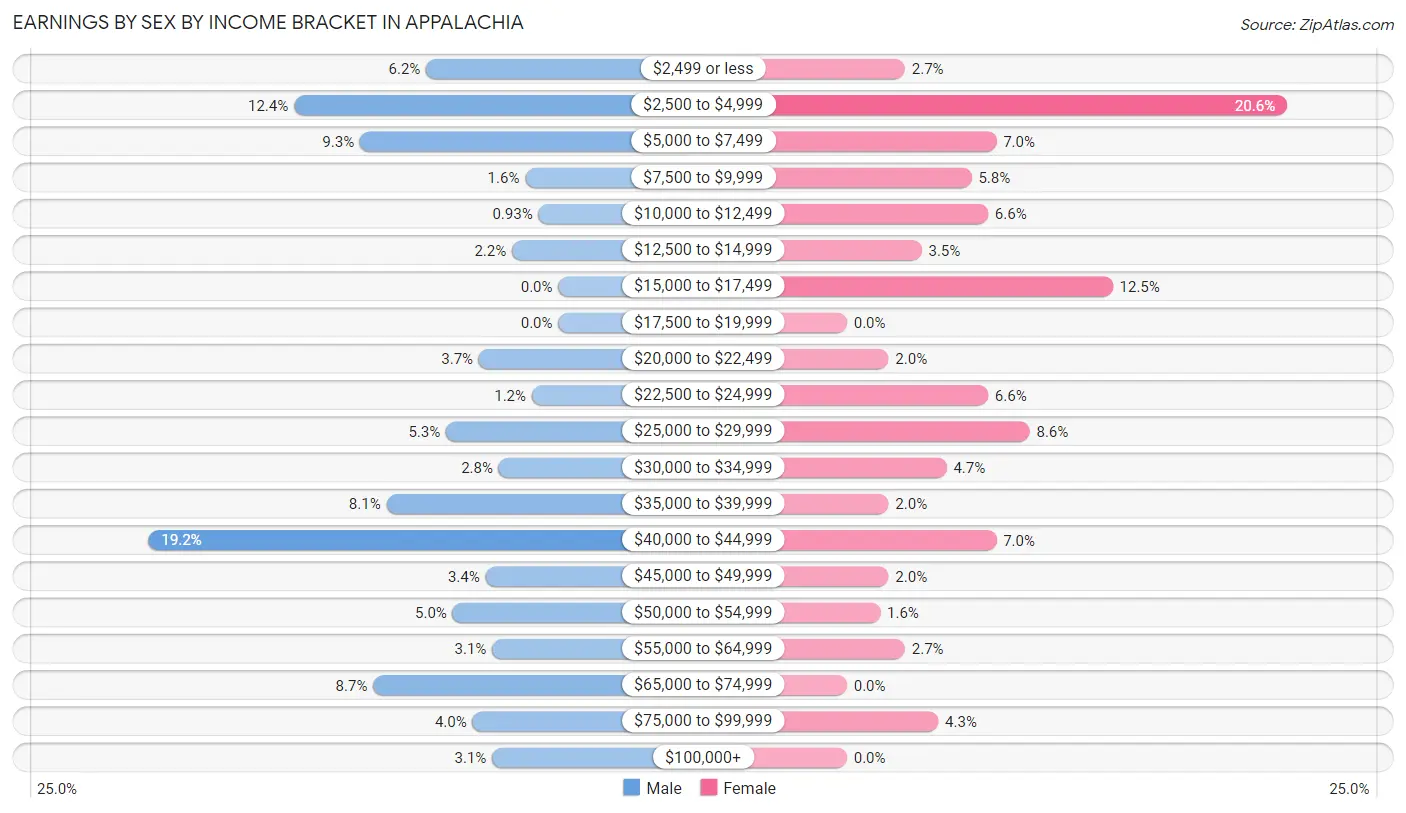
Earnings by Sex by Income Bracket in Appalachia
The most common earnings brackets in Appalachia are $40,000 to $44,999 for men (62 | 19.2%) and $2,500 to $4,999 for women (53 | 20.6%).
| Income | Male | Female |
| $2,499 or less | 20 (6.2%) | 7 (2.7%) |
| $2,500 to $4,999 | 40 (12.4%) | 53 (20.6%) |
| $5,000 to $7,499 | 30 (9.3%) | 18 (7.0%) |
| $7,500 to $9,999 | 5 (1.5%) | 15 (5.8%) |
| $10,000 to $12,499 | 3 (0.9%) | 17 (6.6%) |
| $12,500 to $14,999 | 7 (2.2%) | 9 (3.5%) |
| $15,000 to $17,499 | 0 (0.0%) | 32 (12.4%) |
| $17,500 to $19,999 | 0 (0.0%) | 0 (0.0%) |
| $20,000 to $22,499 | 12 (3.7%) | 5 (1.9%) |
| $22,500 to $24,999 | 4 (1.2%) | 17 (6.6%) |
| $25,000 to $29,999 | 17 (5.3%) | 22 (8.6%) |
| $30,000 to $34,999 | 9 (2.8%) | 12 (4.7%) |
| $35,000 to $39,999 | 26 (8.1%) | 5 (1.9%) |
| $40,000 to $44,999 | 62 (19.2%) | 18 (7.0%) |
| $45,000 to $49,999 | 11 (3.4%) | 5 (1.9%) |
| $50,000 to $54,999 | 16 (5.0%) | 4 (1.6%) |
| $55,000 to $64,999 | 10 (3.1%) | 7 (2.7%) |
| $65,000 to $74,999 | 28 (8.7%) | 0 (0.0%) |
| $75,000 to $99,999 | 13 (4.0%) | 11 (4.3%) |
| $100,000+ | 10 (3.1%) | 0 (0.0%) |
| Total | 323 (100.0%) | 257 (100.0%) |
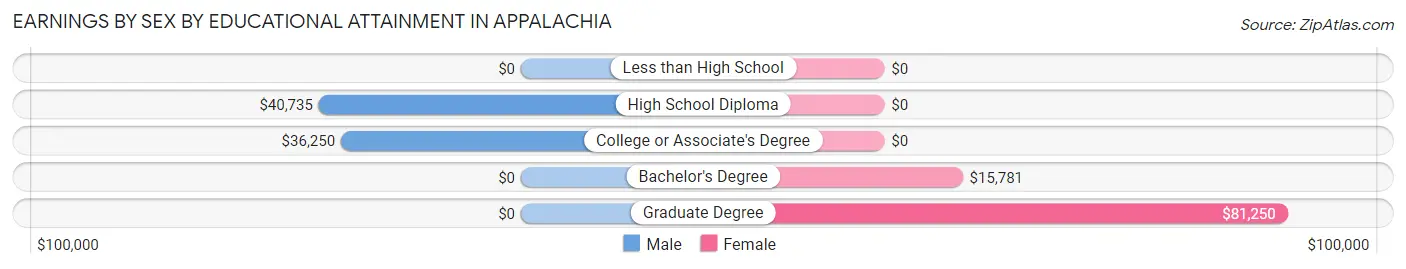
Earnings by Sex by Educational Attainment in Appalachia
Average earnings in Appalachia are $40,000 for men and $16,950 for women, a difference of 57.6%. Men with an educational attainment of high school diploma enjoy the highest average annual earnings of $40,735, while those with college or associate's degree education earn the least with $36,250. Women with an educational attainment of graduate degree earn the most with the average annual earnings of $81,250, while those with bachelor's degree education have the smallest earnings of $15,781.
| Educational Attainment | Male Income | Female Income |
| Less than High School | - | - |
| High School Diploma | $40,735 | $0 |
| College or Associate's Degree | $36,250 | $0 |
| Bachelor's Degree | - | - |
| Graduate Degree | - | - |
| Total | $40,000 | $16,950 |
Family Income in Appalachia
Family Income Brackets in Appalachia
According to the Appalachia family income data, there are 82 families falling into the $15,000 to $24,999 income range, which is the most common income bracket and makes up 20.2% of all families.
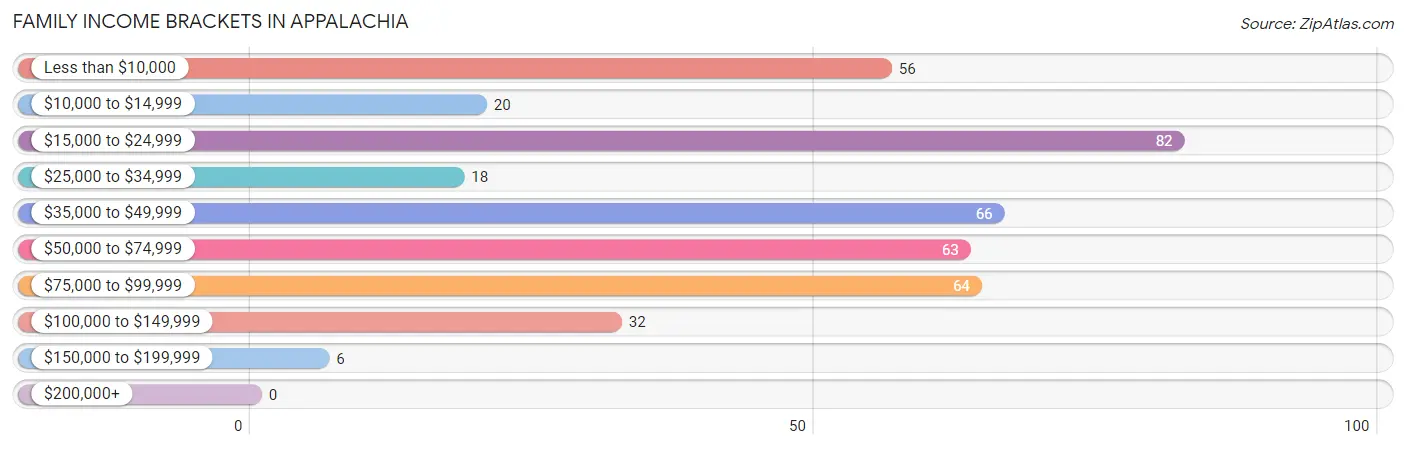
| Income Bracket | # Families | % Families |
| Less than $10,000 | 56 | 13.8% |
| $10,000 to $14,999 | 20 | 4.9% |
| $15,000 to $24,999 | 82 | 20.1% |
| $25,000 to $34,999 | 18 | 4.4% |
| $35,000 to $49,999 | 66 | 16.2% |
| $50,000 to $74,999 | 63 | 15.5% |
| $75,000 to $99,999 | 64 | 15.7% |
| $100,000 to $149,999 | 32 | 7.9% |
| $150,000 to $199,999 | 6 | 1.5% |
| $200,000+ | 0 | 0.0% |
Family Income by Famaliy Size in Appalachia
3-person families (112 | 27.5%) account for the highest median family income in Appalachia with $68,750 per family, while 3-person families (112 | 27.5%) have the highest median income of $22,917 per family member.
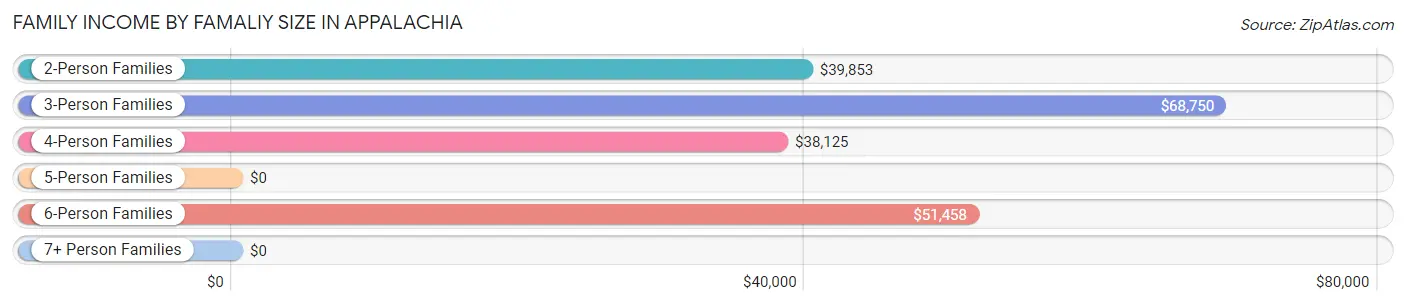
| Income Bracket | # Families | Median Income |
| 2-Person Families | 168 (41.3%) | $39,853 |
| 3-Person Families | 112 (27.5%) | $68,750 |
| 4-Person Families | 53 (13.0%) | $38,125 |
| 5-Person Families | 60 (14.7%) | $0 |
| 6-Person Families | 11 (2.7%) | $51,458 |
| 7+ Person Families | 3 (0.7%) | $0 |
| Total | 407 (100.0%) | $39,306 |
Family Income by Number of Earners in Appalachia
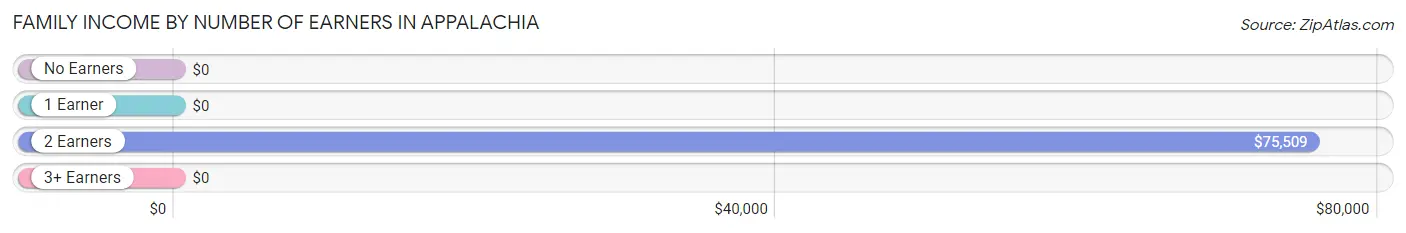
| Number of Earners | # Families | Median Income |
| No Earners | 99 (24.3%) | $0 |
| 1 Earner | 181 (44.5%) | $0 |
| 2 Earners | 113 (27.8%) | $75,509 |
| 3+ Earners | 14 (3.4%) | $0 |
| Total | 407 (100.0%) | $39,306 |
Household Income in Appalachia
Household Income Brackets in Appalachia
With 121 households falling in the category, the $15,000 to $24,999 income range is the most frequent in Appalachia, accounting for 19.4% of all households.
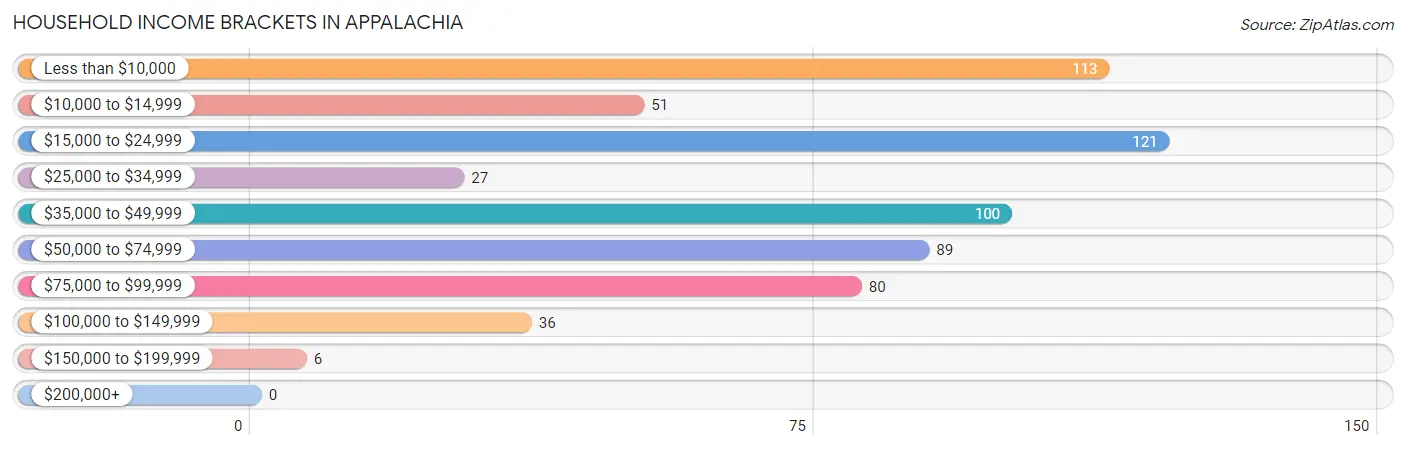
| Income Bracket | # Households | % Households |
| Less than $10,000 | 113 | 18.1% |
| $10,000 to $14,999 | 51 | 8.2% |
| $15,000 to $24,999 | 121 | 19.4% |
| $25,000 to $34,999 | 27 | 4.3% |
| $35,000 to $49,999 | 100 | 16.1% |
| $50,000 to $74,999 | 89 | 14.3% |
| $75,000 to $99,999 | 80 | 12.8% |
| $100,000 to $149,999 | 36 | 5.8% |
| $150,000 to $199,999 | 6 | 1.0% |
| $200,000+ | 0 | 0.0% |
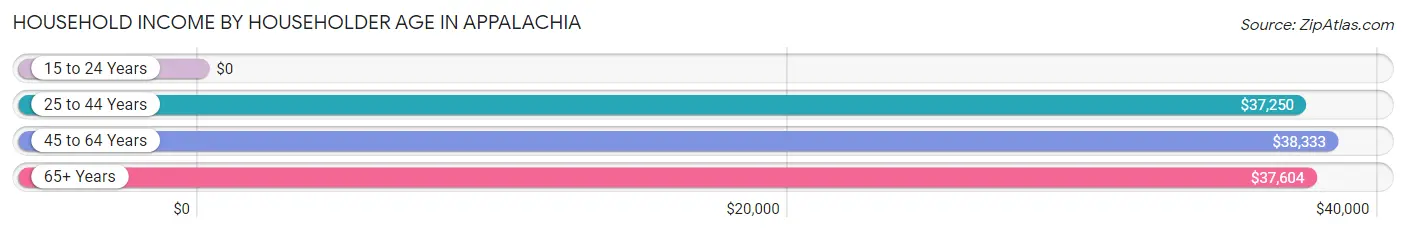
Household Income by Householder Age in Appalachia
The median household income in Appalachia is $34,896, with the highest median household income of $38,333 found in the 45 to 64 years age bracket for the primary householder. A total of 242 households (38.8%) fall into this category. Meanwhile, the 15 to 24 years age bracket for the primary householder has the lowest median household income of $0, with 32 households (5.1%) in this group.
| Income Bracket | # Households | Median Income |
| 15 to 24 Years | 32 (5.1%) | $0 |
| 25 to 44 Years | 163 (26.2%) | $37,250 |
| 45 to 64 Years | 242 (38.8%) | $38,333 |
| 65+ Years | 186 (29.9%) | $37,604 |
| Total | 623 (100.0%) | $34,896 |
Poverty in Appalachia
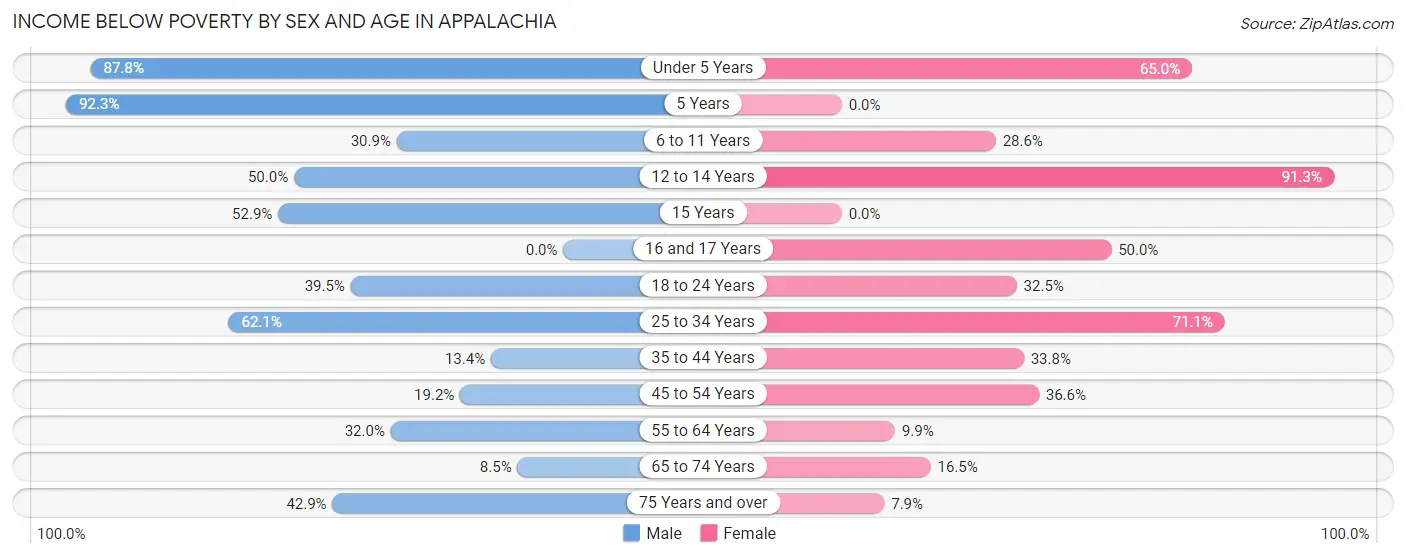
Income Below Poverty by Sex and Age in Appalachia
With 34.8% poverty level for males and 42.5% for females among the residents of Appalachia, 5 year old males and 12 to 14 year old females are the most vulnerable to poverty, with 12 males (92.3%) and 105 females (91.3%) in their respective age groups living below the poverty level.
| Age Bracket | Male | Female |
| Under 5 Years | 43 (87.8%) | 39 (65.0%) |
| 5 Years | 12 (92.3%) | 0 (0.0%) |
| 6 to 11 Years | 30 (30.9%) | 10 (28.6%) |
| 12 to 14 Years | 5 (50.0%) | 105 (91.3%) |
| 15 Years | 9 (52.9%) | 0 (0.0%) |
| 16 and 17 Years | 0 (0.0%) | 10 (50.0%) |
| 18 to 24 Years | 15 (39.5%) | 37 (32.5%) |
| 25 to 34 Years | 64 (62.1%) | 59 (71.1%) |
| 35 to 44 Years | 9 (13.4%) | 26 (33.8%) |
| 45 to 54 Years | 27 (19.2%) | 34 (36.6%) |
| 55 to 64 Years | 33 (32.0%) | 7 (9.9%) |
| 65 to 74 Years | 4 (8.5%) | 15 (16.5%) |
| 75 Years and over | 18 (42.9%) | 3 (7.9%) |
| Total | 269 (34.8%) | 345 (42.5%) |
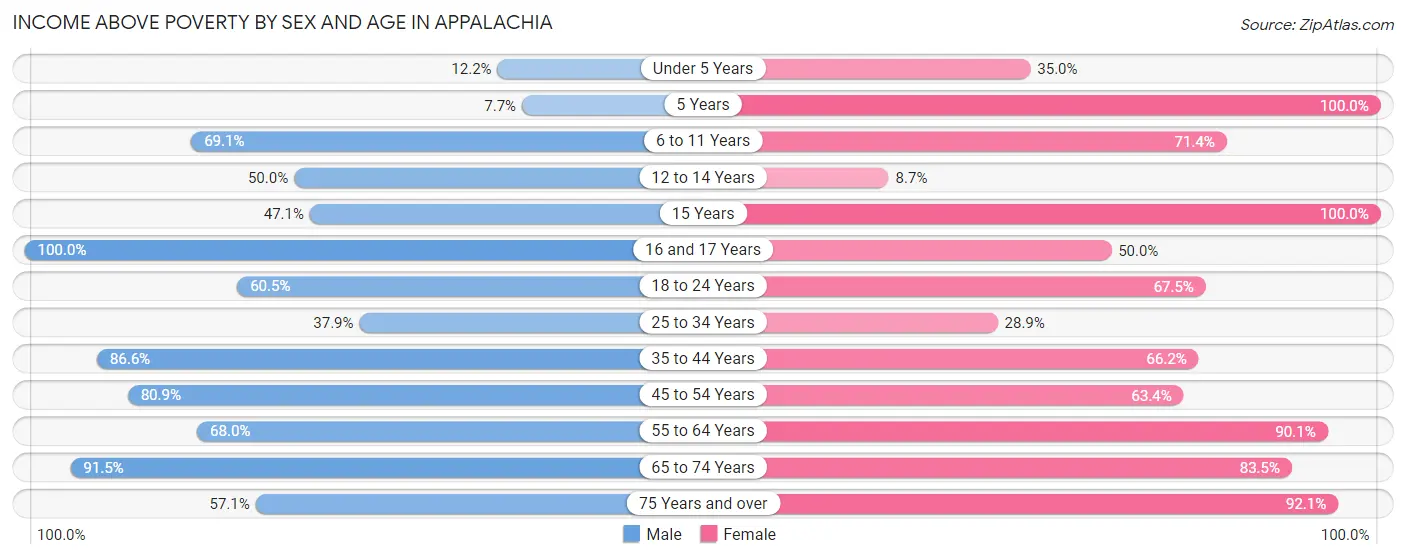
Income Above Poverty by Sex and Age in Appalachia
According to the poverty statistics in Appalachia, males aged 16 and 17 years and females aged 5 years are the age groups that are most secure financially, with 100.0% of males and 100.0% of females in these age groups living above the poverty line.
| Age Bracket | Male | Female |
| Under 5 Years | 6 (12.2%) | 21 (35.0%) |
| 5 Years | 1 (7.7%) | 7 (100.0%) |
| 6 to 11 Years | 67 (69.1%) | 25 (71.4%) |
| 12 to 14 Years | 5 (50.0%) | 10 (8.7%) |
| 15 Years | 8 (47.1%) | 8 (100.0%) |
| 16 and 17 Years | 46 (100.0%) | 10 (50.0%) |
| 18 to 24 Years | 23 (60.5%) | 77 (67.5%) |
| 25 to 34 Years | 39 (37.9%) | 24 (28.9%) |
| 35 to 44 Years | 58 (86.6%) | 51 (66.2%) |
| 45 to 54 Years | 114 (80.8%) | 59 (63.4%) |
| 55 to 64 Years | 70 (68.0%) | 64 (90.1%) |
| 65 to 74 Years | 43 (91.5%) | 76 (83.5%) |
| 75 Years and over | 24 (57.1%) | 35 (92.1%) |
| Total | 504 (65.2%) | 467 (57.5%) |
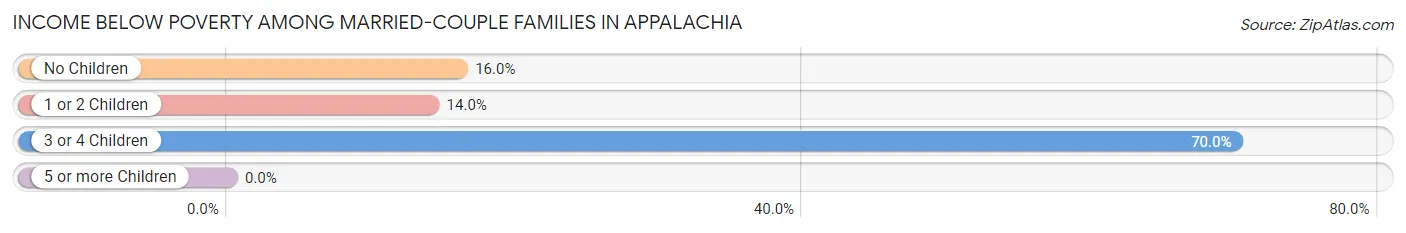
Income Below Poverty Among Married-Couple Families in Appalachia
The poverty statistics for married-couple families in Appalachia show that 25.0% or 57 of the total 228 families live below the poverty line. Families with 3 or 4 children have the highest poverty rate of 70.0%, comprising of 28 families. On the other hand, families with 1 or 2 children have the lowest poverty rate of 14.0%, which includes 8 families.
| Children | Above Poverty | Below Poverty |
| No Children | 110 (84.0%) | 21 (16.0%) |
| 1 or 2 Children | 49 (86.0%) | 8 (14.0%) |
| 3 or 4 Children | 12 (30.0%) | 28 (70.0%) |
| 5 or more Children | 0 (0.0%) | 0 (0.0%) |
| Total | 171 (75.0%) | 57 (25.0%) |
Income Below Poverty Among Single-Parent Households in Appalachia
According to the poverty data in Appalachia, 8.2% or 4 single-father households and 46.9% or 61 single-mother households are living below the poverty line. Among single-father households, those with no children have the highest poverty rate, with 4 households (33.3%) experiencing poverty. Likewise, among single-mother households, those with 3 or 4 children have the highest poverty rate, with 32 households (91.4%) falling below the poverty line.
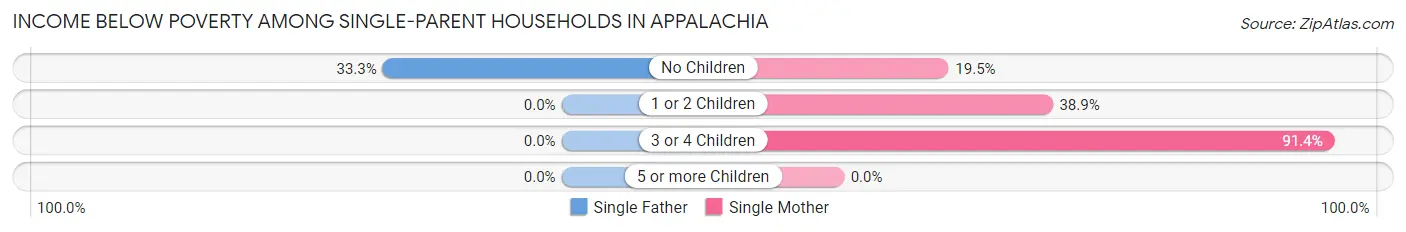
| Children | Single Father | Single Mother |
| No Children | 4 (33.3%) | 8 (19.5%) |
| 1 or 2 Children | 0 (0.0%) | 21 (38.9%) |
| 3 or 4 Children | 0 (0.0%) | 32 (91.4%) |
| 5 or more Children | 0 (0.0%) | 0 (0.0%) |
| Total | 4 (8.2%) | 61 (46.9%) |
Income Below Poverty Among Married-Couple vs Single-Parent Households in Appalachia
The poverty data for Appalachia shows that 57 of the married-couple family households (25.0%) and 65 of the single-parent households (36.3%) are living below the poverty level. Within the married-couple family households, those with 3 or 4 children have the highest poverty rate, with 28 households (70.0%) falling below the poverty line. Among the single-parent households, those with 3 or 4 children have the highest poverty rate, with 32 household (91.4%) living below poverty.
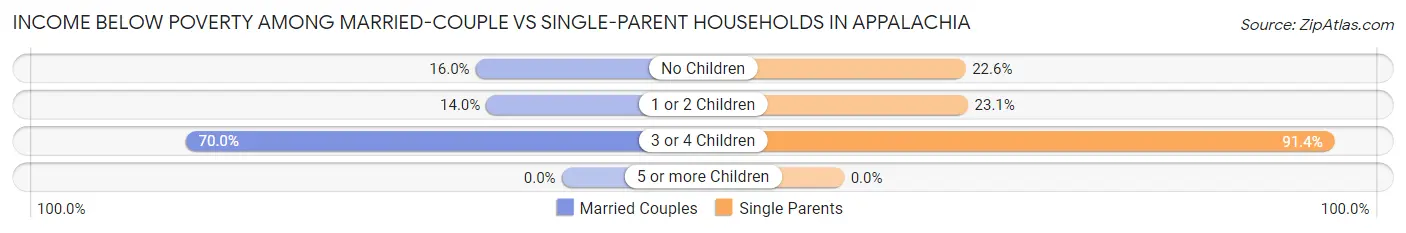
| Children | Married-Couple Families | Single-Parent Households |
| No Children | 21 (16.0%) | 12 (22.6%) |
| 1 or 2 Children | 8 (14.0%) | 21 (23.1%) |
| 3 or 4 Children | 28 (70.0%) | 32 (91.4%) |
| 5 or more Children | 0 (0.0%) | 0 (0.0%) |
| Total | 57 (25.0%) | 65 (36.3%) |
Race in Appalachia
The most populous races in Appalachia are White / Caucasian (1,313 | 82.8%), Two or more Races (196 | 12.4%), and Black / African American (76 | 4.8%).
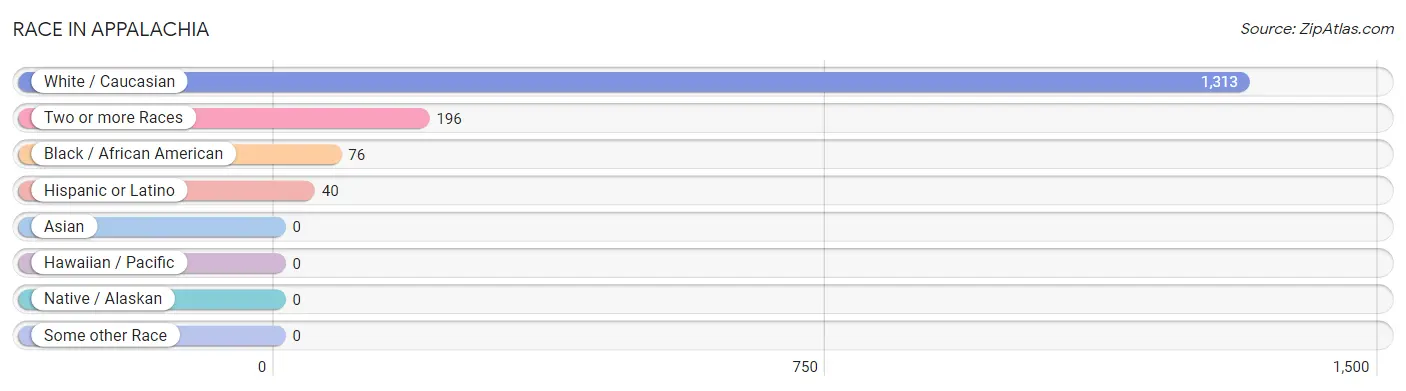
| Race | # Population | % Population |
| Asian | 0 | 0.0% |
| Black / African American | 76 | 4.8% |
| Hawaiian / Pacific | 0 | 0.0% |
| Hispanic or Latino | 40 | 2.5% |
| Native / Alaskan | 0 | 0.0% |
| White / Caucasian | 1,313 | 82.8% |
| Two or more Races | 196 | 12.4% |
| Some other Race | 0 | 0.0% |
| Total | 1,585 | 100.0% |
Ancestry in Appalachia
The most populous ancestries reported in Appalachia are American (364 | 23.0%), English (211 | 13.3%), Irish (170 | 10.7%), German (134 | 8.5%), and Mexican (36 | 2.3%), together accounting for 57.7% of all Appalachia residents.
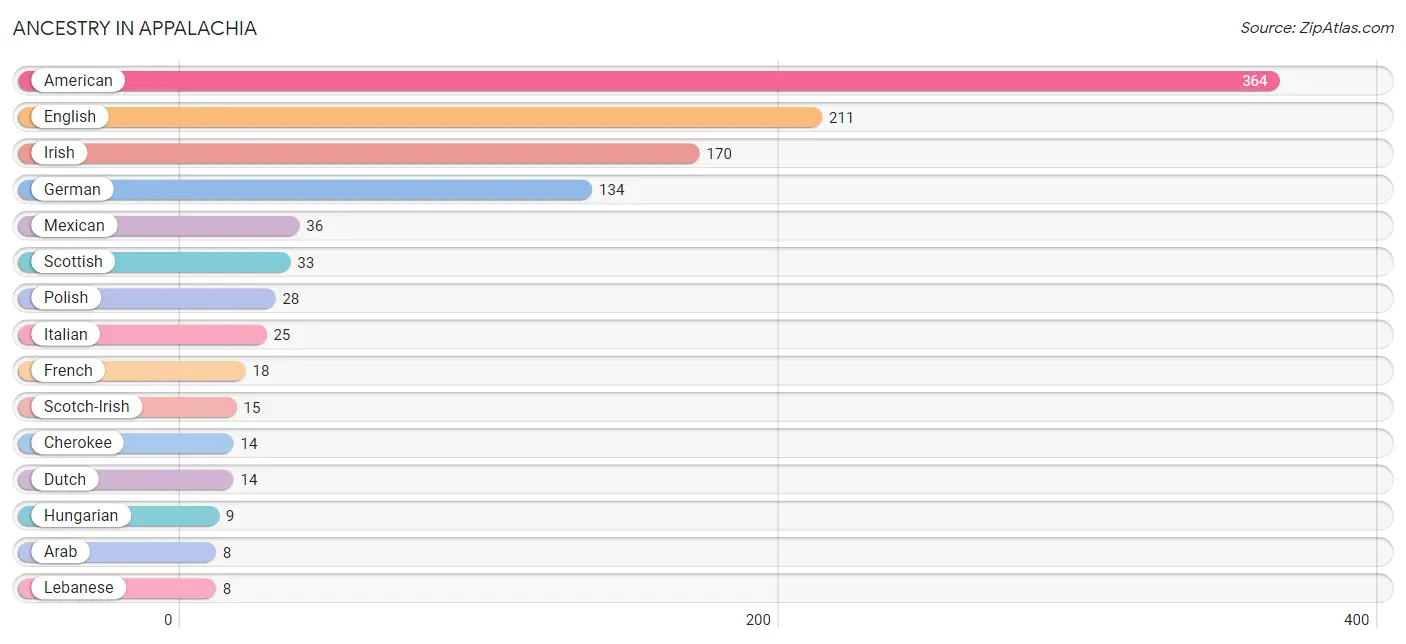
| Ancestry | # Population | % Population |
| American | 364 | 23.0% |
| Arab | 8 | 0.5% |
| Cherokee | 14 | 0.9% |
| Dutch | 14 | 0.9% |
| Eastern European | 7 | 0.4% |
| English | 211 | 13.3% |
| European | 5 | 0.3% |
| French | 18 | 1.1% |
| German | 134 | 8.5% |
| Hungarian | 9 | 0.6% |
| Irish | 170 | 10.7% |
| Italian | 25 | 1.6% |
| Latvian | 4 | 0.3% |
| Lebanese | 8 | 0.5% |
| Mexican | 36 | 2.3% |
| Norwegian | 7 | 0.4% |
| Polish | 28 | 1.8% |
| Scandinavian | 3 | 0.2% |
| Scotch-Irish | 15 | 0.9% |
| Scottish | 33 | 2.1% |
| Spanish | 4 | 0.3% |
| Welsh | 4 | 0.3% | View All 22 Rows |
Immigrants in Appalachia
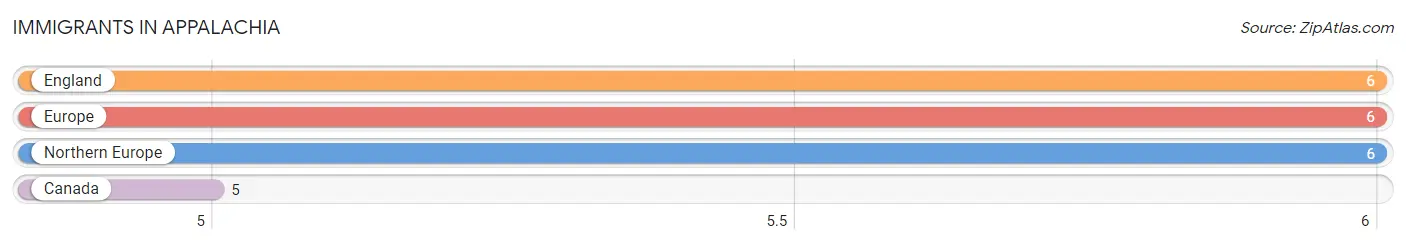
The most numerous immigrant groups reported in Appalachia came from England (6 | 0.4%), Europe (6 | 0.4%), Northern Europe (6 | 0.4%), and Canada (5 | 0.3%), together accounting for 1.5% of all Appalachia residents.
| Immigration Origin | # Population | % Population |
| Canada | 5 | 0.3% |
| England | 6 | 0.4% |
| Europe | 6 | 0.4% |
| Northern Europe | 6 | 0.4% | View All 4 Rows |
Sex and Age in Appalachia
Sex and Age in Appalachia
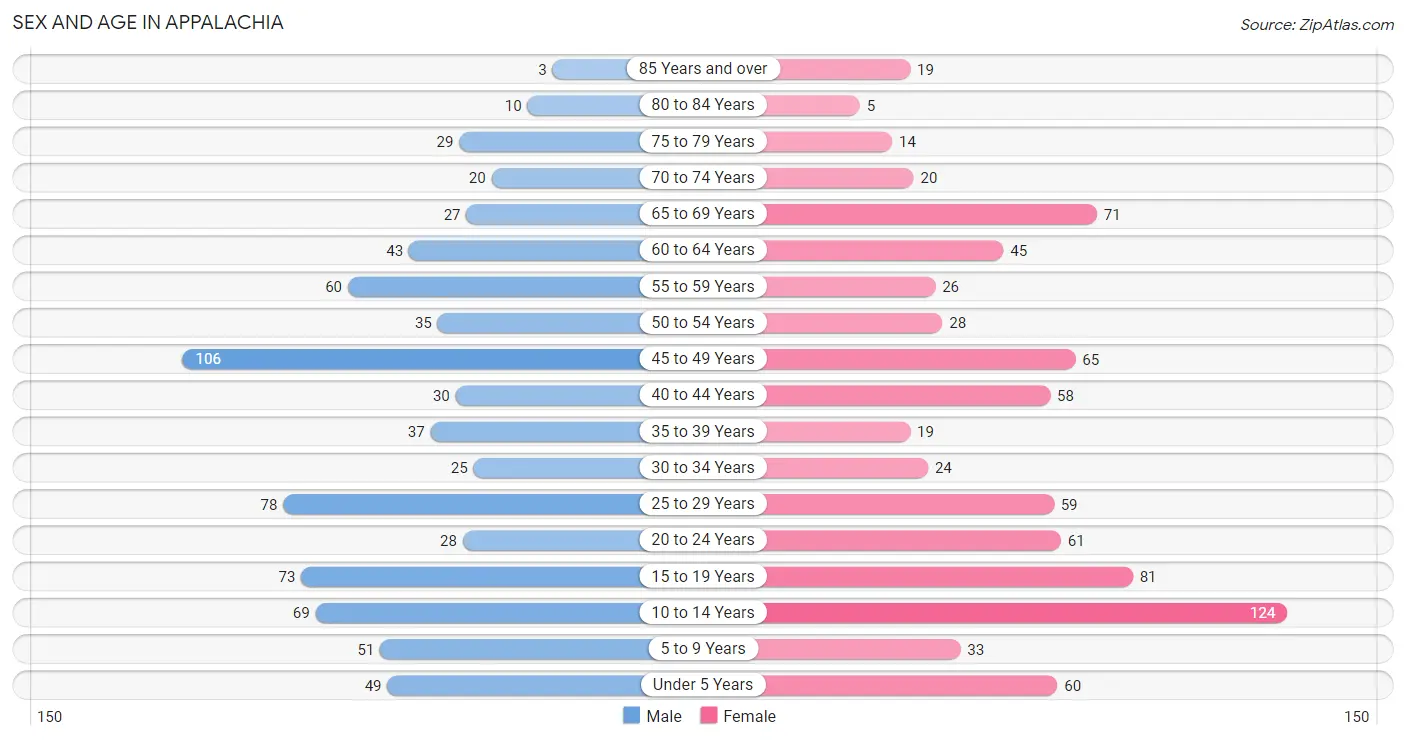
The most populous age groups in Appalachia are 45 to 49 Years (106 | 13.7%) for men and 10 to 14 Years (124 | 15.3%) for women.
| Age Bracket | Male | Female |
| Under 5 Years | 49 (6.3%) | 60 (7.4%) |
| 5 to 9 Years | 51 (6.6%) | 33 (4.1%) |
| 10 to 14 Years | 69 (8.9%) | 124 (15.3%) |
| 15 to 19 Years | 73 (9.4%) | 81 (10.0%) |
| 20 to 24 Years | 28 (3.6%) | 61 (7.5%) |
| 25 to 29 Years | 78 (10.1%) | 59 (7.3%) |
| 30 to 34 Years | 25 (3.2%) | 24 (3.0%) |
| 35 to 39 Years | 37 (4.8%) | 19 (2.3%) |
| 40 to 44 Years | 30 (3.9%) | 58 (7.1%) |
| 45 to 49 Years | 106 (13.7%) | 65 (8.0%) |
| 50 to 54 Years | 35 (4.5%) | 28 (3.5%) |
| 55 to 59 Years | 60 (7.8%) | 26 (3.2%) |
| 60 to 64 Years | 43 (5.6%) | 45 (5.5%) |
| 65 to 69 Years | 27 (3.5%) | 71 (8.7%) |
| 70 to 74 Years | 20 (2.6%) | 20 (2.5%) |
| 75 to 79 Years | 29 (3.7%) | 14 (1.7%) |
| 80 to 84 Years | 10 (1.3%) | 5 (0.6%) |
| 85 Years and over | 3 (0.4%) | 19 (2.3%) |
| Total | 773 (100.0%) | 812 (100.0%) |
Families and Households in Appalachia
Median Family Size in Appalachia
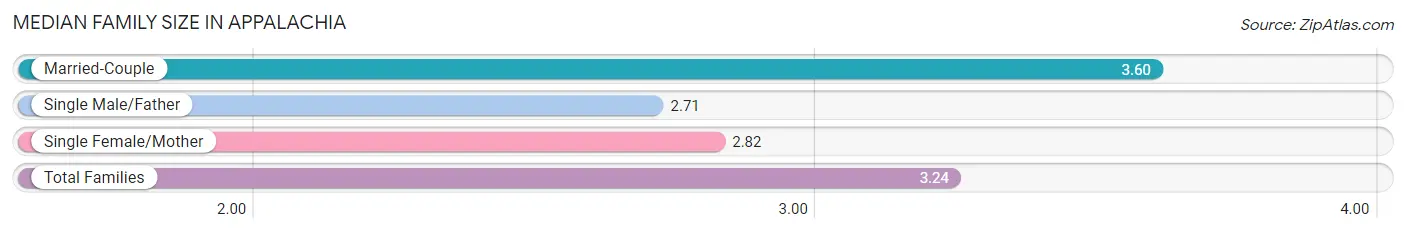
The median family size in Appalachia is 3.24 persons per family, with married-couple families (228 | 56.0%) accounting for the largest median family size of 3.6 persons per family. On the other hand, single male/father families (49 | 12.0%) represent the smallest median family size with 2.71 persons per family.
| Family Type | # Families | Family Size |
| Married-Couple | 228 (56.0%) | 3.60 |
| Single Male/Father | 49 (12.0%) | 2.71 |
| Single Female/Mother | 130 (31.9%) | 2.82 |
| Total Families | 407 (100.0%) | 3.24 |
Median Household Size in Appalachia
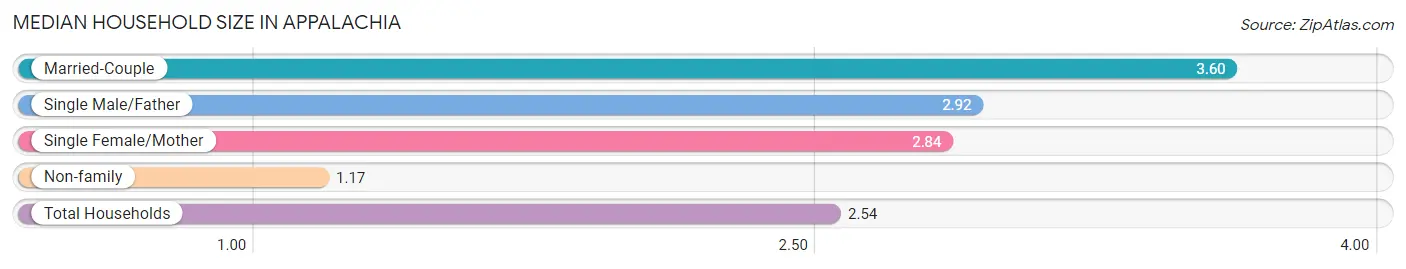
The median household size in Appalachia is 2.54 persons per household, with married-couple households (228 | 36.6%) accounting for the largest median household size of 3.6 persons per household. non-family households (216 | 34.7%) represent the smallest median household size with 1.17 persons per household.
| Household Type | # Households | Household Size |
| Married-Couple | 228 (36.6%) | 3.60 |
| Single Male/Father | 49 (7.9%) | 2.92 |
| Single Female/Mother | 130 (20.9%) | 2.84 |
| Non-family | 216 (34.7%) | 1.17 |
| Total Households | 623 (100.0%) | 2.54 |
Household Size by Marriage Status in Appalachia
Out of a total of 623 households in Appalachia, 407 (65.3%) are family households, while 216 (34.7%) are nonfamily households. The most numerous type of family households are 2-person households, comprising 168, and the most common type of nonfamily households are 1-person households, comprising 175.
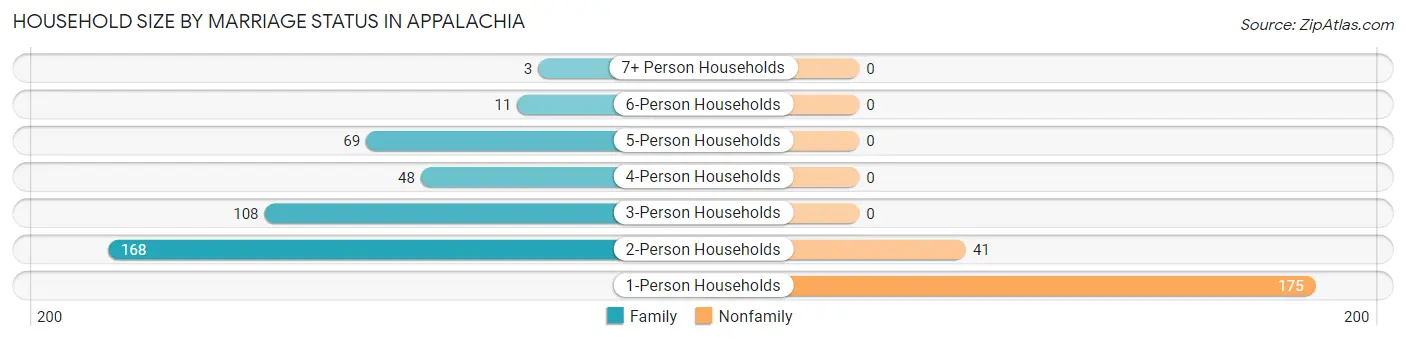
| Household Size | Family Households | Nonfamily Households |
| 1-Person Households | - | 175 (28.1%) |
| 2-Person Households | 168 (27.0%) | 41 (6.6%) |
| 3-Person Households | 108 (17.3%) | 0 (0.0%) |
| 4-Person Households | 48 (7.7%) | 0 (0.0%) |
| 5-Person Households | 69 (11.1%) | 0 (0.0%) |
| 6-Person Households | 11 (1.8%) | 0 (0.0%) |
| 7+ Person Households | 3 (0.5%) | 0 (0.0%) |
| Total | 407 (65.3%) | 216 (34.7%) |
Female Fertility in Appalachia
Fertility by Age in Appalachia
Average fertility rate in Appalachia is 122.0 births per 1,000 women. Women in the age bracket of 20 to 34 years have the highest fertility rate with 264.0 births per 1,000 women. Women in the age bracket of 20 to 34 years acount for 84.4% of all women with births.
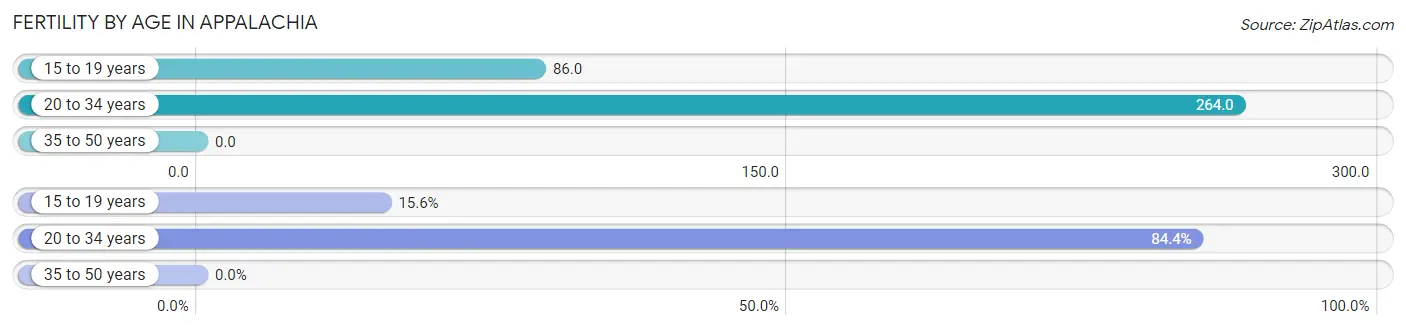
| Age Bracket | Women with Births | Births / 1,000 Women |
| 15 to 19 years | 7 (15.6%) | 86.0 |
| 20 to 34 years | 38 (84.4%) | 264.0 |
| 35 to 50 years | 0 (0.0%) | 0.0 |
| Total | 45 (100.0%) | 122.0 |
Fertility by Age by Marriage Status in Appalachia
26.7% of women with births (45) in Appalachia are married. The highest percentage of unmarried women with births falls into 15 to 19 years age bracket with 100.0% of them unmarried at the time of birth, while the lowest percentage of unmarried women with births belong to 20 to 34 years age bracket with 68.4% of them unmarried.
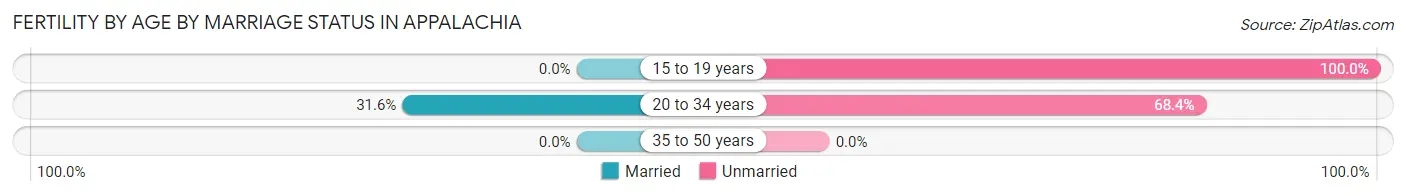
| Age Bracket | Married | Unmarried |
| 15 to 19 years | 0 (0.0%) | 7 (100.0%) |
| 20 to 34 years | 12 (31.6%) | 26 (68.4%) |
| 35 to 50 years | 0 (0.0%) | 0 (0.0%) |
| Total | 12 (26.7%) | 33 (73.3%) |
Fertility by Education in Appalachia
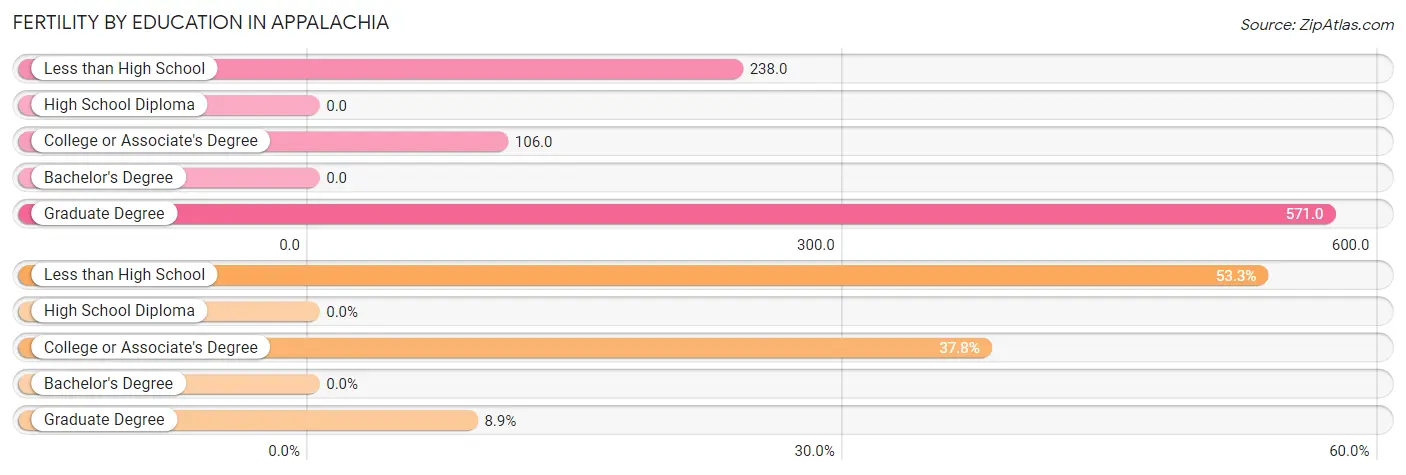
| Educational Attainment | Women with Births | Births / 1,000 Women |
| Less than High School | 24 (53.3%) | 238.0 |
| High School Diploma | 0 (0.0%) | 0.0 |
| College or Associate's Degree | 17 (37.8%) | 106.0 |
| Bachelor's Degree | 0 (0.0%) | 0.0 |
| Graduate Degree | 4 (8.9%) | 571.0 |
| Total | 45 (100.0%) | 122.0 |
Fertility by Education by Marriage Status in Appalachia
73.3% of women with births in Appalachia are unmarried. Women with the educational attainment of graduate degree are most likely to be married with 100.0% of them married at childbirth, while women with the educational attainment of college or associate's degree are least likely to be married with 100.0% of them unmarried at childbirth.
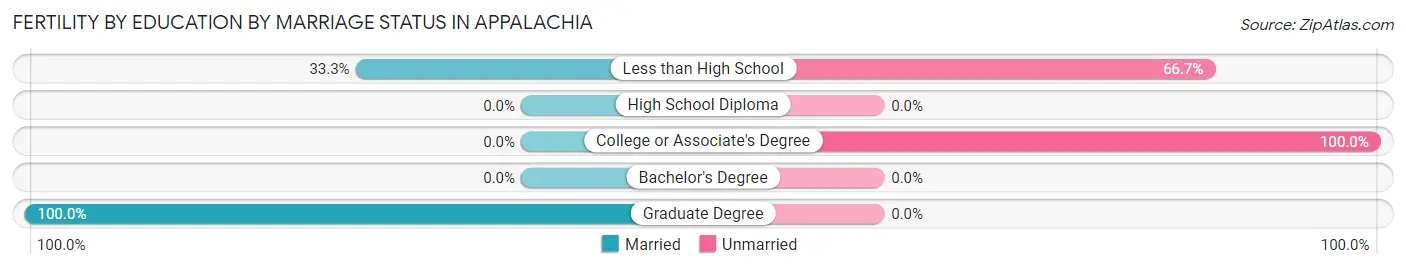
| Educational Attainment | Married | Unmarried |
| Less than High School | 8 (33.3%) | 16 (66.7%) |
| High School Diploma | 0 (0.0%) | 0 (0.0%) |
| College or Associate's Degree | 0 (0.0%) | 17 (100.0%) |
| Bachelor's Degree | 0 (0.0%) | 0 (0.0%) |
| Graduate Degree | 4 (100.0%) | 0 (0.0%) |
| Total | 12 (26.7%) | 33 (73.3%) |
Employment Characteristics in Appalachia
Employment by Class of Employer in Appalachia
Among the 489 employed individuals in Appalachia, private company employees (297 | 60.7%), local government employees (58 | 11.9%), and self-employed (not incorporated) (54 | 11.0%) make up the most common classes of employment.
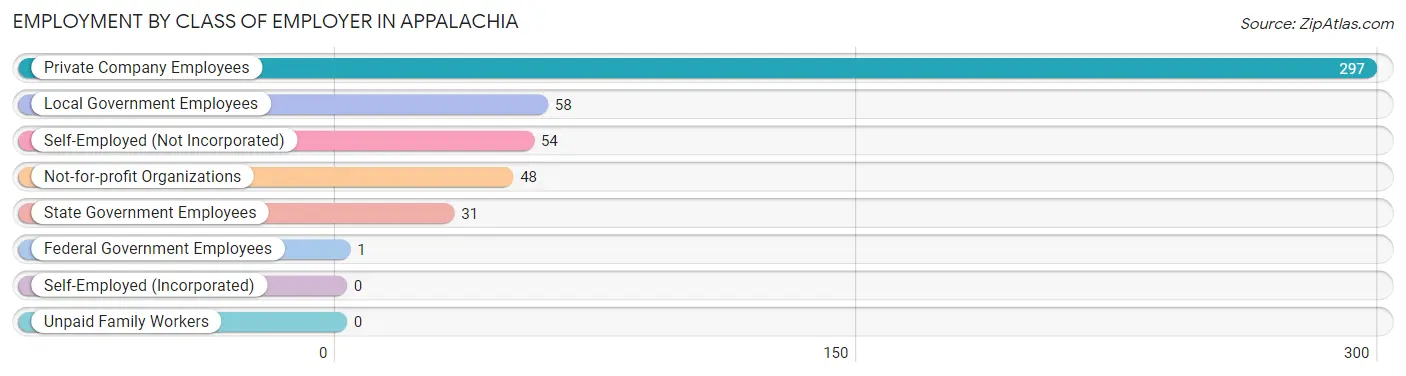
| Employer Class | # Employees | % Employees |
| Private Company Employees | 297 | 60.7% |
| Self-Employed (Incorporated) | 0 | 0.0% |
| Self-Employed (Not Incorporated) | 54 | 11.0% |
| Not-for-profit Organizations | 48 | 9.8% |
| Local Government Employees | 58 | 11.9% |
| State Government Employees | 31 | 6.3% |
| Federal Government Employees | 1 | 0.2% |
| Unpaid Family Workers | 0 | 0.0% |
| Total | 489 | 100.0% |
Employment Status by Age in Appalachia
According to the labor force statistics for Appalachia, out of the total population over 16 years of age (1,174), 48.4% or 568 individuals are in the labor force, with 10.2% or 58 of them unemployed. The age group with the highest labor force participation rate is 35 to 44 years, with 73.6% or 106 individuals in the labor force. Within the labor force, the 30 to 34 years age range has the highest percentage of unemployed individuals, with 22.9% or 8 of them being unemployed.
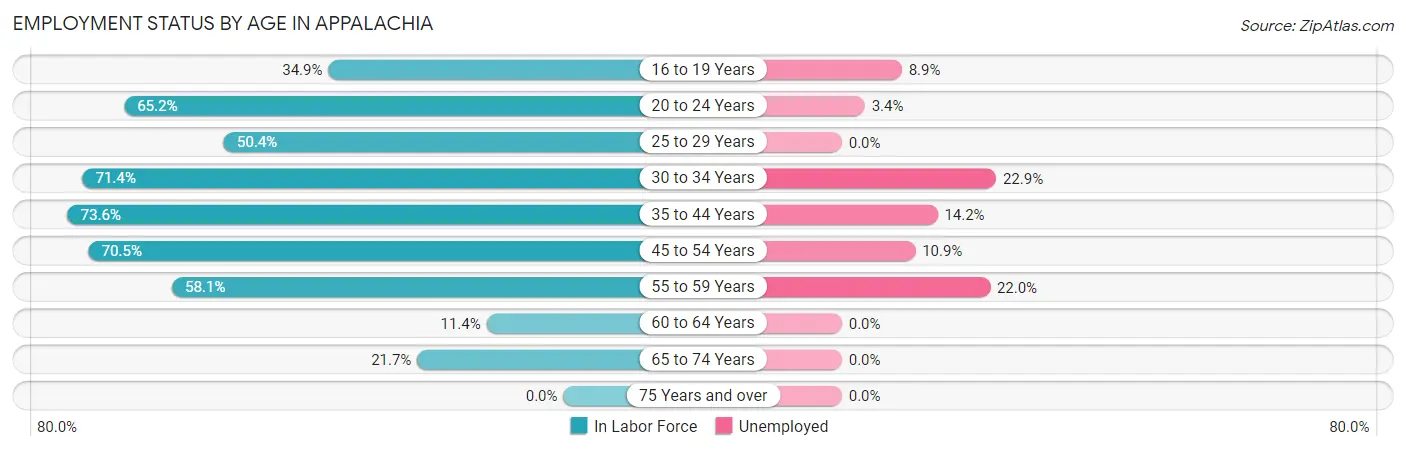
| Age Bracket | In Labor Force | Unemployed |
| 16 to 19 Years | 45 (34.9%) | 4 (8.9%) |
| 20 to 24 Years | 58 (65.2%) | 2 (3.4%) |
| 25 to 29 Years | 69 (50.4%) | 0 (0.0%) |
| 30 to 34 Years | 35 (71.4%) | 8 (22.9%) |
| 35 to 44 Years | 106 (73.6%) | 15 (14.2%) |
| 45 to 54 Years | 165 (70.5%) | 18 (10.9%) |
| 55 to 59 Years | 50 (58.1%) | 11 (22.0%) |
| 60 to 64 Years | 10 (11.4%) | 0 (0.0%) |
| 65 to 74 Years | 30 (21.7%) | 0 (0.0%) |
| 75 Years and over | 0 (0.0%) | 0 (0.0%) |
| Total | 568 (48.4%) | 58 (10.2%) |
Employment Status by Educational Attainment in Appalachia
According to labor force statistics for Appalachia, 58.9% of individuals (435) out of the total population between 25 and 64 years of age (738) are in the labor force, with 12.0% or 52 of them being unemployed. The group with the highest labor force participation rate are those with the educational attainment of bachelor's degree or higher, with 68.3% or 43 individuals in the labor force. Within the labor force, individuals with less than high school education have the highest percentage of unemployment, with 34.4% or 11 of them being unemployed.
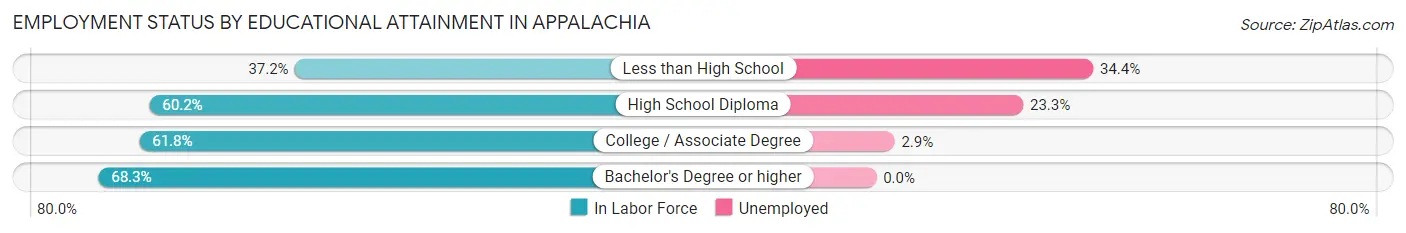
| Educational Attainment | In Labor Force | Unemployed |
| Less than High School | 32 (37.2%) | 30 (34.4%) |
| High School Diploma | 150 (60.2%) | 58 (23.3%) |
| College / Associate Degree | 210 (61.8%) | 10 (2.9%) |
| Bachelor's Degree or higher | 43 (68.3%) | 0 (0.0%) |
| Total | 435 (58.9%) | 89 (12.0%) |
Employment Occupations by Sex in Appalachia
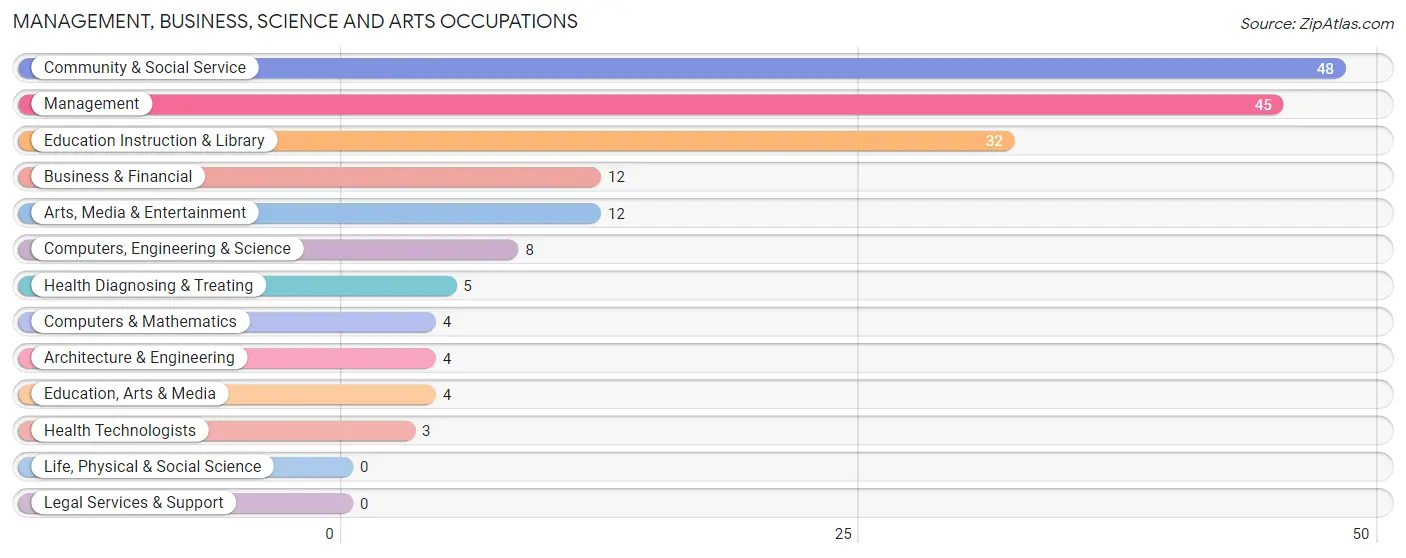
Management, Business, Science and Arts Occupations
The most common Management, Business, Science and Arts occupations in Appalachia are Community & Social Service (48 | 9.4%), Management (45 | 8.8%), Education Instruction & Library (32 | 6.3%), Business & Financial (12 | 2.4%), and Arts, Media & Entertainment (12 | 2.4%).
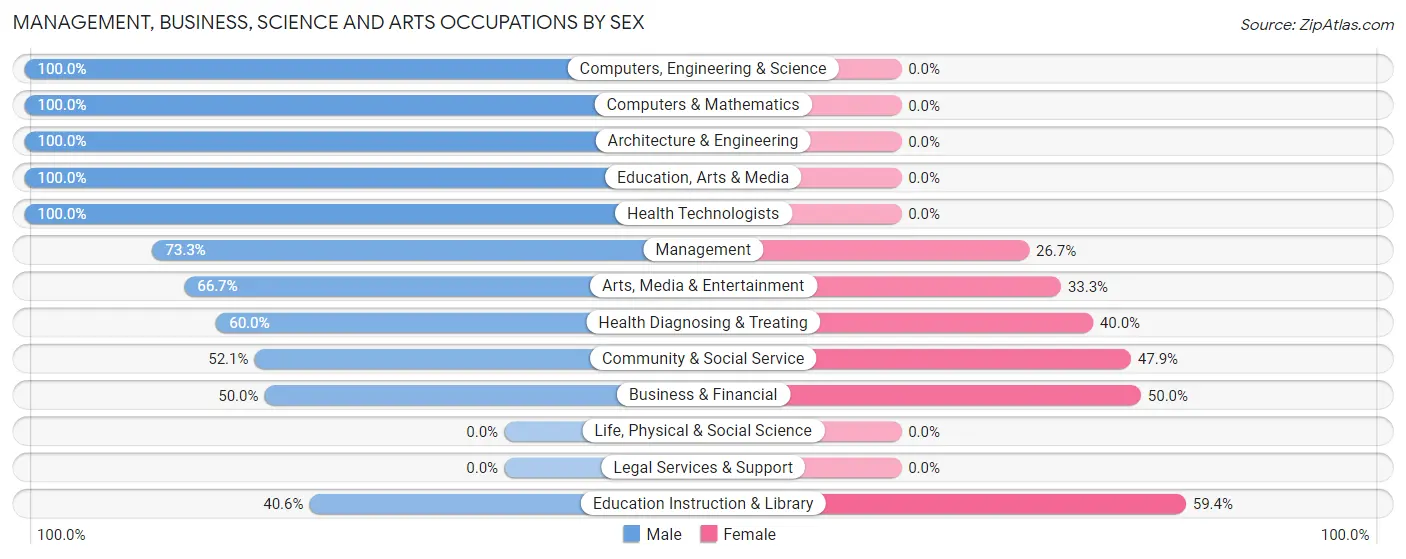
Management, Business, Science and Arts Occupations by Sex
Within the Management, Business, Science and Arts occupations in Appalachia, the most male-oriented occupations are Computers, Engineering & Science (100.0%), Computers & Mathematics (100.0%), and Architecture & Engineering (100.0%), while the most female-oriented occupations are Education Instruction & Library (59.4%), Business & Financial (50.0%), and Community & Social Service (47.9%).
| Occupation | Male | Female |
| Management | 33 (73.3%) | 12 (26.7%) |
| Business & Financial | 6 (50.0%) | 6 (50.0%) |
| Computers, Engineering & Science | 8 (100.0%) | 0 (0.0%) |
| Computers & Mathematics | 4 (100.0%) | 0 (0.0%) |
| Architecture & Engineering | 4 (100.0%) | 0 (0.0%) |
| Life, Physical & Social Science | 0 (0.0%) | 0 (0.0%) |
| Community & Social Service | 25 (52.1%) | 23 (47.9%) |
| Education, Arts & Media | 4 (100.0%) | 0 (0.0%) |
| Legal Services & Support | 0 (0.0%) | 0 (0.0%) |
| Education Instruction & Library | 13 (40.6%) | 19 (59.4%) |
| Arts, Media & Entertainment | 8 (66.7%) | 4 (33.3%) |
| Health Diagnosing & Treating | 3 (60.0%) | 2 (40.0%) |
| Health Technologists | 3 (100.0%) | 0 (0.0%) |
| Total (Category) | 75 (63.6%) | 43 (36.4%) |
| Total (Overall) | 301 (59.0%) | 209 (41.0%) |
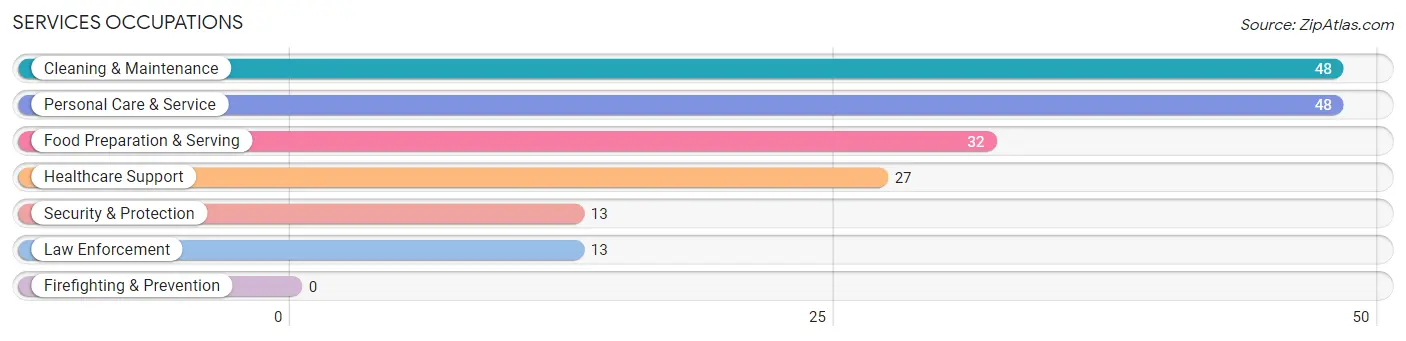
Services Occupations
The most common Services occupations in Appalachia are Cleaning & Maintenance (48 | 9.4%), Personal Care & Service (48 | 9.4%), Food Preparation & Serving (32 | 6.3%), Healthcare Support (27 | 5.3%), and Security & Protection (13 | 2.5%).
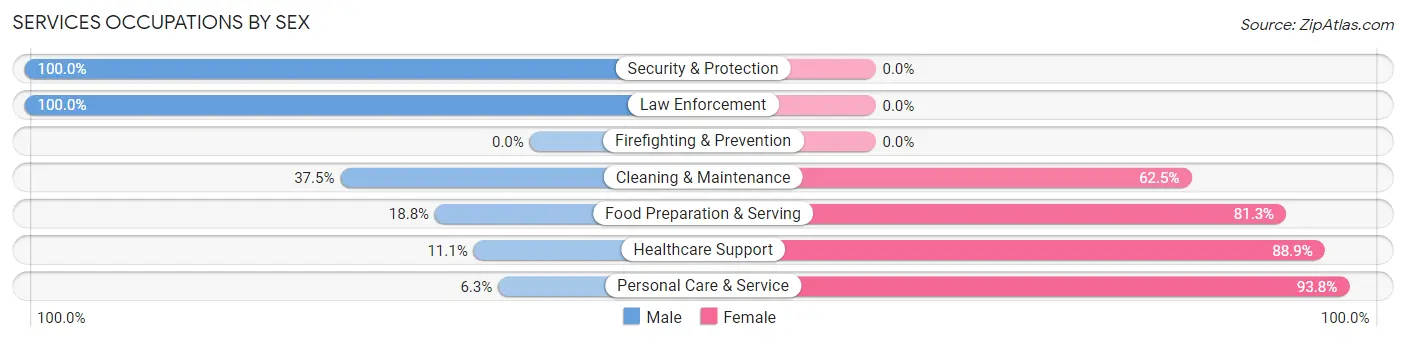
Services Occupations by Sex
Within the Services occupations in Appalachia, the most male-oriented occupations are Security & Protection (100.0%), Law Enforcement (100.0%), and Cleaning & Maintenance (37.5%), while the most female-oriented occupations are Personal Care & Service (93.8%), Healthcare Support (88.9%), and Food Preparation & Serving (81.2%).
| Occupation | Male | Female |
| Healthcare Support | 3 (11.1%) | 24 (88.9%) |
| Security & Protection | 13 (100.0%) | 0 (0.0%) |
| Firefighting & Prevention | 0 (0.0%) | 0 (0.0%) |
| Law Enforcement | 13 (100.0%) | 0 (0.0%) |
| Food Preparation & Serving | 6 (18.8%) | 26 (81.2%) |
| Cleaning & Maintenance | 18 (37.5%) | 30 (62.5%) |
| Personal Care & Service | 3 (6.2%) | 45 (93.8%) |
| Total (Category) | 43 (25.6%) | 125 (74.4%) |
| Total (Overall) | 301 (59.0%) | 209 (41.0%) |
Sales and Office Occupations
The most common Sales and Office occupations in Appalachia are Office & Administration (74 | 14.5%), and Sales & Related (23 | 4.5%).

Sales and Office Occupations by Sex
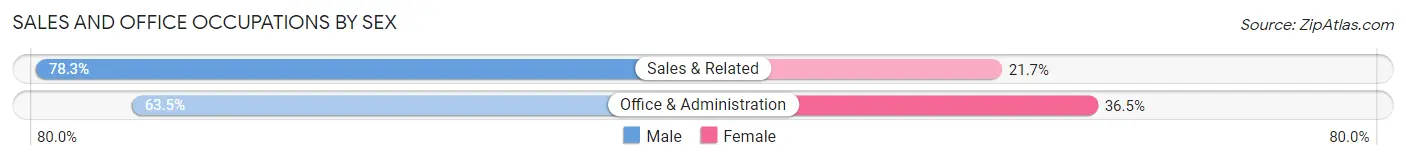
| Occupation | Male | Female |
| Sales & Related | 18 (78.3%) | 5 (21.7%) |
| Office & Administration | 47 (63.5%) | 27 (36.5%) |
| Total (Category) | 65 (67.0%) | 32 (33.0%) |
| Total (Overall) | 301 (59.0%) | 209 (41.0%) |
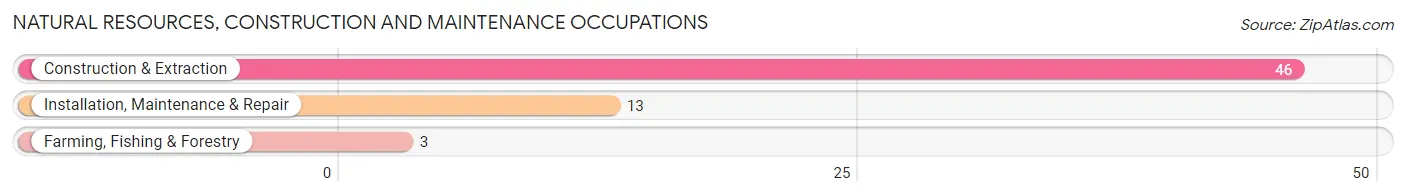
Natural Resources, Construction and Maintenance Occupations
The most common Natural Resources, Construction and Maintenance occupations in Appalachia are Construction & Extraction (46 | 9.0%), Installation, Maintenance & Repair (13 | 2.5%), and Farming, Fishing & Forestry (3 | 0.6%).
Natural Resources, Construction and Maintenance Occupations by Sex
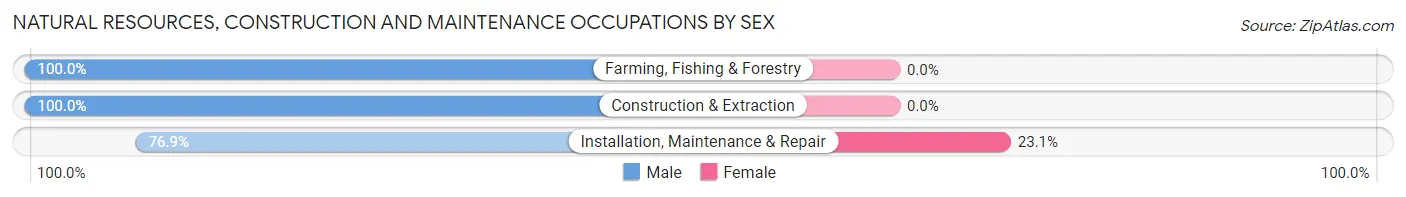
| Occupation | Male | Female |
| Farming, Fishing & Forestry | 3 (100.0%) | 0 (0.0%) |
| Construction & Extraction | 46 (100.0%) | 0 (0.0%) |
| Installation, Maintenance & Repair | 10 (76.9%) | 3 (23.1%) |
| Total (Category) | 59 (95.2%) | 3 (4.8%) |
| Total (Overall) | 301 (59.0%) | 209 (41.0%) |
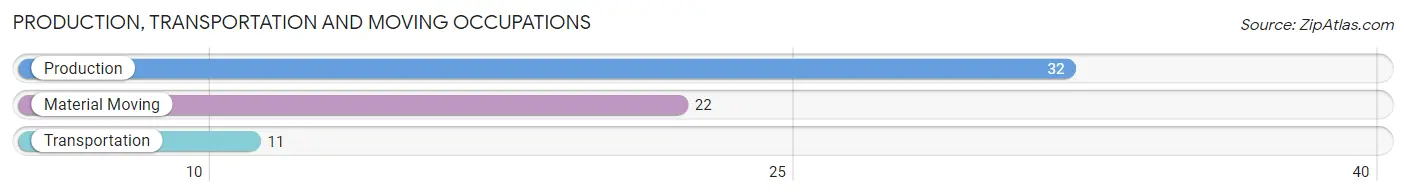
Production, Transportation and Moving Occupations
The most common Production, Transportation and Moving occupations in Appalachia are Production (32 | 6.3%), Material Moving (22 | 4.3%), and Transportation (11 | 2.2%).
Production, Transportation and Moving Occupations by Sex
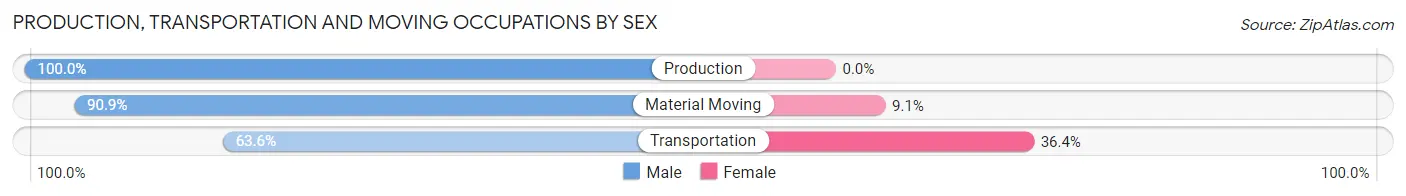
| Occupation | Male | Female |
| Production | 32 (100.0%) | 0 (0.0%) |
| Transportation | 7 (63.6%) | 4 (36.4%) |
| Material Moving | 20 (90.9%) | 2 (9.1%) |
| Total (Category) | 59 (90.8%) | 6 (9.2%) |
| Total (Overall) | 301 (59.0%) | 209 (41.0%) |
Employment Industries by Sex in Appalachia
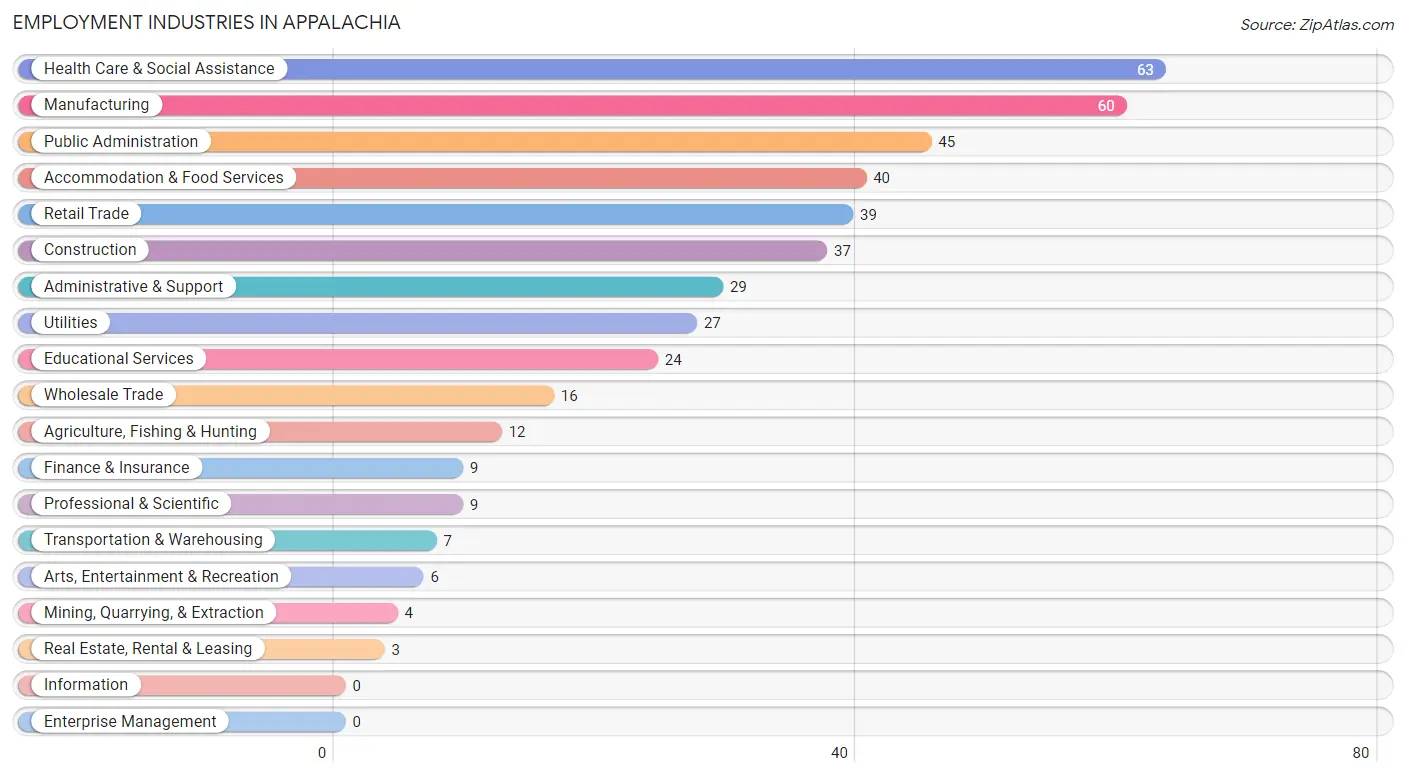
Employment Industries in Appalachia
The major employment industries in Appalachia include Health Care & Social Assistance (63 | 12.3%), Manufacturing (60 | 11.8%), Public Administration (45 | 8.8%), Accommodation & Food Services (40 | 7.8%), and Retail Trade (39 | 7.6%).
Employment Industries by Sex in Appalachia
The Appalachia industries that see more men than women are Agriculture, Fishing & Hunting (100.0%), Mining, Quarrying, & Extraction (100.0%), and Construction (100.0%), whereas the industries that tend to have a higher number of women are Accommodation & Food Services (85.0%), Health Care & Social Assistance (79.4%), and Educational Services (79.2%).
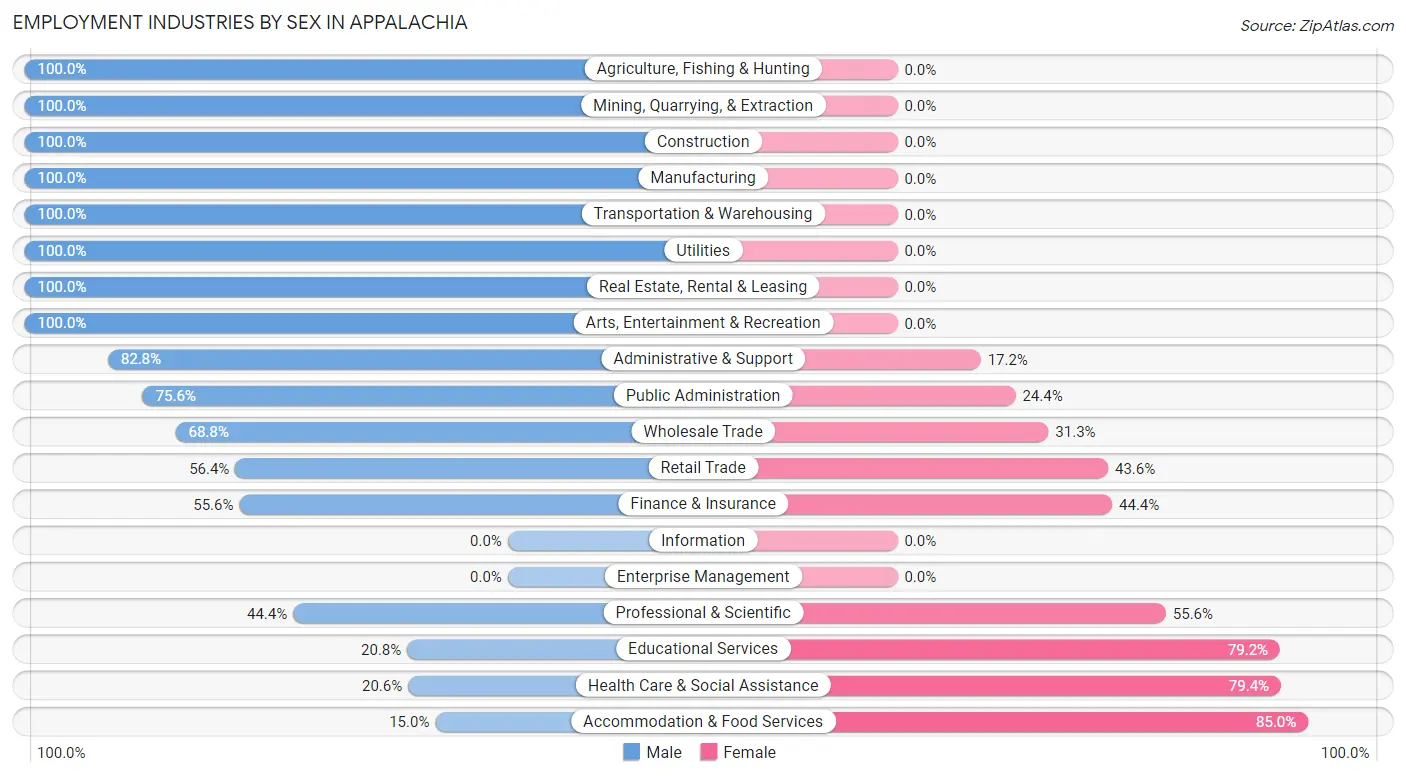
| Industry | Male | Female |
| Agriculture, Fishing & Hunting | 12 (100.0%) | 0 (0.0%) |
| Mining, Quarrying, & Extraction | 4 (100.0%) | 0 (0.0%) |
| Construction | 37 (100.0%) | 0 (0.0%) |
| Manufacturing | 60 (100.0%) | 0 (0.0%) |
| Wholesale Trade | 11 (68.8%) | 5 (31.2%) |
| Retail Trade | 22 (56.4%) | 17 (43.6%) |
| Transportation & Warehousing | 7 (100.0%) | 0 (0.0%) |
| Utilities | 27 (100.0%) | 0 (0.0%) |
| Information | 0 (0.0%) | 0 (0.0%) |
| Finance & Insurance | 5 (55.6%) | 4 (44.4%) |
| Real Estate, Rental & Leasing | 3 (100.0%) | 0 (0.0%) |
| Professional & Scientific | 4 (44.4%) | 5 (55.6%) |
| Enterprise Management | 0 (0.0%) | 0 (0.0%) |
| Administrative & Support | 24 (82.8%) | 5 (17.2%) |
| Educational Services | 5 (20.8%) | 19 (79.2%) |
| Health Care & Social Assistance | 13 (20.6%) | 50 (79.4%) |
| Arts, Entertainment & Recreation | 6 (100.0%) | 0 (0.0%) |
| Accommodation & Food Services | 6 (15.0%) | 34 (85.0%) |
| Public Administration | 34 (75.6%) | 11 (24.4%) |
| Total | 301 (59.0%) | 209 (41.0%) |
Education in Appalachia
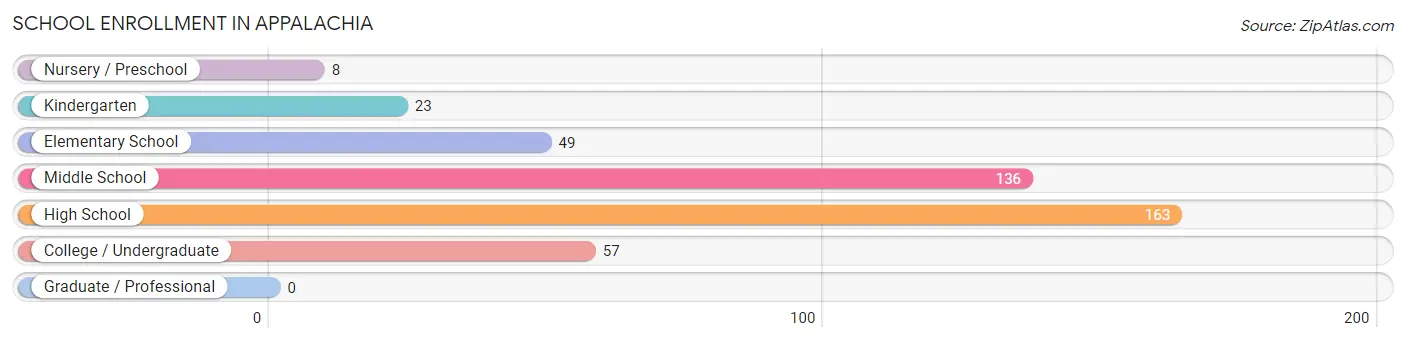
School Enrollment in Appalachia
The most common levels of schooling among the 436 students in Appalachia are high school (163 | 37.4%), middle school (136 | 31.2%), and college / undergraduate (57 | 13.1%).
| School Level | # Students | % Students |
| Nursery / Preschool | 8 | 1.8% |
| Kindergarten | 23 | 5.3% |
| Elementary School | 49 | 11.2% |
| Middle School | 136 | 31.2% |
| High School | 163 | 37.4% |
| College / Undergraduate | 57 | 13.1% |
| Graduate / Professional | 0 | 0.0% |
| Total | 436 | 100.0% |
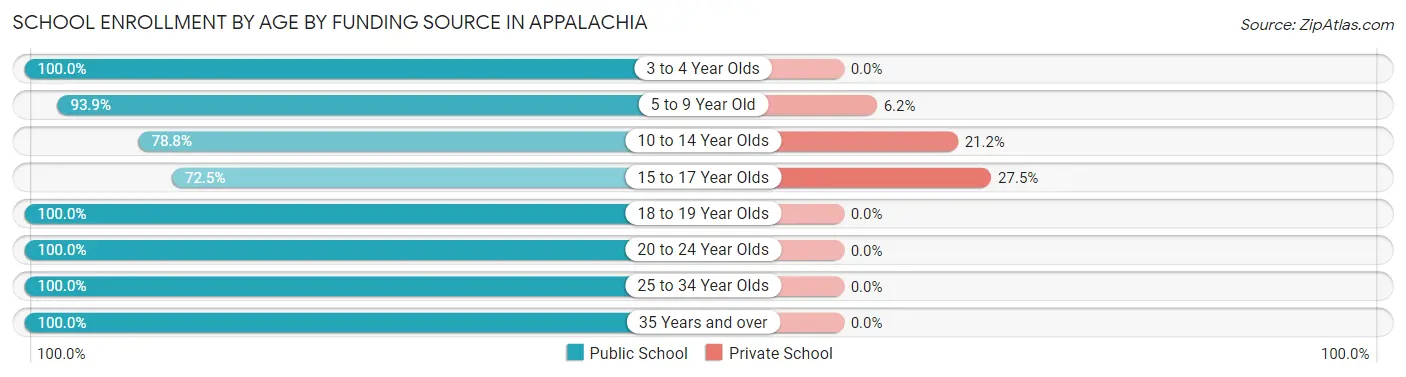
School Enrollment by Age by Funding Source in Appalachia
Out of a total of 436 students who are enrolled in schools in Appalachia, 70 (16.1%) attend a private institution, while the remaining 366 (83.9%) are enrolled in public schools. The age group of 15 to 17 year olds has the highest likelihood of being enrolled in private schools, with 25 (27.5% in the age bracket) enrolled. Conversely, the age group of 3 to 4 year olds has the lowest likelihood of being enrolled in a private school, with 5 (100.0% in the age bracket) attending a public institution.
| Age Bracket | Public School | Private School |
| 3 to 4 Year Olds | 5 (100.0%) | 0 (0.0%) |
| 5 to 9 Year Old | 61 (93.9%) | 4 (6.1%) |
| 10 to 14 Year Olds | 152 (78.8%) | 41 (21.2%) |
| 15 to 17 Year Olds | 66 (72.5%) | 25 (27.5%) |
| 18 to 19 Year Olds | 33 (100.0%) | 0 (0.0%) |
| 20 to 24 Year Olds | 8 (100.0%) | 0 (0.0%) |
| 25 to 34 Year Olds | 35 (100.0%) | 0 (0.0%) |
| 35 Years and over | 6 (100.0%) | 0 (0.0%) |
| Total | 366 (83.9%) | 70 (16.1%) |
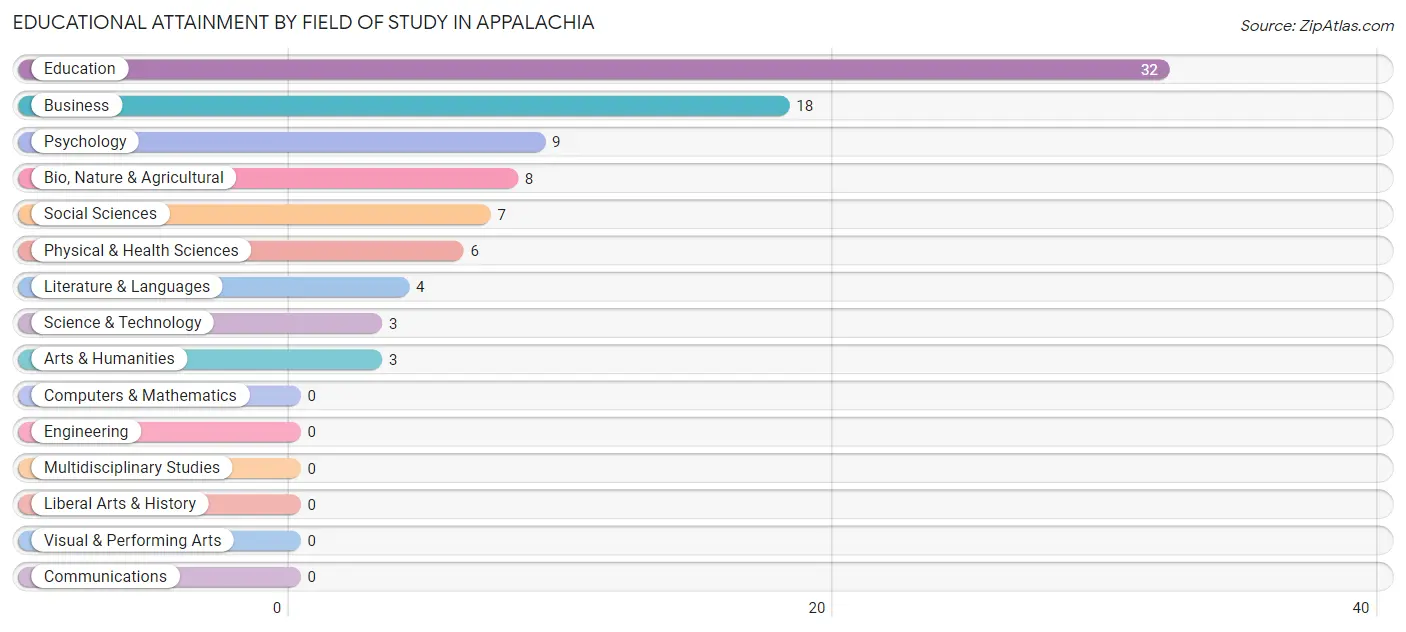
Educational Attainment by Field of Study in Appalachia
Education (32 | 35.6%), business (18 | 20.0%), psychology (9 | 10.0%), bio, nature & agricultural (8 | 8.9%), and social sciences (7 | 7.8%) are the most common fields of study among 90 individuals in Appalachia who have obtained a bachelor's degree or higher.
| Field of Study | # Graduates | % Graduates |
| Computers & Mathematics | 0 | 0.0% |
| Bio, Nature & Agricultural | 8 | 8.9% |
| Physical & Health Sciences | 6 | 6.7% |
| Psychology | 9 | 10.0% |
| Social Sciences | 7 | 7.8% |
| Engineering | 0 | 0.0% |
| Multidisciplinary Studies | 0 | 0.0% |
| Science & Technology | 3 | 3.3% |
| Business | 18 | 20.0% |
| Education | 32 | 35.6% |
| Literature & Languages | 4 | 4.4% |
| Liberal Arts & History | 0 | 0.0% |
| Visual & Performing Arts | 0 | 0.0% |
| Communications | 0 | 0.0% |
| Arts & Humanities | 3 | 3.3% |
| Total | 90 | 100.0% |
Transportation & Commute in Appalachia
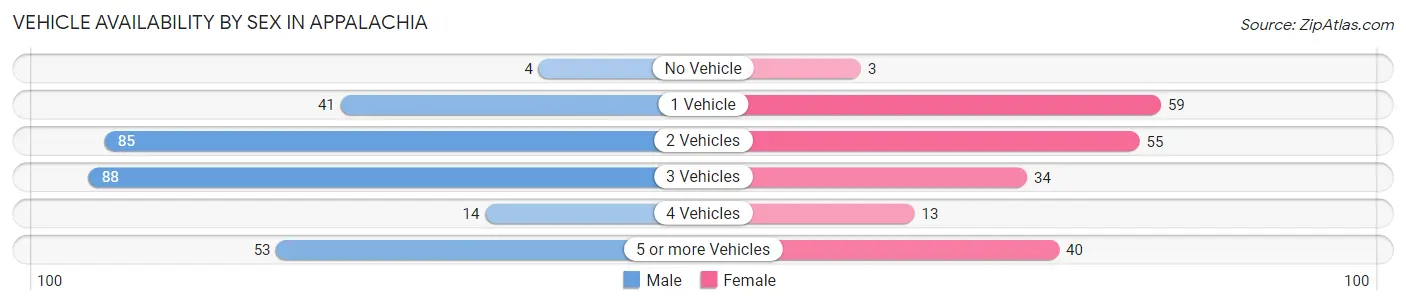
Vehicle Availability by Sex in Appalachia
The most prevalent vehicle ownership categories in Appalachia are males with 3 vehicles (88, accounting for 30.9%) and females with 3 vehicles (34, making up 43.1%).
| Vehicles Available | Male | Female |
| No Vehicle | 4 (1.4%) | 3 (1.5%) |
| 1 Vehicle | 41 (14.4%) | 59 (28.9%) |
| 2 Vehicles | 85 (29.8%) | 55 (27.0%) |
| 3 Vehicles | 88 (30.9%) | 34 (16.7%) |
| 4 Vehicles | 14 (4.9%) | 13 (6.4%) |
| 5 or more Vehicles | 53 (18.6%) | 40 (19.6%) |
| Total | 285 (100.0%) | 204 (100.0%) |
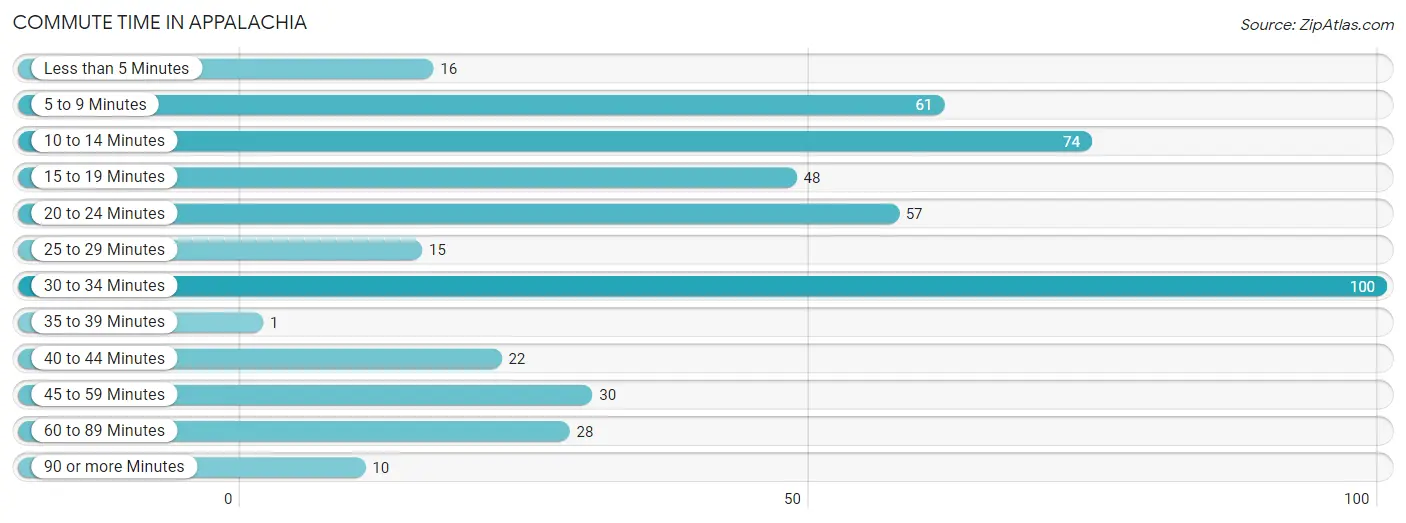
Commute Time in Appalachia
The most frequently occuring commute durations in Appalachia are 30 to 34 minutes (100 commuters, 21.6%), 10 to 14 minutes (74 commuters, 16.0%), and 5 to 9 minutes (61 commuters, 13.2%).
| Commute Time | # Commuters | % Commuters |
| Less than 5 Minutes | 16 | 3.5% |
| 5 to 9 Minutes | 61 | 13.2% |
| 10 to 14 Minutes | 74 | 16.0% |
| 15 to 19 Minutes | 48 | 10.4% |
| 20 to 24 Minutes | 57 | 12.3% |
| 25 to 29 Minutes | 15 | 3.3% |
| 30 to 34 Minutes | 100 | 21.6% |
| 35 to 39 Minutes | 1 | 0.2% |
| 40 to 44 Minutes | 22 | 4.8% |
| 45 to 59 Minutes | 30 | 6.5% |
| 60 to 89 Minutes | 28 | 6.1% |
| 90 or more Minutes | 10 | 2.2% |
Commute Time by Sex in Appalachia
The most common commute times in Appalachia are 30 to 34 minutes (98 commuters, 35.1%) for males and 20 to 24 minutes (51 commuters, 27.9%) for females.
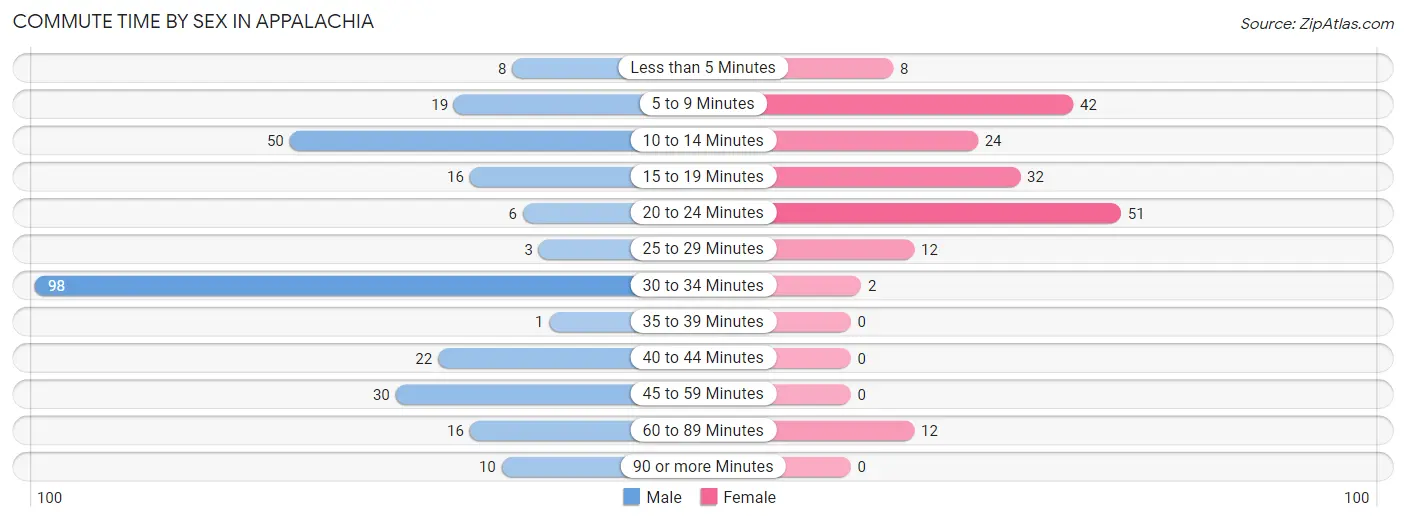
| Commute Time | Male | Female |
| Less than 5 Minutes | 8 (2.9%) | 8 (4.4%) |
| 5 to 9 Minutes | 19 (6.8%) | 42 (23.0%) |
| 10 to 14 Minutes | 50 (17.9%) | 24 (13.1%) |
| 15 to 19 Minutes | 16 (5.7%) | 32 (17.5%) |
| 20 to 24 Minutes | 6 (2.1%) | 51 (27.9%) |
| 25 to 29 Minutes | 3 (1.1%) | 12 (6.6%) |
| 30 to 34 Minutes | 98 (35.1%) | 2 (1.1%) |
| 35 to 39 Minutes | 1 (0.4%) | 0 (0.0%) |
| 40 to 44 Minutes | 22 (7.9%) | 0 (0.0%) |
| 45 to 59 Minutes | 30 (10.7%) | 0 (0.0%) |
| 60 to 89 Minutes | 16 (5.7%) | 12 (6.6%) |
| 90 or more Minutes | 10 (3.6%) | 0 (0.0%) |
Time of Departure to Work by Sex in Appalachia
The most frequent times of departure to work in Appalachia are 11:00 AM to 11:59 AM (36, 12.9%) for males and 10:00 AM to 10:59 AM (50, 27.3%) for females.
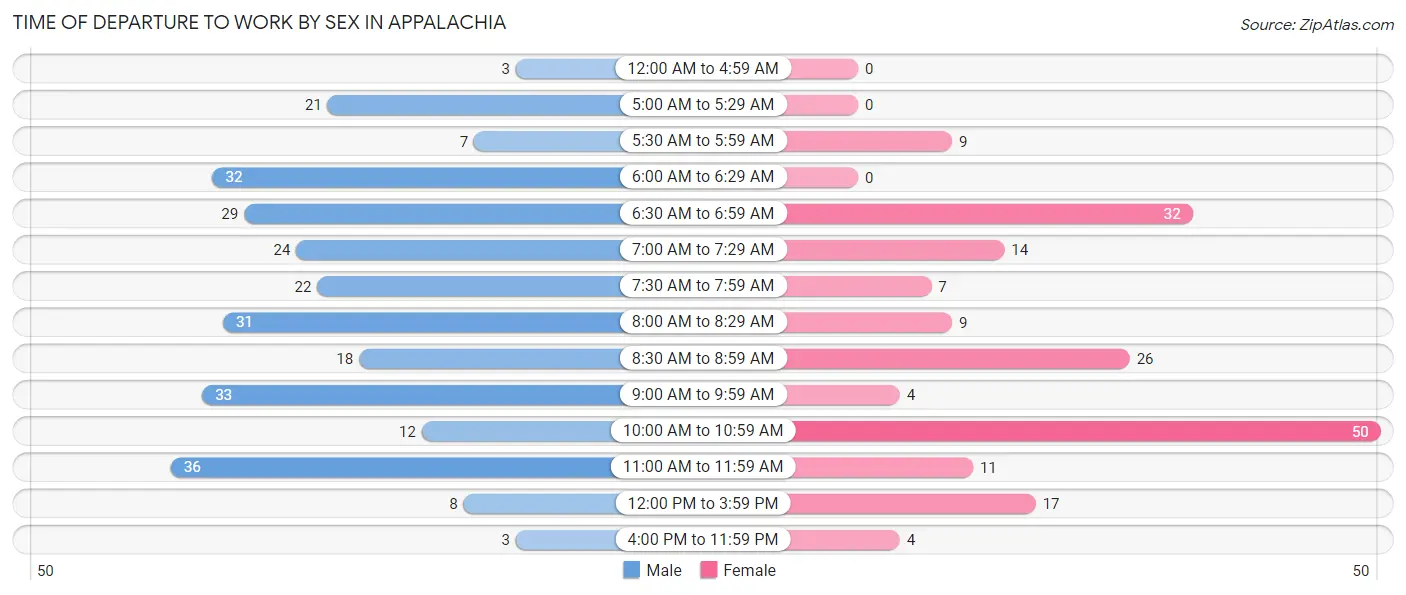
| Time of Departure | Male | Female |
| 12:00 AM to 4:59 AM | 3 (1.1%) | 0 (0.0%) |
| 5:00 AM to 5:29 AM | 21 (7.5%) | 0 (0.0%) |
| 5:30 AM to 5:59 AM | 7 (2.5%) | 9 (4.9%) |
| 6:00 AM to 6:29 AM | 32 (11.5%) | 0 (0.0%) |
| 6:30 AM to 6:59 AM | 29 (10.4%) | 32 (17.5%) |
| 7:00 AM to 7:29 AM | 24 (8.6%) | 14 (7.6%) |
| 7:30 AM to 7:59 AM | 22 (7.9%) | 7 (3.8%) |
| 8:00 AM to 8:29 AM | 31 (11.1%) | 9 (4.9%) |
| 8:30 AM to 8:59 AM | 18 (6.5%) | 26 (14.2%) |
| 9:00 AM to 9:59 AM | 33 (11.8%) | 4 (2.2%) |
| 10:00 AM to 10:59 AM | 12 (4.3%) | 50 (27.3%) |
| 11:00 AM to 11:59 AM | 36 (12.9%) | 11 (6.0%) |
| 12:00 PM to 3:59 PM | 8 (2.9%) | 17 (9.3%) |
| 4:00 PM to 11:59 PM | 3 (1.1%) | 4 (2.2%) |
| Total | 279 (100.0%) | 183 (100.0%) |
Housing Occupancy in Appalachia
Occupancy by Ownership in Appalachia
Of the total 623 dwellings in Appalachia, owner-occupied units account for 342 (54.9%), while renter-occupied units make up 281 (45.1%).
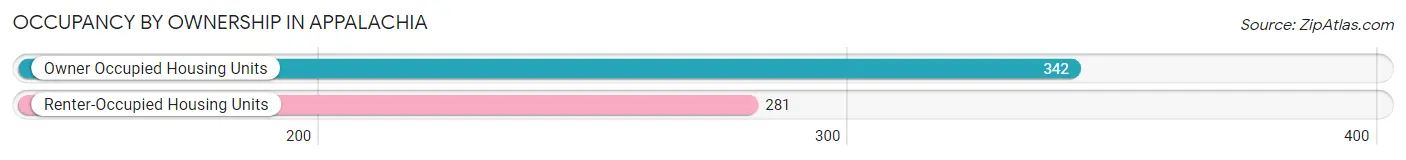
| Occupancy | # Housing Units | % Housing Units |
| Owner Occupied Housing Units | 342 | 54.9% |
| Renter-Occupied Housing Units | 281 | 45.1% |
| Total Occupied Housing Units | 623 | 100.0% |
Occupancy by Household Size in Appalachia
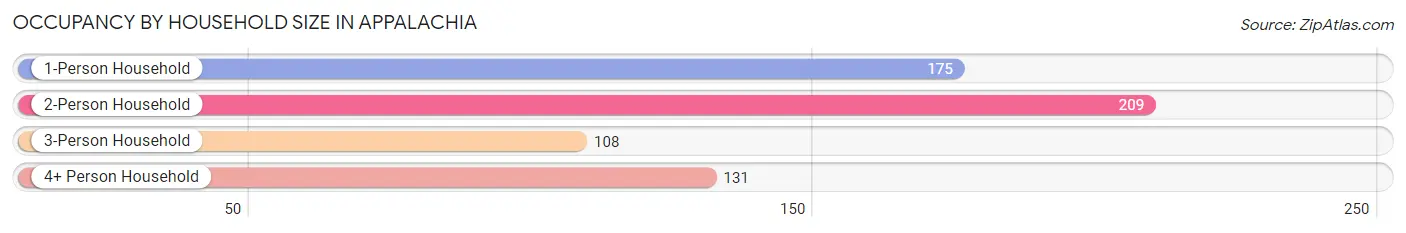
| Household Size | # Housing Units | % Housing Units |
| 1-Person Household | 175 | 28.1% |
| 2-Person Household | 209 | 33.6% |
| 3-Person Household | 108 | 17.3% |
| 4+ Person Household | 131 | 21.0% |
| Total Housing Units | 623 | 100.0% |
Occupancy by Ownership by Household Size in Appalachia
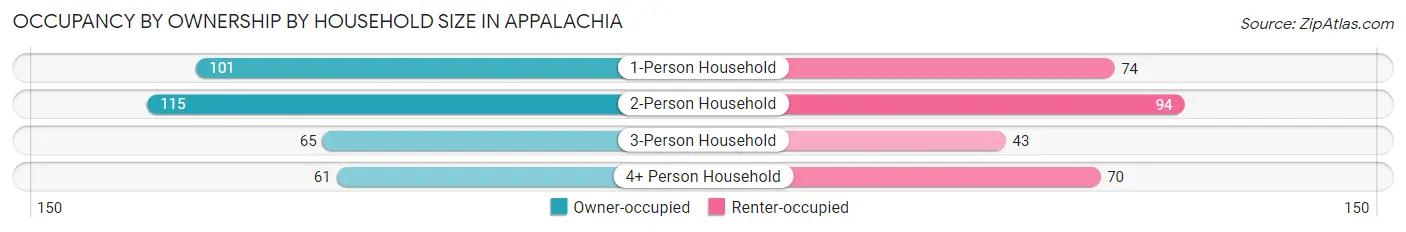
| Household Size | Owner-occupied | Renter-occupied |
| 1-Person Household | 101 (57.7%) | 74 (42.3%) |
| 2-Person Household | 115 (55.0%) | 94 (45.0%) |
| 3-Person Household | 65 (60.2%) | 43 (39.8%) |
| 4+ Person Household | 61 (46.6%) | 70 (53.4%) |
| Total Housing Units | 342 (54.9%) | 281 (45.1%) |
Occupancy by Educational Attainment in Appalachia
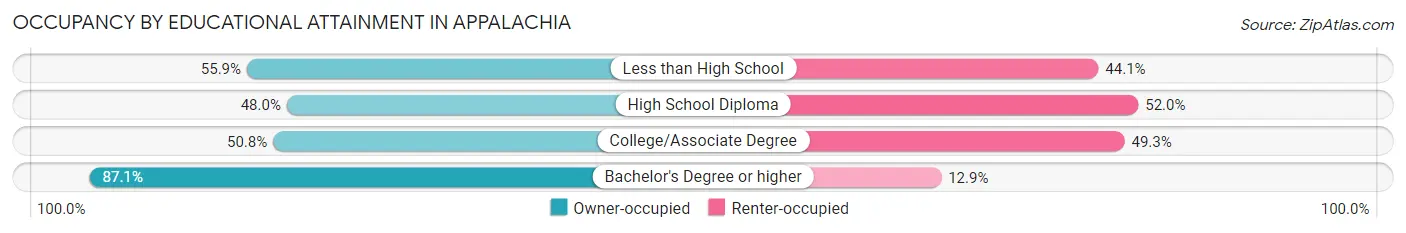
| Household Size | Owner-occupied | Renter-occupied |
| Less than High School | 80 (55.9%) | 63 (44.1%) |
| High School Diploma | 73 (48.0%) | 79 (52.0%) |
| College/Associate Degree | 135 (50.7%) | 131 (49.2%) |
| Bachelor's Degree or higher | 54 (87.1%) | 8 (12.9%) |
Occupancy by Age of Householder in Appalachia
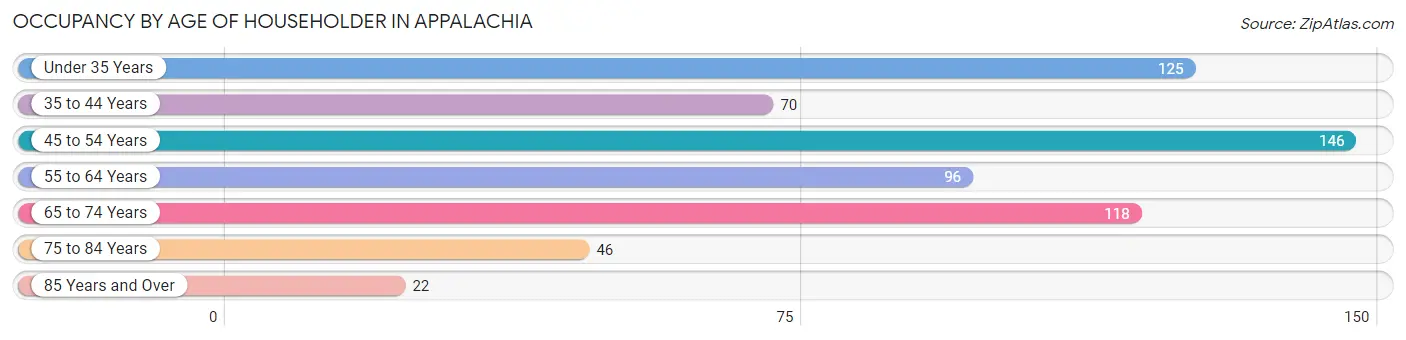
| Age Bracket | # Households | % Households |
| Under 35 Years | 125 | 20.1% |
| 35 to 44 Years | 70 | 11.2% |
| 45 to 54 Years | 146 | 23.4% |
| 55 to 64 Years | 96 | 15.4% |
| 65 to 74 Years | 118 | 18.9% |
| 75 to 84 Years | 46 | 7.4% |
| 85 Years and Over | 22 | 3.5% |
| Total | 623 | 100.0% |
Housing Finances in Appalachia
Median Income by Occupancy in Appalachia
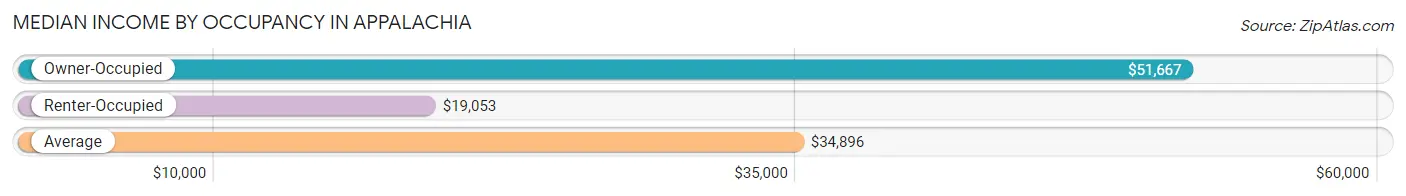
| Occupancy Type | # Households | Median Income |
| Owner-Occupied | 342 (54.9%) | $51,667 |
| Renter-Occupied | 281 (45.1%) | $19,053 |
| Average | 623 (100.0%) | $34,896 |
Occupancy by Householder Income Bracket in Appalachia
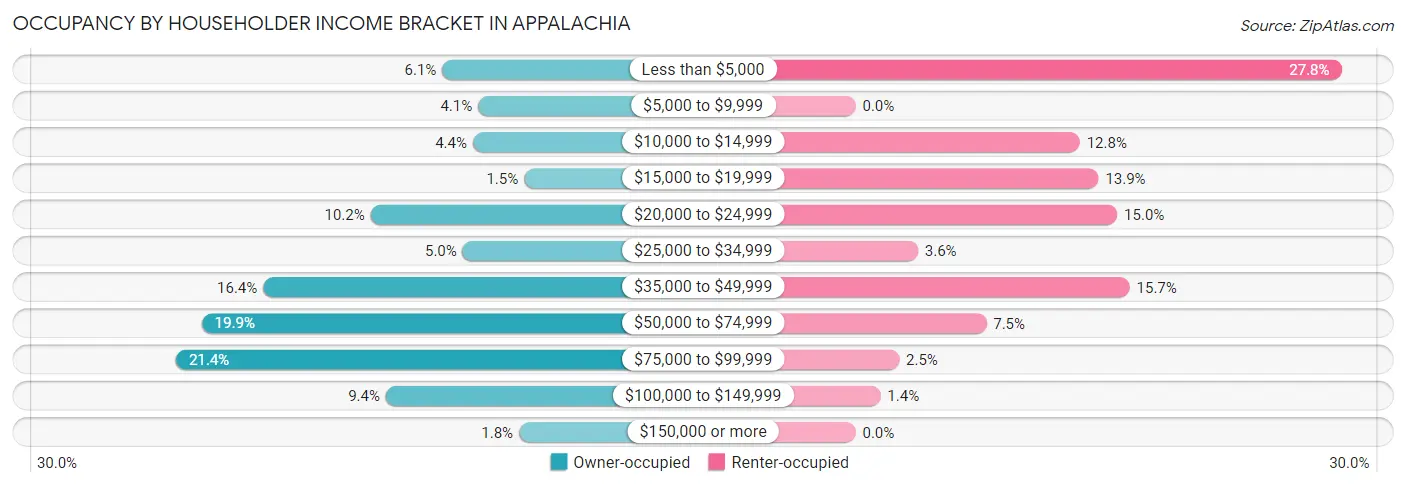
| Income Bracket | Owner-occupied | Renter-occupied |
| Less than $5,000 | 21 (6.1%) | 78 (27.8%) |
| $5,000 to $9,999 | 14 (4.1%) | 0 (0.0%) |
| $10,000 to $14,999 | 15 (4.4%) | 36 (12.8%) |
| $15,000 to $19,999 | 5 (1.5%) | 39 (13.9%) |
| $20,000 to $24,999 | 35 (10.2%) | 42 (14.9%) |
| $25,000 to $34,999 | 17 (5.0%) | 10 (3.6%) |
| $35,000 to $49,999 | 56 (16.4%) | 44 (15.7%) |
| $50,000 to $74,999 | 68 (19.9%) | 21 (7.5%) |
| $75,000 to $99,999 | 73 (21.3%) | 7 (2.5%) |
| $100,000 to $149,999 | 32 (9.4%) | 4 (1.4%) |
| $150,000 or more | 6 (1.8%) | 0 (0.0%) |
| Total | 342 (100.0%) | 281 (100.0%) |
Monthly Housing Cost Tiers in Appalachia
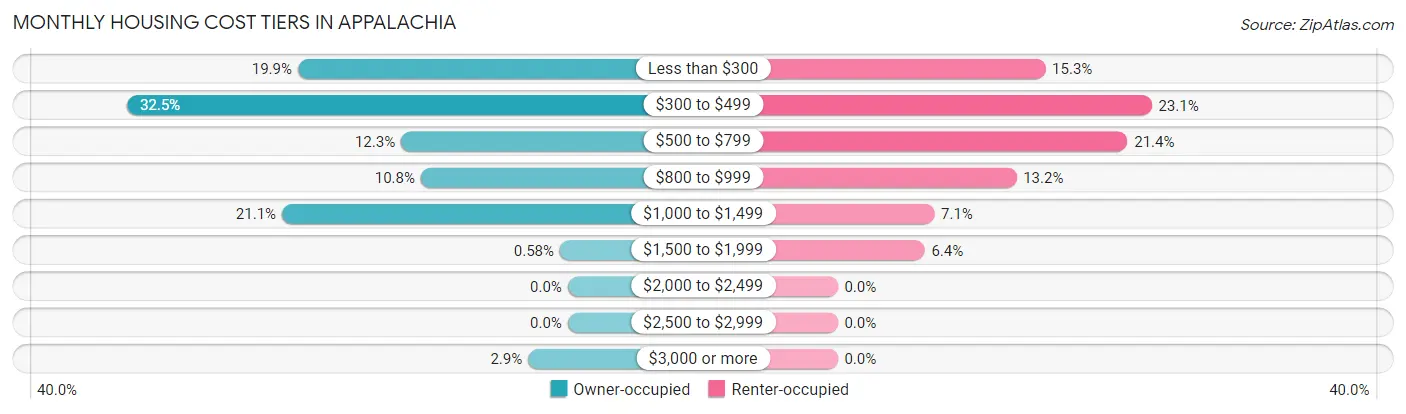
| Monthly Cost | Owner-occupied | Renter-occupied |
| Less than $300 | 68 (19.9%) | 43 (15.3%) |
| $300 to $499 | 111 (32.5%) | 65 (23.1%) |
| $500 to $799 | 42 (12.3%) | 60 (21.3%) |
| $800 to $999 | 37 (10.8%) | 37 (13.2%) |
| $1,000 to $1,499 | 72 (21.0%) | 20 (7.1%) |
| $1,500 to $1,999 | 2 (0.6%) | 18 (6.4%) |
| $2,000 to $2,499 | 0 (0.0%) | 0 (0.0%) |
| $2,500 to $2,999 | 0 (0.0%) | 0 (0.0%) |
| $3,000 or more | 10 (2.9%) | 0 (0.0%) |
| Total | 342 (100.0%) | 281 (100.0%) |
Physical Housing Characteristics in Appalachia
Housing Structures in Appalachia
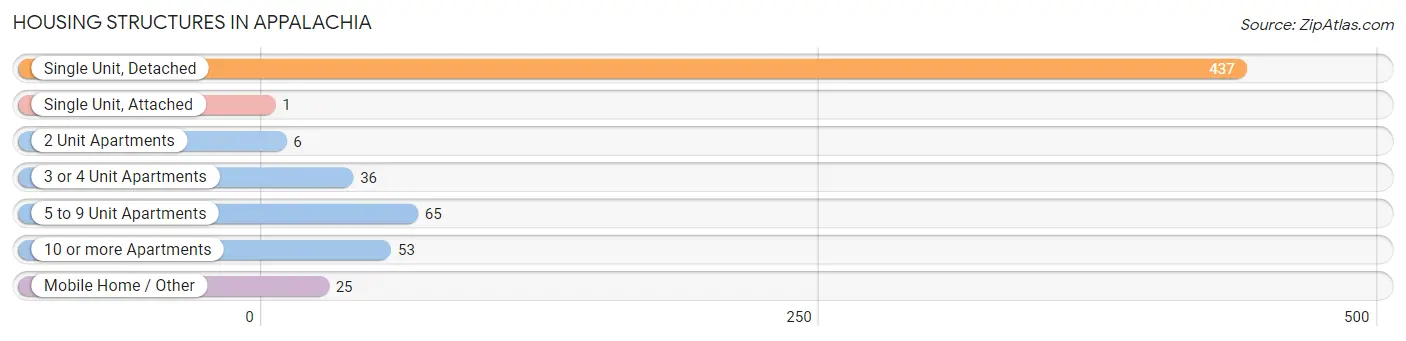
| Structure Type | # Housing Units | % Housing Units |
| Single Unit, Detached | 437 | 70.1% |
| Single Unit, Attached | 1 | 0.2% |
| 2 Unit Apartments | 6 | 1.0% |
| 3 or 4 Unit Apartments | 36 | 5.8% |
| 5 to 9 Unit Apartments | 65 | 10.4% |
| 10 or more Apartments | 53 | 8.5% |
| Mobile Home / Other | 25 | 4.0% |
| Total | 623 | 100.0% |
Housing Structures by Occupancy in Appalachia
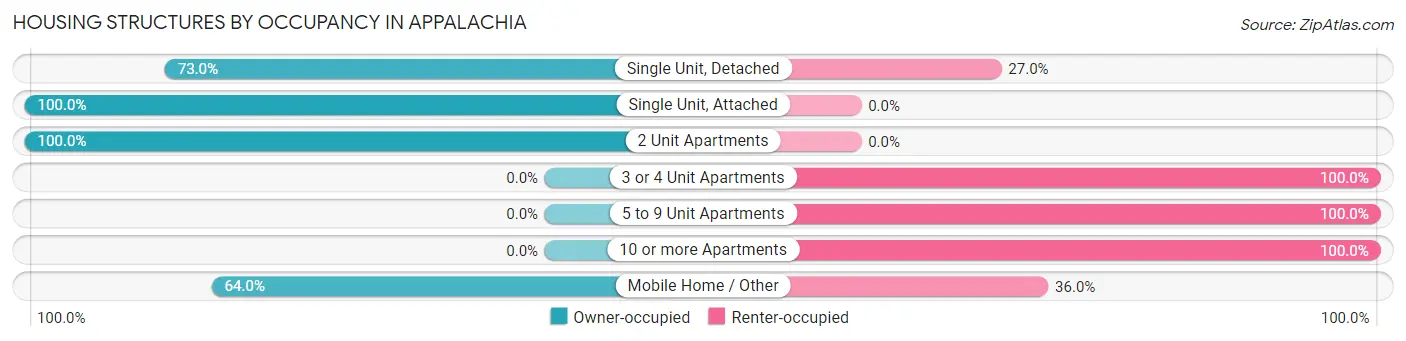
| Structure Type | Owner-occupied | Renter-occupied |
| Single Unit, Detached | 319 (73.0%) | 118 (27.0%) |
| Single Unit, Attached | 1 (100.0%) | 0 (0.0%) |
| 2 Unit Apartments | 6 (100.0%) | 0 (0.0%) |
| 3 or 4 Unit Apartments | 0 (0.0%) | 36 (100.0%) |
| 5 to 9 Unit Apartments | 0 (0.0%) | 65 (100.0%) |
| 10 or more Apartments | 0 (0.0%) | 53 (100.0%) |
| Mobile Home / Other | 16 (64.0%) | 9 (36.0%) |
| Total | 342 (54.9%) | 281 (45.1%) |
Housing Structures by Number of Rooms in Appalachia
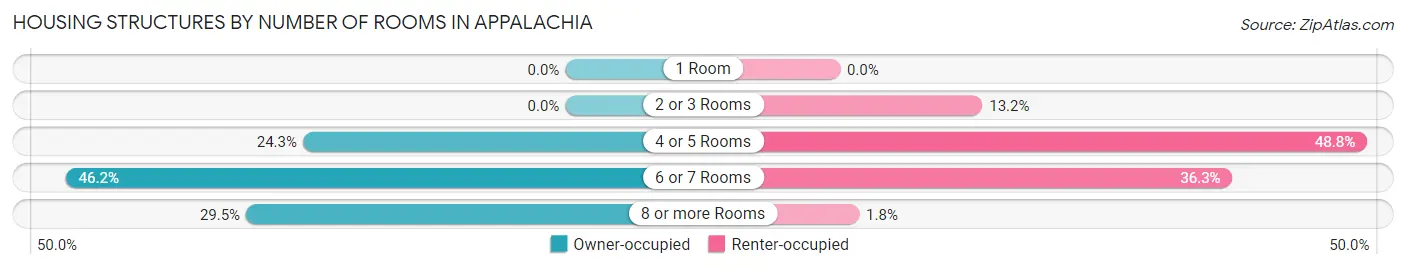
| Number of Rooms | Owner-occupied | Renter-occupied |
| 1 Room | 0 (0.0%) | 0 (0.0%) |
| 2 or 3 Rooms | 0 (0.0%) | 37 (13.2%) |
| 4 or 5 Rooms | 83 (24.3%) | 137 (48.7%) |
| 6 or 7 Rooms | 158 (46.2%) | 102 (36.3%) |
| 8 or more Rooms | 101 (29.5%) | 5 (1.8%) |
| Total | 342 (100.0%) | 281 (100.0%) |
Housing Structure by Heating Type in Appalachia
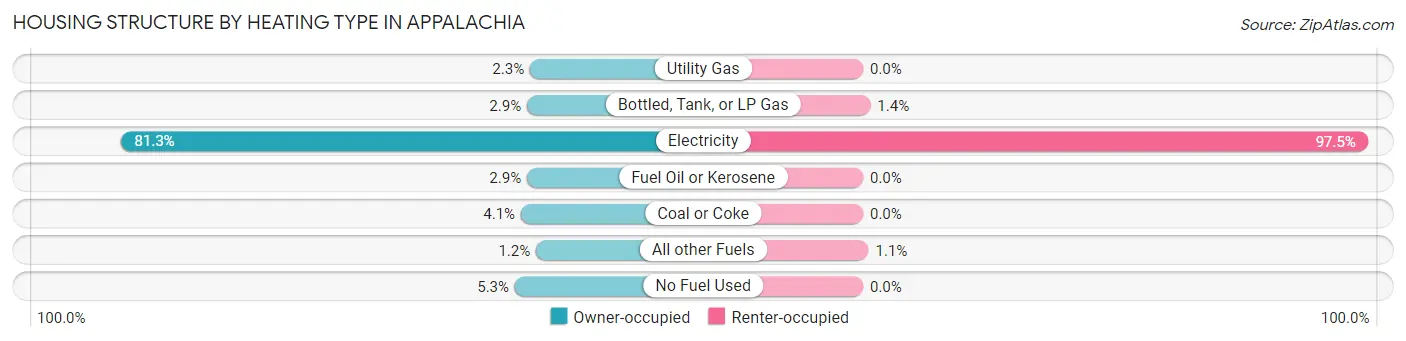
| Heating Type | Owner-occupied | Renter-occupied |
| Utility Gas | 8 (2.3%) | 0 (0.0%) |
| Bottled, Tank, or LP Gas | 10 (2.9%) | 4 (1.4%) |
| Electricity | 278 (81.3%) | 274 (97.5%) |
| Fuel Oil or Kerosene | 10 (2.9%) | 0 (0.0%) |
| Coal or Coke | 14 (4.1%) | 0 (0.0%) |
| All other Fuels | 4 (1.2%) | 3 (1.1%) |
| No Fuel Used | 18 (5.3%) | 0 (0.0%) |
| Total | 342 (100.0%) | 281 (100.0%) |
Household Vehicle Usage in Appalachia
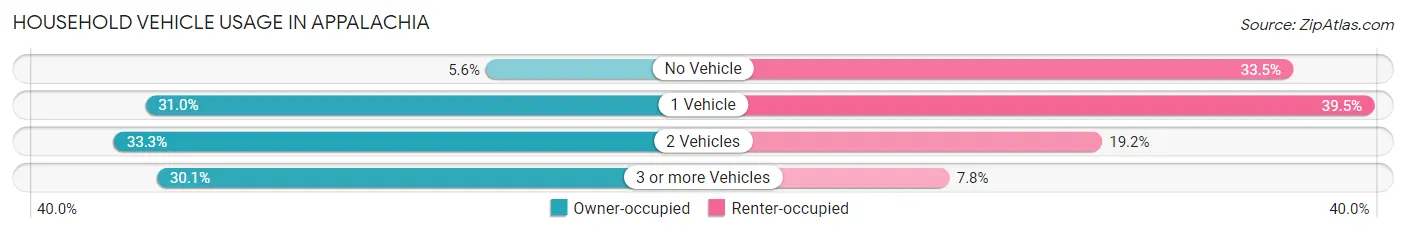
| Vehicles per Household | Owner-occupied | Renter-occupied |
| No Vehicle | 19 (5.6%) | 94 (33.5%) |
| 1 Vehicle | 106 (31.0%) | 111 (39.5%) |
| 2 Vehicles | 114 (33.3%) | 54 (19.2%) |
| 3 or more Vehicles | 103 (30.1%) | 22 (7.8%) |
| Total | 342 (100.0%) | 281 (100.0%) |
Real Estate & Mortgages in Appalachia
Real Estate and Mortgage Overview in Appalachia
| Characteristic | Without Mortgage | With Mortgage |
| Housing Units | 207 | 135 |
| Median Property Value | $42,700 | $89,600 |
| Median Household Income | $39,213 | $6 |
| Monthly Housing Costs | $346 | $10 |
| Real Estate Taxes | $465 | $3 |
Property Value by Mortgage Status in Appalachia
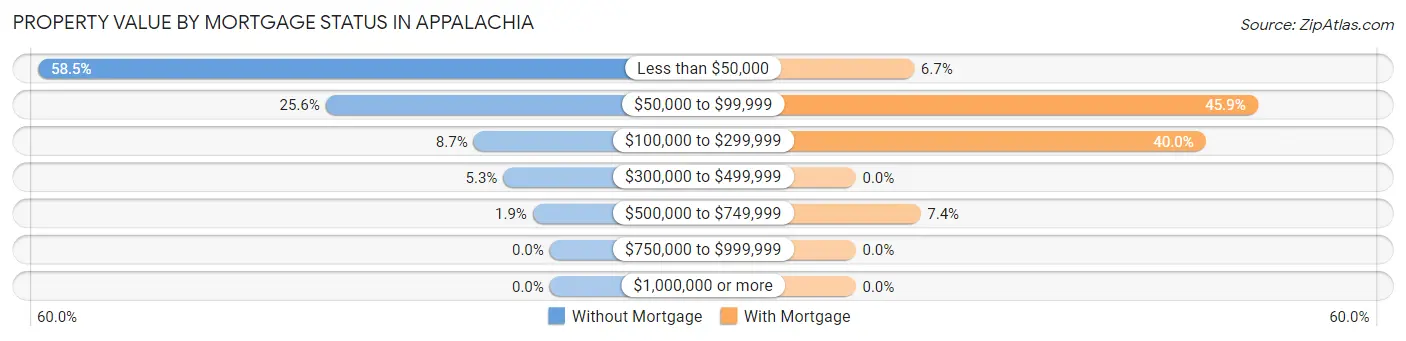
| Property Value | Without Mortgage | With Mortgage |
| Less than $50,000 | 121 (58.5%) | 9 (6.7%) |
| $50,000 to $99,999 | 53 (25.6%) | 62 (45.9%) |
| $100,000 to $299,999 | 18 (8.7%) | 54 (40.0%) |
| $300,000 to $499,999 | 11 (5.3%) | 0 (0.0%) |
| $500,000 to $749,999 | 4 (1.9%) | 10 (7.4%) |
| $750,000 to $999,999 | 0 (0.0%) | 0 (0.0%) |
| $1,000,000 or more | 0 (0.0%) | 0 (0.0%) |
| Total | 207 (100.0%) | 135 (100.0%) |
Household Income by Mortgage Status in Appalachia
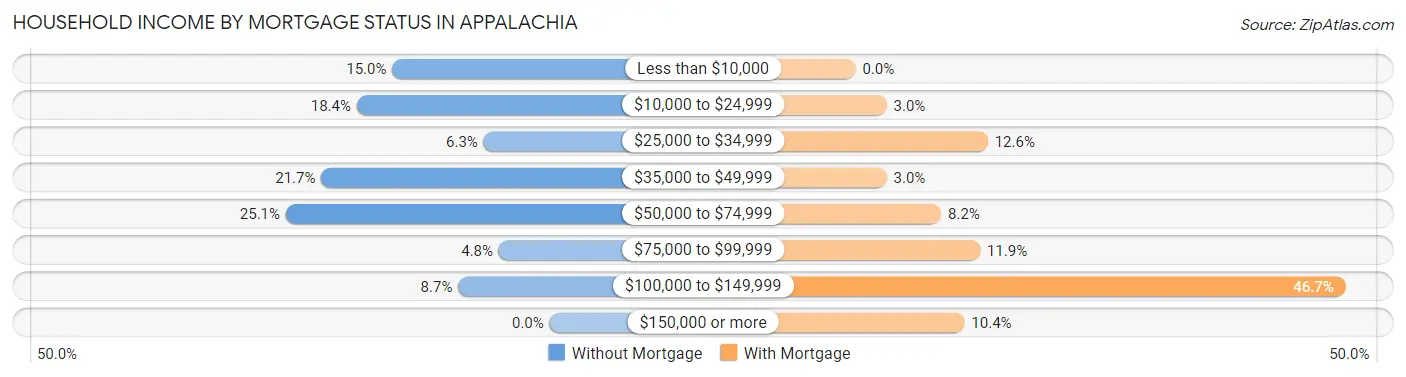
| Household Income | Without Mortgage | With Mortgage |
| Less than $10,000 | 31 (15.0%) | 0 (0.0%) |
| $10,000 to $24,999 | 38 (18.4%) | 4 (3.0%) |
| $25,000 to $34,999 | 13 (6.3%) | 17 (12.6%) |
| $35,000 to $49,999 | 45 (21.7%) | 4 (3.0%) |
| $50,000 to $74,999 | 52 (25.1%) | 11 (8.2%) |
| $75,000 to $99,999 | 10 (4.8%) | 16 (11.8%) |
| $100,000 to $149,999 | 18 (8.7%) | 63 (46.7%) |
| $150,000 or more | 0 (0.0%) | 14 (10.4%) |
| Total | 207 (100.0%) | 135 (100.0%) |
Property Value to Household Income Ratio in Appalachia
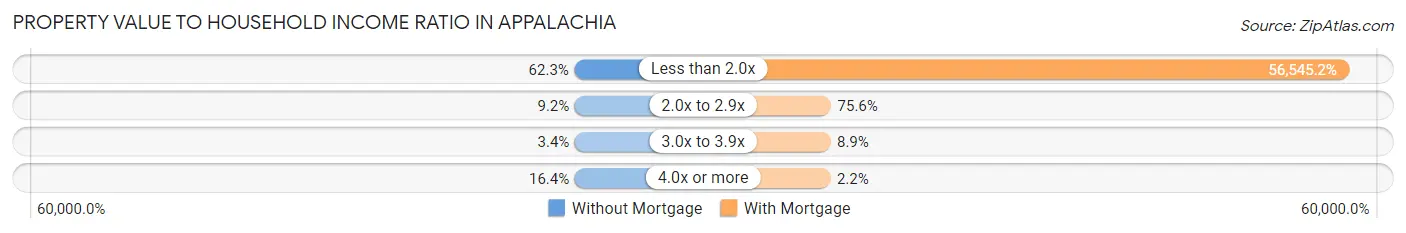
| Value-to-Income Ratio | Without Mortgage | With Mortgage |
| Less than 2.0x | 129 (62.3%) | 76,336 (56,545.2%) |
| 2.0x to 2.9x | 19 (9.2%) | 102 (75.6%) |
| 3.0x to 3.9x | 7 (3.4%) | 12 (8.9%) |
| 4.0x or more | 34 (16.4%) | 3 (2.2%) |
| Total | 207 (100.0%) | 135 (100.0%) |
Real Estate Taxes by Mortgage Status in Appalachia
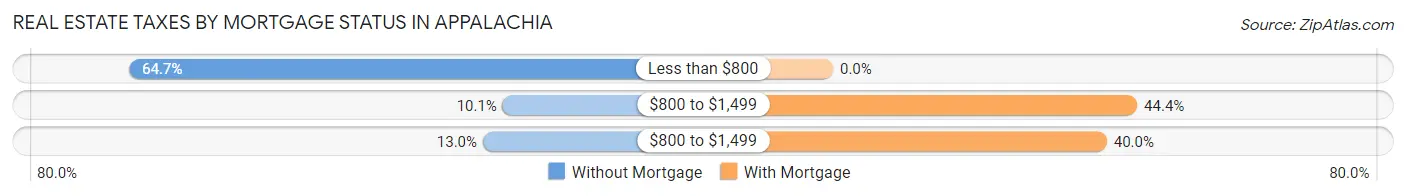
| Property Taxes | Without Mortgage | With Mortgage |
| Less than $800 | 134 (64.7%) | 0 (0.0%) |
| $800 to $1,499 | 21 (10.1%) | 60 (44.4%) |
| $800 to $1,499 | 27 (13.0%) | 54 (40.0%) |
| Total | 207 (100.0%) | 135 (100.0%) |
Health & Disability in Appalachia
Health Insurance Coverage by Age in Appalachia
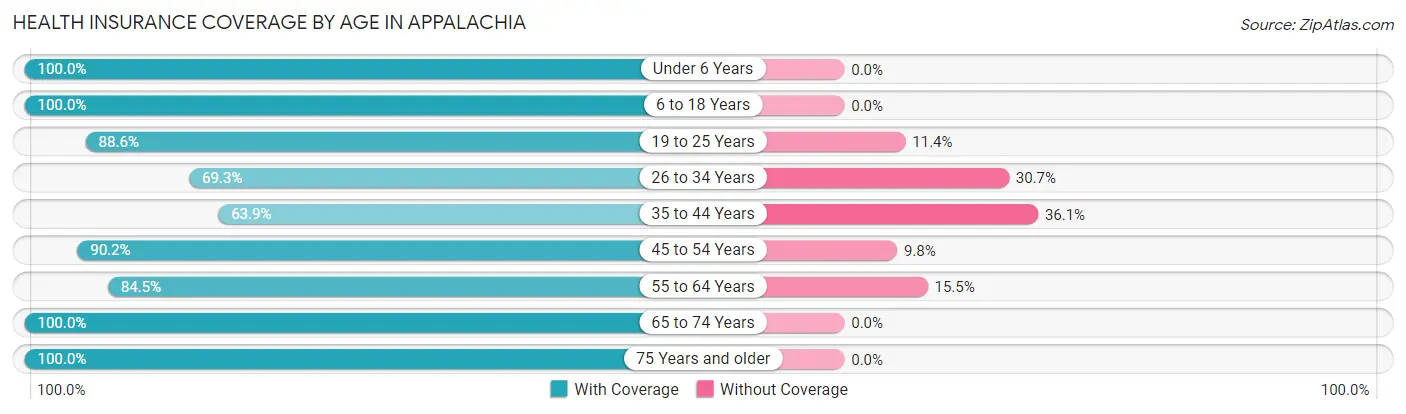
| Age Bracket | With Coverage | Without Coverage |
| Under 6 Years | 129 (100.0%) | 0 (0.0%) |
| 6 to 18 Years | 365 (100.0%) | 0 (0.0%) |
| 19 to 25 Years | 140 (88.6%) | 18 (11.4%) |
| 26 to 34 Years | 113 (69.3%) | 50 (30.7%) |
| 35 to 44 Years | 92 (63.9%) | 52 (36.1%) |
| 45 to 54 Years | 211 (90.2%) | 23 (9.8%) |
| 55 to 64 Years | 147 (84.5%) | 27 (15.5%) |
| 65 to 74 Years | 138 (100.0%) | 0 (0.0%) |
| 75 Years and older | 80 (100.0%) | 0 (0.0%) |
| Total | 1,415 (89.3%) | 170 (10.7%) |
Health Insurance Coverage by Citizenship Status in Appalachia
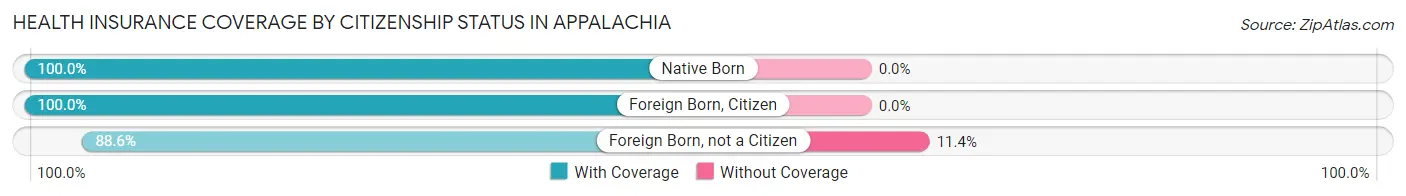
| Citizenship Status | With Coverage | Without Coverage |
| Native Born | 129 (100.0%) | 0 (0.0%) |
| Foreign Born, Citizen | 365 (100.0%) | 0 (0.0%) |
| Foreign Born, not a Citizen | 140 (88.6%) | 18 (11.4%) |
Health Insurance Coverage by Household Income in Appalachia
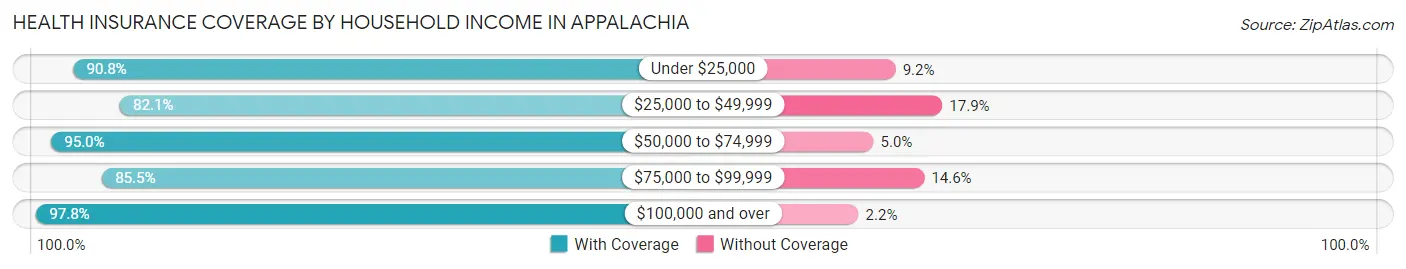
| Household Income | With Coverage | Without Coverage |
| Under $25,000 | 595 (90.8%) | 60 (9.2%) |
| $25,000 to $49,999 | 298 (82.1%) | 65 (17.9%) |
| $50,000 to $74,999 | 208 (95.0%) | 11 (5.0%) |
| $75,000 to $99,999 | 182 (85.5%) | 31 (14.5%) |
| $100,000 and over | 132 (97.8%) | 3 (2.2%) |
Public vs Private Health Insurance Coverage by Age in Appalachia
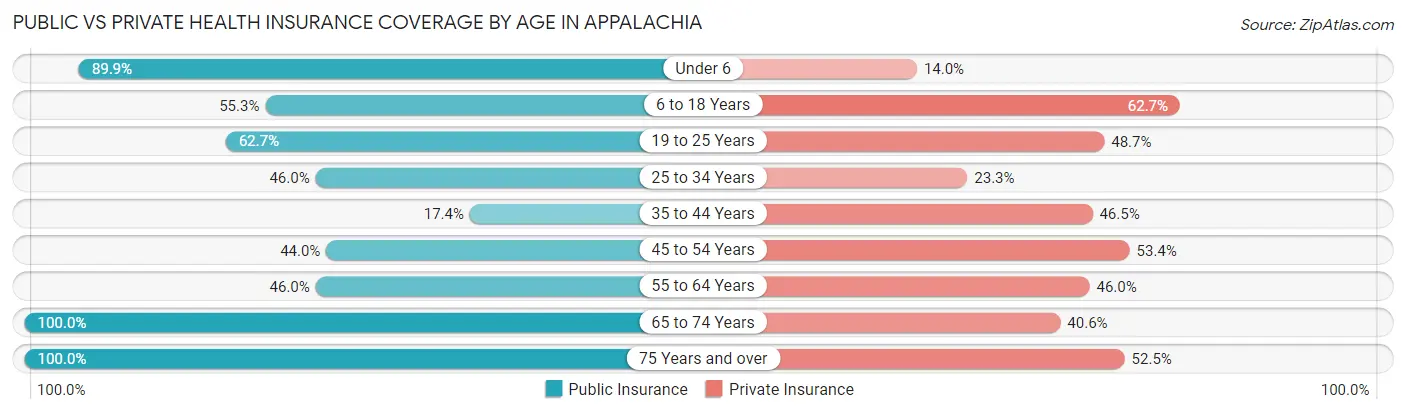
| Age Bracket | Public Insurance | Private Insurance |
| Under 6 | 116 (89.9%) | 18 (14.0%) |
| 6 to 18 Years | 202 (55.3%) | 229 (62.7%) |
| 19 to 25 Years | 99 (62.7%) | 77 (48.7%) |
| 25 to 34 Years | 75 (46.0%) | 38 (23.3%) |
| 35 to 44 Years | 25 (17.4%) | 67 (46.5%) |
| 45 to 54 Years | 103 (44.0%) | 125 (53.4%) |
| 55 to 64 Years | 80 (46.0%) | 80 (46.0%) |
| 65 to 74 Years | 138 (100.0%) | 56 (40.6%) |
| 75 Years and over | 80 (100.0%) | 42 (52.5%) |
| Total | 918 (57.9%) | 732 (46.2%) |
Disability Status by Sex by Age in Appalachia
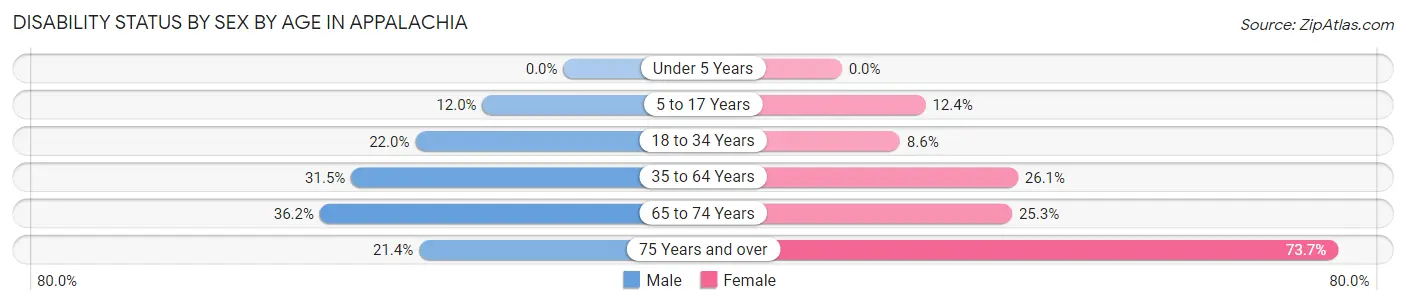
| Age Bracket | Male | Female |
| Under 5 Years | 0 (0.0%) | 0 (0.0%) |
| 5 to 17 Years | 22 (12.0%) | 23 (12.4%) |
| 18 to 34 Years | 31 (22.0%) | 17 (8.6%) |
| 35 to 64 Years | 98 (31.5%) | 63 (26.1%) |
| 65 to 74 Years | 17 (36.2%) | 23 (25.3%) |
| 75 Years and over | 9 (21.4%) | 28 (73.7%) |
Disability Class by Sex by Age in Appalachia
Disability Class: Hearing Difficulty
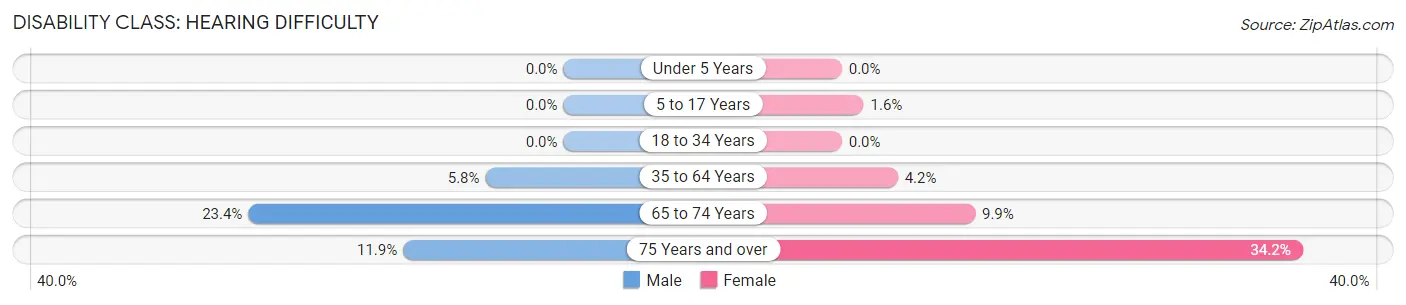
| Age Bracket | Male | Female |
| Under 5 Years | 0 (0.0%) | 0 (0.0%) |
| 5 to 17 Years | 0 (0.0%) | 3 (1.6%) |
| 18 to 34 Years | 0 (0.0%) | 0 (0.0%) |
| 35 to 64 Years | 18 (5.8%) | 10 (4.2%) |
| 65 to 74 Years | 11 (23.4%) | 9 (9.9%) |
| 75 Years and over | 5 (11.9%) | 13 (34.2%) |
Disability Class: Vision Difficulty
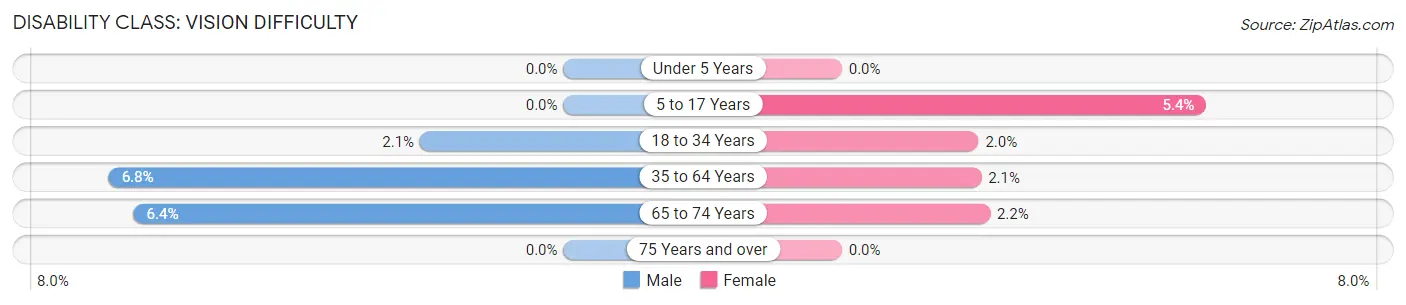
| Age Bracket | Male | Female |
| Under 5 Years | 0 (0.0%) | 0 (0.0%) |
| 5 to 17 Years | 0 (0.0%) | 10 (5.4%) |
| 18 to 34 Years | 3 (2.1%) | 4 (2.0%) |
| 35 to 64 Years | 21 (6.8%) | 5 (2.1%) |
| 65 to 74 Years | 3 (6.4%) | 2 (2.2%) |
| 75 Years and over | 0 (0.0%) | 0 (0.0%) |
Disability Class: Cognitive Difficulty
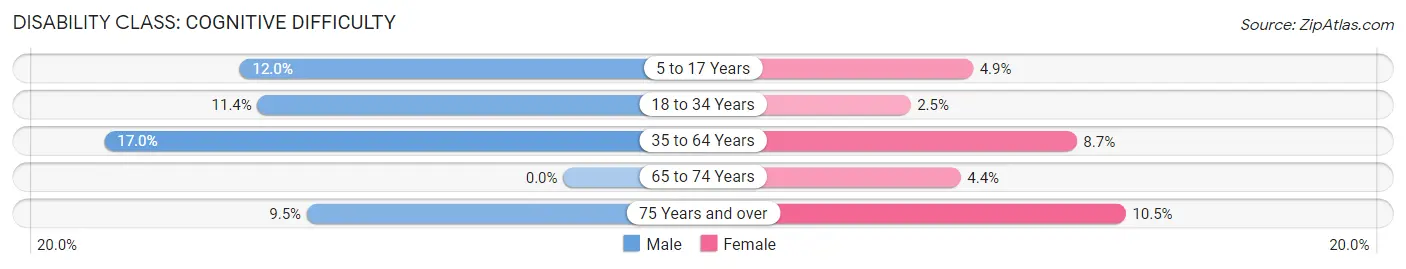
| Age Bracket | Male | Female |
| 5 to 17 Years | 22 (12.0%) | 9 (4.9%) |
| 18 to 34 Years | 16 (11.4%) | 5 (2.5%) |
| 35 to 64 Years | 53 (17.0%) | 21 (8.7%) |
| 65 to 74 Years | 0 (0.0%) | 4 (4.4%) |
| 75 Years and over | 4 (9.5%) | 4 (10.5%) |
Disability Class: Ambulatory Difficulty
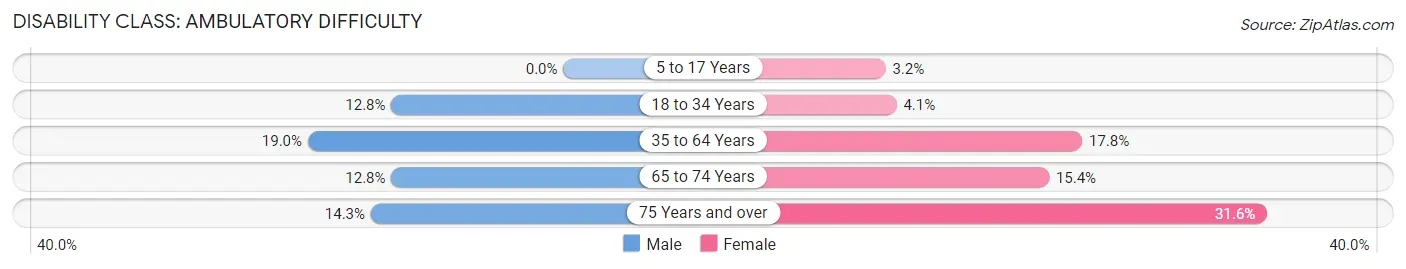
| Age Bracket | Male | Female |
| 5 to 17 Years | 0 (0.0%) | 6 (3.2%) |
| 18 to 34 Years | 18 (12.8%) | 8 (4.1%) |
| 35 to 64 Years | 59 (19.0%) | 43 (17.8%) |
| 65 to 74 Years | 6 (12.8%) | 14 (15.4%) |
| 75 Years and over | 6 (14.3%) | 12 (31.6%) |
Disability Class: Self-Care Difficulty
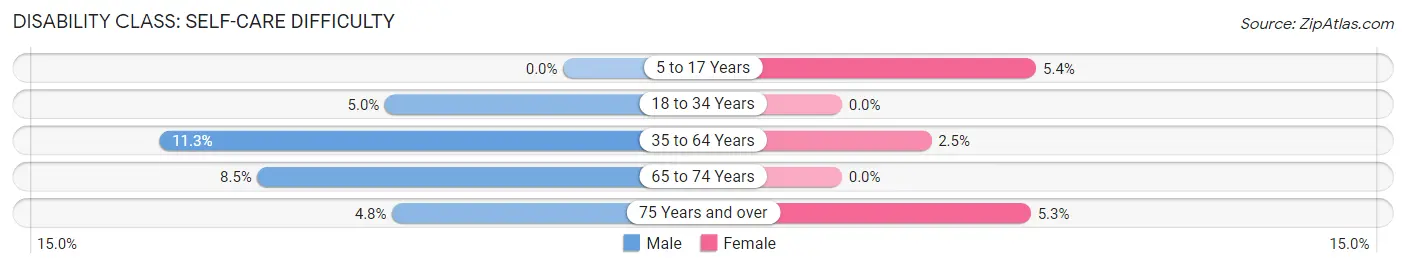
| Age Bracket | Male | Female |
| 5 to 17 Years | 0 (0.0%) | 10 (5.4%) |
| 18 to 34 Years | 7 (5.0%) | 0 (0.0%) |
| 35 to 64 Years | 35 (11.3%) | 6 (2.5%) |
| 65 to 74 Years | 4 (8.5%) | 0 (0.0%) |
| 75 Years and over | 2 (4.8%) | 2 (5.3%) |
Technology Access in Appalachia
Computing Device Access in Appalachia

| Device Type | # Households | % Households |
| Desktop or Laptop | 345 | 55.4% |
| Smartphone | 473 | 75.9% |
| Tablet | 346 | 55.5% |
| No Computing Device | 79 | 12.7% |
| Total | 623 | 100.0% |
Internet Access in Appalachia
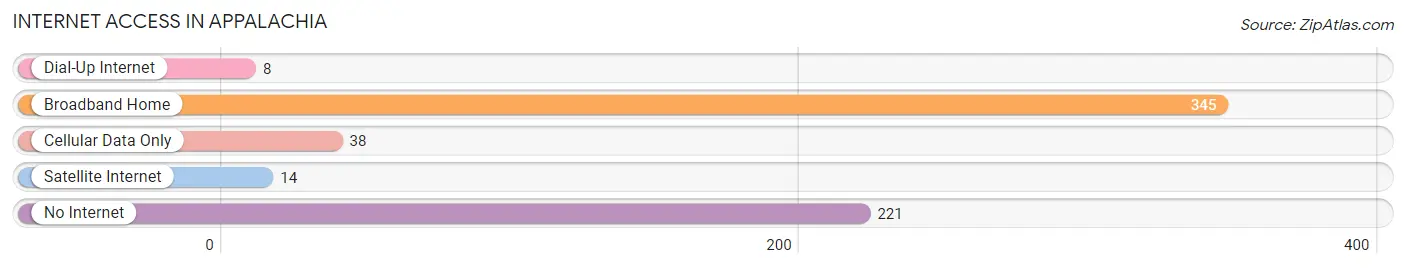
| Internet Type | # Households | % Households |
| Dial-Up Internet | 8 | 1.3% |
| Broadband Home | 345 | 55.4% |
| Cellular Data Only | 38 | 6.1% |
| Satellite Internet | 14 | 2.2% |
| No Internet | 221 | 35.5% |
| Total | 623 | 100.0% |
Appalachia Summary
Appalachia is a region located in the eastern United States, stretching from the southern tip of New York to northern Alabama and Mississippi. It is a culturally and geographically distinct region, with a unique history, geography, economy, and demographics.
History
The history of Appalachia is a long and complex one, stretching back to the earliest days of European settlement in the region. The first Europeans to settle in the region were the Scots-Irish, who arrived in the late 17th century. They were followed by German and English settlers in the 18th century, and by African Americans in the 19th century. The region was also home to a number of Native American tribes, including the Cherokee, Chickasaw, and Choctaw.
The region was heavily impacted by the American Civil War, with many battles taking place in the region. After the war, the region experienced a period of economic decline, as the coal and timber industries declined. This led to a period of poverty and hardship for many of the region’s residents.
In the 20th century, the region experienced a period of economic growth, as the coal and timber industries began to rebound. This led to an influx of new residents, as well as an increase in tourism.
Geography
Appalachia is a region of rugged mountains and valleys, with a variety of terrain ranging from rolling hills to steep mountains. The region is home to a number of rivers, including the Ohio, Tennessee, and Potomac. The region is also home to a number of national parks, including the Great Smoky Mountains National Park and the Shenandoah National Park.
The climate of Appalachia is generally temperate, with warm summers and cold winters. The region receives an average of 40 inches of rain per year, and is prone to occasional flooding.
Economy
The economy of Appalachia is largely based on natural resources, such as coal, timber, and natural gas. The region is also home to a number of manufacturing industries, including furniture, textiles, and automotive parts. Tourism is also an important part of the region’s economy, with a number of popular attractions, such as the Great Smoky Mountains National Park and the Shenandoah National Park.
Demographics
Appalachia is home to a diverse population, with a variety of ethnic and racial backgrounds. The region is predominantly white, with African Americans making up the largest minority group. The region is also home to a number of Native American tribes, including the Cherokee, Chickasaw, and Choctaw.
The population of Appalachia is largely rural, with a number of small towns and villages scattered throughout the region. The largest cities in the region are Knoxville, Tennessee; Charleston, West Virginia; and Asheville, North Carolina.
Appalachia is a unique region, with a long and complex history, diverse geography, and a variety of economic and demographic characteristics. The region has experienced a period of economic growth in recent years, and is home to a number of popular tourist attractions. The region is also home to a diverse population, with a variety of ethnic and racial backgrounds.
Common Questions
What is Per Capita Income in Appalachia?
Per Capita income in Appalachia is $16,659.
What is the Median Family Income in Appalachia?
Median Family Income in Appalachia is $39,306.
What is the Median Household income in Appalachia?
Median Household Income in Appalachia is $34,896.
What is Income or Wage Gap in Appalachia?
Income or Wage Gap in Appalachia is 57.6%.
Women in Appalachia earn 42.4 cents for every dollar earned by a man.
What is Inequality or Gini Index in Appalachia?
Inequality or Gini Index in Appalachia is 0.46.
What is the Total Population of Appalachia?
Total Population of Appalachia is 1,585.
What is the Total Male Population of Appalachia?
Total Male Population of Appalachia is 773.
What is the Total Female Population of Appalachia?
Total Female Population of Appalachia is 812.
What is the Ratio of Males per 100 Females in Appalachia?
There are 95.20 Males per 100 Females in Appalachia.
What is the Ratio of Females per 100 Males in Appalachia?
There are 105.05 Females per 100 Males in Appalachia.
What is the Median Population Age in Appalachia?
Median Population Age in Appalachia is 32.4 Years.
What is the Average Family Size in Appalachia
Average Family Size in Appalachia is 3.2 People.
What is the Average Household Size in Appalachia
Average Household Size in Appalachia is 2.5 People.
How Large is the Labor Force in Appalachia?
There are 568 People in the Labor Forcein in Appalachia.
What is the Percentage of People in the Labor Force in Appalachia?
48.4% of People are in the Labor Force in Appalachia.
What is the Unemployment Rate in Appalachia?
Unemployment Rate in Appalachia is 10.2%.