Accomac, VA Map & Demographics
Accomac Map
Accomac Overview
$19,560
PER CAPITA INCOME
$48,750
AVG FAMILY INCOME
$41,304
AVG HOUSEHOLD INCOME
28.4%
WAGE / INCOME GAP [ % ]
71.6¢/ $1
WAGE / INCOME GAP [ $ ]
0.38
INEQUALITY / GINI INDEX
981
TOTAL POPULATION
420
MALE POPULATION
561
FEMALE POPULATION
74.87
MALES / 100 FEMALES
133.57
FEMALES / 100 MALES
30.9
MEDIAN AGE
4.5
AVG FAMILY SIZE
2.9
AVG HOUSEHOLD SIZE
363
LABOR FORCE [ PEOPLE ]
53.1%
PERCENT IN LABOR FORCE
1.9%
UNEMPLOYMENT RATE
Accomac Zip Codes
Accomac Area Codes
Income in Accomac
Income Overview in Accomac
Per Capita Income in Accomac is $19,560, while median incomes of families and households are $48,750 and $41,304 respectively.
| Characteristic | Number | Measure |
| Per Capita Income | 981 | $19,560 |
| Median Family Income | 160 | $48,750 |
| Mean Family Income | 160 | $70,219 |
| Median Household Income | 304 | $41,304 |
| Mean Household Income | 304 | $57,193 |
| Income Deficit | 160 | $0 |
| Wage / Income Gap (%) | 981 | 28.43% |
| Wage / Income Gap ($) | 981 | 71.57¢ per $1 |
| Gini / Inequality Index | 981 | 0.38 |
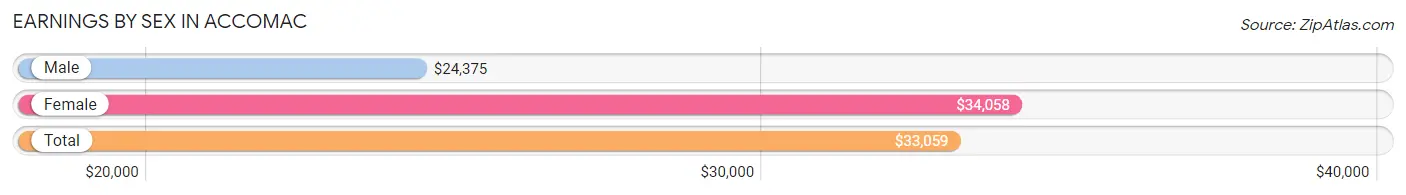
Earnings by Sex in Accomac
Average Earnings in Accomac are $33,059, $24,375 for men and $34,058 for women, a difference of 28.4%.
| Sex | Number | Average Earnings |
| Male | 219 (51.4%) | $24,375 |
| Female | 207 (48.6%) | $34,058 |
| Total | 426 (100.0%) | $33,059 |
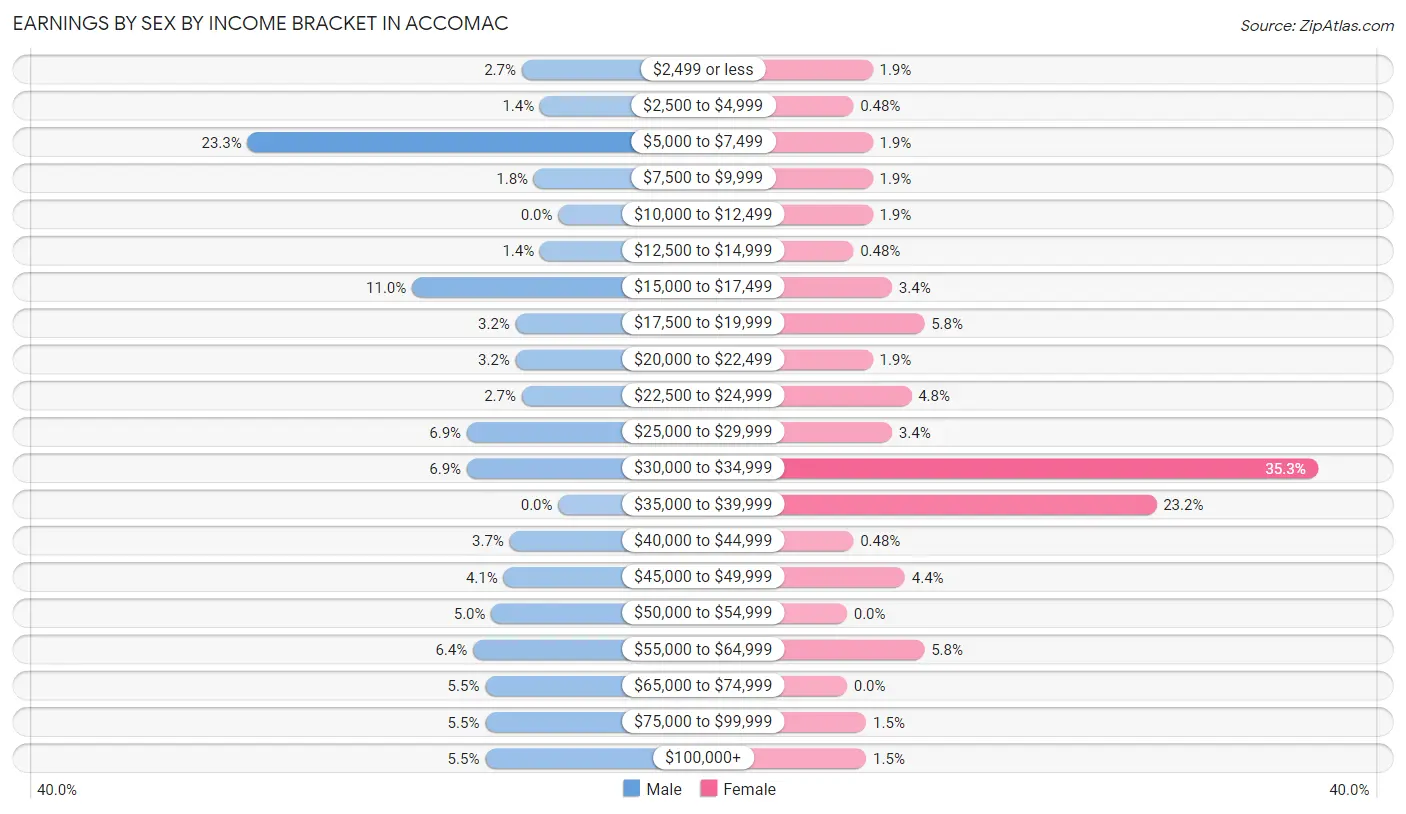
Earnings by Sex by Income Bracket in Accomac
The most common earnings brackets in Accomac are $5,000 to $7,499 for men (51 | 23.3%) and $30,000 to $34,999 for women (73 | 35.3%).
| Income | Male | Female |
| $2,499 or less | 6 (2.7%) | 4 (1.9%) |
| $2,500 to $4,999 | 3 (1.4%) | 1 (0.5%) |
| $5,000 to $7,499 | 51 (23.3%) | 4 (1.9%) |
| $7,500 to $9,999 | 4 (1.8%) | 4 (1.9%) |
| $10,000 to $12,499 | 0 (0.0%) | 4 (1.9%) |
| $12,500 to $14,999 | 3 (1.4%) | 1 (0.5%) |
| $15,000 to $17,499 | 24 (11.0%) | 7 (3.4%) |
| $17,500 to $19,999 | 7 (3.2%) | 12 (5.8%) |
| $20,000 to $22,499 | 7 (3.2%) | 4 (1.9%) |
| $22,500 to $24,999 | 6 (2.7%) | 10 (4.8%) |
| $25,000 to $29,999 | 15 (6.9%) | 7 (3.4%) |
| $30,000 to $34,999 | 15 (6.9%) | 73 (35.3%) |
| $35,000 to $39,999 | 0 (0.0%) | 48 (23.2%) |
| $40,000 to $44,999 | 8 (3.6%) | 1 (0.5%) |
| $45,000 to $49,999 | 9 (4.1%) | 9 (4.3%) |
| $50,000 to $54,999 | 11 (5.0%) | 0 (0.0%) |
| $55,000 to $64,999 | 14 (6.4%) | 12 (5.8%) |
| $65,000 to $74,999 | 12 (5.5%) | 0 (0.0%) |
| $75,000 to $99,999 | 12 (5.5%) | 3 (1.5%) |
| $100,000+ | 12 (5.5%) | 3 (1.5%) |
| Total | 219 (100.0%) | 207 (100.0%) |
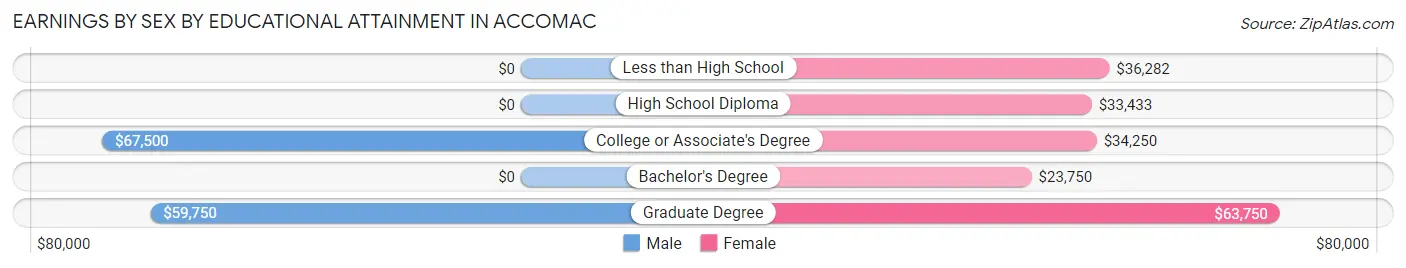
Earnings by Sex by Educational Attainment in Accomac
Average earnings in Accomac are $23,542 for men and $34,161 for women, a difference of 31.1%. Men with an educational attainment of college or associate's degree enjoy the highest average annual earnings of $67,500, while those with graduate degree education earn the least with $59,750. Women with an educational attainment of graduate degree earn the most with the average annual earnings of $63,750, while those with bachelor's degree education have the smallest earnings of $23,750.
| Educational Attainment | Male Income | Female Income |
| Less than High School | - | - |
| High School Diploma | - | - |
| College or Associate's Degree | $67,500 | $34,250 |
| Bachelor's Degree | - | - |
| Graduate Degree | $59,750 | $63,750 |
| Total | $23,542 | $34,161 |
Family Income in Accomac
Family Income Brackets in Accomac
According to the Accomac family income data, there are 59 families falling into the $35,000 to $49,999 income range, which is the most common income bracket and makes up 36.9% of all families.
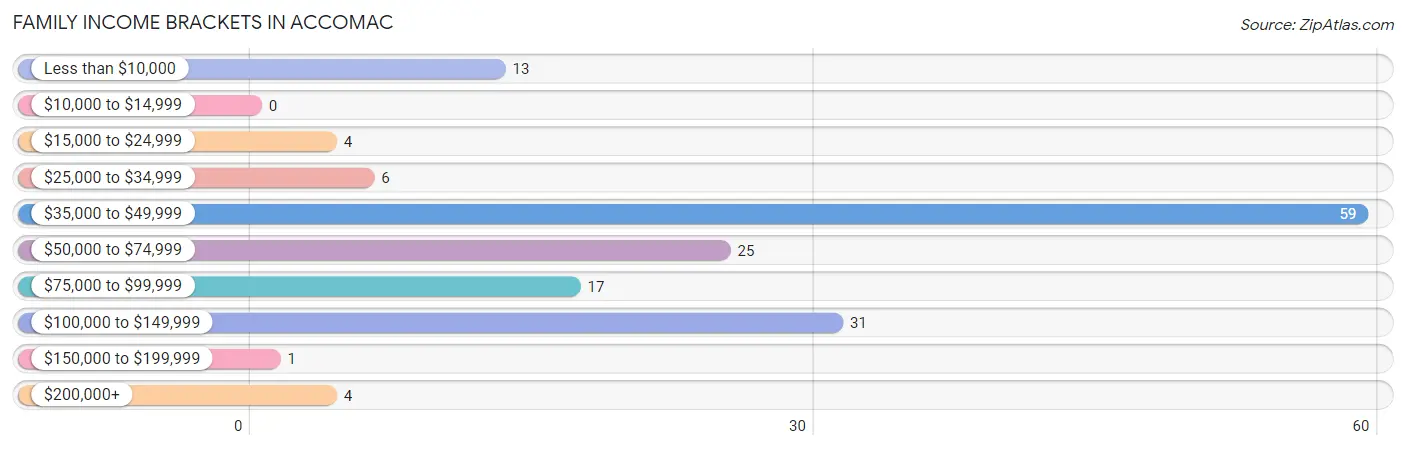
| Income Bracket | # Families | % Families |
| Less than $10,000 | 13 | 8.1% |
| $10,000 to $14,999 | 0 | 0.0% |
| $15,000 to $24,999 | 4 | 2.5% |
| $25,000 to $34,999 | 6 | 3.8% |
| $35,000 to $49,999 | 59 | 36.9% |
| $50,000 to $74,999 | 25 | 15.6% |
| $75,000 to $99,999 | 17 | 10.6% |
| $100,000 to $149,999 | 31 | 19.4% |
| $150,000 to $199,999 | 1 | 0.6% |
| $200,000+ | 4 | 2.5% |
Family Income by Famaliy Size in Accomac
4-person families (7 | 4.4%) account for the highest median family income in Accomac with $106,250 per family, while 2-person families (48 | 30.0%) have the highest median income of $44,219 per family member.
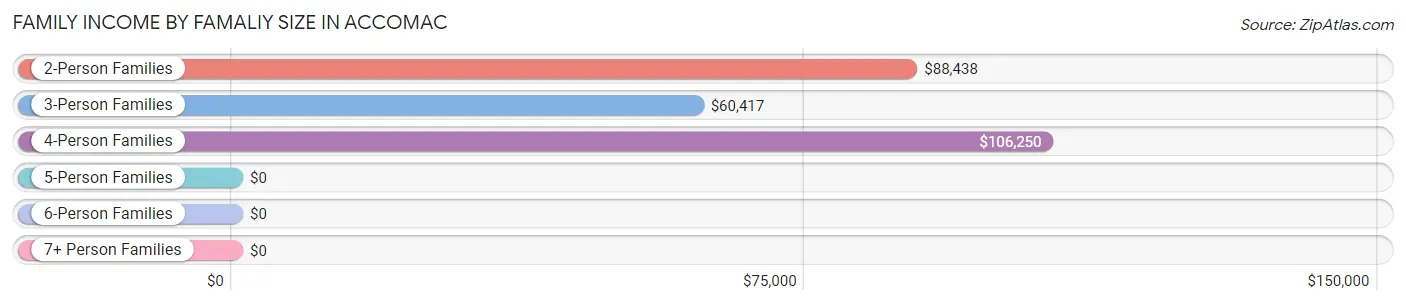
| Income Bracket | # Families | Median Income |
| 2-Person Families | 48 (30.0%) | $88,438 |
| 3-Person Families | 44 (27.5%) | $60,417 |
| 4-Person Families | 7 (4.4%) | $106,250 |
| 5-Person Families | 16 (10.0%) | $0 |
| 6-Person Families | 39 (24.4%) | $0 |
| 7+ Person Families | 6 (3.7%) | $0 |
| Total | 160 (100.0%) | $48,750 |
Family Income by Number of Earners in Accomac
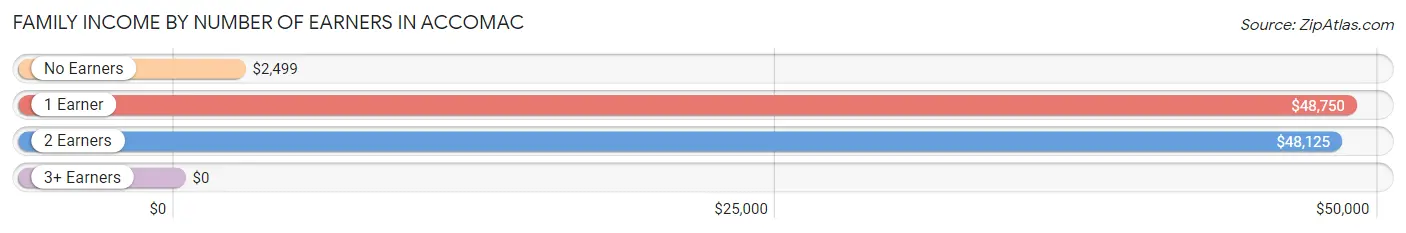
| Number of Earners | # Families | Median Income |
| No Earners | 21 (13.1%) | $2,499 |
| 1 Earner | 40 (25.0%) | $48,750 |
| 2 Earners | 92 (57.5%) | $48,125 |
| 3+ Earners | 7 (4.4%) | $0 |
| Total | 160 (100.0%) | $48,750 |
Household Income in Accomac
Household Income Brackets in Accomac
With 83 households falling in the category, the $25,000 to $34,999 income range is the most frequent in Accomac, accounting for 27.3% of all households. In contrast, only 1 households (0.3%) fall into the $150,000 to $199,999 income bracket, making it the least populous group.
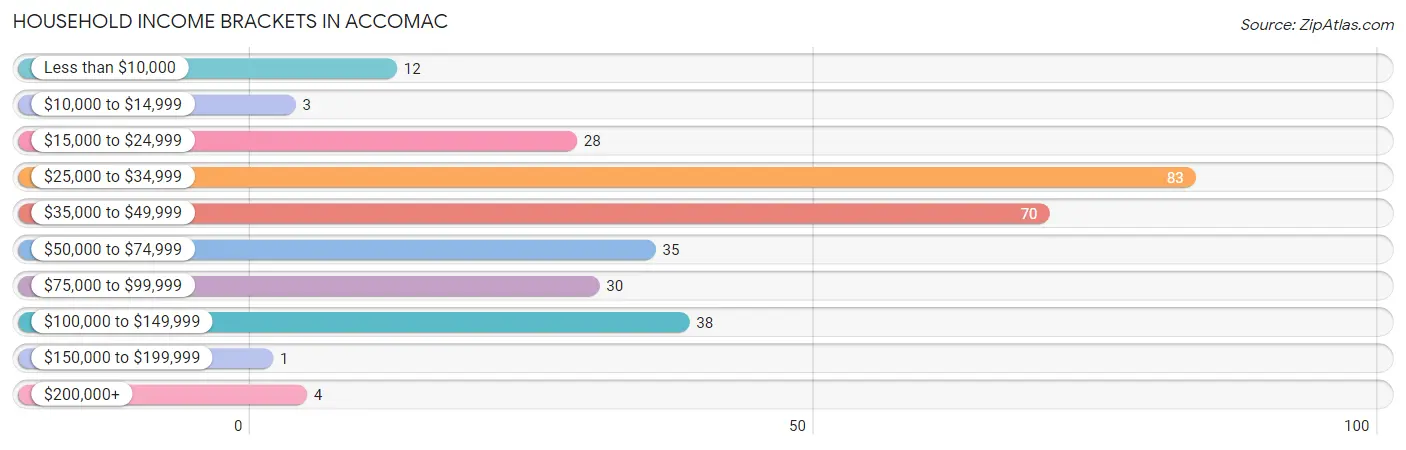
| Income Bracket | # Households | % Households |
| Less than $10,000 | 12 | 3.9% |
| $10,000 to $14,999 | 3 | 1.0% |
| $15,000 to $24,999 | 28 | 9.2% |
| $25,000 to $34,999 | 83 | 27.3% |
| $35,000 to $49,999 | 70 | 23.0% |
| $50,000 to $74,999 | 35 | 11.5% |
| $75,000 to $99,999 | 30 | 9.9% |
| $100,000 to $149,999 | 38 | 12.5% |
| $150,000 to $199,999 | 1 | 0.3% |
| $200,000+ | 4 | 1.3% |
Household Income by Householder Age in Accomac
The median household income in Accomac is $41,304, with the highest median household income of $53,750 found in the 65+ years age bracket for the primary householder. A total of 73 households (24.0%) fall into this category.
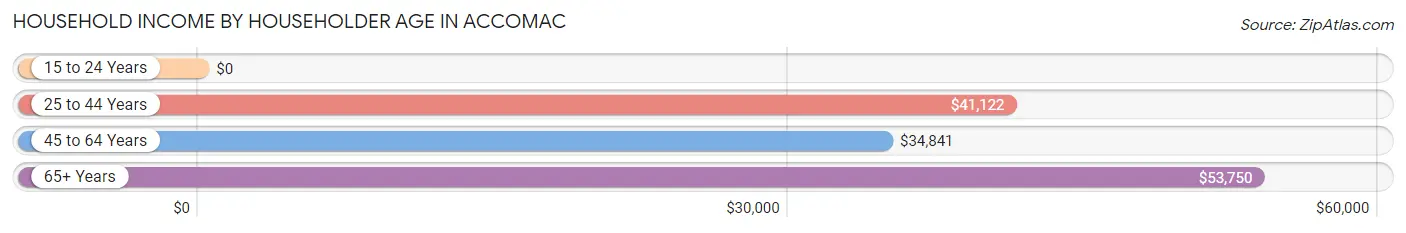
| Income Bracket | # Households | Median Income |
| 15 to 24 Years | 0 (0.0%) | $0 |
| 25 to 44 Years | 97 (31.9%) | $41,122 |
| 45 to 64 Years | 134 (44.1%) | $34,841 |
| 65+ Years | 73 (24.0%) | $53,750 |
| Total | 304 (100.0%) | $41,304 |
Poverty in Accomac
Income Below Poverty by Sex and Age in Accomac
With 24.3% poverty level for males and 4.7% for females among the residents of Accomac, under 5 year old males and 18 to 24 year old females are the most vulnerable to poverty, with 41 males (95.4%) and 1 females (33.3%) in their respective age groups living below the poverty level.
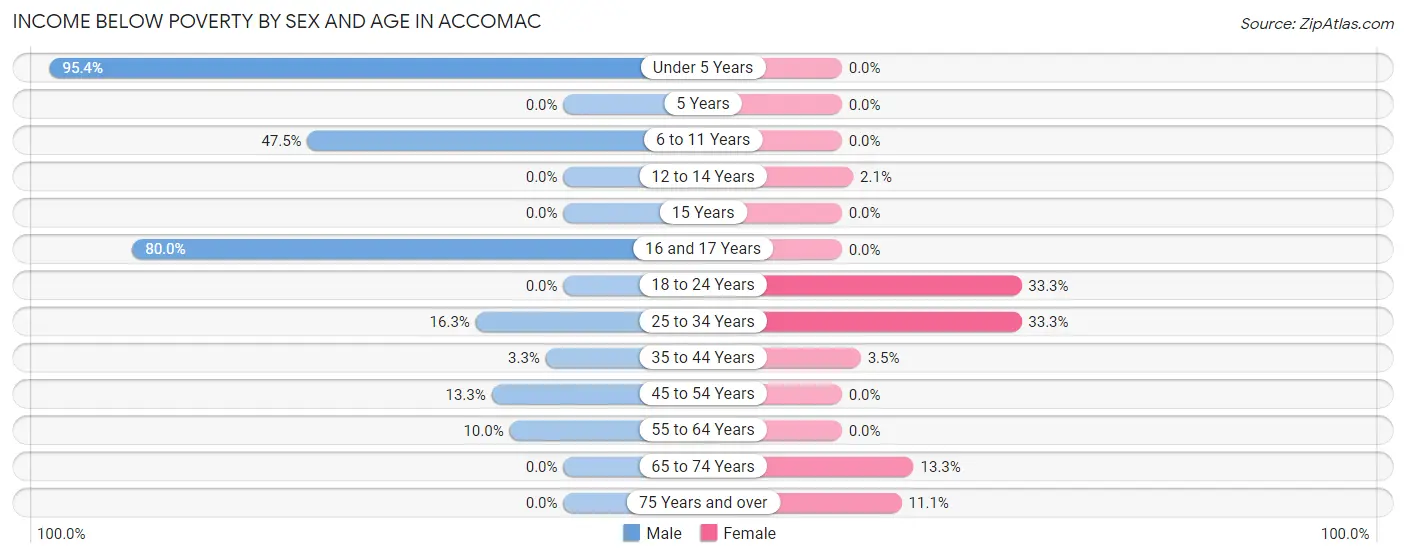
| Age Bracket | Male | Female |
| Under 5 Years | 41 (95.4%) | 0 (0.0%) |
| 5 Years | 0 (0.0%) | 0 (0.0%) |
| 6 to 11 Years | 19 (47.5%) | 0 (0.0%) |
| 12 to 14 Years | 0 (0.0%) | 2 (2.1%) |
| 15 Years | 0 (0.0%) | 0 (0.0%) |
| 16 and 17 Years | 4 (80.0%) | 0 (0.0%) |
| 18 to 24 Years | 0 (0.0%) | 1 (33.3%) |
| 25 to 34 Years | 7 (16.3%) | 15 (33.3%) |
| 35 to 44 Years | 2 (3.3%) | 2 (3.5%) |
| 45 to 54 Years | 4 (13.3%) | 0 (0.0%) |
| 55 to 64 Years | 3 (10.0%) | 0 (0.0%) |
| 65 to 74 Years | 0 (0.0%) | 4 (13.3%) |
| 75 Years and over | 0 (0.0%) | 2 (11.1%) |
| Total | 80 (24.3%) | 26 (4.7%) |
Income Above Poverty by Sex and Age in Accomac
According to the poverty statistics in Accomac, males aged 5 years and females aged under 5 years are the age groups that are most secure financially, with 100.0% of males and 100.0% of females in these age groups living above the poverty line.
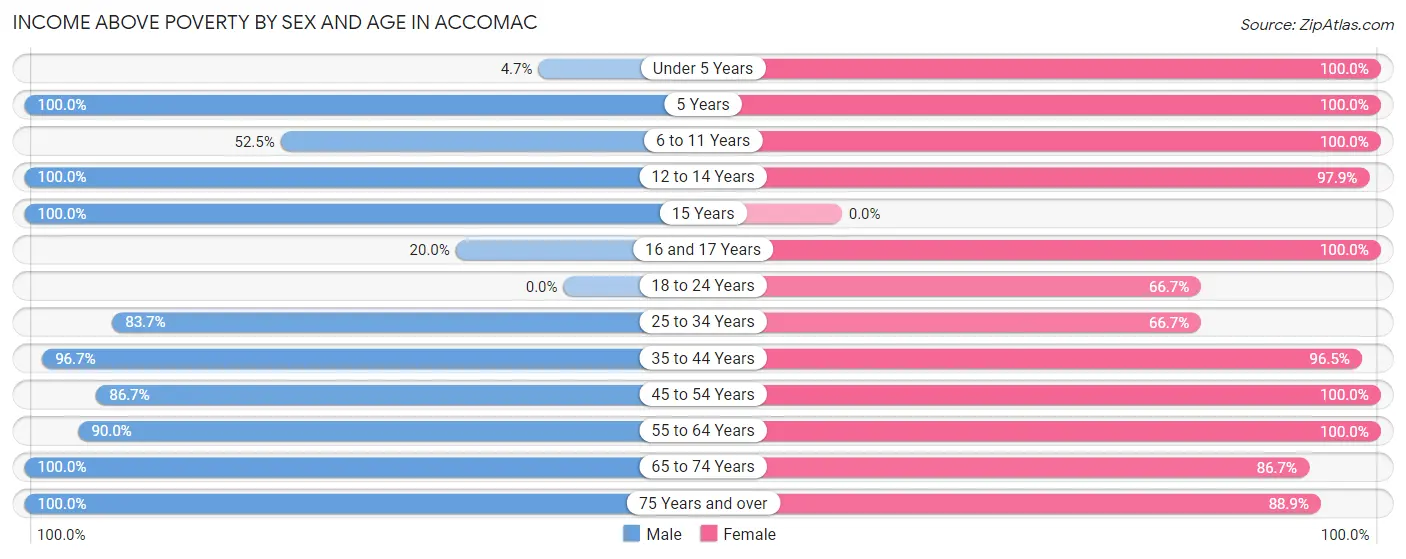
| Age Bracket | Male | Female |
| Under 5 Years | 2 (4.6%) | 19 (100.0%) |
| 5 Years | 9 (100.0%) | 8 (100.0%) |
| 6 to 11 Years | 21 (52.5%) | 66 (100.0%) |
| 12 to 14 Years | 9 (100.0%) | 93 (97.9%) |
| 15 Years | 9 (100.0%) | 0 (0.0%) |
| 16 and 17 Years | 1 (20.0%) | 89 (100.0%) |
| 18 to 24 Years | 0 (0.0%) | 2 (66.7%) |
| 25 to 34 Years | 36 (83.7%) | 30 (66.7%) |
| 35 to 44 Years | 59 (96.7%) | 55 (96.5%) |
| 45 to 54 Years | 26 (86.7%) | 91 (100.0%) |
| 55 to 64 Years | 27 (90.0%) | 37 (100.0%) |
| 65 to 74 Years | 29 (100.0%) | 26 (86.7%) |
| 75 Years and over | 21 (100.0%) | 16 (88.9%) |
| Total | 249 (75.7%) | 532 (95.3%) |
Income Below Poverty Among Married-Couple Families in Accomac
The poverty statistics for married-couple families in Accomac show that 3.0% or 4 of the total 132 families live below the poverty line. Families with 1 or 2 children have the highest poverty rate of 10.5%, comprising of 4 families. On the other hand, families with no children have the lowest poverty rate of 0.0%, which includes 0 families.
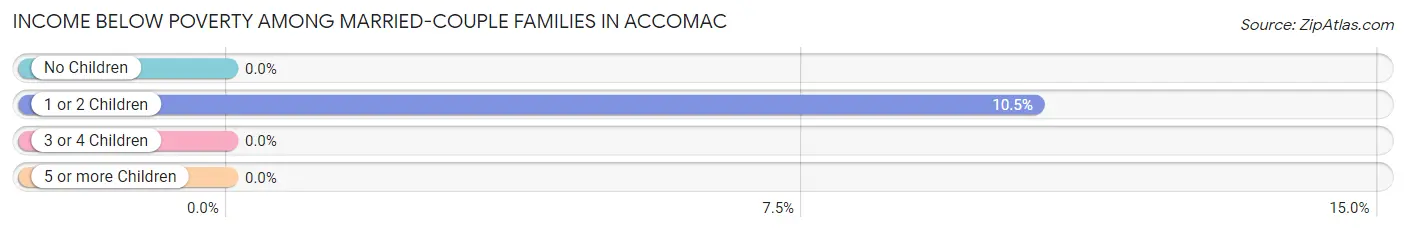
| Children | Above Poverty | Below Poverty |
| No Children | 43 (100.0%) | 0 (0.0%) |
| 1 or 2 Children | 34 (89.5%) | 4 (10.5%) |
| 3 or 4 Children | 45 (100.0%) | 0 (0.0%) |
| 5 or more Children | 6 (100.0%) | 0 (0.0%) |
| Total | 128 (97.0%) | 4 (3.0%) |
Income Below Poverty Among Single-Parent Households in Accomac
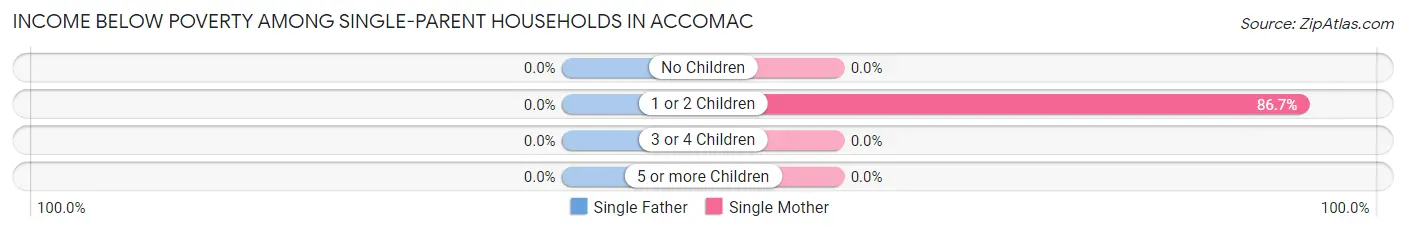
| Children | Single Father | Single Mother |
| No Children | 0 (0.0%) | 0 (0.0%) |
| 1 or 2 Children | 0 (0.0%) | 13 (86.7%) |
| 3 or 4 Children | 0 (0.0%) | 0 (0.0%) |
| 5 or more Children | 0 (0.0%) | 0 (0.0%) |
| Total | 0 (0.0%) | 13 (68.4%) |
Income Below Poverty Among Married-Couple vs Single-Parent Households in Accomac
The poverty data for Accomac shows that 4 of the married-couple family households (3.0%) and 13 of the single-parent households (46.4%) are living below the poverty level. Within the married-couple family households, those with 1 or 2 children have the highest poverty rate, with 4 households (10.5%) falling below the poverty line. Among the single-parent households, those with 1 or 2 children have the highest poverty rate, with 13 household (65.0%) living below poverty.
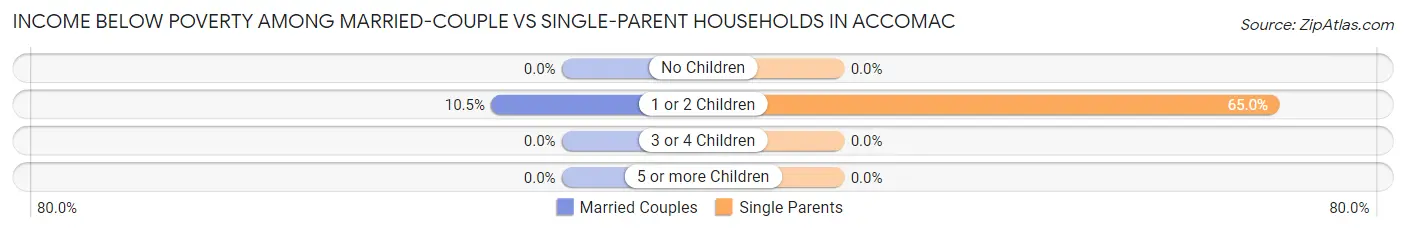
| Children | Married-Couple Families | Single-Parent Households |
| No Children | 0 (0.0%) | 0 (0.0%) |
| 1 or 2 Children | 4 (10.5%) | 13 (65.0%) |
| 3 or 4 Children | 0 (0.0%) | 0 (0.0%) |
| 5 or more Children | 0 (0.0%) | 0 (0.0%) |
| Total | 4 (3.0%) | 13 (46.4%) |
Race in Accomac
The most populous races in Accomac are Hispanic or Latino (390 | 39.8%), White / Caucasian (352 | 35.9%), and Two or more Races (335 | 34.2%).
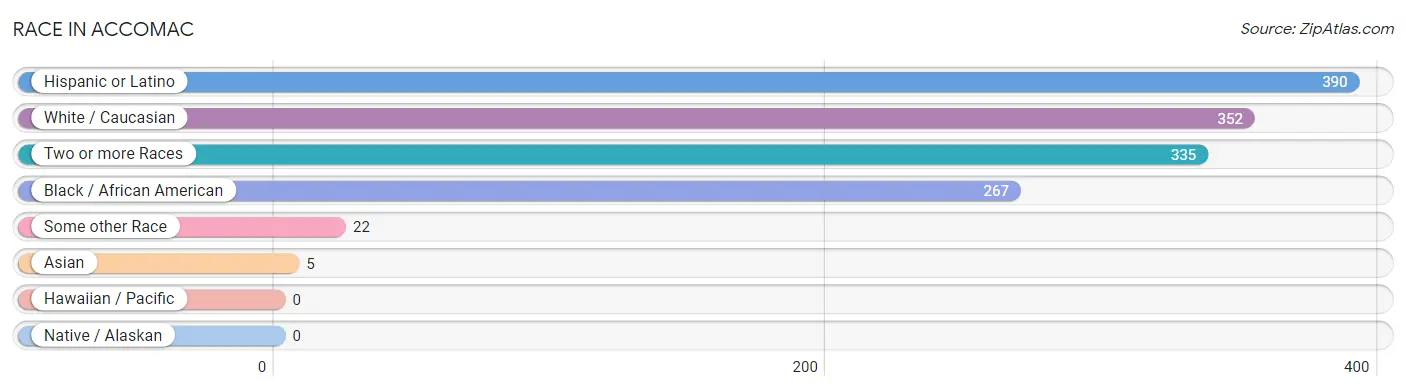
| Race | # Population | % Population |
| Asian | 5 | 0.5% |
| Black / African American | 267 | 27.2% |
| Hawaiian / Pacific | 0 | 0.0% |
| Hispanic or Latino | 390 | 39.8% |
| Native / Alaskan | 0 | 0.0% |
| White / Caucasian | 352 | 35.9% |
| Two or more Races | 335 | 34.2% |
| Some other Race | 22 | 2.2% |
| Total | 981 | 100.0% |
Ancestry in Accomac
The most populous ancestries reported in Accomac are American (515 | 52.5%), Central American (345 | 35.2%), Guatemalan (345 | 35.2%), English (44 | 4.5%), and Mexican (37 | 3.8%), together accounting for 131.1% of all Accomac residents.
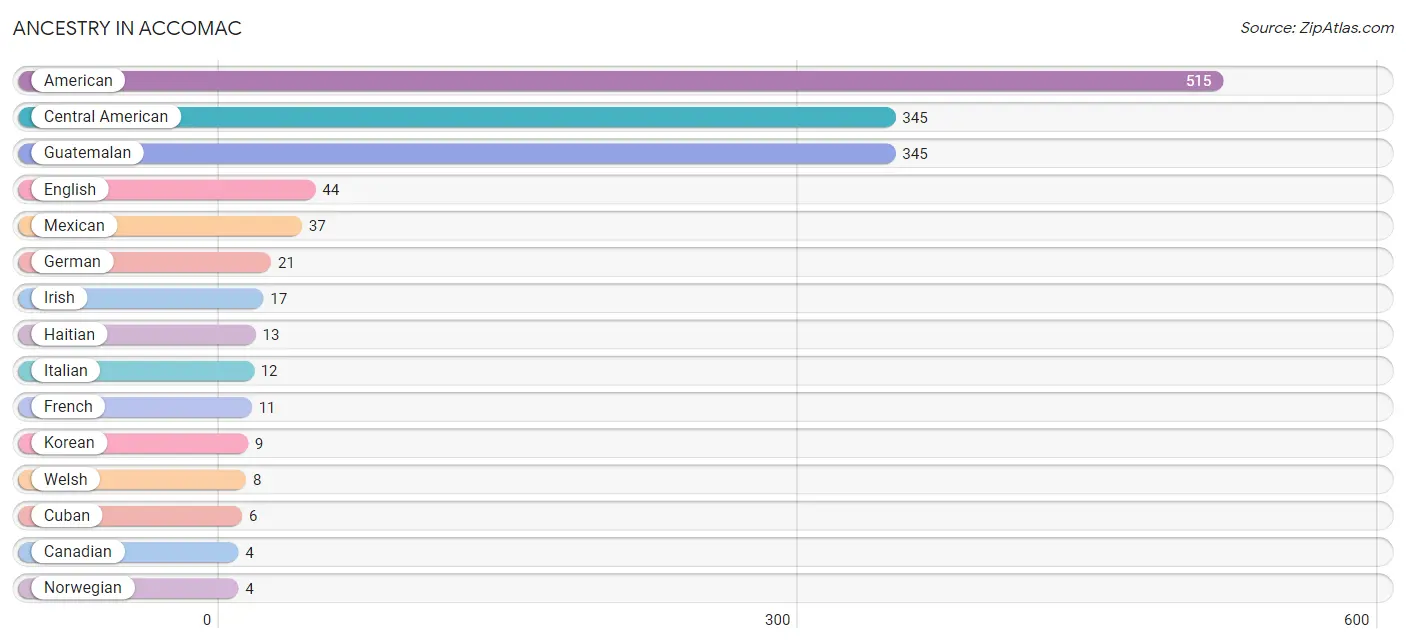
| Ancestry | # Population | % Population |
| American | 515 | 52.5% |
| British | 1 | 0.1% |
| Canadian | 4 | 0.4% |
| Central American | 345 | 35.2% |
| Cherokee | 1 | 0.1% |
| Cuban | 6 | 0.6% |
| Eastern European | 2 | 0.2% |
| English | 44 | 4.5% |
| European | 1 | 0.1% |
| French | 11 | 1.1% |
| German | 21 | 2.1% |
| Guatemalan | 345 | 35.2% |
| Haitian | 13 | 1.3% |
| Hungarian | 3 | 0.3% |
| Irish | 17 | 1.7% |
| Italian | 12 | 1.2% |
| Korean | 9 | 0.9% |
| Mexican | 37 | 3.8% |
| Norwegian | 4 | 0.4% |
| Polish | 4 | 0.4% |
| Puerto Rican | 2 | 0.2% |
| Scotch-Irish | 1 | 0.1% |
| Scottish | 3 | 0.3% |
| Welsh | 8 | 0.8% | View All 24 Rows |
Immigrants in Accomac
The most numerous immigrant groups reported in Accomac came from Latin America (208 | 21.2%), Central America (192 | 19.6%), Guatemala (188 | 19.2%), Asia (23 | 2.3%), and India (18 | 1.8%), together accounting for 64.1% of all Accomac residents.
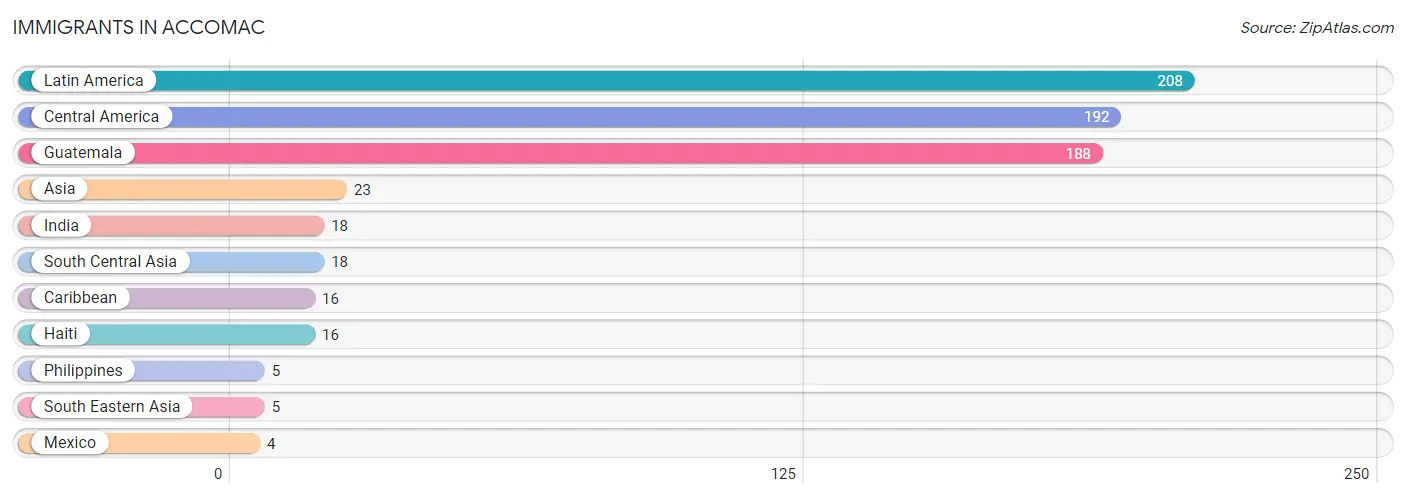
| Immigration Origin | # Population | % Population |
| Asia | 23 | 2.3% |
| Caribbean | 16 | 1.6% |
| Central America | 192 | 19.6% |
| Guatemala | 188 | 19.2% |
| Haiti | 16 | 1.6% |
| India | 18 | 1.8% |
| Latin America | 208 | 21.2% |
| Mexico | 4 | 0.4% |
| Philippines | 5 | 0.5% |
| South Central Asia | 18 | 1.8% |
| South Eastern Asia | 5 | 0.5% | View All 11 Rows |
Sex and Age in Accomac
Sex and Age in Accomac
The most populous age groups in Accomac are 40 to 44 Years (65 | 15.5%) for men and 10 to 14 Years (148 | 26.4%) for women.
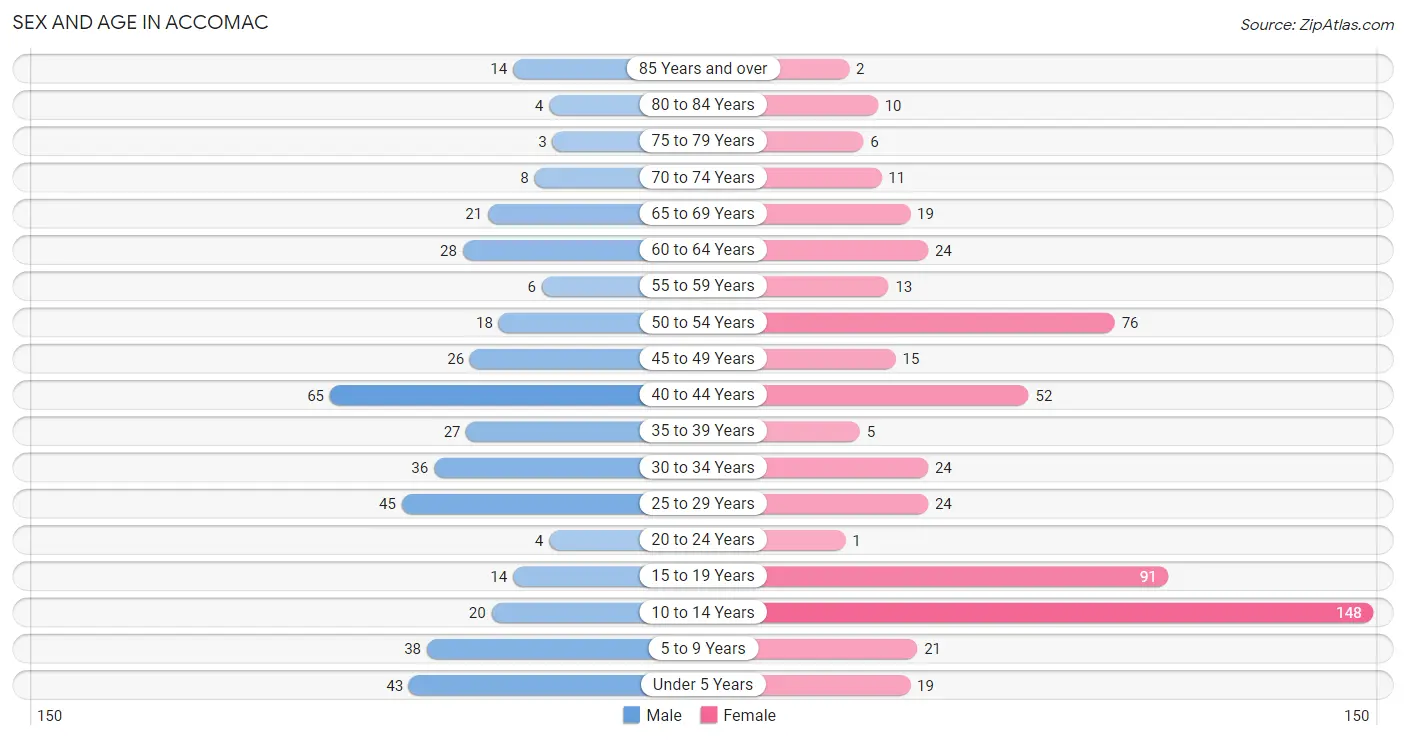
| Age Bracket | Male | Female |
| Under 5 Years | 43 (10.2%) | 19 (3.4%) |
| 5 to 9 Years | 38 (9.0%) | 21 (3.7%) |
| 10 to 14 Years | 20 (4.8%) | 148 (26.4%) |
| 15 to 19 Years | 14 (3.3%) | 91 (16.2%) |
| 20 to 24 Years | 4 (0.9%) | 1 (0.2%) |
| 25 to 29 Years | 45 (10.7%) | 24 (4.3%) |
| 30 to 34 Years | 36 (8.6%) | 24 (4.3%) |
| 35 to 39 Years | 27 (6.4%) | 5 (0.9%) |
| 40 to 44 Years | 65 (15.5%) | 52 (9.3%) |
| 45 to 49 Years | 26 (6.2%) | 15 (2.7%) |
| 50 to 54 Years | 18 (4.3%) | 76 (13.6%) |
| 55 to 59 Years | 6 (1.4%) | 13 (2.3%) |
| 60 to 64 Years | 28 (6.7%) | 24 (4.3%) |
| 65 to 69 Years | 21 (5.0%) | 19 (3.4%) |
| 70 to 74 Years | 8 (1.9%) | 11 (2.0%) |
| 75 to 79 Years | 3 (0.7%) | 6 (1.1%) |
| 80 to 84 Years | 4 (0.9%) | 10 (1.8%) |
| 85 Years and over | 14 (3.3%) | 2 (0.4%) |
| Total | 420 (100.0%) | 561 (100.0%) |
Families and Households in Accomac
Median Family Size in Accomac
The median family size in Accomac is 4.49 persons per family, with single female/mother families (19 | 11.9%) accounting for the largest median family size of 4.68 persons per family. On the other hand, single male/father families (9 | 5.6%) represent the smallest median family size with 2.22 persons per family.
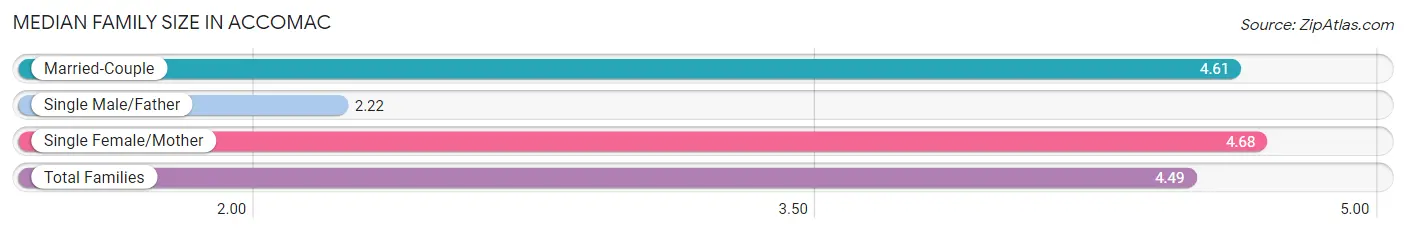
| Family Type | # Families | Family Size |
| Married-Couple | 132 (82.5%) | 4.61 |
| Single Male/Father | 9 (5.6%) | 2.22 |
| Single Female/Mother | 19 (11.9%) | 4.68 |
| Total Families | 160 (100.0%) | 4.49 |
Median Household Size in Accomac
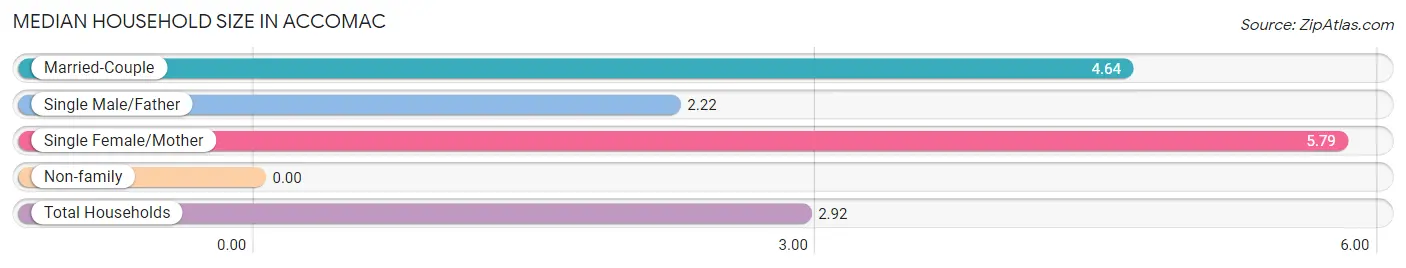
| Household Type | # Households | Household Size |
| Married-Couple | 132 (43.4%) | 4.64 |
| Single Male/Father | 9 (3.0%) | 2.22 |
| Single Female/Mother | 19 (6.2%) | 5.79 |
| Non-family | 144 (47.4%) | - |
| Total Households | 304 (100.0%) | 2.92 |
Household Size by Marriage Status in Accomac
Out of a total of 304 households in Accomac, 160 (52.6%) are family households, while 144 (47.4%) are nonfamily households. The most numerous type of family households are 2-person households, comprising 48, and the most common type of nonfamily households are 1-person households, comprising 144.
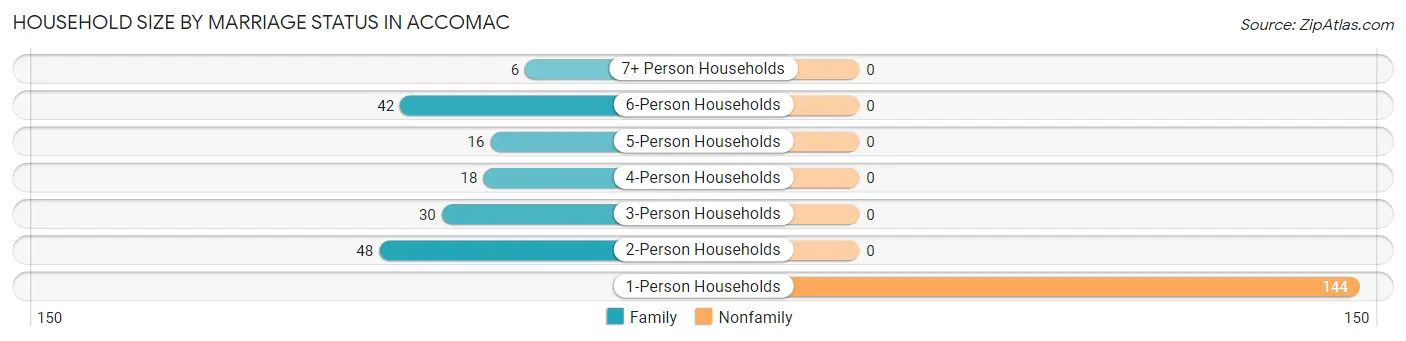
| Household Size | Family Households | Nonfamily Households |
| 1-Person Households | - | 144 (47.4%) |
| 2-Person Households | 48 (15.8%) | 0 (0.0%) |
| 3-Person Households | 30 (9.9%) | 0 (0.0%) |
| 4-Person Households | 18 (5.9%) | 0 (0.0%) |
| 5-Person Households | 16 (5.3%) | 0 (0.0%) |
| 6-Person Households | 42 (13.8%) | 0 (0.0%) |
| 7+ Person Households | 6 (2.0%) | 0 (0.0%) |
| Total | 160 (52.6%) | 144 (47.4%) |
Female Fertility in Accomac
Fertility by Age in Accomac
Average fertility rate in Accomac is 22.0 births per 1,000 women. Women in the age bracket of 20 to 34 years have the highest fertility rate with 102.0 births per 1,000 women. Women in the age bracket of 20 to 34 years acount for 100.0% of all women with births.
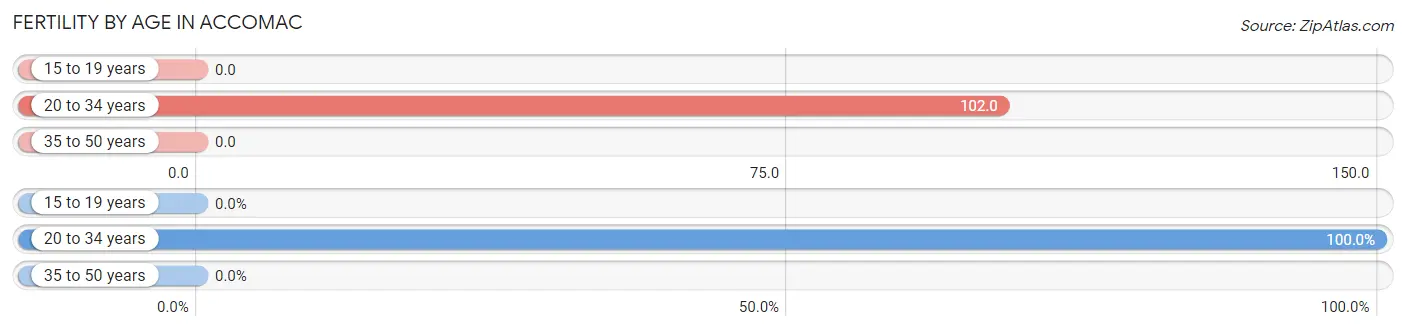
| Age Bracket | Women with Births | Births / 1,000 Women |
| 15 to 19 years | 0 (0.0%) | 0.0 |
| 20 to 34 years | 5 (100.0%) | 102.0 |
| 35 to 50 years | 0 (0.0%) | 0.0 |
| Total | 5 (100.0%) | 22.0 |
Fertility by Age by Marriage Status in Accomac
60.0% of women with births (5) in Accomac are married. The highest percentage of unmarried women with births falls into 20 to 34 years age bracket with 40.0% of them unmarried at the time of birth, while the lowest percentage of unmarried women with births belong to 20 to 34 years age bracket with 40.0% of them unmarried.
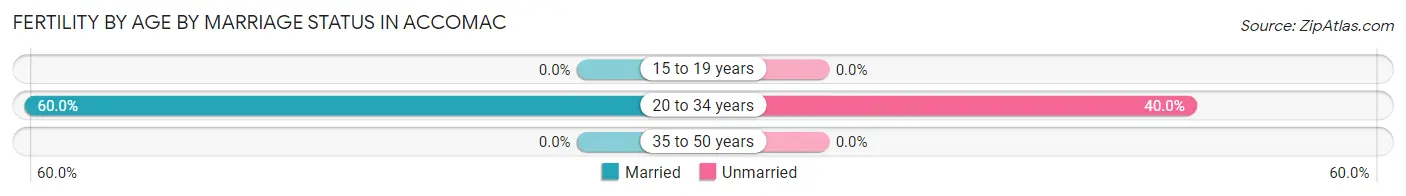
| Age Bracket | Married | Unmarried |
| 15 to 19 years | 0 (0.0%) | 0 (0.0%) |
| 20 to 34 years | 3 (60.0%) | 2 (40.0%) |
| 35 to 50 years | 0 (0.0%) | 0 (0.0%) |
| Total | 3 (60.0%) | 2 (40.0%) |
Fertility by Education in Accomac
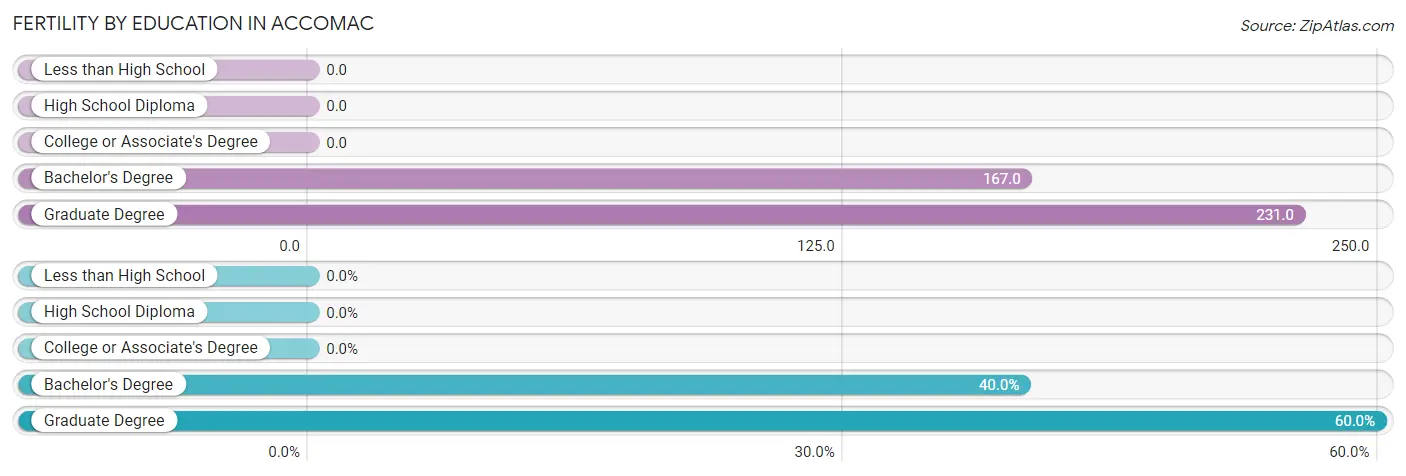
| Educational Attainment | Women with Births | Births / 1,000 Women |
| Less than High School | 0 (0.0%) | 0.0 |
| High School Diploma | 0 (0.0%) | 0.0 |
| College or Associate's Degree | 0 (0.0%) | 0.0 |
| Bachelor's Degree | 2 (40.0%) | 167.0 |
| Graduate Degree | 3 (60.0%) | 231.0 |
| Total | 5 (100.0%) | 22.0 |
Fertility by Education by Marriage Status in Accomac
40.0% of women with births in Accomac are unmarried. Women with the educational attainment of graduate degree are most likely to be married with 100.0% of them married at childbirth, while women with the educational attainment of bachelor's degree are least likely to be married with 100.0% of them unmarried at childbirth.
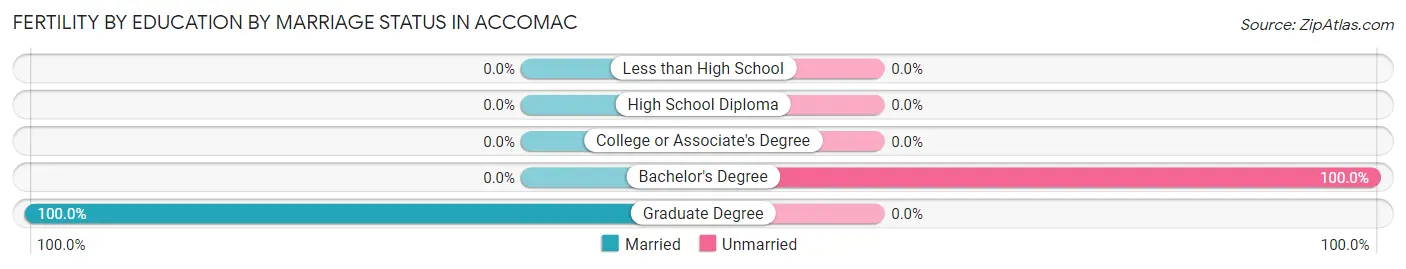
| Educational Attainment | Married | Unmarried |
| Less than High School | 0 (0.0%) | 0 (0.0%) |
| High School Diploma | 0 (0.0%) | 0 (0.0%) |
| College or Associate's Degree | 0 (0.0%) | 0 (0.0%) |
| Bachelor's Degree | 0 (0.0%) | 2 (100.0%) |
| Graduate Degree | 3 (100.0%) | 0 (0.0%) |
| Total | 3 (60.0%) | 2 (40.0%) |
Employment Characteristics in Accomac
Employment by Class of Employer in Accomac
Among the 355 employed individuals in Accomac, private company employees (271 | 76.3%), not-for-profit organizations (24 | 6.8%), and local government employees (23 | 6.5%) make up the most common classes of employment.
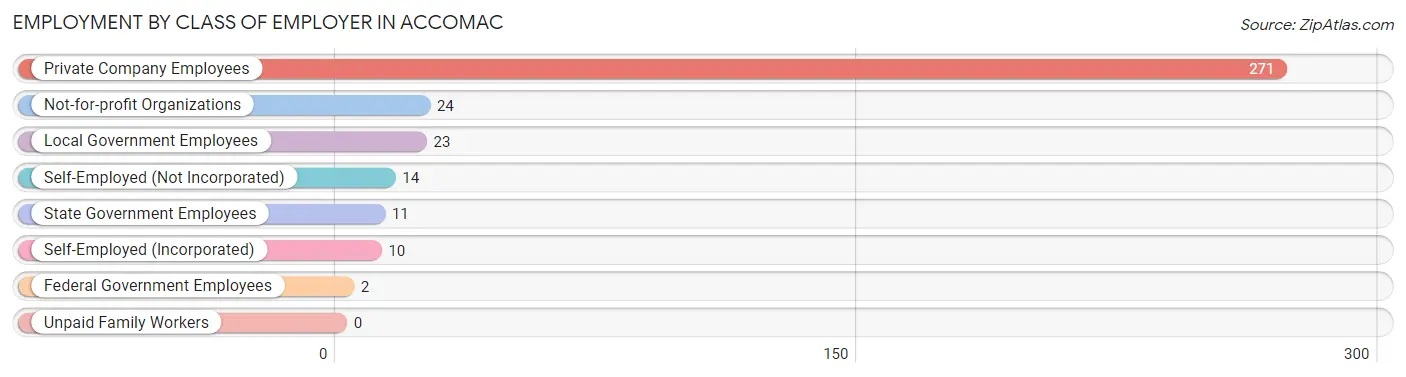
| Employer Class | # Employees | % Employees |
| Private Company Employees | 271 | 76.3% |
| Self-Employed (Incorporated) | 10 | 2.8% |
| Self-Employed (Not Incorporated) | 14 | 3.9% |
| Not-for-profit Organizations | 24 | 6.8% |
| Local Government Employees | 23 | 6.5% |
| State Government Employees | 11 | 3.1% |
| Federal Government Employees | 2 | 0.6% |
| Unpaid Family Workers | 0 | 0.0% |
| Total | 355 | 100.0% |
Employment Status by Age in Accomac
According to the labor force statistics for Accomac, out of the total population over 16 years of age (683), 53.1% or 363 individuals are in the labor force, with 1.9% or 7 of them unemployed. The age group with the highest labor force participation rate is 45 to 54 years, with 83.0% or 112 individuals in the labor force. Within the labor force, the 45 to 54 years age range has the highest percentage of unemployed individuals, with 6.3% or 7 of them being unemployed.
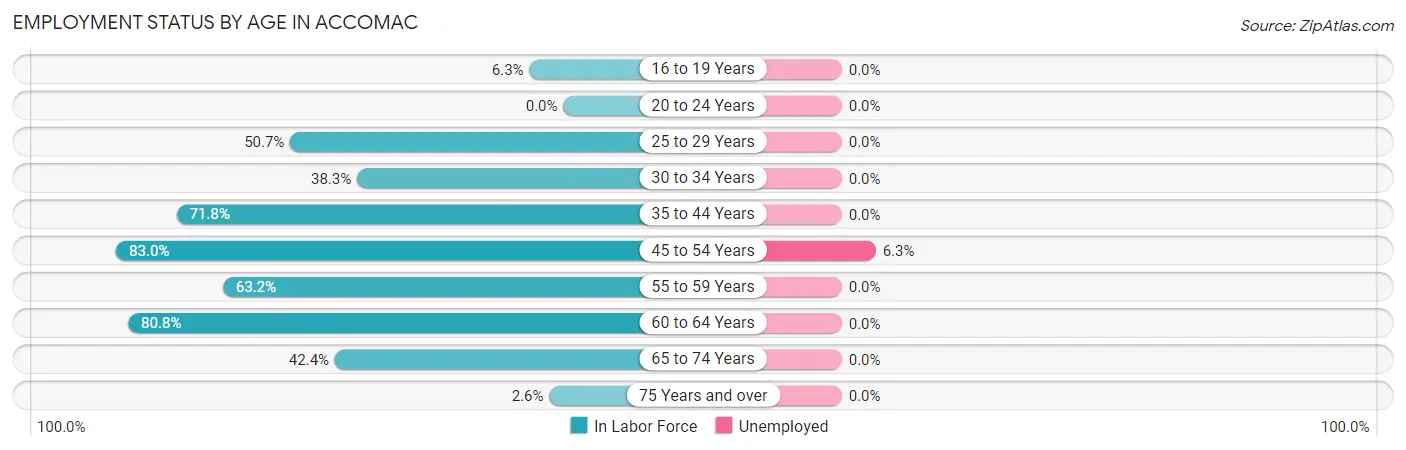
| Age Bracket | In Labor Force | Unemployed |
| 16 to 19 Years | 6 (6.3%) | 0 (0.0%) |
| 20 to 24 Years | 0 (0.0%) | 0 (0.0%) |
| 25 to 29 Years | 35 (50.7%) | 0 (0.0%) |
| 30 to 34 Years | 23 (38.3%) | 0 (0.0%) |
| 35 to 44 Years | 107 (71.8%) | 0 (0.0%) |
| 45 to 54 Years | 112 (83.0%) | 7 (6.3%) |
| 55 to 59 Years | 12 (63.2%) | 0 (0.0%) |
| 60 to 64 Years | 42 (80.8%) | 0 (0.0%) |
| 65 to 74 Years | 25 (42.4%) | 0 (0.0%) |
| 75 Years and over | 1 (2.6%) | 0 (0.0%) |
| Total | 363 (53.1%) | 7 (1.9%) |
Employment Status by Educational Attainment in Accomac
According to labor force statistics for Accomac, 68.4% of individuals (331) out of the total population between 25 and 64 years of age (484) are in the labor force, with 2.1% or 7 of them being unemployed. The group with the highest labor force participation rate are those with the educational attainment of college / associate degree, with 72.1% or 44 individuals in the labor force. Within the labor force, individuals with bachelor's degree or higher education have the highest percentage of unemployment, with 12.5% or 7 of them being unemployed.
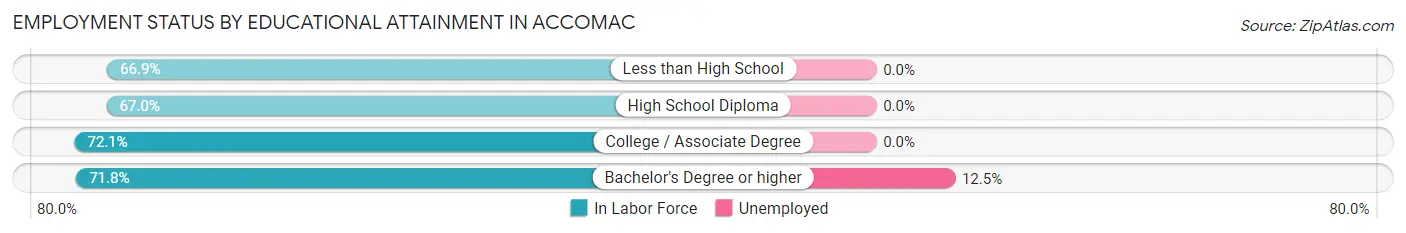
| Educational Attainment | In Labor Force | Unemployed |
| Less than High School | 107 (66.9%) | 0 (0.0%) |
| High School Diploma | 124 (67.0%) | 0 (0.0%) |
| College / Associate Degree | 44 (72.1%) | 0 (0.0%) |
| Bachelor's Degree or higher | 56 (71.8%) | 10 (12.5%) |
| Total | 331 (68.4%) | 10 (2.1%) |
Employment Occupations by Sex in Accomac
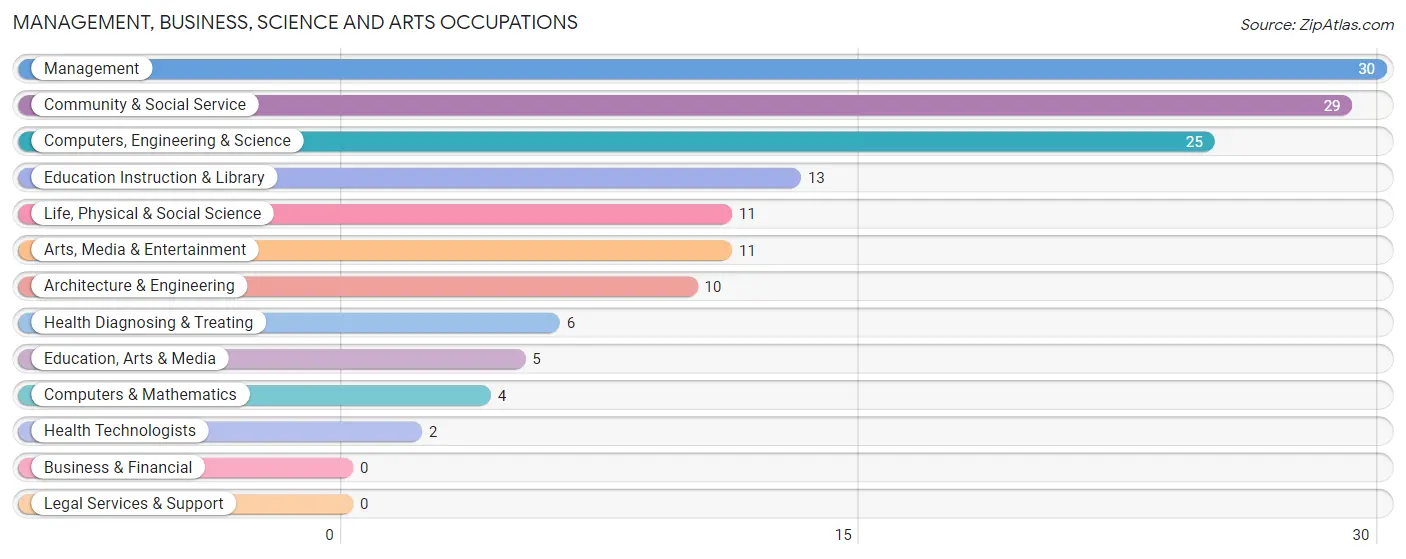
Management, Business, Science and Arts Occupations
The most common Management, Business, Science and Arts occupations in Accomac are Management (30 | 8.4%), Community & Social Service (29 | 8.2%), Computers, Engineering & Science (25 | 7.0%), Education Instruction & Library (13 | 3.6%), and Life, Physical & Social Science (11 | 3.1%).
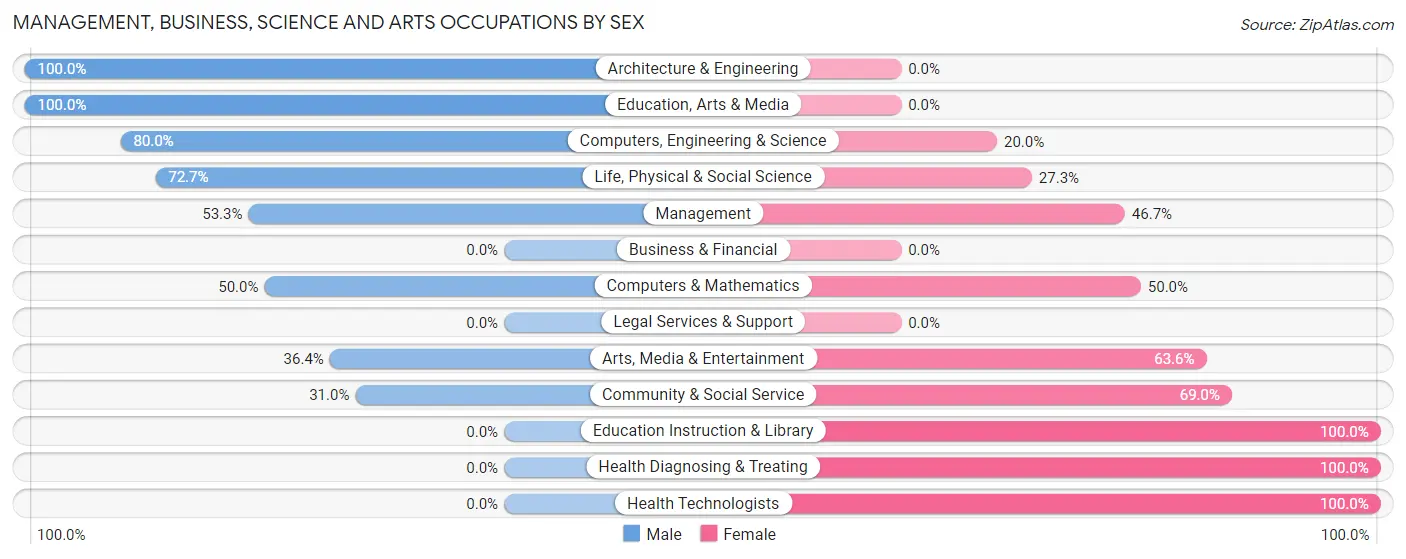
Management, Business, Science and Arts Occupations by Sex
Within the Management, Business, Science and Arts occupations in Accomac, the most male-oriented occupations are Architecture & Engineering (100.0%), Education, Arts & Media (100.0%), and Computers, Engineering & Science (80.0%), while the most female-oriented occupations are Education Instruction & Library (100.0%), Health Diagnosing & Treating (100.0%), and Health Technologists (100.0%).
| Occupation | Male | Female |
| Management | 16 (53.3%) | 14 (46.7%) |
| Business & Financial | 0 (0.0%) | 0 (0.0%) |
| Computers, Engineering & Science | 20 (80.0%) | 5 (20.0%) |
| Computers & Mathematics | 2 (50.0%) | 2 (50.0%) |
| Architecture & Engineering | 10 (100.0%) | 0 (0.0%) |
| Life, Physical & Social Science | 8 (72.7%) | 3 (27.3%) |
| Community & Social Service | 9 (31.0%) | 20 (69.0%) |
| Education, Arts & Media | 5 (100.0%) | 0 (0.0%) |
| Legal Services & Support | 0 (0.0%) | 0 (0.0%) |
| Education Instruction & Library | 0 (0.0%) | 13 (100.0%) |
| Arts, Media & Entertainment | 4 (36.4%) | 7 (63.6%) |
| Health Diagnosing & Treating | 0 (0.0%) | 6 (100.0%) |
| Health Technologists | 0 (0.0%) | 2 (100.0%) |
| Total (Category) | 45 (50.0%) | 45 (50.0%) |
| Total (Overall) | 166 (46.6%) | 190 (53.4%) |
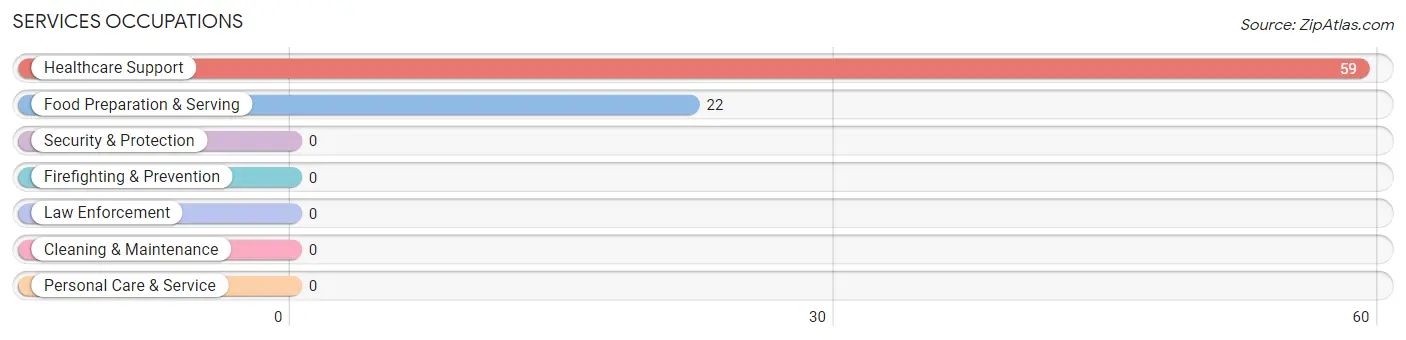
Services Occupations
The most common Services occupations in Accomac are Healthcare Support (59 | 16.6%), and Food Preparation & Serving (22 | 6.2%).
Services Occupations by Sex
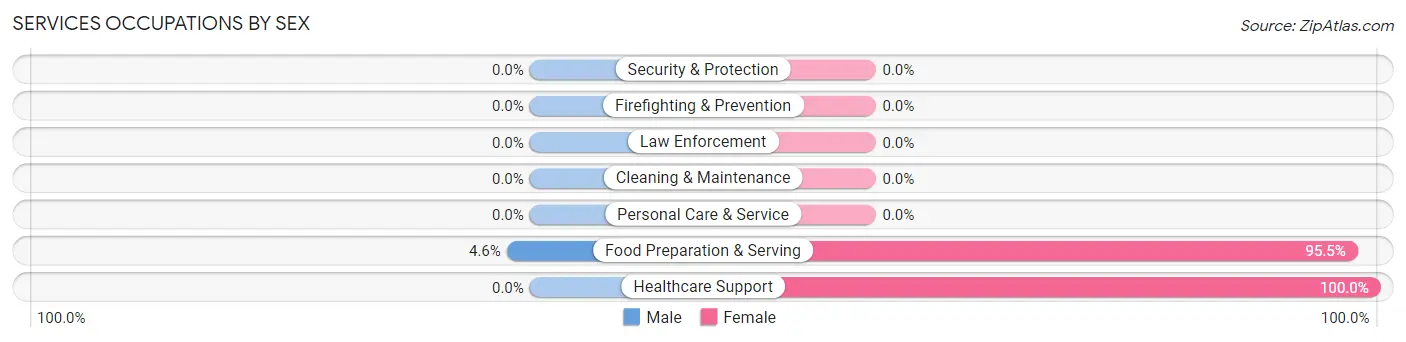
| Occupation | Male | Female |
| Healthcare Support | 0 (0.0%) | 59 (100.0%) |
| Security & Protection | 0 (0.0%) | 0 (0.0%) |
| Firefighting & Prevention | 0 (0.0%) | 0 (0.0%) |
| Law Enforcement | 0 (0.0%) | 0 (0.0%) |
| Food Preparation & Serving | 1 (4.5%) | 21 (95.5%) |
| Cleaning & Maintenance | 0 (0.0%) | 0 (0.0%) |
| Personal Care & Service | 0 (0.0%) | 0 (0.0%) |
| Total (Category) | 1 (1.2%) | 80 (98.8%) |
| Total (Overall) | 166 (46.6%) | 190 (53.4%) |
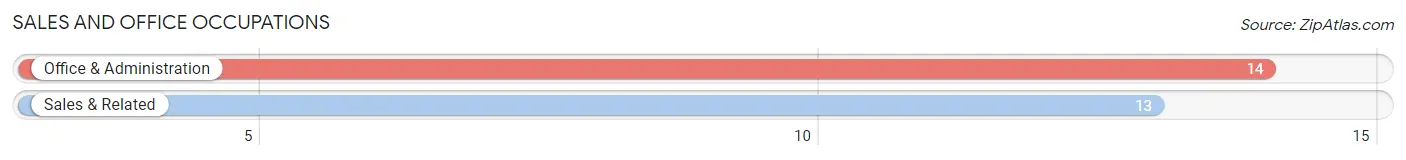
Sales and Office Occupations
The most common Sales and Office occupations in Accomac are Office & Administration (14 | 3.9%), and Sales & Related (13 | 3.6%).
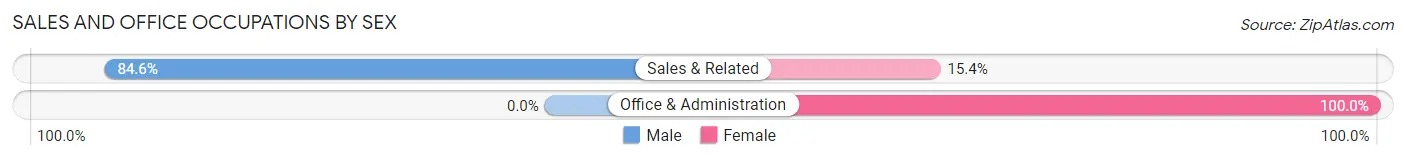
Sales and Office Occupations by Sex
| Occupation | Male | Female |
| Sales & Related | 11 (84.6%) | 2 (15.4%) |
| Office & Administration | 0 (0.0%) | 14 (100.0%) |
| Total (Category) | 11 (40.7%) | 16 (59.3%) |
| Total (Overall) | 166 (46.6%) | 190 (53.4%) |
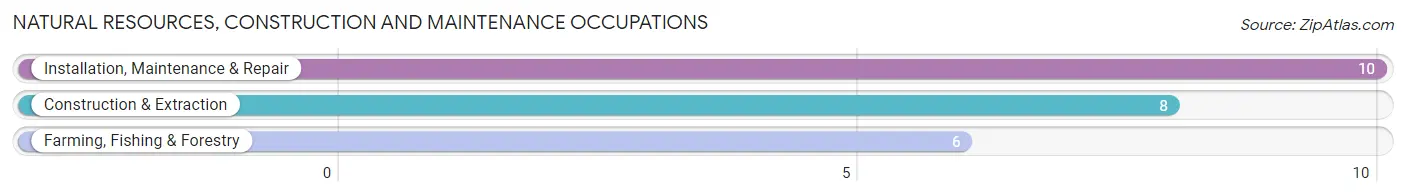
Natural Resources, Construction and Maintenance Occupations
The most common Natural Resources, Construction and Maintenance occupations in Accomac are Installation, Maintenance & Repair (10 | 2.8%), Construction & Extraction (8 | 2.2%), and Farming, Fishing & Forestry (6 | 1.7%).
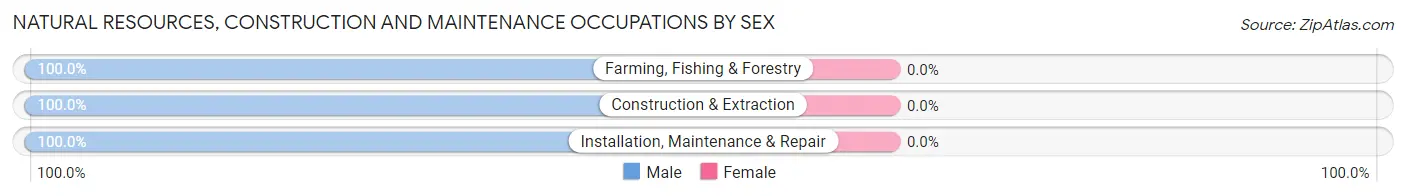
Natural Resources, Construction and Maintenance Occupations by Sex
| Occupation | Male | Female |
| Farming, Fishing & Forestry | 6 (100.0%) | 0 (0.0%) |
| Construction & Extraction | 8 (100.0%) | 0 (0.0%) |
| Installation, Maintenance & Repair | 10 (100.0%) | 0 (0.0%) |
| Total (Category) | 24 (100.0%) | 0 (0.0%) |
| Total (Overall) | 166 (46.6%) | 190 (53.4%) |
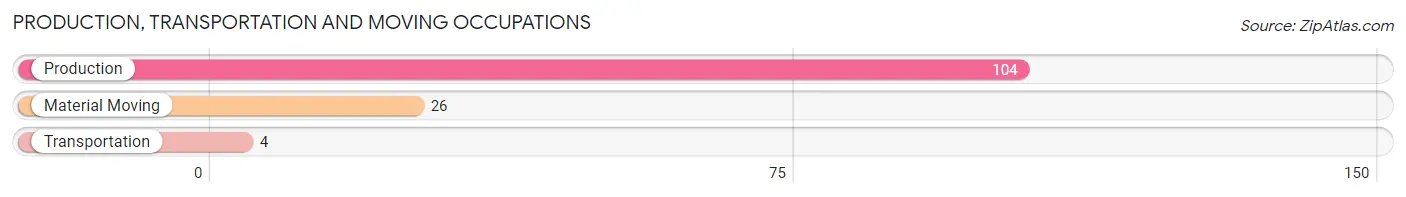
Production, Transportation and Moving Occupations
The most common Production, Transportation and Moving occupations in Accomac are Production (104 | 29.2%), Material Moving (26 | 7.3%), and Transportation (4 | 1.1%).
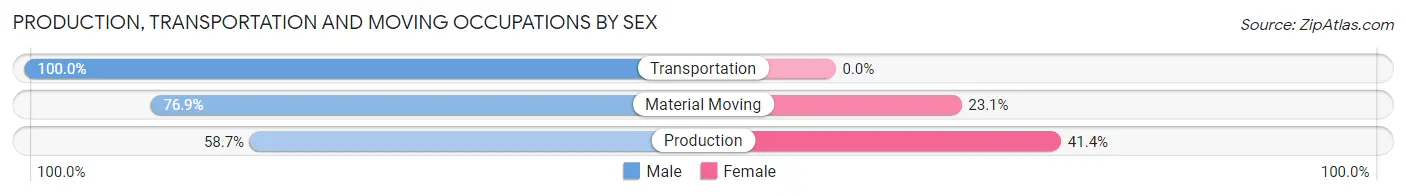
Production, Transportation and Moving Occupations by Sex
| Occupation | Male | Female |
| Production | 61 (58.7%) | 43 (41.3%) |
| Transportation | 4 (100.0%) | 0 (0.0%) |
| Material Moving | 20 (76.9%) | 6 (23.1%) |
| Total (Category) | 85 (63.4%) | 49 (36.6%) |
| Total (Overall) | 166 (46.6%) | 190 (53.4%) |
Employment Industries by Sex in Accomac
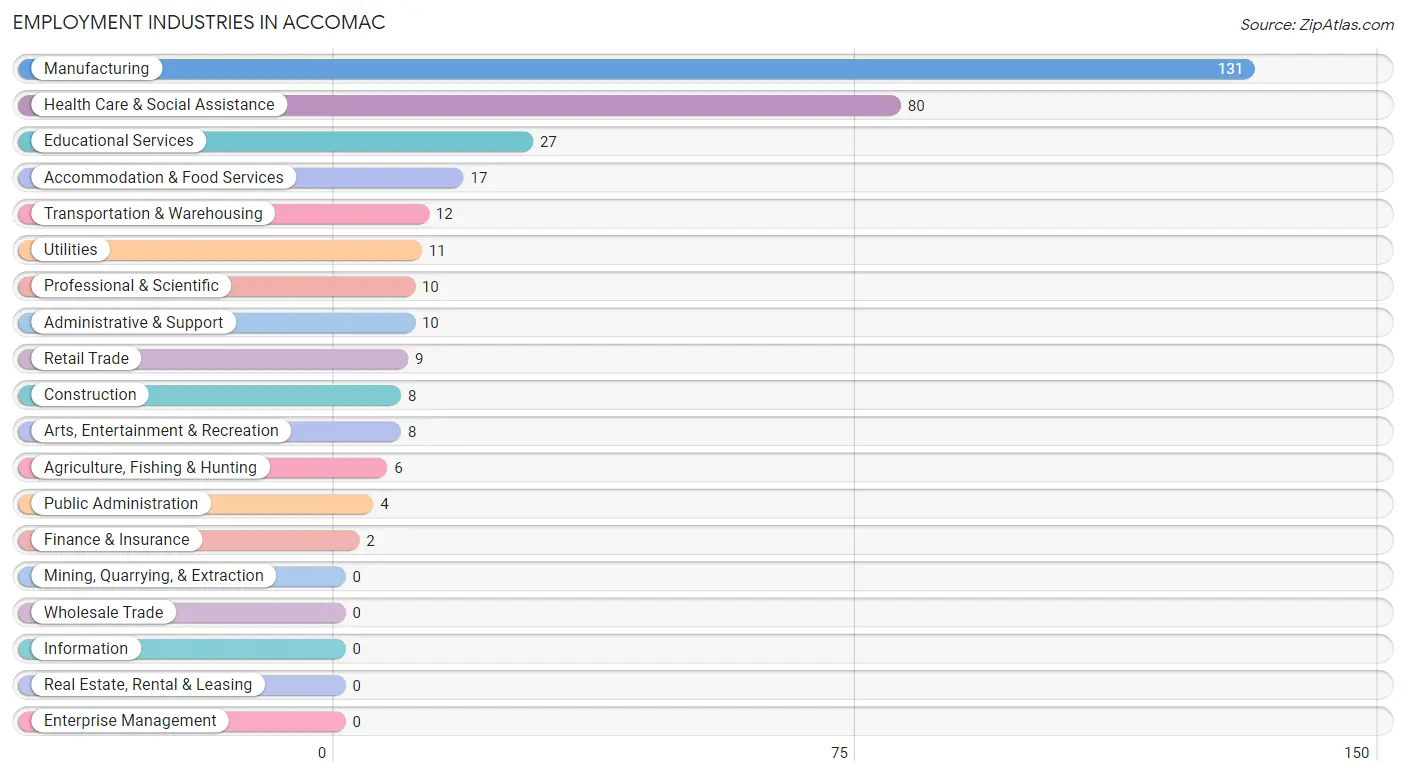
Employment Industries in Accomac
The major employment industries in Accomac include Manufacturing (131 | 36.8%), Health Care & Social Assistance (80 | 22.5%), Educational Services (27 | 7.6%), Accommodation & Food Services (17 | 4.8%), and Transportation & Warehousing (12 | 3.4%).
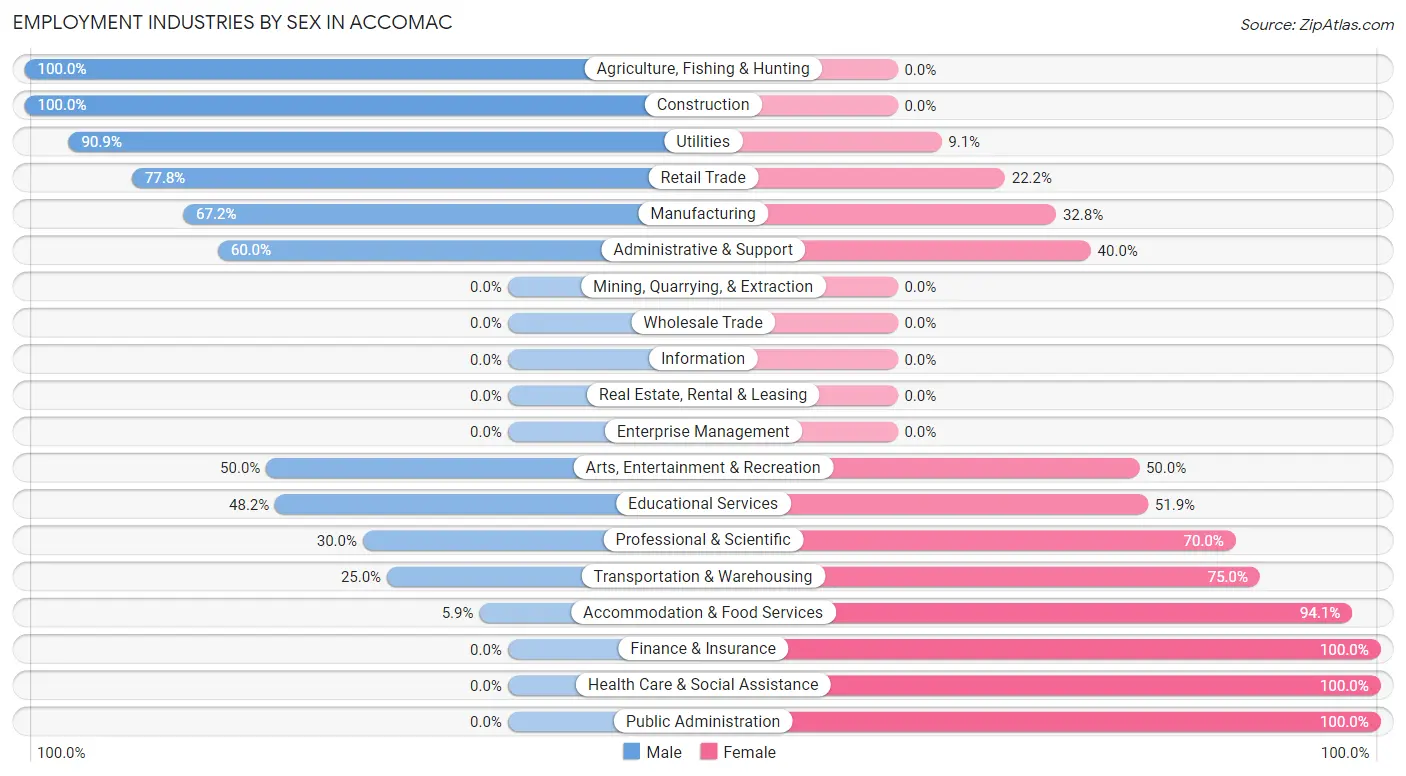
Employment Industries by Sex in Accomac
The Accomac industries that see more men than women are Agriculture, Fishing & Hunting (100.0%), Construction (100.0%), and Utilities (90.9%), whereas the industries that tend to have a higher number of women are Finance & Insurance (100.0%), Health Care & Social Assistance (100.0%), and Public Administration (100.0%).
| Industry | Male | Female |
| Agriculture, Fishing & Hunting | 6 (100.0%) | 0 (0.0%) |
| Mining, Quarrying, & Extraction | 0 (0.0%) | 0 (0.0%) |
| Construction | 8 (100.0%) | 0 (0.0%) |
| Manufacturing | 88 (67.2%) | 43 (32.8%) |
| Wholesale Trade | 0 (0.0%) | 0 (0.0%) |
| Retail Trade | 7 (77.8%) | 2 (22.2%) |
| Transportation & Warehousing | 3 (25.0%) | 9 (75.0%) |
| Utilities | 10 (90.9%) | 1 (9.1%) |
| Information | 0 (0.0%) | 0 (0.0%) |
| Finance & Insurance | 0 (0.0%) | 2 (100.0%) |
| Real Estate, Rental & Leasing | 0 (0.0%) | 0 (0.0%) |
| Professional & Scientific | 3 (30.0%) | 7 (70.0%) |
| Enterprise Management | 0 (0.0%) | 0 (0.0%) |
| Administrative & Support | 6 (60.0%) | 4 (40.0%) |
| Educational Services | 13 (48.1%) | 14 (51.8%) |
| Health Care & Social Assistance | 0 (0.0%) | 80 (100.0%) |
| Arts, Entertainment & Recreation | 4 (50.0%) | 4 (50.0%) |
| Accommodation & Food Services | 1 (5.9%) | 16 (94.1%) |
| Public Administration | 0 (0.0%) | 4 (100.0%) |
| Total | 166 (46.6%) | 190 (53.4%) |
Education in Accomac
School Enrollment in Accomac
The most common levels of schooling among the 317 students in Accomac are high school (144 | 45.4%), middle school (104 | 32.8%), and elementary school (46 | 14.5%).
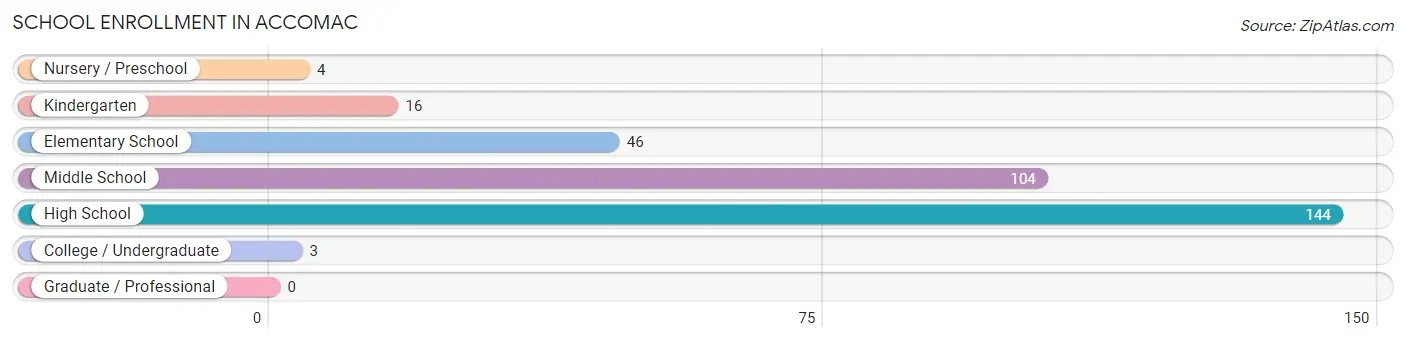
| School Level | # Students | % Students |
| Nursery / Preschool | 4 | 1.3% |
| Kindergarten | 16 | 5.1% |
| Elementary School | 46 | 14.5% |
| Middle School | 104 | 32.8% |
| High School | 144 | 45.4% |
| College / Undergraduate | 3 | 0.9% |
| Graduate / Professional | 0 | 0.0% |
| Total | 317 | 100.0% |
School Enrollment by Age by Funding Source in Accomac
Out of a total of 317 students who are enrolled in schools in Accomac, 1 (0.3%) attend a private institution, while the remaining 316 (99.7%) are enrolled in public schools. The age group of 15 to 17 year olds has the highest likelihood of being enrolled in private schools, with 1 (1.1% in the age bracket) enrolled. Conversely, the age group of 3 to 4 year olds has the lowest likelihood of being enrolled in a private school, with 3 (100.0% in the age bracket) attending a public institution.
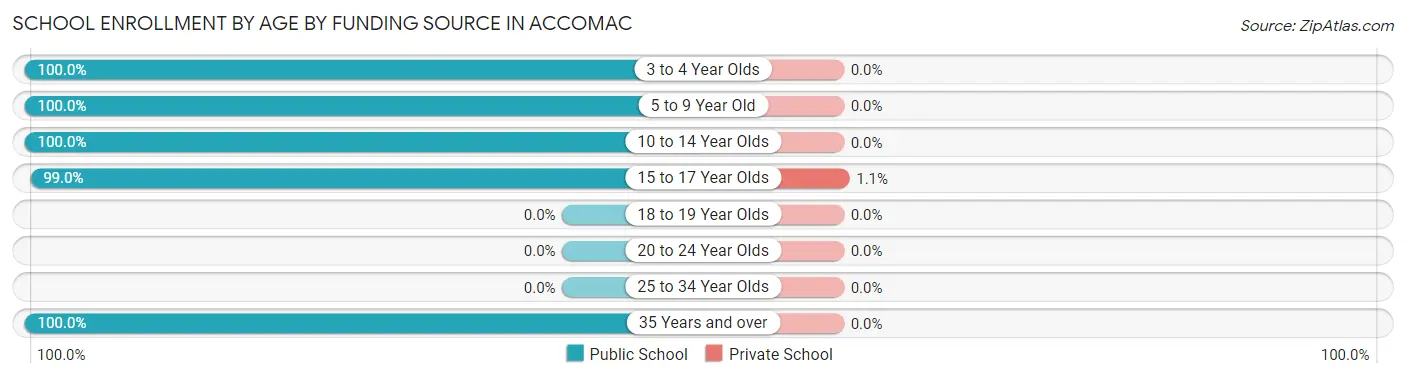
| Age Bracket | Public School | Private School |
| 3 to 4 Year Olds | 3 (100.0%) | 0 (0.0%) |
| 5 to 9 Year Old | 59 (100.0%) | 0 (0.0%) |
| 10 to 14 Year Olds | 157 (100.0%) | 0 (0.0%) |
| 15 to 17 Year Olds | 94 (99.0%) | 1 (1.1%) |
| 18 to 19 Year Olds | 0 (0.0%) | 0 (0.0%) |
| 20 to 24 Year Olds | 0 (0.0%) | 0 (0.0%) |
| 25 to 34 Year Olds | 0 (0.0%) | 0 (0.0%) |
| 35 Years and over | 3 (100.0%) | 0 (0.0%) |
| Total | 316 (99.7%) | 1 (0.3%) |
Educational Attainment by Field of Study in Accomac
Education (25 | 21.9%), science & technology (18 | 15.8%), business (18 | 15.8%), bio, nature & agricultural (16 | 14.0%), and physical & health sciences (10 | 8.8%) are the most common fields of study among 114 individuals in Accomac who have obtained a bachelor's degree or higher.
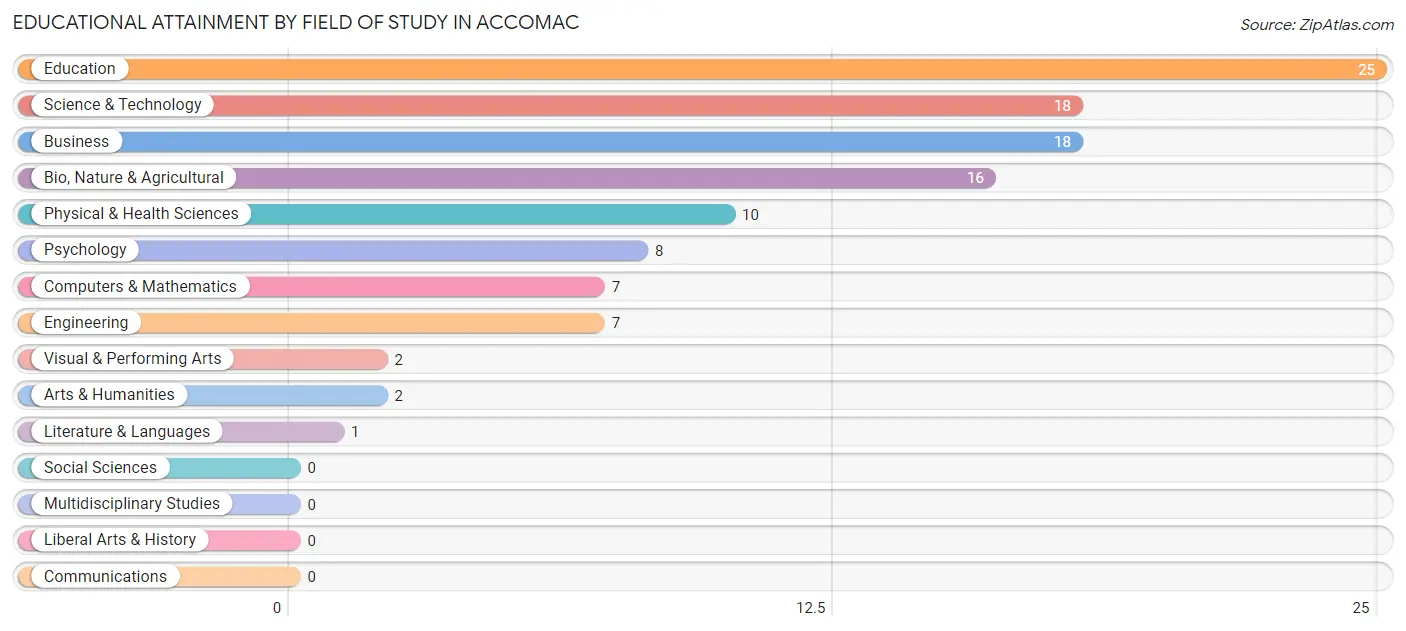
| Field of Study | # Graduates | % Graduates |
| Computers & Mathematics | 7 | 6.1% |
| Bio, Nature & Agricultural | 16 | 14.0% |
| Physical & Health Sciences | 10 | 8.8% |
| Psychology | 8 | 7.0% |
| Social Sciences | 0 | 0.0% |
| Engineering | 7 | 6.1% |
| Multidisciplinary Studies | 0 | 0.0% |
| Science & Technology | 18 | 15.8% |
| Business | 18 | 15.8% |
| Education | 25 | 21.9% |
| Literature & Languages | 1 | 0.9% |
| Liberal Arts & History | 0 | 0.0% |
| Visual & Performing Arts | 2 | 1.8% |
| Communications | 0 | 0.0% |
| Arts & Humanities | 2 | 1.8% |
| Total | 114 | 100.0% |
Transportation & Commute in Accomac
Vehicle Availability by Sex in Accomac
The most prevalent vehicle ownership categories in Accomac are males with 3 vehicles (73, accounting for 44.0%) and females with 3 vehicles (69, making up 38.6%).
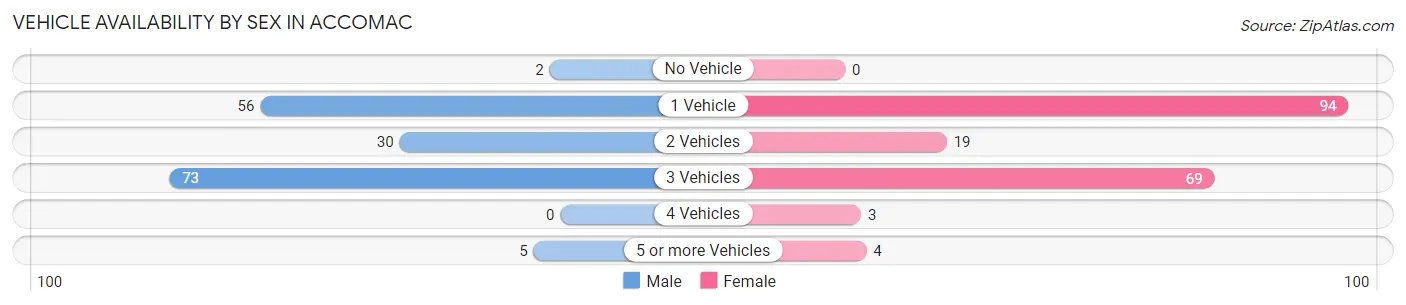
| Vehicles Available | Male | Female |
| No Vehicle | 2 (1.2%) | 0 (0.0%) |
| 1 Vehicle | 56 (33.7%) | 94 (49.7%) |
| 2 Vehicles | 30 (18.1%) | 19 (10.1%) |
| 3 Vehicles | 73 (44.0%) | 69 (36.5%) |
| 4 Vehicles | 0 (0.0%) | 3 (1.6%) |
| 5 or more Vehicles | 5 (3.0%) | 4 (2.1%) |
| Total | 166 (100.0%) | 189 (100.0%) |
Commute Time in Accomac
The most frequently occuring commute durations in Accomac are 10 to 14 minutes (200 commuters, 59.2%), 5 to 9 minutes (65 commuters, 19.2%), and 15 to 19 minutes (19 commuters, 5.6%).
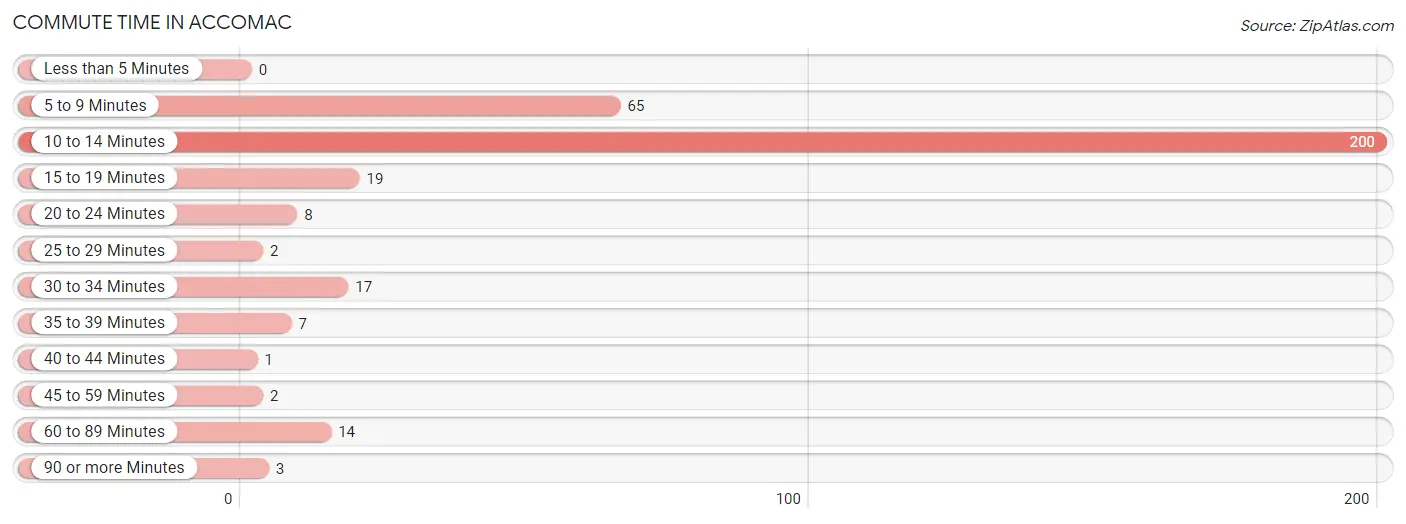
| Commute Time | # Commuters | % Commuters |
| Less than 5 Minutes | 0 | 0.0% |
| 5 to 9 Minutes | 65 | 19.2% |
| 10 to 14 Minutes | 200 | 59.2% |
| 15 to 19 Minutes | 19 | 5.6% |
| 20 to 24 Minutes | 8 | 2.4% |
| 25 to 29 Minutes | 2 | 0.6% |
| 30 to 34 Minutes | 17 | 5.0% |
| 35 to 39 Minutes | 7 | 2.1% |
| 40 to 44 Minutes | 1 | 0.3% |
| 45 to 59 Minutes | 2 | 0.6% |
| 60 to 89 Minutes | 14 | 4.1% |
| 90 or more Minutes | 3 | 0.9% |
Commute Time by Sex in Accomac
The most common commute times in Accomac are 10 to 14 minutes (72 commuters, 44.4%) for males and 10 to 14 minutes (128 commuters, 72.7%) for females.
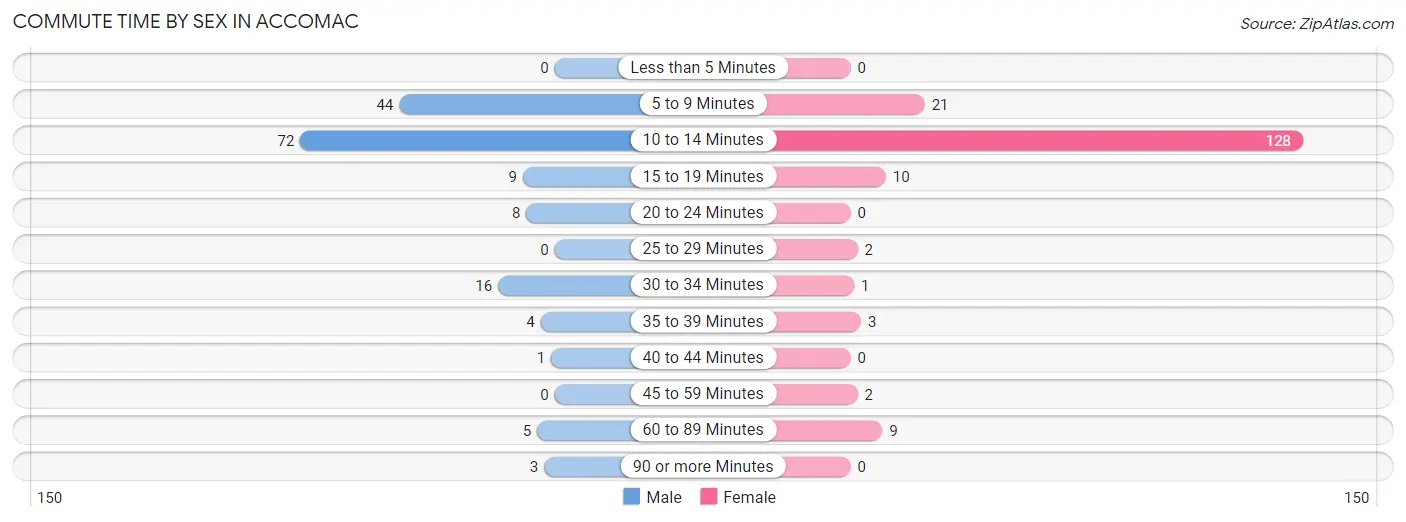
| Commute Time | Male | Female |
| Less than 5 Minutes | 0 (0.0%) | 0 (0.0%) |
| 5 to 9 Minutes | 44 (27.2%) | 21 (11.9%) |
| 10 to 14 Minutes | 72 (44.4%) | 128 (72.7%) |
| 15 to 19 Minutes | 9 (5.6%) | 10 (5.7%) |
| 20 to 24 Minutes | 8 (4.9%) | 0 (0.0%) |
| 25 to 29 Minutes | 0 (0.0%) | 2 (1.1%) |
| 30 to 34 Minutes | 16 (9.9%) | 1 (0.6%) |
| 35 to 39 Minutes | 4 (2.5%) | 3 (1.7%) |
| 40 to 44 Minutes | 1 (0.6%) | 0 (0.0%) |
| 45 to 59 Minutes | 0 (0.0%) | 2 (1.1%) |
| 60 to 89 Minutes | 5 (3.1%) | 9 (5.1%) |
| 90 or more Minutes | 3 (1.8%) | 0 (0.0%) |
Time of Departure to Work by Sex in Accomac
The most frequent times of departure to work in Accomac are 12:00 PM to 3:59 PM (60, 37.0%) for males and 8:00 AM to 8:29 AM (55, 31.2%) for females.
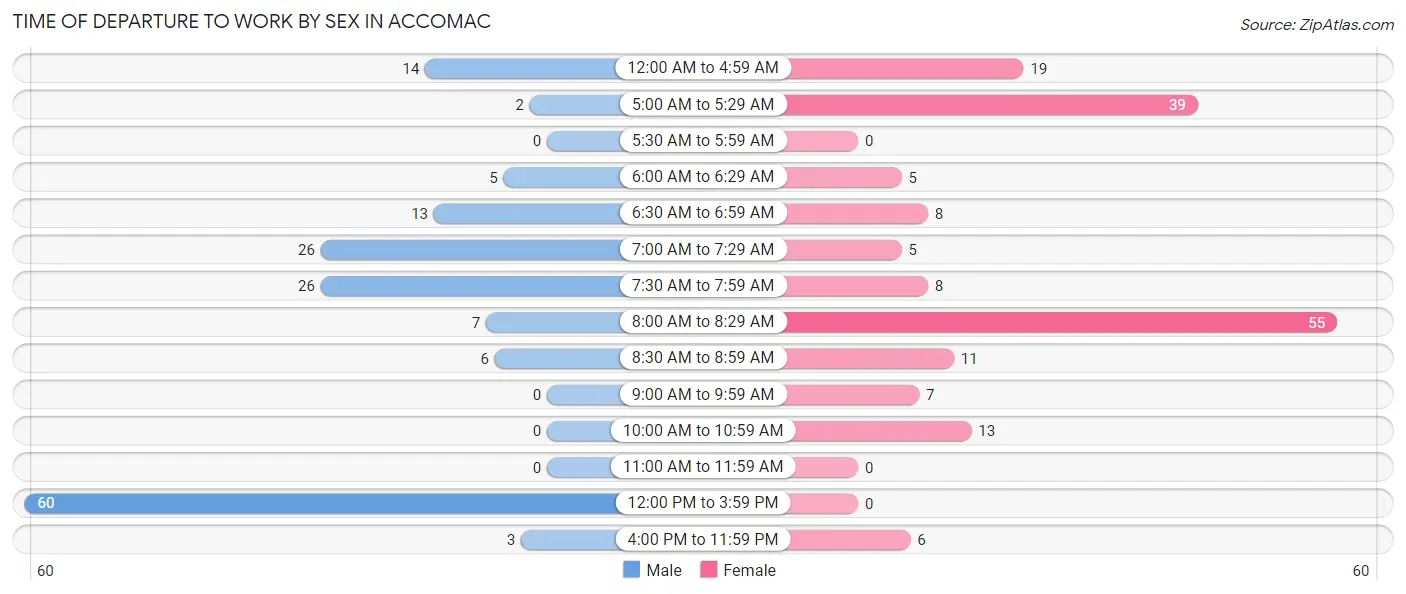
| Time of Departure | Male | Female |
| 12:00 AM to 4:59 AM | 14 (8.6%) | 19 (10.8%) |
| 5:00 AM to 5:29 AM | 2 (1.2%) | 39 (22.2%) |
| 5:30 AM to 5:59 AM | 0 (0.0%) | 0 (0.0%) |
| 6:00 AM to 6:29 AM | 5 (3.1%) | 5 (2.8%) |
| 6:30 AM to 6:59 AM | 13 (8.0%) | 8 (4.5%) |
| 7:00 AM to 7:29 AM | 26 (16.1%) | 5 (2.8%) |
| 7:30 AM to 7:59 AM | 26 (16.1%) | 8 (4.5%) |
| 8:00 AM to 8:29 AM | 7 (4.3%) | 55 (31.2%) |
| 8:30 AM to 8:59 AM | 6 (3.7%) | 11 (6.2%) |
| 9:00 AM to 9:59 AM | 0 (0.0%) | 7 (4.0%) |
| 10:00 AM to 10:59 AM | 0 (0.0%) | 13 (7.4%) |
| 11:00 AM to 11:59 AM | 0 (0.0%) | 0 (0.0%) |
| 12:00 PM to 3:59 PM | 60 (37.0%) | 0 (0.0%) |
| 4:00 PM to 11:59 PM | 3 (1.8%) | 6 (3.4%) |
| Total | 162 (100.0%) | 176 (100.0%) |
Housing Occupancy in Accomac
Occupancy by Ownership in Accomac
Of the total 304 dwellings in Accomac, owner-occupied units account for 175 (57.6%), while renter-occupied units make up 129 (42.4%).
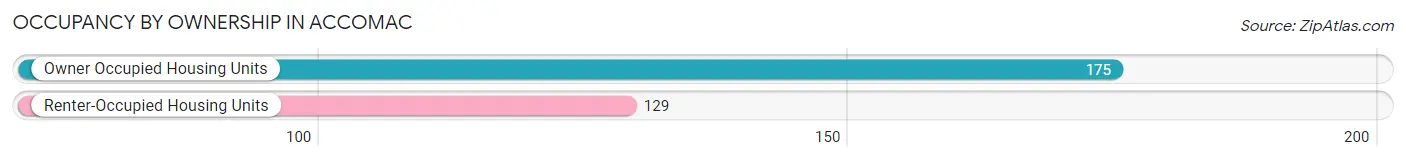
| Occupancy | # Housing Units | % Housing Units |
| Owner Occupied Housing Units | 175 | 57.6% |
| Renter-Occupied Housing Units | 129 | 42.4% |
| Total Occupied Housing Units | 304 | 100.0% |
Occupancy by Household Size in Accomac
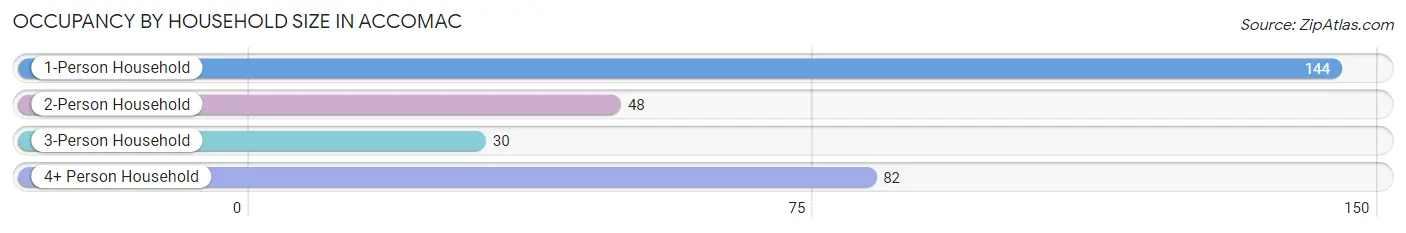
| Household Size | # Housing Units | % Housing Units |
| 1-Person Household | 144 | 47.4% |
| 2-Person Household | 48 | 15.8% |
| 3-Person Household | 30 | 9.9% |
| 4+ Person Household | 82 | 27.0% |
| Total Housing Units | 304 | 100.0% |
Occupancy by Ownership by Household Size in Accomac
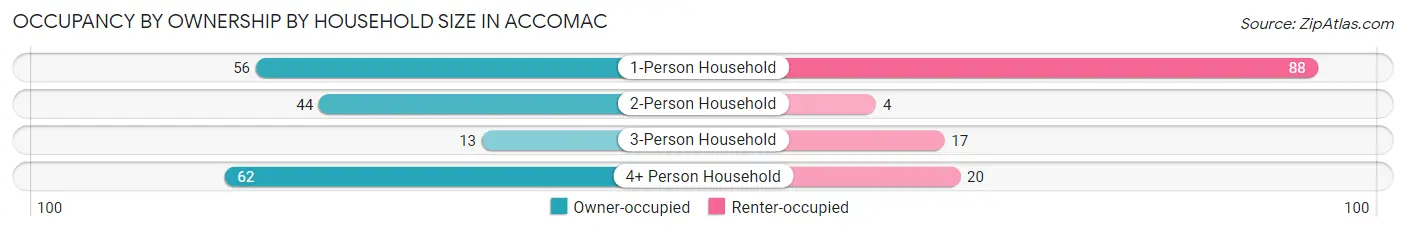
| Household Size | Owner-occupied | Renter-occupied |
| 1-Person Household | 56 (38.9%) | 88 (61.1%) |
| 2-Person Household | 44 (91.7%) | 4 (8.3%) |
| 3-Person Household | 13 (43.3%) | 17 (56.7%) |
| 4+ Person Household | 62 (75.6%) | 20 (24.4%) |
| Total Housing Units | 175 (57.6%) | 129 (42.4%) |
Occupancy by Educational Attainment in Accomac
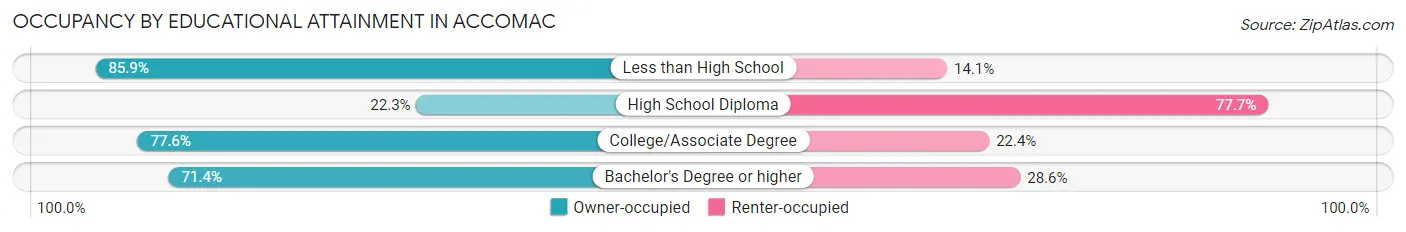
| Household Size | Owner-occupied | Renter-occupied |
| Less than High School | 55 (85.9%) | 9 (14.1%) |
| High School Diploma | 25 (22.3%) | 87 (77.7%) |
| College/Associate Degree | 45 (77.6%) | 13 (22.4%) |
| Bachelor's Degree or higher | 50 (71.4%) | 20 (28.6%) |
Occupancy by Age of Householder in Accomac
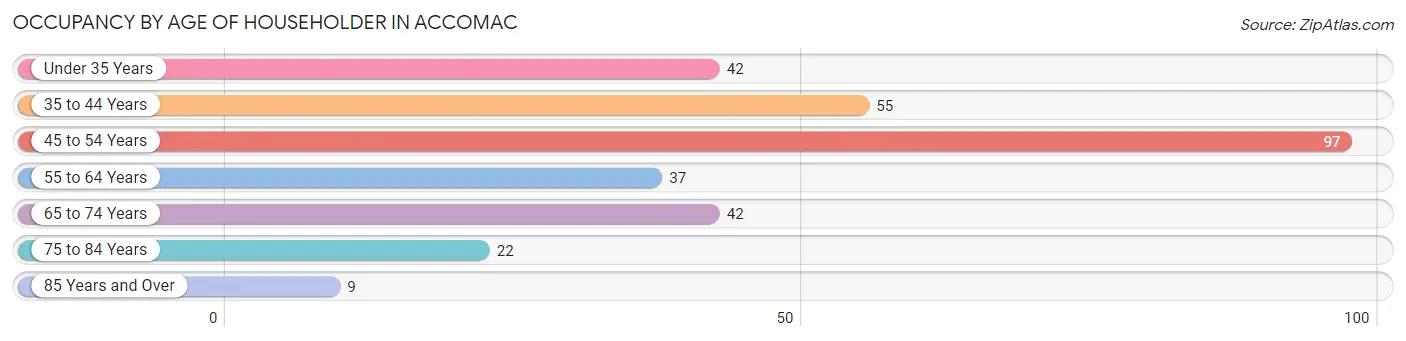
| Age Bracket | # Households | % Households |
| Under 35 Years | 42 | 13.8% |
| 35 to 44 Years | 55 | 18.1% |
| 45 to 54 Years | 97 | 31.9% |
| 55 to 64 Years | 37 | 12.2% |
| 65 to 74 Years | 42 | 13.8% |
| 75 to 84 Years | 22 | 7.2% |
| 85 Years and Over | 9 | 3.0% |
| Total | 304 | 100.0% |
Housing Finances in Accomac
Median Income by Occupancy in Accomac
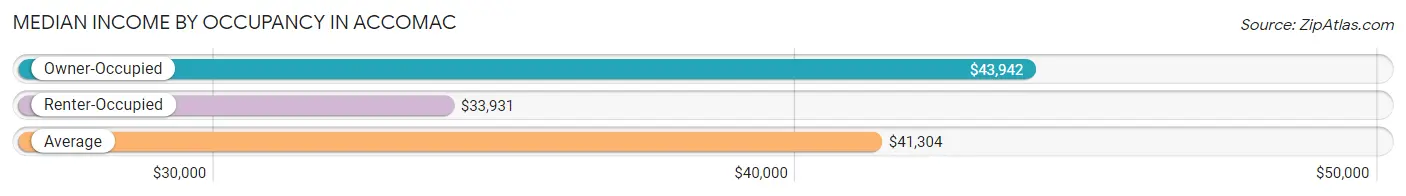
| Occupancy Type | # Households | Median Income |
| Owner-Occupied | 175 (57.6%) | $43,942 |
| Renter-Occupied | 129 (42.4%) | $33,931 |
| Average | 304 (100.0%) | $41,304 |
Occupancy by Householder Income Bracket in Accomac
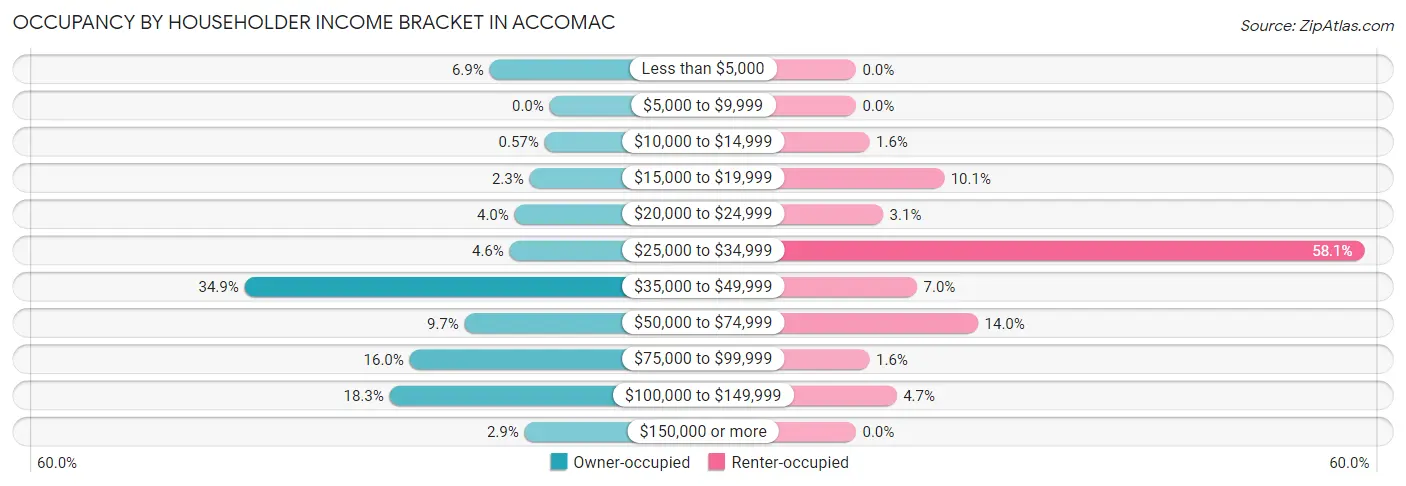
| Income Bracket | Owner-occupied | Renter-occupied |
| Less than $5,000 | 12 (6.9%) | 0 (0.0%) |
| $5,000 to $9,999 | 0 (0.0%) | 0 (0.0%) |
| $10,000 to $14,999 | 1 (0.6%) | 2 (1.5%) |
| $15,000 to $19,999 | 4 (2.3%) | 13 (10.1%) |
| $20,000 to $24,999 | 7 (4.0%) | 4 (3.1%) |
| $25,000 to $34,999 | 8 (4.6%) | 75 (58.1%) |
| $35,000 to $49,999 | 61 (34.9%) | 9 (7.0%) |
| $50,000 to $74,999 | 17 (9.7%) | 18 (14.0%) |
| $75,000 to $99,999 | 28 (16.0%) | 2 (1.5%) |
| $100,000 to $149,999 | 32 (18.3%) | 6 (4.6%) |
| $150,000 or more | 5 (2.9%) | 0 (0.0%) |
| Total | 175 (100.0%) | 129 (100.0%) |
Monthly Housing Cost Tiers in Accomac
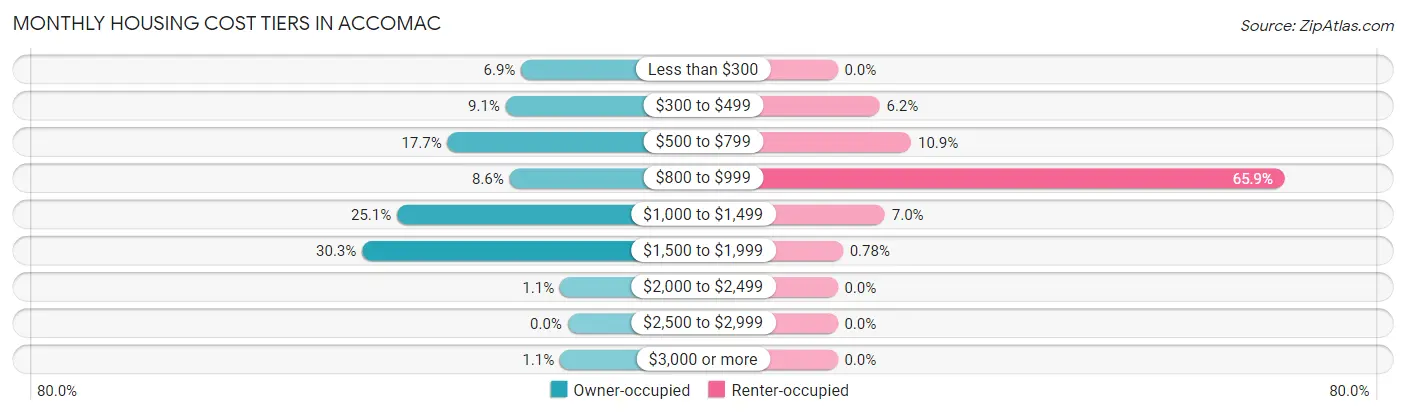
| Monthly Cost | Owner-occupied | Renter-occupied |
| Less than $300 | 12 (6.9%) | 0 (0.0%) |
| $300 to $499 | 16 (9.1%) | 8 (6.2%) |
| $500 to $799 | 31 (17.7%) | 14 (10.8%) |
| $800 to $999 | 15 (8.6%) | 85 (65.9%) |
| $1,000 to $1,499 | 44 (25.1%) | 9 (7.0%) |
| $1,500 to $1,999 | 53 (30.3%) | 1 (0.8%) |
| $2,000 to $2,499 | 2 (1.1%) | 0 (0.0%) |
| $2,500 to $2,999 | 0 (0.0%) | 0 (0.0%) |
| $3,000 or more | 2 (1.1%) | 0 (0.0%) |
| Total | 175 (100.0%) | 129 (100.0%) |
Physical Housing Characteristics in Accomac
Housing Structures in Accomac
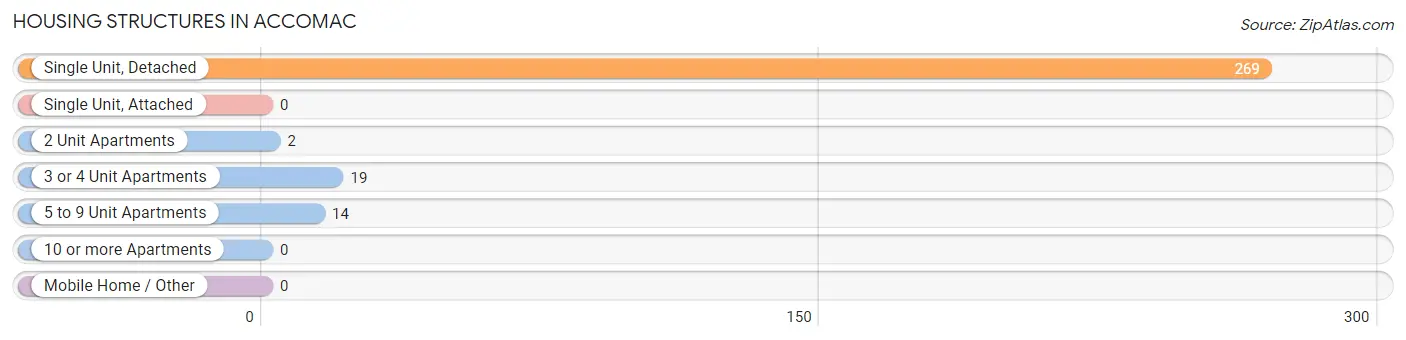
| Structure Type | # Housing Units | % Housing Units |
| Single Unit, Detached | 269 | 88.5% |
| Single Unit, Attached | 0 | 0.0% |
| 2 Unit Apartments | 2 | 0.7% |
| 3 or 4 Unit Apartments | 19 | 6.2% |
| 5 to 9 Unit Apartments | 14 | 4.6% |
| 10 or more Apartments | 0 | 0.0% |
| Mobile Home / Other | 0 | 0.0% |
| Total | 304 | 100.0% |
Housing Structures by Occupancy in Accomac
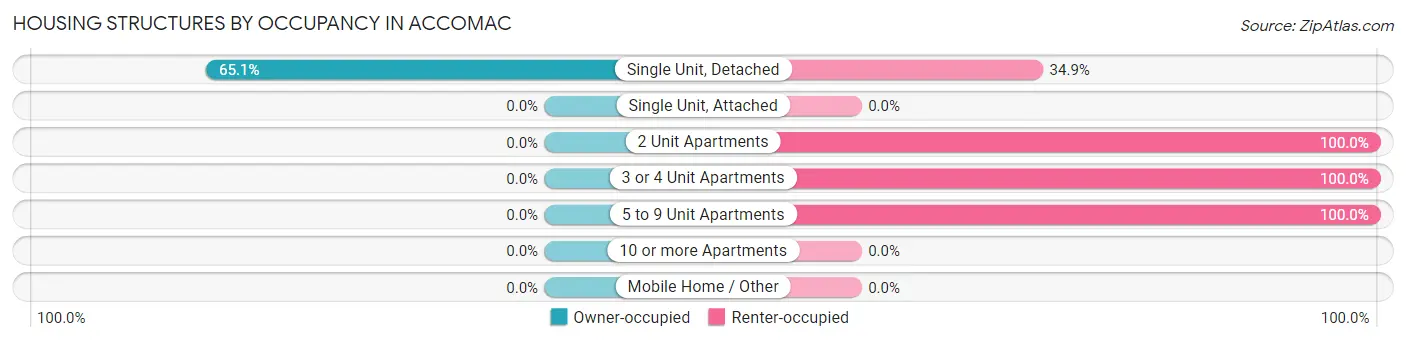
| Structure Type | Owner-occupied | Renter-occupied |
| Single Unit, Detached | 175 (65.1%) | 94 (34.9%) |
| Single Unit, Attached | 0 (0.0%) | 0 (0.0%) |
| 2 Unit Apartments | 0 (0.0%) | 2 (100.0%) |
| 3 or 4 Unit Apartments | 0 (0.0%) | 19 (100.0%) |
| 5 to 9 Unit Apartments | 0 (0.0%) | 14 (100.0%) |
| 10 or more Apartments | 0 (0.0%) | 0 (0.0%) |
| Mobile Home / Other | 0 (0.0%) | 0 (0.0%) |
| Total | 175 (57.6%) | 129 (42.4%) |
Housing Structures by Number of Rooms in Accomac
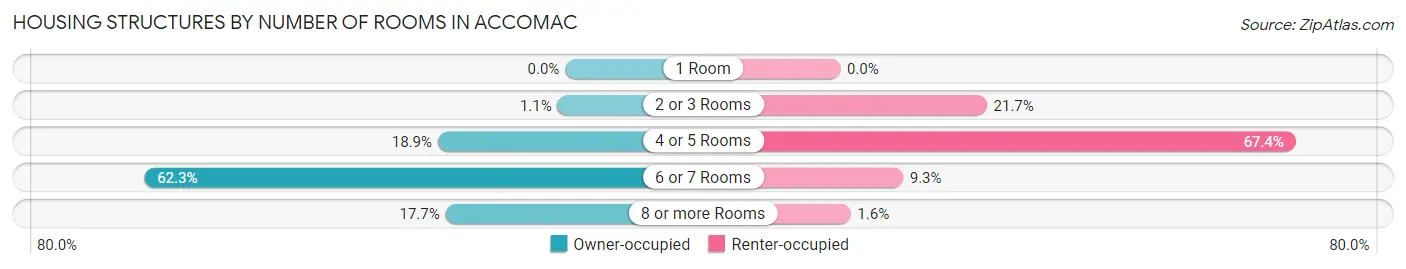
| Number of Rooms | Owner-occupied | Renter-occupied |
| 1 Room | 0 (0.0%) | 0 (0.0%) |
| 2 or 3 Rooms | 2 (1.1%) | 28 (21.7%) |
| 4 or 5 Rooms | 33 (18.9%) | 87 (67.4%) |
| 6 or 7 Rooms | 109 (62.3%) | 12 (9.3%) |
| 8 or more Rooms | 31 (17.7%) | 2 (1.5%) |
| Total | 175 (100.0%) | 129 (100.0%) |
Housing Structure by Heating Type in Accomac
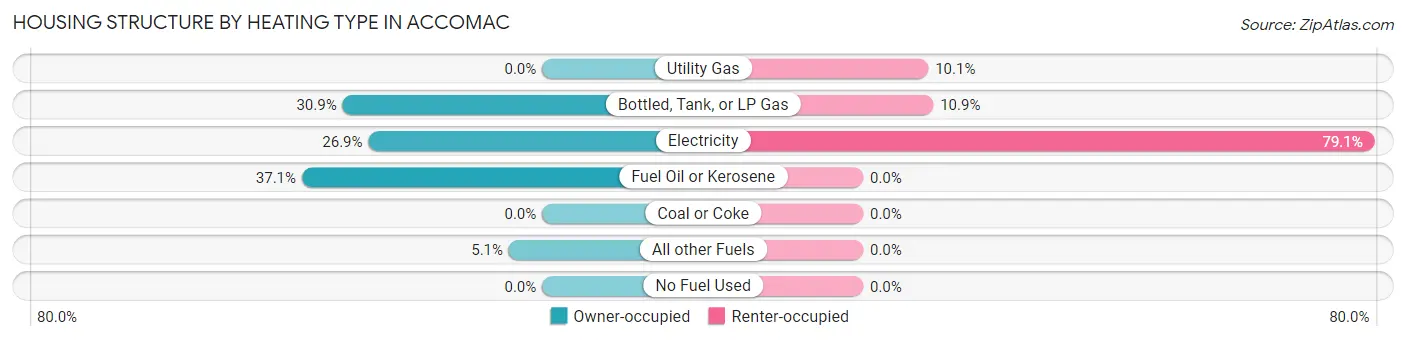
| Heating Type | Owner-occupied | Renter-occupied |
| Utility Gas | 0 (0.0%) | 13 (10.1%) |
| Bottled, Tank, or LP Gas | 54 (30.9%) | 14 (10.8%) |
| Electricity | 47 (26.9%) | 102 (79.1%) |
| Fuel Oil or Kerosene | 65 (37.1%) | 0 (0.0%) |
| Coal or Coke | 0 (0.0%) | 0 (0.0%) |
| All other Fuels | 9 (5.1%) | 0 (0.0%) |
| No Fuel Used | 0 (0.0%) | 0 (0.0%) |
| Total | 175 (100.0%) | 129 (100.0%) |
Household Vehicle Usage in Accomac
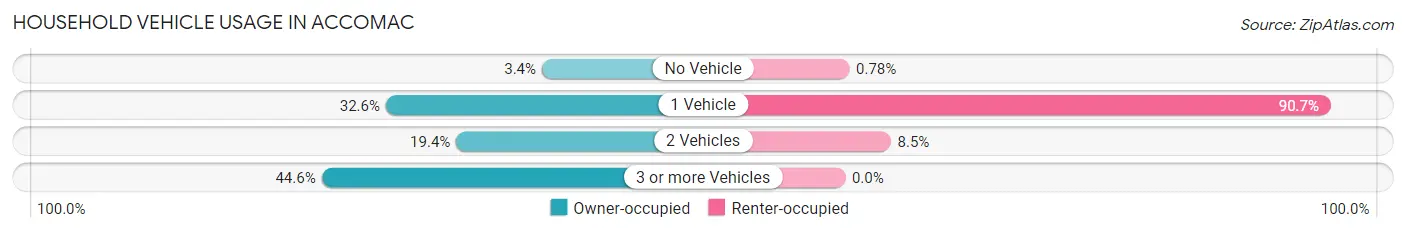
| Vehicles per Household | Owner-occupied | Renter-occupied |
| No Vehicle | 6 (3.4%) | 1 (0.8%) |
| 1 Vehicle | 57 (32.6%) | 117 (90.7%) |
| 2 Vehicles | 34 (19.4%) | 11 (8.5%) |
| 3 or more Vehicles | 78 (44.6%) | 0 (0.0%) |
| Total | 175 (100.0%) | 129 (100.0%) |
Real Estate & Mortgages in Accomac
Real Estate and Mortgage Overview in Accomac
| Characteristic | Without Mortgage | With Mortgage |
| Housing Units | 62 | 113 |
| Median Property Value | $172,500 | $239,600 |
| Median Household Income | $44,808 | $0 |
| Monthly Housing Costs | $519 | $2 |
| Real Estate Taxes | $800 | $0 |
Property Value by Mortgage Status in Accomac
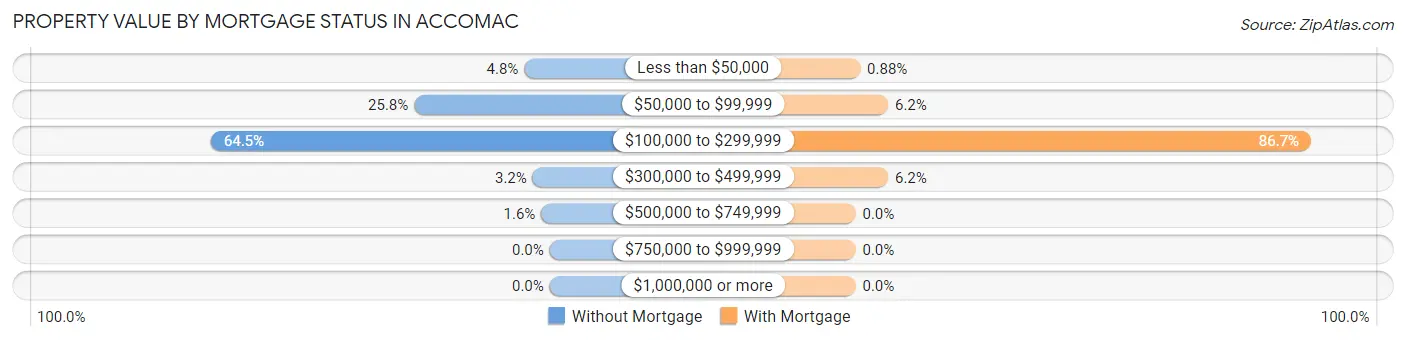
| Property Value | Without Mortgage | With Mortgage |
| Less than $50,000 | 3 (4.8%) | 1 (0.9%) |
| $50,000 to $99,999 | 16 (25.8%) | 7 (6.2%) |
| $100,000 to $299,999 | 40 (64.5%) | 98 (86.7%) |
| $300,000 to $499,999 | 2 (3.2%) | 7 (6.2%) |
| $500,000 to $749,999 | 1 (1.6%) | 0 (0.0%) |
| $750,000 to $999,999 | 0 (0.0%) | 0 (0.0%) |
| $1,000,000 or more | 0 (0.0%) | 0 (0.0%) |
| Total | 62 (100.0%) | 113 (100.0%) |
Household Income by Mortgage Status in Accomac
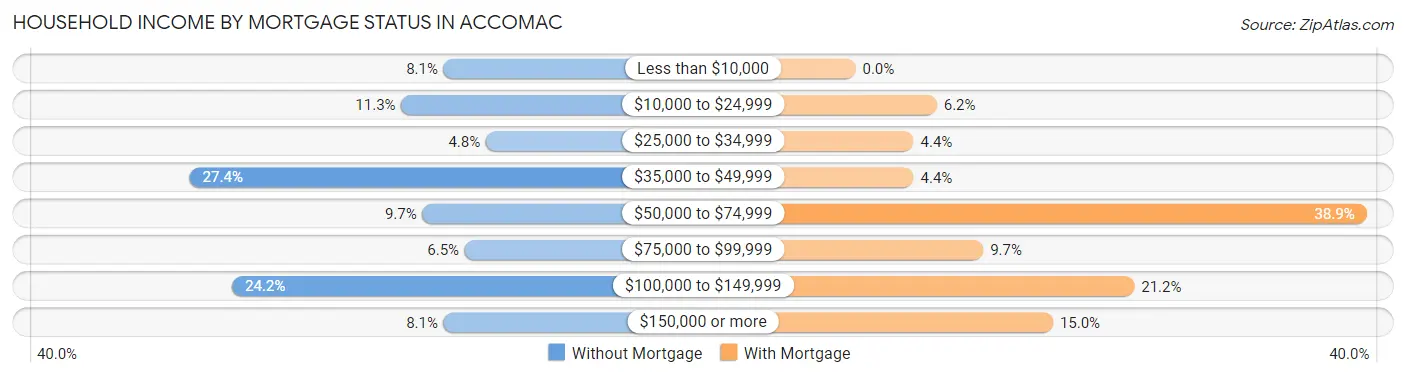
| Household Income | Without Mortgage | With Mortgage |
| Less than $10,000 | 5 (8.1%) | 0 (0.0%) |
| $10,000 to $24,999 | 7 (11.3%) | 7 (6.2%) |
| $25,000 to $34,999 | 3 (4.8%) | 5 (4.4%) |
| $35,000 to $49,999 | 17 (27.4%) | 5 (4.4%) |
| $50,000 to $74,999 | 6 (9.7%) | 44 (38.9%) |
| $75,000 to $99,999 | 4 (6.5%) | 11 (9.7%) |
| $100,000 to $149,999 | 15 (24.2%) | 24 (21.2%) |
| $150,000 or more | 5 (8.1%) | 17 (15.0%) |
| Total | 62 (100.0%) | 113 (100.0%) |
Property Value to Household Income Ratio in Accomac
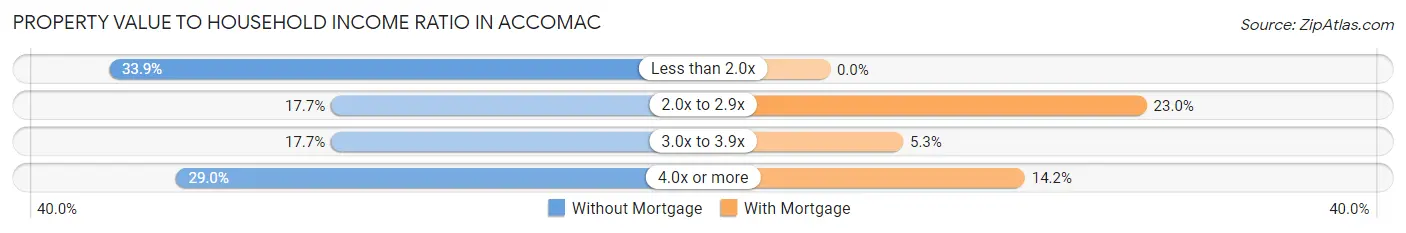
| Value-to-Income Ratio | Without Mortgage | With Mortgage |
| Less than 2.0x | 21 (33.9%) | 0 (0.0%) |
| 2.0x to 2.9x | 11 (17.7%) | 26 (23.0%) |
| 3.0x to 3.9x | 11 (17.7%) | 6 (5.3%) |
| 4.0x or more | 18 (29.0%) | 16 (14.2%) |
| Total | 62 (100.0%) | 113 (100.0%) |
Real Estate Taxes by Mortgage Status in Accomac
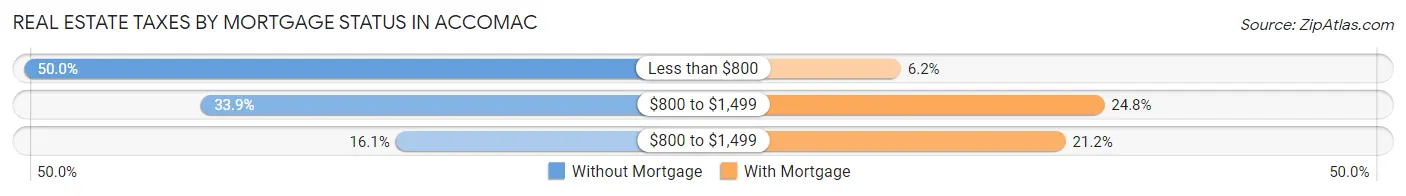
| Property Taxes | Without Mortgage | With Mortgage |
| Less than $800 | 31 (50.0%) | 7 (6.2%) |
| $800 to $1,499 | 21 (33.9%) | 28 (24.8%) |
| $800 to $1,499 | 10 (16.1%) | 24 (21.2%) |
| Total | 62 (100.0%) | 113 (100.0%) |
Health & Disability in Accomac
Health Insurance Coverage by Age in Accomac
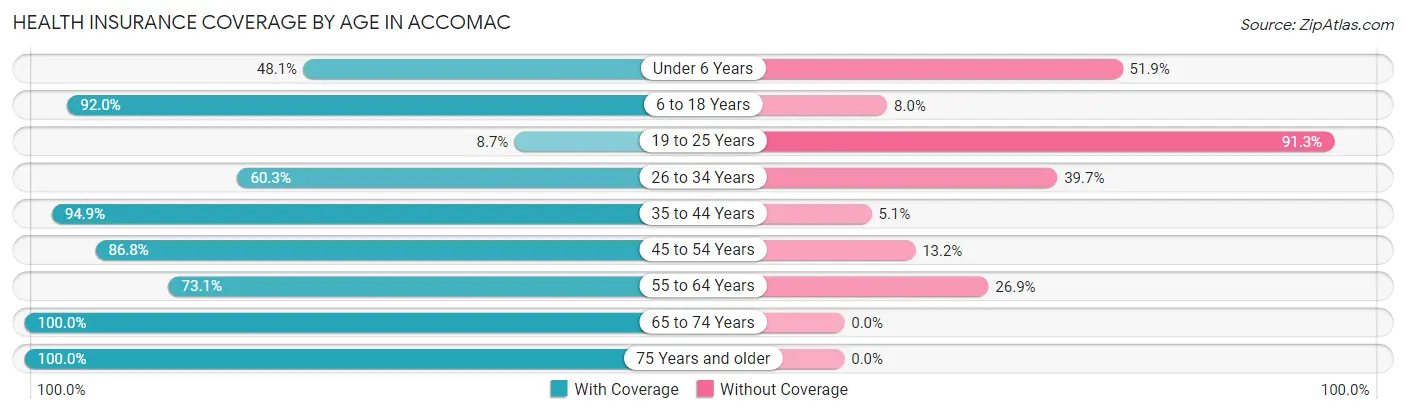
| Age Bracket | With Coverage | Without Coverage |
| Under 6 Years | 38 (48.1%) | 41 (51.9%) |
| 6 to 18 Years | 288 (92.0%) | 25 (8.0%) |
| 19 to 25 Years | 2 (8.7%) | 21 (91.3%) |
| 26 to 34 Years | 41 (60.3%) | 27 (39.7%) |
| 35 to 44 Years | 112 (94.9%) | 6 (5.1%) |
| 45 to 54 Years | 105 (86.8%) | 16 (13.2%) |
| 55 to 64 Years | 49 (73.1%) | 18 (26.9%) |
| 65 to 74 Years | 59 (100.0%) | 0 (0.0%) |
| 75 Years and older | 39 (100.0%) | 0 (0.0%) |
| Total | 733 (82.6%) | 154 (17.4%) |
Health Insurance Coverage by Citizenship Status in Accomac
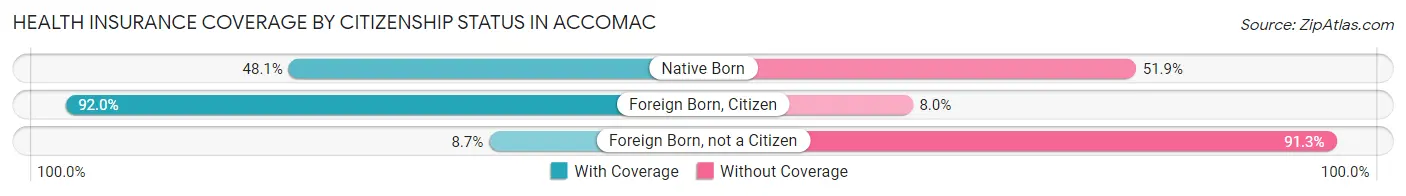
| Citizenship Status | With Coverage | Without Coverage |
| Native Born | 38 (48.1%) | 41 (51.9%) |
| Foreign Born, Citizen | 288 (92.0%) | 25 (8.0%) |
| Foreign Born, not a Citizen | 2 (8.7%) | 21 (91.3%) |
Health Insurance Coverage by Household Income in Accomac
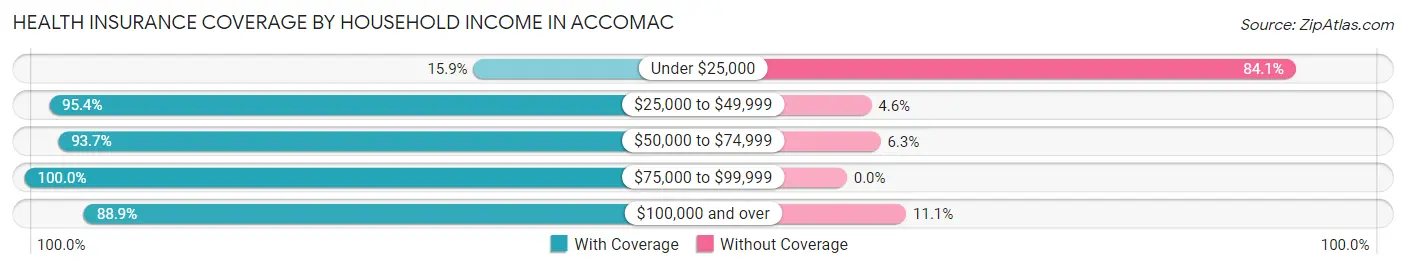
| Household Income | With Coverage | Without Coverage |
| Under $25,000 | 21 (15.9%) | 111 (84.1%) |
| $25,000 to $49,999 | 436 (95.4%) | 21 (4.6%) |
| $50,000 to $74,999 | 104 (93.7%) | 7 (6.3%) |
| $75,000 to $99,999 | 52 (100.0%) | 0 (0.0%) |
| $100,000 and over | 120 (88.9%) | 15 (11.1%) |
Public vs Private Health Insurance Coverage by Age in Accomac
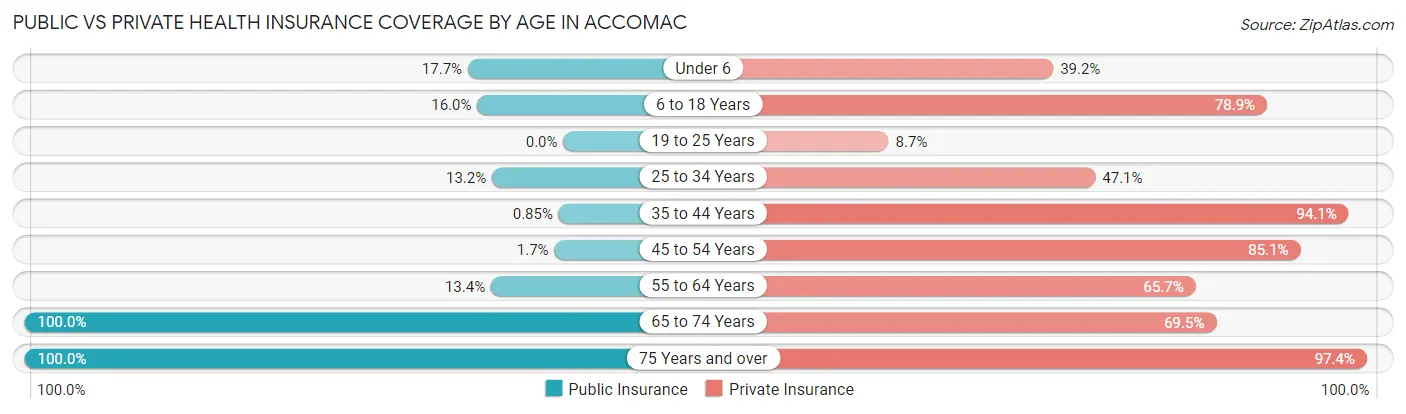
| Age Bracket | Public Insurance | Private Insurance |
| Under 6 | 14 (17.7%) | 31 (39.2%) |
| 6 to 18 Years | 50 (16.0%) | 247 (78.9%) |
| 19 to 25 Years | 0 (0.0%) | 2 (8.7%) |
| 25 to 34 Years | 9 (13.2%) | 32 (47.1%) |
| 35 to 44 Years | 1 (0.9%) | 111 (94.1%) |
| 45 to 54 Years | 2 (1.7%) | 103 (85.1%) |
| 55 to 64 Years | 9 (13.4%) | 44 (65.7%) |
| 65 to 74 Years | 59 (100.0%) | 41 (69.5%) |
| 75 Years and over | 39 (100.0%) | 38 (97.4%) |
| Total | 183 (20.6%) | 649 (73.2%) |
Disability Status by Sex by Age in Accomac
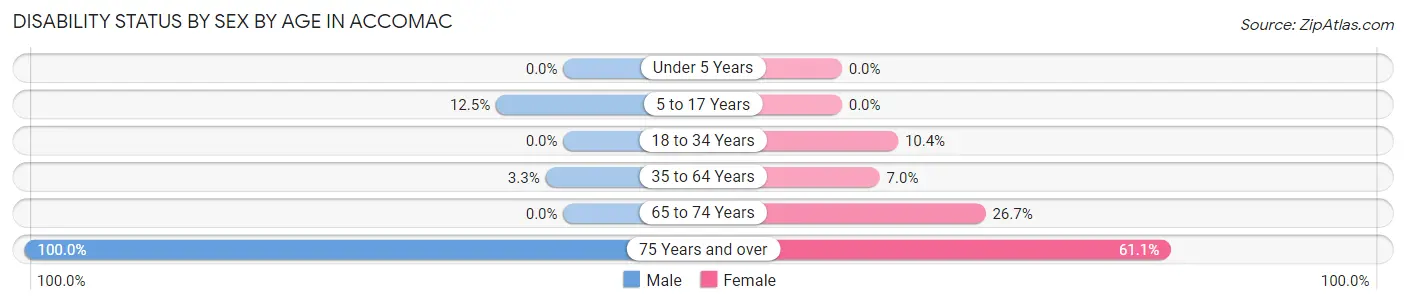
| Age Bracket | Male | Female |
| Under 5 Years | 0 (0.0%) | 0 (0.0%) |
| 5 to 17 Years | 9 (12.5%) | 0 (0.0%) |
| 18 to 34 Years | 0 (0.0%) | 5 (10.4%) |
| 35 to 64 Years | 4 (3.3%) | 13 (7.0%) |
| 65 to 74 Years | 0 (0.0%) | 8 (26.7%) |
| 75 Years and over | 21 (100.0%) | 11 (61.1%) |
Disability Class by Sex by Age in Accomac
Disability Class: Hearing Difficulty
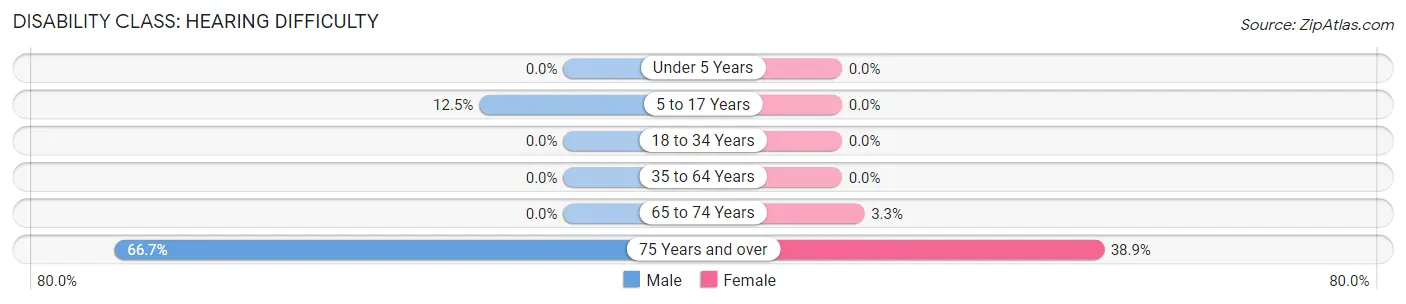
| Age Bracket | Male | Female |
| Under 5 Years | 0 (0.0%) | 0 (0.0%) |
| 5 to 17 Years | 9 (12.5%) | 0 (0.0%) |
| 18 to 34 Years | 0 (0.0%) | 0 (0.0%) |
| 35 to 64 Years | 0 (0.0%) | 0 (0.0%) |
| 65 to 74 Years | 0 (0.0%) | 1 (3.3%) |
| 75 Years and over | 14 (66.7%) | 7 (38.9%) |
Disability Class: Vision Difficulty
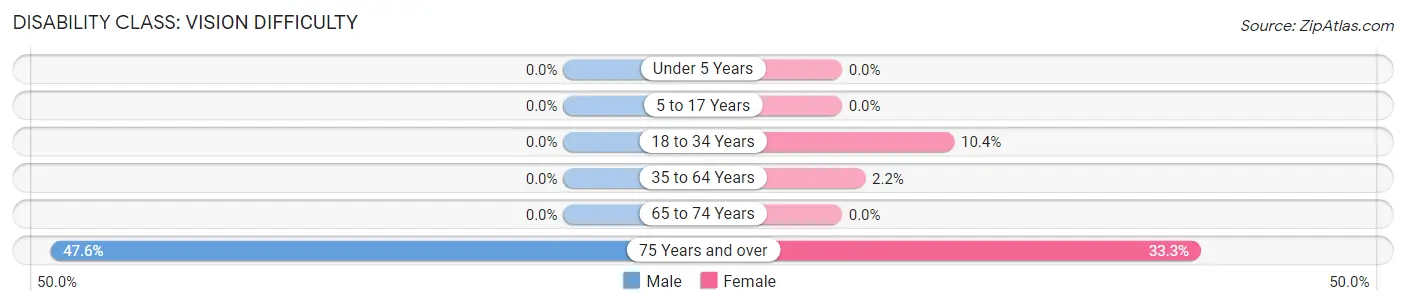
| Age Bracket | Male | Female |
| Under 5 Years | 0 (0.0%) | 0 (0.0%) |
| 5 to 17 Years | 0 (0.0%) | 0 (0.0%) |
| 18 to 34 Years | 0 (0.0%) | 5 (10.4%) |
| 35 to 64 Years | 0 (0.0%) | 4 (2.2%) |
| 65 to 74 Years | 0 (0.0%) | 0 (0.0%) |
| 75 Years and over | 10 (47.6%) | 6 (33.3%) |
Disability Class: Cognitive Difficulty
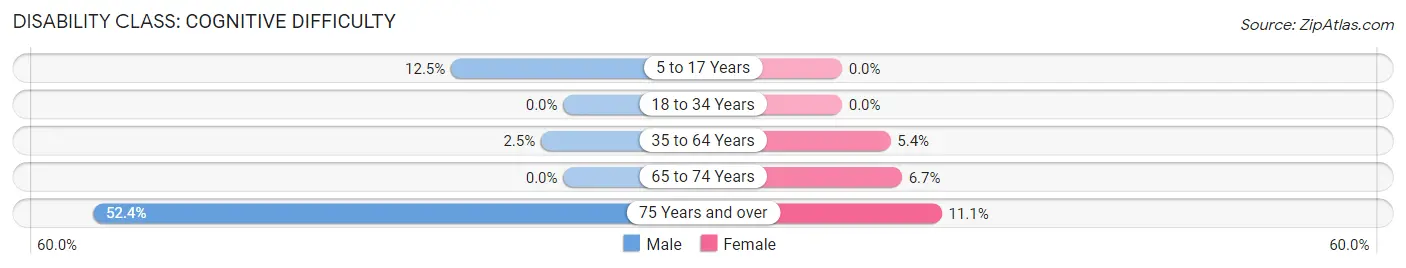
| Age Bracket | Male | Female |
| 5 to 17 Years | 9 (12.5%) | 0 (0.0%) |
| 18 to 34 Years | 0 (0.0%) | 0 (0.0%) |
| 35 to 64 Years | 3 (2.5%) | 10 (5.4%) |
| 65 to 74 Years | 0 (0.0%) | 2 (6.7%) |
| 75 Years and over | 11 (52.4%) | 2 (11.1%) |
Disability Class: Ambulatory Difficulty
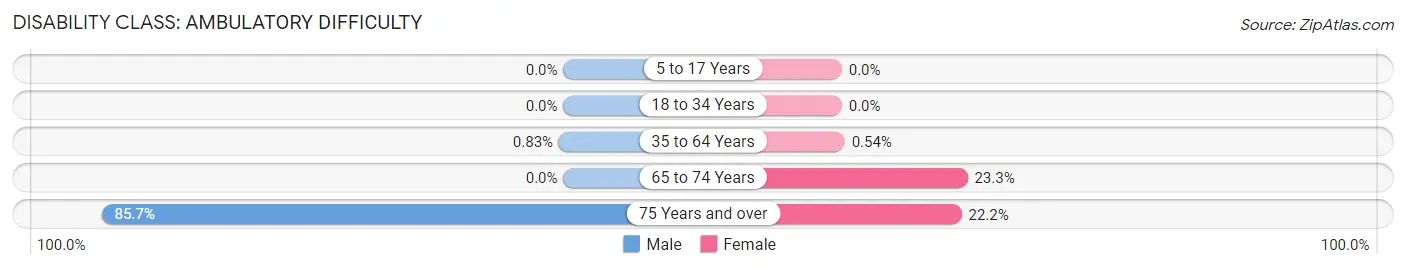
| Age Bracket | Male | Female |
| 5 to 17 Years | 0 (0.0%) | 0 (0.0%) |
| 18 to 34 Years | 0 (0.0%) | 0 (0.0%) |
| 35 to 64 Years | 1 (0.8%) | 1 (0.5%) |
| 65 to 74 Years | 0 (0.0%) | 7 (23.3%) |
| 75 Years and over | 18 (85.7%) | 4 (22.2%) |
Disability Class: Self-Care Difficulty
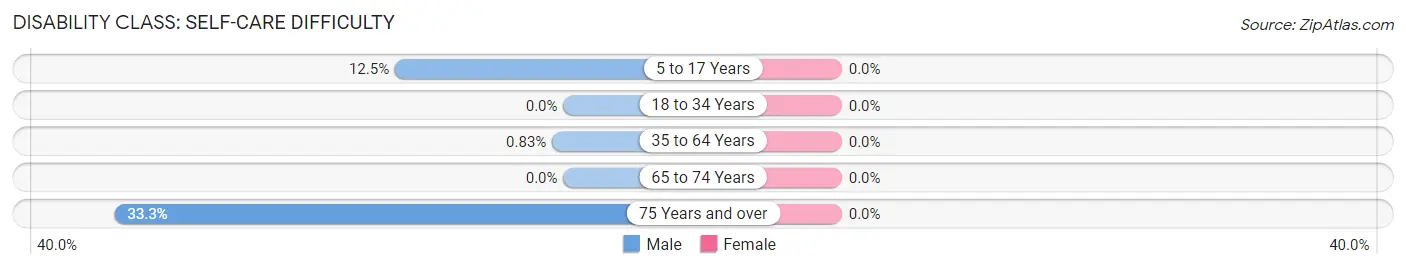
| Age Bracket | Male | Female |
| 5 to 17 Years | 9 (12.5%) | 0 (0.0%) |
| 18 to 34 Years | 0 (0.0%) | 0 (0.0%) |
| 35 to 64 Years | 1 (0.8%) | 0 (0.0%) |
| 65 to 74 Years | 0 (0.0%) | 0 (0.0%) |
| 75 Years and over | 7 (33.3%) | 0 (0.0%) |
Technology Access in Accomac
Computing Device Access in Accomac
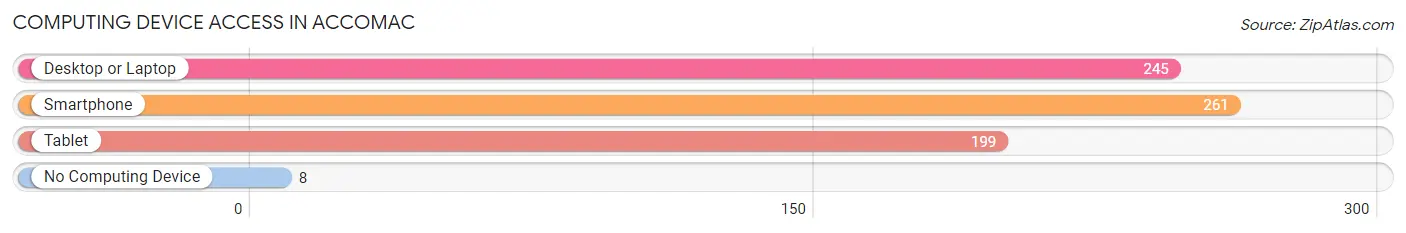
| Device Type | # Households | % Households |
| Desktop or Laptop | 245 | 80.6% |
| Smartphone | 261 | 85.9% |
| Tablet | 199 | 65.5% |
| No Computing Device | 8 | 2.6% |
| Total | 304 | 100.0% |
Internet Access in Accomac
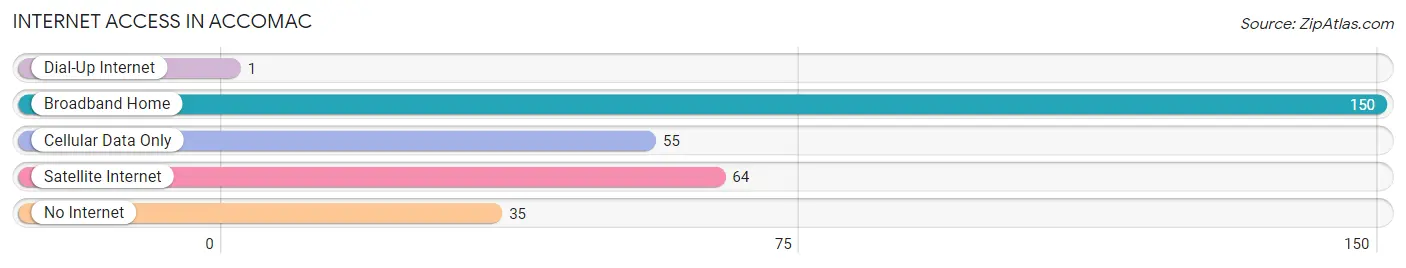
| Internet Type | # Households | % Households |
| Dial-Up Internet | 1 | 0.3% |
| Broadband Home | 150 | 49.3% |
| Cellular Data Only | 55 | 18.1% |
| Satellite Internet | 64 | 21.0% |
| No Internet | 35 | 11.5% |
| Total | 304 | 100.0% |
Accomac Summary
Accomac is a small town located in Accomack County, Virginia, United States. It is situated on the Eastern Shore of the Chesapeake Bay, approximately 50 miles south of the state capital of Richmond. The population of Accomac was 1,769 at the 2010 census.
History
Accomac was first settled in 1663 by English colonists from the Virginia Company of London. The town was named after the Accomack Indians, who were the original inhabitants of the area. The town was incorporated in 1742 and was the county seat of Accomack County until 1867, when the county seat was moved to nearby Onancock.
Accomac was an important port in the 18th and 19th centuries, and was a major center for the production of seafood, including oysters, crabs, and fish. The town was also a major center for the production of agricultural products, including corn, wheat, and tobacco.
Geography
Accomac is located at 37°45'N 75°45'W (37.75, -75.75). It is situated on the Eastern Shore of the Chesapeake Bay, approximately 50 miles south of the state capital of Richmond. The town is bordered by the towns of Onancock to the north, Parksley to the east, and Painter to the south.
The town has a total area of 0.9 square miles, all of which is land. The terrain is generally flat, with some rolling hills. The climate is humid subtropical, with hot, humid summers and mild winters.
Economy
The economy of Accomac is largely based on agriculture and seafood production. The town is home to several large farms, which produce corn, wheat, and tobacco. The town is also a major center for the production of seafood, including oysters, crabs, and fish.
In addition to agriculture and seafood production, Accomac is home to several small businesses, including restaurants, retail stores, and service providers. The town is also home to a number of tourist attractions, including the Accomack County Historical Society Museum and the Eastern Shore of Virginia National Wildlife Refuge.
Demographics
As of the 2010 census, there were 1,769 people, 745 households, and 463 families residing in Accomac. The population density was 1,945.3 people per square mile. The racial makeup of the town was 79.2% White, 17.3% African American, 0.3% Native American, 0.7% Asian, 0.1% Pacific Islander, 0.7% from other races, and 1.7% from two or more races. Hispanic or Latino of any race were 2.2% of the population.
The median income for a household in Accomac was $37,917, and the median income for a family was $45,625. Males had a median income of $31,250 versus $25,000 for females. The per capita income for the town was $18,945. About 11.2% of families and 14.2% of the population were below the poverty line, including 19.2% of those under age 18 and 8.3% of those age 65 or over.
Common Questions
What is Per Capita Income in Accomac?
Per Capita income in Accomac is $19,560.
What is the Median Family Income in Accomac?
Median Family Income in Accomac is $48,750.
What is the Median Household income in Accomac?
Median Household Income in Accomac is $41,304.
What is Income or Wage Gap in Accomac?
Income or Wage Gap in Accomac is 28.4%.
Women in Accomac earn 71.6 cents for every dollar earned by a man.
What is Inequality or Gini Index in Accomac?
Inequality or Gini Index in Accomac is 0.38.
What is the Total Population of Accomac?
Total Population of Accomac is 981.
What is the Total Male Population of Accomac?
Total Male Population of Accomac is 420.
What is the Total Female Population of Accomac?
Total Female Population of Accomac is 561.
What is the Ratio of Males per 100 Females in Accomac?
There are 74.87 Males per 100 Females in Accomac.
What is the Ratio of Females per 100 Males in Accomac?
There are 133.57 Females per 100 Males in Accomac.
What is the Median Population Age in Accomac?
Median Population Age in Accomac is 30.9 Years.
What is the Average Family Size in Accomac
Average Family Size in Accomac is 4.5 People.
What is the Average Household Size in Accomac
Average Household Size in Accomac is 2.9 People.
How Large is the Labor Force in Accomac?
There are 363 People in the Labor Forcein in Accomac.
What is the Percentage of People in the Labor Force in Accomac?
53.1% of People are in the Labor Force in Accomac.
What is the Unemployment Rate in Accomac?
Unemployment Rate in Accomac is 1.9%.