Zip Codes with the Highest Percentage of Population Employed in Security & Protection in West Valley City, UT
RELATED REPORTS & OPTIONS
Security & Protection
West Valley City
Compare Zip Codes
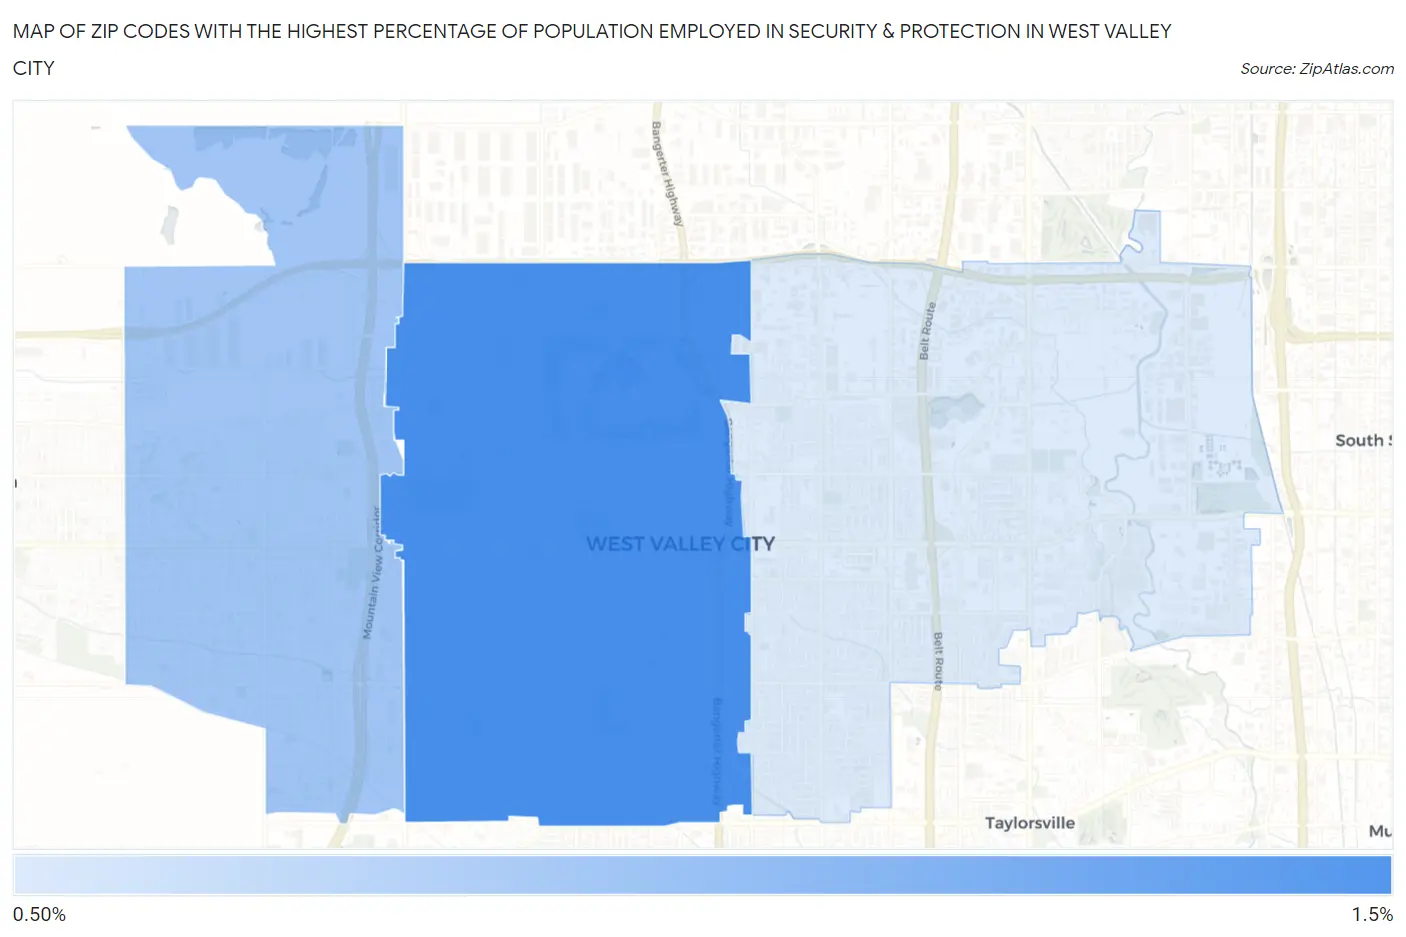
Map of Zip Codes with the Highest Percentage of Population Employed in Security & Protection in West Valley City
0.81%
1.4%
Zip Codes with the Highest Percentage of Population Employed in Security & Protection in West Valley City, UT
| Zip Code | % Employed | vs State | vs National | |
| 1. | 84120 | 1.4% | 1.6%(-0.224)#134 | 2.1%(-0.758)#17,025 |
| 2. | 84128 | 1.0% | 1.6%(-0.572)#169 | 2.1%(-1.11)#19,719 |
| 3. | 84119 | 0.81% | 1.6%(-0.804)#182 | 2.1%(-1.34)#21,356 |
1
Common Questions
What are the Top Zip Codes with the Highest Percentage of Population Employed in Security & Protection in West Valley City, UT?
Top Zip Codes with the Highest Percentage of Population Employed in Security & Protection in West Valley City, UT are:
What zip code has the Highest Percentage of Population Employed in Security & Protection in West Valley City, UT?
84120 has the Highest Percentage of Population Employed in Security & Protection in West Valley City, UT with 1.4%.
What is the Percentage of Population Employed in Security & Protection in West Valley City, UT?
Percentage of Population Employed in Security & Protection in West Valley City is 1.0%.
What is the Percentage of Population Employed in Security & Protection in Utah?
Percentage of Population Employed in Security & Protection in Utah is 1.6%.
What is the Percentage of Population Employed in Security & Protection in the United States?
Percentage of Population Employed in Security & Protection in the United States is 2.1%.