Zip Codes with the Highest Percentage of Population Employed in Administrative & Support Services in West Valley City, UT
RELATED REPORTS & OPTIONS
Administrative & Support Services
West Valley City
Compare Zip Codes
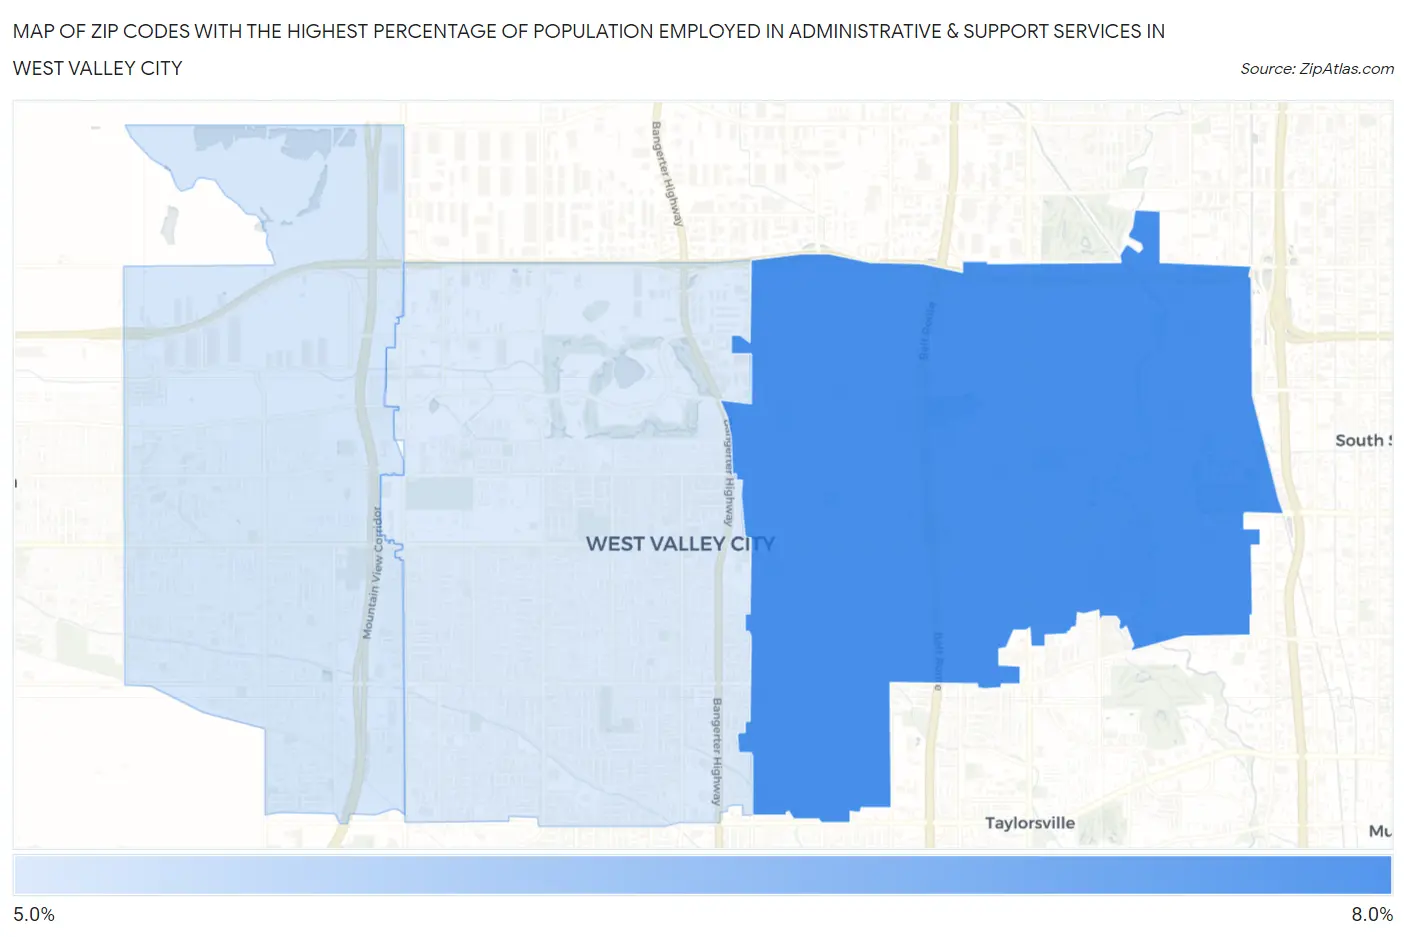
Map of Zip Codes with the Highest Percentage of Population Employed in Administrative & Support Services in West Valley City
5.4%
6.3%
Zip Codes with the Highest Percentage of Population Employed in Administrative & Support Services in West Valley City, UT
| Zip Code | % Employed | vs State | vs National | |
| 1. | 84119 | 6.3% | 4.3%(+2.05)#36 | 4.1%(+2.19)#4,175 |
| 2. | 84128 | 5.5% | 4.3%(+1.19)#52 | 4.1%(+1.33)#5,890 |
| 3. | 84120 | 5.4% | 4.3%(+1.14)#53 | 4.1%(+1.28)#5,996 |
1
Common Questions
What are the Top Zip Codes with the Highest Percentage of Population Employed in Administrative & Support Services in West Valley City, UT?
Top Zip Codes with the Highest Percentage of Population Employed in Administrative & Support Services in West Valley City, UT are:
What zip code has the Highest Percentage of Population Employed in Administrative & Support Services in West Valley City, UT?
84119 has the Highest Percentage of Population Employed in Administrative & Support Services in West Valley City, UT with 6.3%.
What is the Percentage of Population Employed in Administrative & Support Services in West Valley City, UT?
Percentage of Population Employed in Administrative & Support Services in West Valley City is 5.7%.
What is the Percentage of Population Employed in Administrative & Support Services in Utah?
Percentage of Population Employed in Administrative & Support Services in Utah is 4.3%.
What is the Percentage of Population Employed in Administrative & Support Services in the United States?
Percentage of Population Employed in Administrative & Support Services in the United States is 4.1%.