Zip Codes with the Highest Percentage of Population with a Degree in Liberal Arts and History in West Valley City, UT
RELATED REPORTS & OPTIONS
Liberal Arts and History
West Valley City
Compare Zip Codes
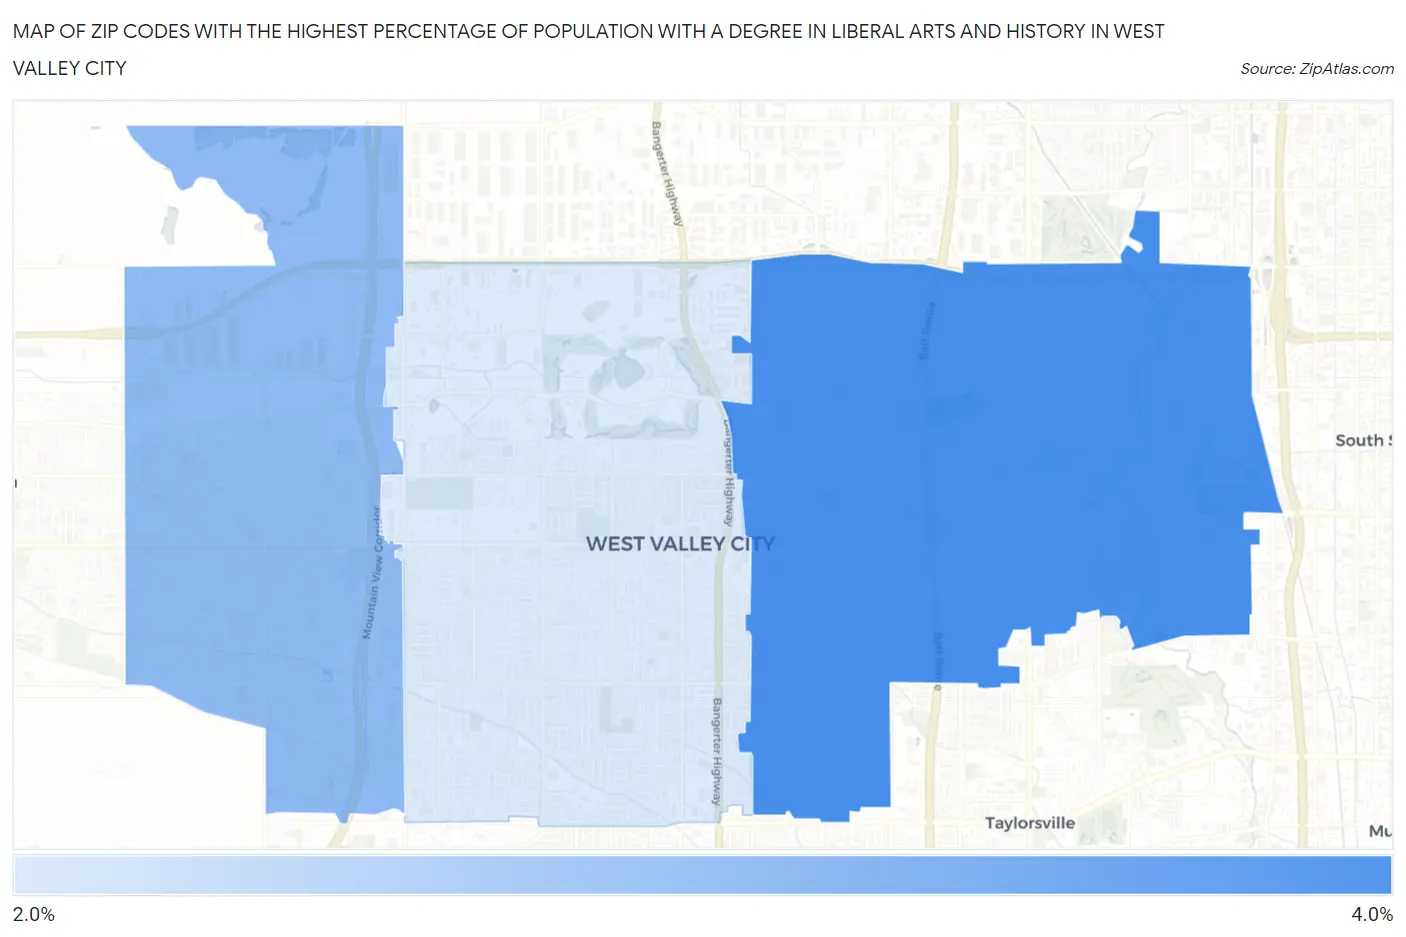
Map of Zip Codes with the Highest Percentage of Population with a Degree in Liberal Arts and History in West Valley City
2.6%
3.6%
Zip Codes with the Highest Percentage of Population with a Degree in Liberal Arts and History in West Valley City, UT
| Zip Code | % Graduates | vs State | vs National | |
| 1. | 84119 | 3.6% | 3.3%(+0.236)#83 | 4.9%(-1.32)#16,397 |
| 2. | 84128 | 3.1% | 3.3%(-0.229)#104 | 4.9%(-1.78)#18,039 |
| 3. | 84120 | 2.6% | 3.3%(-0.733)#137 | 4.9%(-2.29)#19,701 |
1
Common Questions
What are the Top Zip Codes with the Highest Percentage of Population with a Degree in Liberal Arts and History in West Valley City, UT?
Top Zip Codes with the Highest Percentage of Population with a Degree in Liberal Arts and History in West Valley City, UT are:
What zip code has the Highest Percentage of Population with a Degree in Liberal Arts and History in West Valley City, UT?
84119 has the Highest Percentage of Population with a Degree in Liberal Arts and History in West Valley City, UT with 3.6%.
What is the Percentage of Population with a Degree in Liberal Arts and History in West Valley City, UT?
Percentage of Population with a Degree in Liberal Arts and History in West Valley City is 3.3%.
What is the Percentage of Population with a Degree in Liberal Arts and History in Utah?
Percentage of Population with a Degree in Liberal Arts and History in Utah is 3.3%.
What is the Percentage of Population with a Degree in Liberal Arts and History in the United States?
Percentage of Population with a Degree in Liberal Arts and History in the United States is 4.9%.