Zip Codes with the Highest Percentage of Population Employed in Security & Protection in Sandy, UT
RELATED REPORTS & OPTIONS
Security & Protection
Sandy
Compare Zip Codes
Map of Zip Codes with the Highest Percentage of Population Employed in Security & Protection in Sandy
1.00%
2.4%
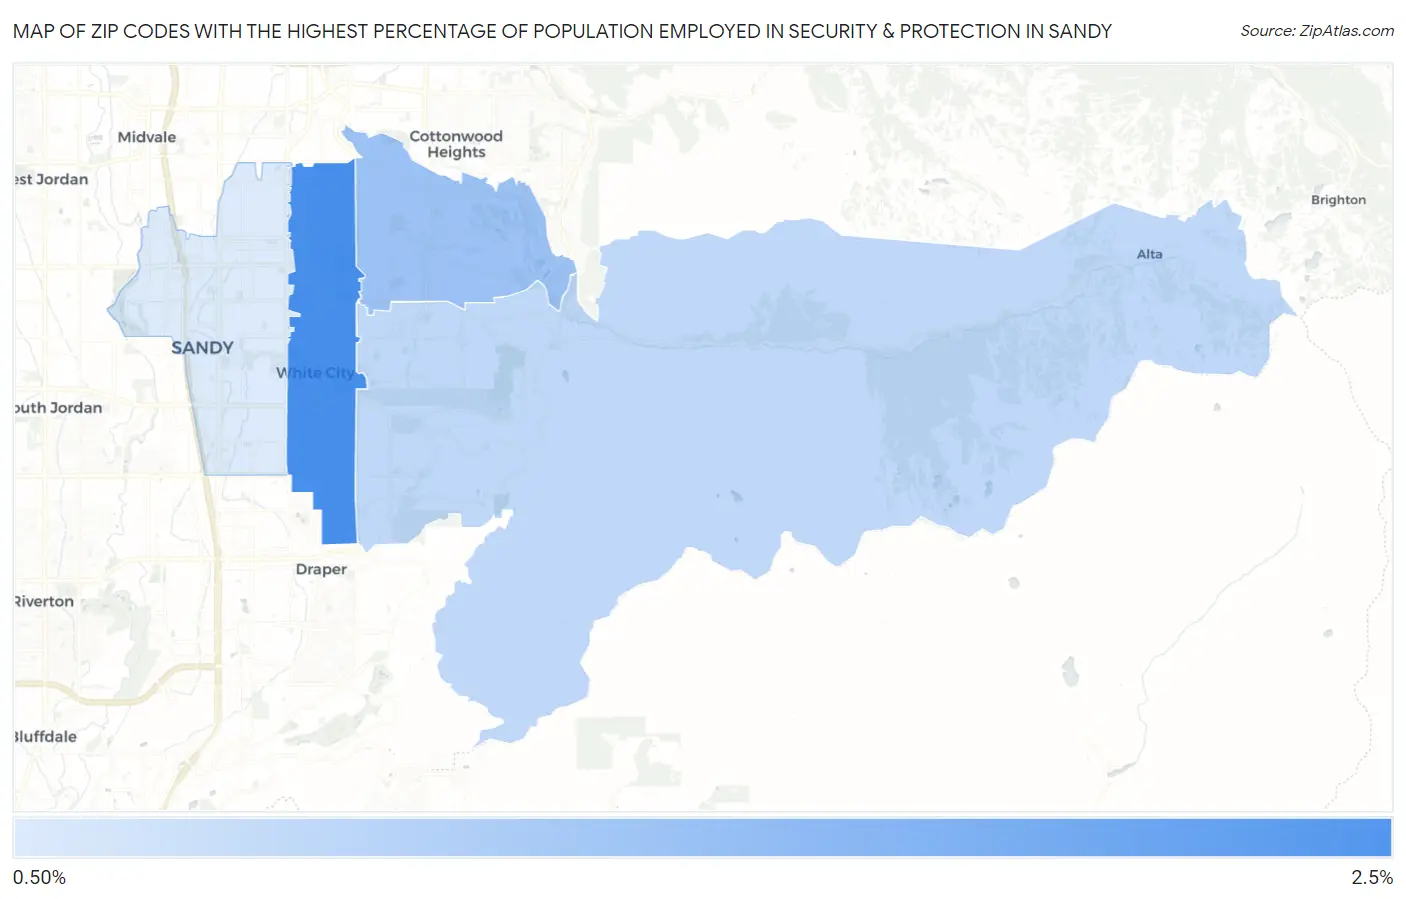
Zip Codes with the Highest Percentage of Population Employed in Security & Protection in Sandy, UT
| Zip Code | % Employed | vs State | vs National | |
| 1. | 84094 | 2.4% | 1.6%(+0.814)#70 | 2.1%(+0.280)#9,914 |
| 2. | 84093 | 1.6% | 1.6%(-0.007)#121 | 2.1%(-0.541)#15,362 |
| 3. | 84092 | 1.3% | 1.6%(-0.322)#145 | 2.1%(-0.857)#17,808 |
| 4. | 84070 | 1.00% | 1.6%(-0.616)#172 | 2.1%(-1.15)#20,054 |
1
Common Questions
What are the Top 3 Zip Codes with the Highest Percentage of Population Employed in Security & Protection in Sandy, UT?
Top 3 Zip Codes with the Highest Percentage of Population Employed in Security & Protection in Sandy, UT are:
What zip code has the Highest Percentage of Population Employed in Security & Protection in Sandy, UT?
84094 has the Highest Percentage of Population Employed in Security & Protection in Sandy, UT with 2.4%.
What is the Percentage of Population Employed in Security & Protection in Sandy, UT?
Percentage of Population Employed in Security & Protection in Sandy is 1.4%.
What is the Percentage of Population Employed in Security & Protection in Utah?
Percentage of Population Employed in Security & Protection in Utah is 1.6%.
What is the Percentage of Population Employed in Security & Protection in the United States?
Percentage of Population Employed in Security & Protection in the United States is 2.1%.