Zip Codes with the Highest Percentage of Households Heated by Bottled Gas / Liquid Propane in West Valley City, UT

RELATED REPORTS & OPTIONS

Bottled Gas / LP Heating
Population
Families and Households
Female Fertility
Female Fertility (Unmarried)
Race (Community Size)
Race (Percentage)
Ancestry (Community Size)
AfricanAmericanApacheArabArgentineanArmenianAustrianBasqueBelgianBhutaneseBlackfeetBolivianBrazilianBritishBurmeseCanadianCentral AmericanCentral American IndianCherokeeChileanChippewaChoctawColombianCosta RicanCroatianCubanCzechDanishDominicanDutchEastern EuropeanEcuadorianEgyptianEnglishEuropeanFijianFinnishFrenchFrench CanadianGermanGreekGuamanian / ChamorroGuatemalanHonduranHungarianIndian (Asian)IndonesianIrishItalianJapaneseKenyanKoreanLithuanianLuxembourgerMalaysianMexicanMexican American IndianNative HawaiianNavajoNicaraguanNorthern EuropeanNorwegianPakistaniPeruvianPolishPortuguesePuebloPuerto RicanRussianSalvadoranSamoanScandinavianScotch-IrishScottishSerbianSiouxSlovakSloveneSomaliSouth AmericanSouth American IndianSpaniardSpanishSpanish AmericanSri LankanSubsaharan AfricanSudaneseSwedishSwissThaiTonganUkrainianVenezuelanWelshYugoslavian
Ancestry (Percentage)
AfricanAmericanApacheArabArgentineanArmenianAustrianBasqueBelgianBhutaneseBlackfeetBolivianBrazilianBritishBurmeseCanadianCentral AmericanCentral American IndianCherokeeChileanChippewaChoctawColombianCosta RicanCroatianCubanCzechDanishDominicanDutchEastern EuropeanEcuadorianEgyptianEnglishEuropeanFijianFinnishFrenchFrench CanadianGermanGreekGuamanian / ChamorroGuatemalanHonduranHungarianIndian (Asian)IndonesianIrishItalianJapaneseKenyanKoreanLithuanianLuxembourgerMalaysianMexicanMexican American IndianNative HawaiianNavajoNicaraguanNorthern EuropeanNorwegianPakistaniPeruvianPolishPortuguesePuebloPuerto RicanRussianSalvadoranSamoanScandinavianScotch-IrishScottishSerbianSiouxSlovakSloveneSomaliSouth AmericanSouth American IndianSpaniardSpanishSpanish AmericanSri LankanSubsaharan AfricanSudaneseSwedishSwissThaiTonganUkrainianVenezuelanWelshYugoslavian
Immigrant Origin (Total)
Immigrant Origin (Percentage)
Income
Income (Families)
Income (Households)
Poverty
Poverty (Families)
Unemployment
Employment Occupations
Employment Industries
Employer Class
Commute Time
Commute Means
School Enrollment
Education by Degree Field
Occupancy
Finances
Physical Characteristics
West Valley City
Compare Zip Codes
Comparison Subject

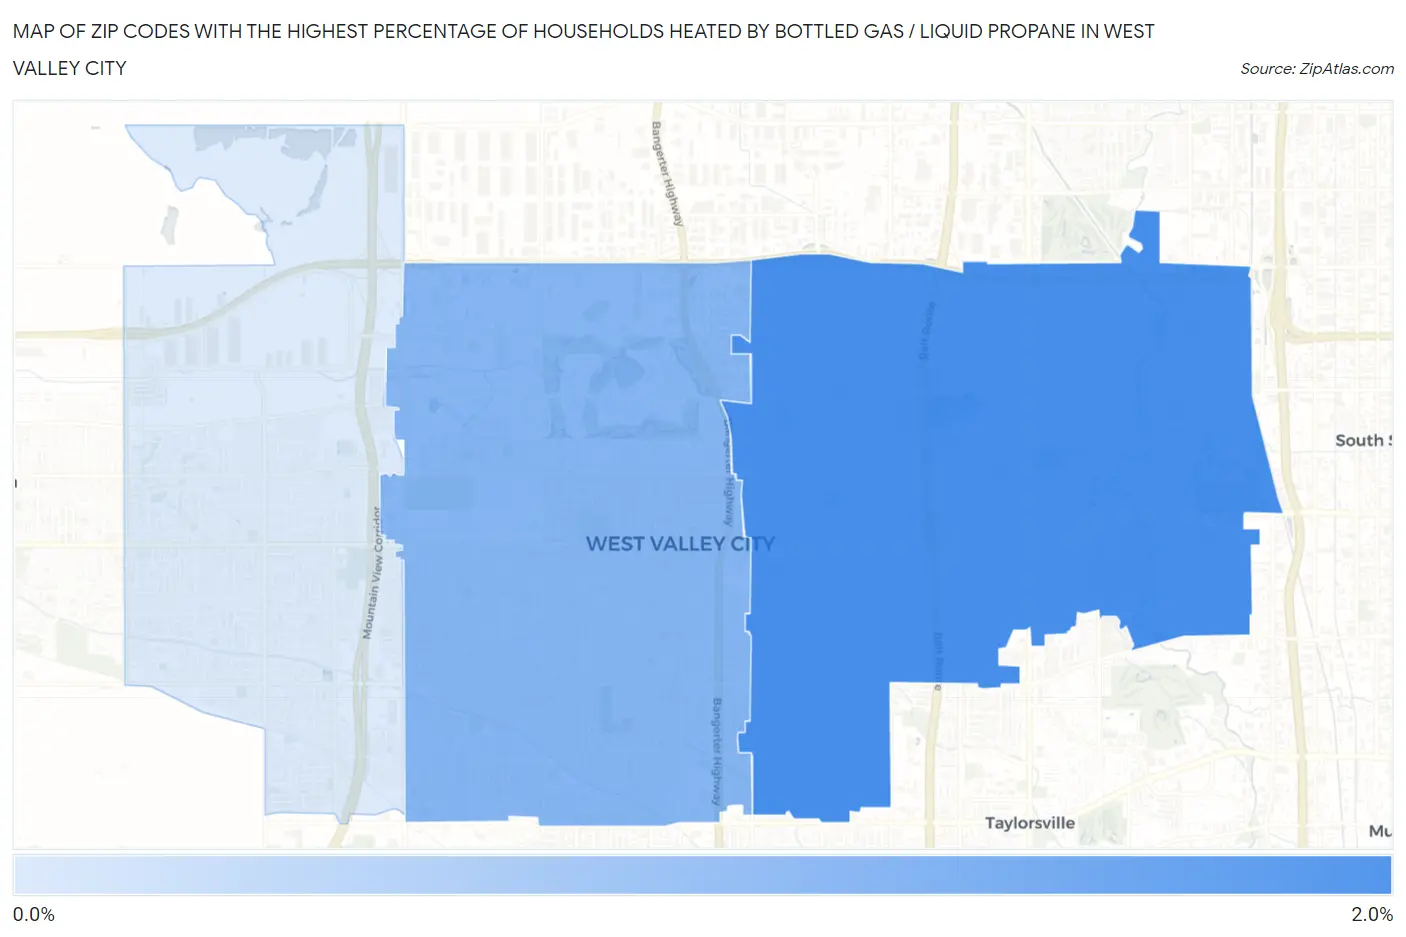
Map of Zip Codes with the Highest Percentage of Households Heated by Bottled Gas / Liquid Propane in West Valley City

0.0%
2.0%
Zip Codes with the Highest Percentage of Households Heated by Bottled Gas / Liquid Propane in West Valley City Map

Zip Codes with the Highest Percentage of Households Heated by Bottled Gas / Liquid Propane in West Valley City, UT

Zip Code Bottled Gas / LP Heating vs State vs National
1.841191.9%2.4%(-0.500)#1664.9%(-3.00)#23,380
2.841201.4%2.4%(-1.00)#1874.9%(-3.50)#24,985
3.841280.70%2.4%(-1.70)#2254.9%(-4.20)#27,846

Common Questions

What are the Top Zip Codes with the Highest Percentage of Households Heated by Bottled Gas / Liquid Propane in West Valley City, UT?
Top Zip Codes with the Highest Percentage of Households Heated by Bottled Gas / Liquid Propane in West Valley City, UT are:
#1
1.9%
#2
1.4%
#3
0.70%
What zip code has the Highest Percentage of Households Heated by Bottled Gas / Liquid Propane in West Valley City, UT?
84119 has the Highest Percentage of Households Heated by Bottled Gas / Liquid Propane in West Valley City, UT with 1.9%.
What is the Percentage of Households Heated by Bottled Gas / Liquid Propane in West Valley City, UT?
Percentage of Households Heated by Bottled Gas / Liquid Propane in West Valley City is 1.4%.
What is the Percentage of Households Heated by Bottled Gas / Liquid Propane in Utah?
Percentage of Households Heated by Bottled Gas / Liquid Propane in Utah is 2.4%.
What is the Percentage of Households Heated by Bottled Gas / Liquid Propane in the United States?
Percentage of Households Heated by Bottled Gas / Liquid Propane in the United States is 4.9%.