Zip Codes with the Highest Percentage of Population Employed in Farming, Fishing & Forestry in West Valley City, UT
RELATED REPORTS & OPTIONS
Farming, Fishing & Forestry
West Valley City
Compare Zip Codes
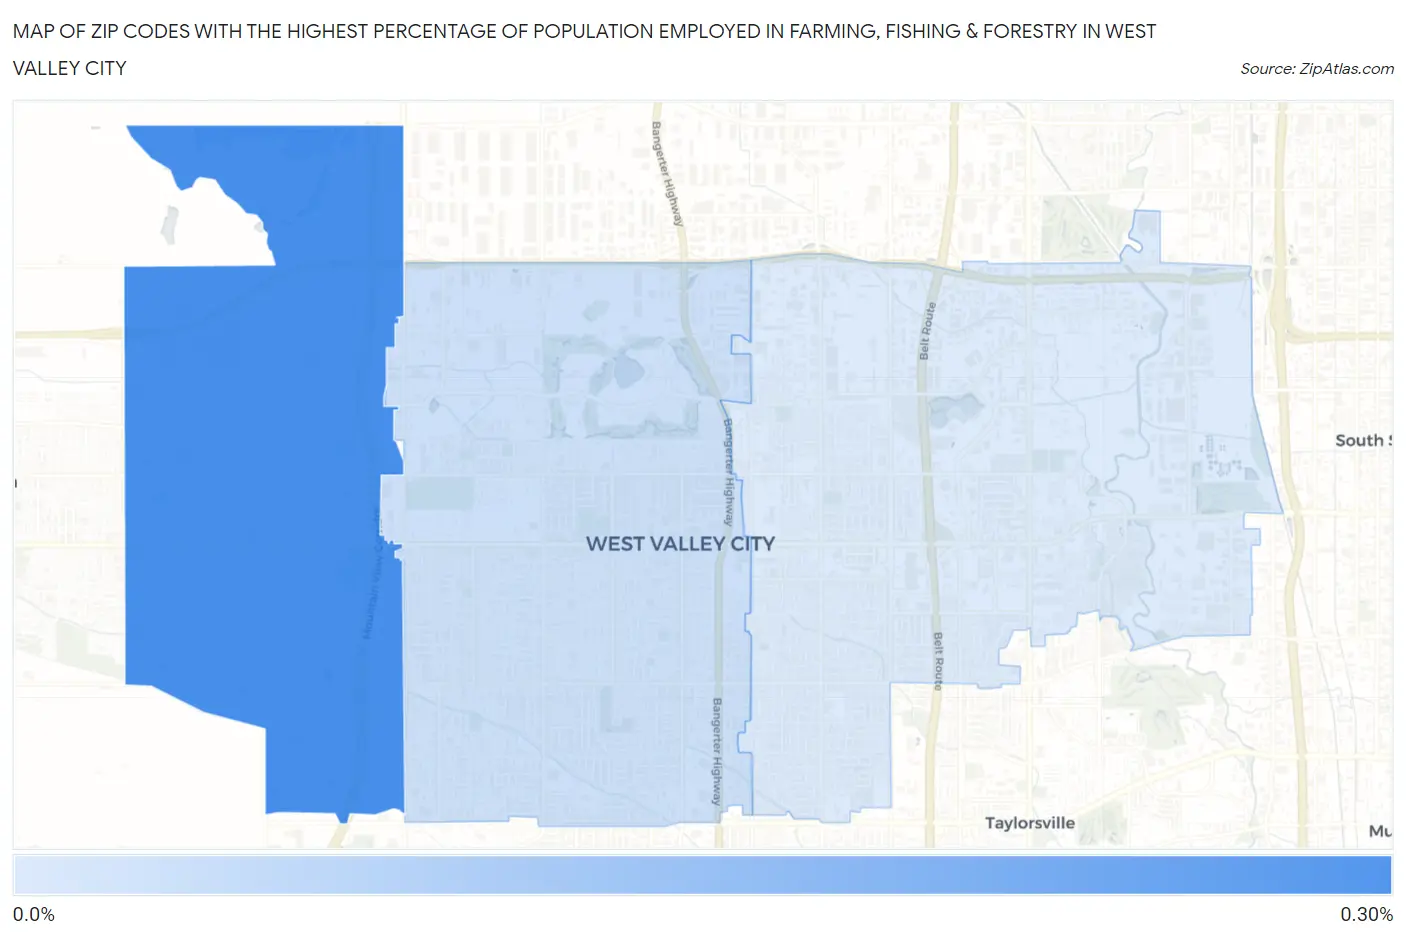
Map of Zip Codes with the Highest Percentage of Population Employed in Farming, Fishing & Forestry in West Valley City
0.050%
0.27%
Zip Codes with the Highest Percentage of Population Employed in Farming, Fishing & Forestry in West Valley City, UT
| Zip Code | % Employed | vs State | vs National | |
| 1. | 84128 | 0.27% | 0.32%(-0.056)#121 | 0.61%(-0.339)#15,204 |
| 2. | 84120 | 0.075% | 0.32%(-0.248)#141 | 0.61%(-0.531)#18,219 |
| 3. | 84119 | 0.050% | 0.32%(-0.273)#148 | 0.61%(-0.555)#18,657 |
1
Common Questions
What are the Top Zip Codes with the Highest Percentage of Population Employed in Farming, Fishing & Forestry in West Valley City, UT?
Top Zip Codes with the Highest Percentage of Population Employed in Farming, Fishing & Forestry in West Valley City, UT are:
What zip code has the Highest Percentage of Population Employed in Farming, Fishing & Forestry in West Valley City, UT?
84128 has the Highest Percentage of Population Employed in Farming, Fishing & Forestry in West Valley City, UT with 0.27%.
What is the Percentage of Population Employed in Farming, Fishing & Forestry in West Valley City, UT?
Percentage of Population Employed in Farming, Fishing & Forestry in West Valley City is 0.11%.
What is the Percentage of Population Employed in Farming, Fishing & Forestry in Utah?
Percentage of Population Employed in Farming, Fishing & Forestry in Utah is 0.32%.
What is the Percentage of Population Employed in Farming, Fishing & Forestry in the United States?
Percentage of Population Employed in Farming, Fishing & Forestry in the United States is 0.61%.