Yup'ik vs Immigrants from Guyana Unemployment Among Ages 35 to 44 years
COMPARE
Yup'ik
Immigrants from Guyana
Unemployment Among Ages 35 to 44 years
Unemployment Among Ages 35 to 44 years Comparison
Yup'ik
Immigrants from Guyana
14.4%
UNEMPLOYMENT AMONG AGES 35 TO 44 YEARS
0.0/ 100
METRIC RATING
345th/ 347
METRIC RANK
6.0%
UNEMPLOYMENT AMONG AGES 35 TO 44 YEARS
0.0/ 100
METRIC RATING
312th/ 347
METRIC RANK
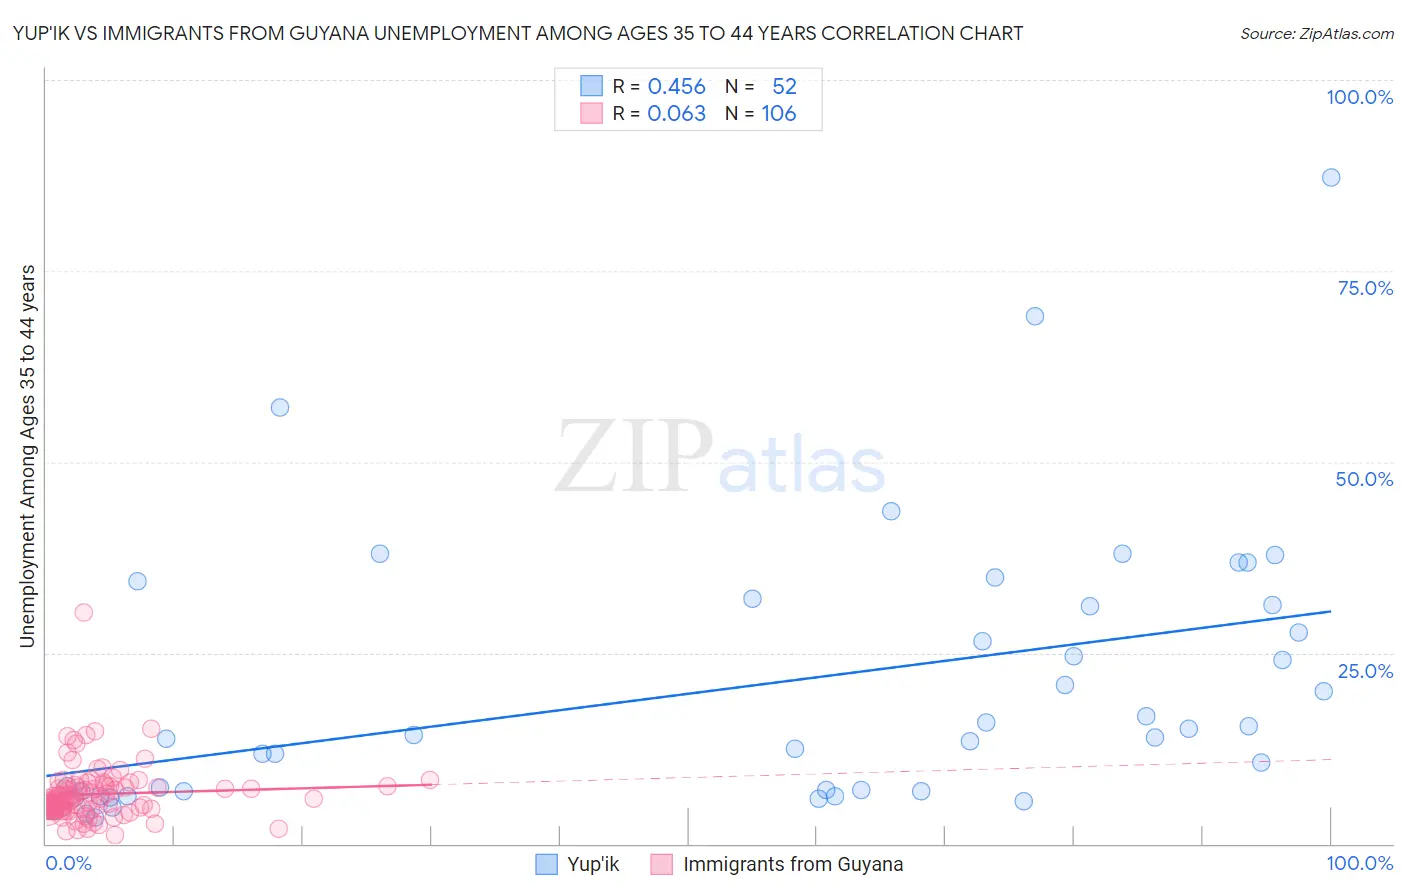
Yup'ik vs Immigrants from Guyana Unemployment Among Ages 35 to 44 years Correlation Chart
The statistical analysis conducted on geographies consisting of 39,745,943 people shows a moderate positive correlation between the proportion of Yup'ik and unemployment rate among population between the ages 35 and 44 in the United States with a correlation coefficient (R) of 0.456 and weighted average of 14.4%. Similarly, the statistical analysis conducted on geographies consisting of 182,093,178 people shows a slight positive correlation between the proportion of Immigrants from Guyana and unemployment rate among population between the ages 35 and 44 in the United States with a correlation coefficient (R) of 0.063 and weighted average of 6.0%, a difference of 141.9%.
Unemployment Among Ages 35 to 44 years Correlation Summary
| Measurement | Yup'ik | Immigrants from Guyana |
| Minimum | 3.5% | 1.2% |
| Maximum | 87.2% | 30.3% |
| Range | 83.8% | 29.1% |
| Mean | 19.9% | 6.5% |
| Median | 13.8% | 5.7% |
| Interquartile 25% (IQ1) | 6.6% | 4.6% |
| Interquartile 75% (IQ3) | 31.2% | 7.5% |
| Interquartile Range (IQR) | 24.6% | 2.9% |
| Standard Deviation (Sample) | 17.6% | 3.7% |
| Standard Deviation (Population) | 17.5% | 3.6% |
Similar Demographics by Unemployment Among Ages 35 to 44 years
Demographics Similar to Yup'ik by Unemployment Among Ages 35 to 44 years
In terms of unemployment among ages 35 to 44 years, the demographic groups most similar to Yup'ik are Crow (15.7%, a difference of 8.8%), Yuman (16.9%, a difference of 17.2%), Pima (11.8%, a difference of 22.8%), Arapaho (10.3%, a difference of 40.3%), and Navajo (9.3%, a difference of 54.6%).
| Demographics | Rating | Rank | Unemployment Among Ages 35 to 44 years |
| Puerto Ricans | 0.0 /100 | #333 | Tragic 7.6% |
| Houma | 0.0 /100 | #334 | Tragic 7.8% |
| Sioux | 0.0 /100 | #335 | Tragic 8.4% |
| Apache | 0.0 /100 | #336 | Tragic 8.4% |
| Tohono O'odham | 0.0 /100 | #337 | Tragic 8.4% |
| Cheyenne | 0.0 /100 | #338 | Tragic 8.5% |
| Inupiat | 0.0 /100 | #339 | Tragic 8.6% |
| Alaskan Athabascans | 0.0 /100 | #340 | Tragic 8.6% |
| Hopi | 0.0 /100 | #341 | Tragic 8.9% |
| Navajo | 0.0 /100 | #342 | Tragic 9.3% |
| Arapaho | 0.0 /100 | #343 | Tragic 10.3% |
| Pima | 0.0 /100 | #344 | Tragic 11.8% |
| Yup'ik | 0.0 /100 | #345 | Tragic 14.4% |
| Crow | 0.0 /100 | #346 | Tragic 15.7% |
| Yuman | 0.0 /100 | #347 | Tragic 16.9% |
Demographics Similar to Immigrants from Guyana by Unemployment Among Ages 35 to 44 years
In terms of unemployment among ages 35 to 44 years, the demographic groups most similar to Immigrants from Guyana are British West Indian (6.0%, a difference of 0.12%), Immigrants from Dominica (6.0%, a difference of 0.49%), Marshallese (5.9%, a difference of 1.1%), Guyanese (5.9%, a difference of 1.4%), and Black/African American (6.1%, a difference of 2.3%).
| Demographics | Rating | Rank | Unemployment Among Ages 35 to 44 years |
| Belizeans | 0.0 /100 | #305 | Tragic 5.7% |
| Barbadians | 0.0 /100 | #306 | Tragic 5.7% |
| Immigrants | Belize | 0.0 /100 | #307 | Tragic 5.8% |
| Immigrants | Azores | 0.0 /100 | #308 | Tragic 5.8% |
| Immigrants | Barbados | 0.0 /100 | #309 | Tragic 5.8% |
| Guyanese | 0.0 /100 | #310 | Tragic 5.9% |
| Marshallese | 0.0 /100 | #311 | Tragic 5.9% |
| Immigrants | Guyana | 0.0 /100 | #312 | Tragic 6.0% |
| British West Indians | 0.0 /100 | #313 | Tragic 6.0% |
| Immigrants | Dominica | 0.0 /100 | #314 | Tragic 6.0% |
| Blacks/African Americans | 0.0 /100 | #315 | Tragic 6.1% |
| Tsimshian | 0.0 /100 | #316 | Tragic 6.2% |
| Immigrants | St. Vincent and the Grenadines | 0.0 /100 | #317 | Tragic 6.2% |
| Colville | 0.0 /100 | #318 | Tragic 6.2% |
| Immigrants | Grenada | 0.0 /100 | #319 | Tragic 6.2% |