Yup'ik vs Immigrants from Ghana Unemployment Among Ages 35 to 44 years

COMPARE

Yup'ik
Race
Ancestry
AfghanAfricanAlaska NativeAlaskan AthabascanAlbanianAleutAlsatianAmericanApacheArabArapahoArgentineanArmenianAssyrian/Chaldean/SyriacAustralianAustrianBahamianBangladeshiBarbadianBasqueBelgianBelizeanBermudanBhutaneseBlackfeetBolivianBrazilianBritishBritish West IndianBulgarianBurmeseCajunCambodianCanadianCape VerdeanCarpatho RusynCelticCentral AmericanCentral American IndianCherokeeCheyenneChickasawChileanChineseChippewaChoctawColombianColvilleComancheCosta RicanCreeCreekCroatianCrowCubanCypriotCzechCzechoslovakianDanishDelawareDominicanDutchDutch West IndianEastern EuropeanEcuadorianEgyptianEnglishEstonianEthiopianEuropeanFijianFilipinoFinnishFrenchFrench American IndianFrench CanadianGermanGerman RussianGhanaianGreekGuamanian/ChamorroGuatemalanGuyaneseHaitianHmongHonduranHopiHoumaHungarianIcelanderIndian (Asian)IndonesianInupiatIranianIraqiIrishIroquoisIsraeliItalianJamaicanJapaneseJordanianKenyanKiowaKoreanLaotianLatvianLebaneseLiberianLithuanianLumbeeLuxembourgerMacedonianMalaysianMalteseMarshalleseMenomineeMexicanMexican American IndianMongolianMoroccanNative HawaiianNavajoNepaleseNew ZealanderNicaraguanNigerianNorthern EuropeanNorwegianOkinawanOsageOttawaPaiutePakistaniPalestinianPanamanianParaguayanPennsylvania GermanPeruvianPimaPolishPortuguesePotawatomiPuebloPuerto RicanPuget Sound SalishRomanianRussianSalvadoranSamoanScandinavianScotch-IrishScottishSeminoleSenegaleseSerbianShoshoneSierra LeoneanSiouxSlavicSlovakSloveneSomaliSouth AfricanSouth AmericanSouth American IndianSoviet UnionSpaniardSpanishSpanish AmericanSpanish American IndianSri LankanSubsaharan AfricanSudaneseSwedishSwissSyrianTaiwaneseThaiTlingit-HaidaTohono O'OdhamTonganTrinidadian and TobagonianTsimshianTurkishU.S. Virgin IslanderUgandanUkrainianUruguayanUteVenezuelanVietnameseWelshWest IndianYakamaYaquiYugoslavianYumanYup'ikZimbabwean
Immigration
NonimmigrantsImmigrantsAfghanistanAfricaAlbaniaArgentinaArmeniaAsiaAustraliaAustriaBahamasBangladeshBarbadosBelarusBelgiumBelizeBoliviaBosnia and HerzegovinaBrazilBulgariaBurma/MyanmarCabo VerdeCambodiaCameroonCanadaCaribbeanCentral AmericaChileChinaColombiaCongoCosta RicaCroatiaCubaCzechoslovakiaDenmarkDominicaDominican RepublicEastern AfricaEastern AsiaEastern EuropeEcuadorEgyptEl SalvadorEnglandEritreaEthiopiaEuropeFijiFranceGermanyGreeceGrenadaGuatemalaGuyanaHaitiHondurasHong KongHungaryIndiaIndonesiaIranIraqIrelandIsraelItalyJamaicaJapanJordanKazakhstanKenyaKoreaKuwaitLaosLatin AmericaLatviaLebanonLiberiaLithuaniaMalaysiaMexicoMicronesiaMiddle AfricaMoldovaMoroccoNepalNetherlandsNicaraguaNigeriaNorth AmericaNorth MacedoniaNorthern AfricaNorthern EuropeNorwayOceaniaPakistanPanamaPeruPhilippinesPolandPortugalRomaniaRussiaSaudi ArabiaScotlandSenegalSerbiaSierra LeoneSingaporeSomaliaSouth AfricaSouth AmericaSouth Central AsiaSouth Eastern AsiaSouthern EuropeSpainSri LankaSt. Vincent and the GrenadinesSudanSwedenSwitzerlandSyriaTaiwanThailandTrinidad and TobagoTurkeyUgandaUkraineUruguayUzbekistanVenezuelaVietnamWest IndiesWestern AfricaWestern AsiaWestern EuropeYemenZaireZimbabweAzores
Immigrants from Ghana
Race
Ancestry
AfghanAfricanAlaska NativeAlaskan AthabascanAlbanianAleutAlsatianAmericanApacheArabArapahoArgentineanArmenianAssyrian/Chaldean/SyriacAustralianAustrianBahamianBangladeshiBarbadianBasqueBelgianBelizeanBermudanBhutaneseBlackfeetBolivianBrazilianBritishBritish West IndianBulgarianBurmeseCajunCambodianCanadianCape VerdeanCarpatho RusynCelticCentral AmericanCentral American IndianCherokeeCheyenneChickasawChileanChineseChippewaChoctawColombianColvilleComancheCosta RicanCreeCreekCroatianCrowCubanCypriotCzechCzechoslovakianDanishDelawareDominicanDutchDutch West IndianEastern EuropeanEcuadorianEgyptianEnglishEstonianEthiopianEuropeanFijianFilipinoFinnishFrenchFrench American IndianFrench CanadianGermanGerman RussianGhanaianGreekGuamanian/ChamorroGuatemalanGuyaneseHaitianHmongHonduranHopiHoumaHungarianIcelanderIndian (Asian)IndonesianInupiatIranianIraqiIrishIroquoisIsraeliItalianJamaicanJapaneseJordanianKenyanKiowaKoreanLaotianLatvianLebaneseLiberianLithuanianLumbeeLuxembourgerMacedonianMalaysianMalteseMarshalleseMenomineeMexicanMexican American IndianMongolianMoroccanNative HawaiianNavajoNepaleseNew ZealanderNicaraguanNigerianNorthern EuropeanNorwegianOkinawanOsageOttawaPaiutePakistaniPalestinianPanamanianParaguayanPennsylvania GermanPeruvianPimaPolishPortuguesePotawatomiPuebloPuerto RicanPuget Sound SalishRomanianRussianSalvadoranSamoanScandinavianScotch-IrishScottishSeminoleSenegaleseSerbianShoshoneSierra LeoneanSiouxSlavicSlovakSloveneSomaliSouth AfricanSouth AmericanSouth American IndianSoviet UnionSpaniardSpanishSpanish AmericanSpanish American IndianSri LankanSubsaharan AfricanSudaneseSwedishSwissSyrianTaiwaneseThaiTlingit-HaidaTohono O'OdhamTonganTrinidadian and TobagonianTsimshianTurkishU.S. Virgin IslanderUgandanUkrainianUruguayanUteVenezuelanVietnameseWelshWest IndianYakamaYaquiYugoslavianYumanZimbabwean
Immigration
NonimmigrantsImmigrantsAfghanistanAfricaAlbaniaArgentinaArmeniaAsiaAustraliaAustriaBahamasBangladeshBarbadosBelarusBelgiumBelizeBoliviaBosnia and HerzegovinaBrazilBulgariaBurma/MyanmarCabo VerdeCambodiaCameroonCanadaCaribbeanCentral AmericaChileChinaColombiaCongoCosta RicaCroatiaCubaCzechoslovakiaDenmarkDominicaDominican RepublicEastern AfricaEastern AsiaEastern EuropeEcuadorEgyptEl SalvadorEnglandEritreaEthiopiaEuropeFijiFranceGermanyGhanaGreeceGrenadaGuatemalaGuyanaHaitiHondurasHong KongHungaryIndiaIndonesiaIranIraqIrelandIsraelItalyJamaicaJapanJordanKazakhstanKenyaKoreaKuwaitLaosLatin AmericaLatviaLebanonLiberiaLithuaniaMalaysiaMexicoMicronesiaMiddle AfricaMoldovaMoroccoNepalNetherlandsNicaraguaNigeriaNorth AmericaNorth MacedoniaNorthern AfricaNorthern EuropeNorwayOceaniaPakistanPanamaPeruPhilippinesPolandPortugalRomaniaRussiaSaudi ArabiaScotlandSenegalSerbiaSierra LeoneSingaporeSomaliaSouth AfricaSouth AmericaSouth Central AsiaSouth Eastern AsiaSouthern EuropeSpainSri LankaSt. Vincent and the GrenadinesSudanSwedenSwitzerlandSyriaTaiwanThailandTrinidad and TobagoTurkeyUgandaUkraineUruguayUzbekistanVenezuelaVietnamWest IndiesWestern AfricaWestern AsiaWestern EuropeYemenZaireZimbabweAzores
Unemployment Among Ages 35 to 44 years
Income
Poverty
Unemployment
Labor Participation
Family Structure
Vehicle Availability
Education Level
Disability

Unemployment Among Ages 35 to 44 years Comparison

Yup'ik

Immigrants from Ghana

Tragic
Tragic
14.4%
UNEMPLOYMENT AMONG AGES 35 TO 44 YEARS
0.0/ 100
METRIC RATING
345th/ 347
METRIC RANK
5.4%
UNEMPLOYMENT AMONG AGES 35 TO 44 YEARS
0.0/ 100
METRIC RATING
282nd/ 347
METRIC RANK

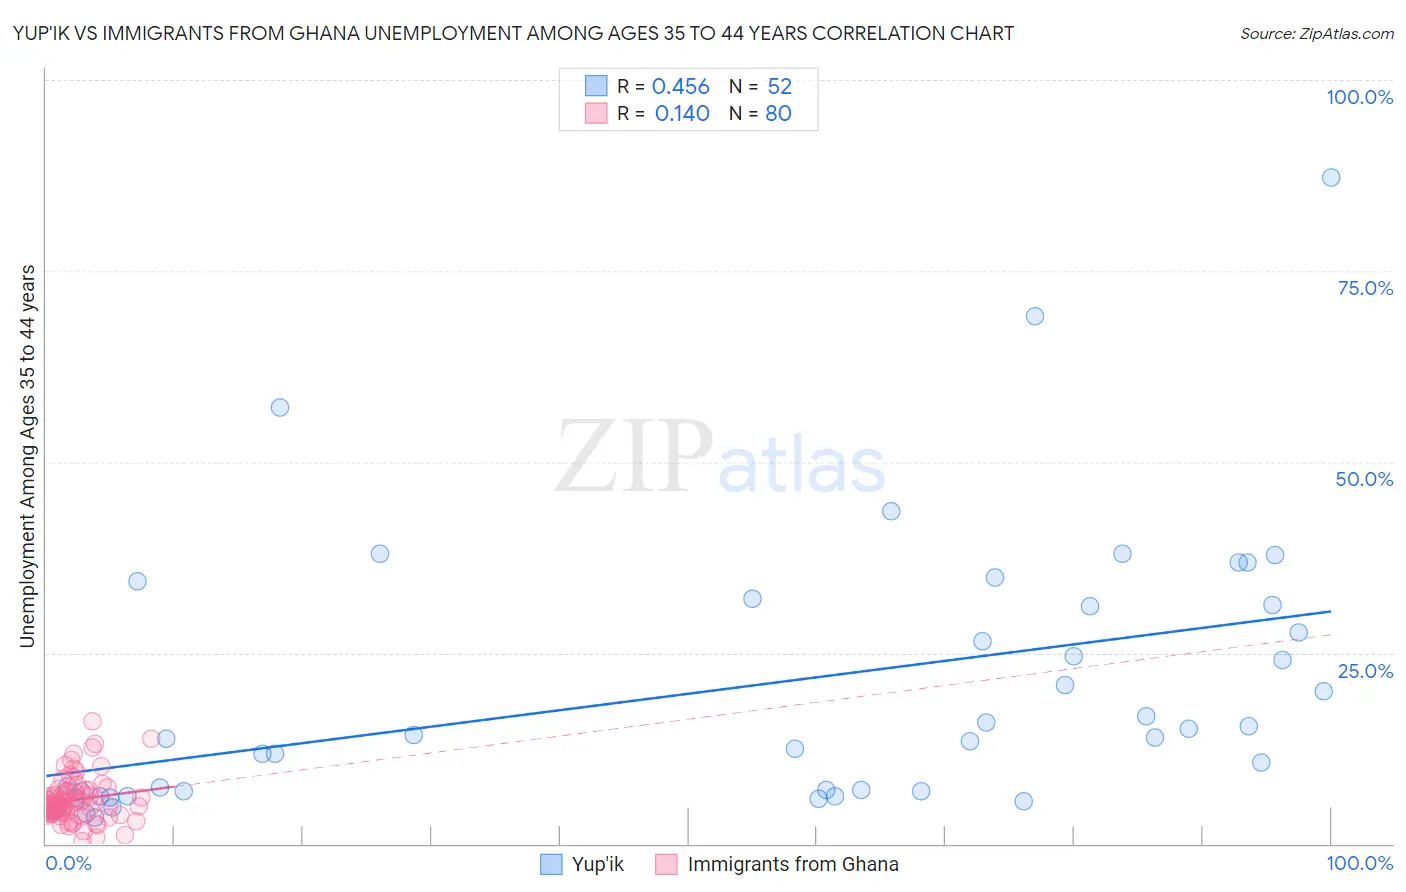
Yup'ik vs Immigrants from Ghana Unemployment Among Ages 35 to 44 years Correlation Chart

The statistical analysis conducted on geographies consisting of 39,745,943 people shows a moderate positive correlation between the proportion of Yup'ik and unemployment rate among population between the ages 35 and 44 in the United States with a correlation coefficient (R) of 0.456 and weighted average of 14.4%. Similarly, the statistical analysis conducted on geographies consisting of 198,215,482 people shows a poor positive correlation between the proportion of Immigrants from Ghana and unemployment rate among population between the ages 35 and 44 in the United States with a correlation coefficient (R) of 0.140 and weighted average of 5.4%, a difference of 166.6%.
Yup'ik vs Immigrants from Ghana Unemployment Among Ages 35 to 44 years

Unemployment Among Ages 35 to 44 years Correlation Summary

MeasurementYup'ikImmigrants from Ghana
Minimum3.5%0.40%
Maximum87.2%16.1%
Range83.8%15.7%
Mean19.9%5.8%
Median13.8%5.0%
Interquartile 25% (IQ1)6.6%4.1%
Interquartile 75% (IQ3)31.2%6.8%
Interquartile Range (IQR)24.6%2.7%
Standard Deviation (Sample)17.6%2.9%
Standard Deviation (Population)17.5%2.9%

Similar Demographics by Unemployment Among Ages 35 to 44 years

Demographics Similar to Yup'ik by Unemployment Among Ages 35 to 44 years

In terms of unemployment among ages 35 to 44 years, the demographic groups most similar to Yup'ik are Crow (15.7%, a difference of 8.8%), Yuman (16.9%, a difference of 17.2%), Pima (11.8%, a difference of 22.8%), Arapaho (10.3%, a difference of 40.3%), and Navajo (9.3%, a difference of 54.6%).
DemographicsRating | RankUnemployment Among Ages 35 to 44 years
Puerto Ricans
0.0
/100
|
#333
Tragic
7.6%
Houma
0.0
/100
|
#334
Tragic
7.8%
Sioux
0.0
/100
|
#335
Tragic
8.4%
Apache
0.0
/100
|
#336
Tragic
8.4%
Tohono O'odham
0.0
/100
|
#337
Tragic
8.4%
Cheyenne
0.0
/100
|
#338
Tragic
8.5%
Inupiat
0.0
/100
|
#339
Tragic
8.6%
Alaskan Athabascans
0.0
/100
|
#340
Tragic
8.6%
Hopi
0.0
/100
|
#341
Tragic
8.9%
Navajo
0.0
/100
|
#342
Tragic
9.3%
Arapaho
0.0
/100
|
#343
Tragic
10.3%
Pima
0.0
/100
|
#344
Tragic
11.8%
Yup'ik
0.0
/100
|
#345
Tragic
14.4%
Crow
0.0
/100
|
#346
Tragic
15.7%
Yuman
0.0
/100
|
#347
Tragic
16.9%

Demographics Similar to Immigrants from Ghana by Unemployment Among Ages 35 to 44 years

In terms of unemployment among ages 35 to 44 years, the demographic groups most similar to Immigrants from Ghana are Immigrants from Portugal (5.4%, a difference of 0.39%), Ecuadorian (5.4%, a difference of 0.43%), Immigrants from Senegal (5.4%, a difference of 0.60%), Immigrants from Ecuador (5.4%, a difference of 0.62%), and Lumbee (5.4%, a difference of 0.66%).
DemographicsRating | RankUnemployment Among Ages 35 to 44 years
Immigrants | Mexico
0.0
/100
|
#275
Tragic
5.4%
Native Hawaiians
0.0
/100
|
#276
Tragic
5.4%
Immigrants | Caribbean
0.0
/100
|
#277
Tragic
5.4%
Lumbee
0.0
/100
|
#278
Tragic
5.4%
Immigrants | Senegal
0.0
/100
|
#279
Tragic
5.4%
Ecuadorians
0.0
/100
|
#280
Tragic
5.4%
Immigrants | Portugal
0.0
/100
|
#281
Tragic
5.4%
Immigrants | Ghana
0.0
/100
|
#282
Tragic
5.4%
Immigrants | Ecuador
0.0
/100
|
#283
Tragic
5.4%
Haitians
0.0
/100
|
#284
Tragic
5.5%
Hispanics or Latinos
0.0
/100
|
#285
Tragic
5.5%
Immigrants | Micronesia
0.0
/100
|
#286
Tragic
5.5%
French American Indians
0.0
/100
|
#287
Tragic
5.5%
Cree
0.0
/100
|
#288
Tragic
5.5%
Spanish American Indians
0.0
/100
|
#289
Tragic
5.5%