Yuman vs Iraqi Unemployment Among Ages 16 to 19 years
COMPARE
Yuman
Iraqi
Unemployment Among Ages 16 to 19 years
Unemployment Among Ages 16 to 19 years Comparison
Yuman
Iraqis
37.4%
UNEMPLOYMENT AMONG AGES 16 TO 19 YEARS
0.0/ 100
METRIC RATING
346th/ 347
METRIC RANK
16.4%
UNEMPLOYMENT AMONG AGES 16 TO 19 YEARS
99.7/ 100
METRIC RATING
49th/ 347
METRIC RANK
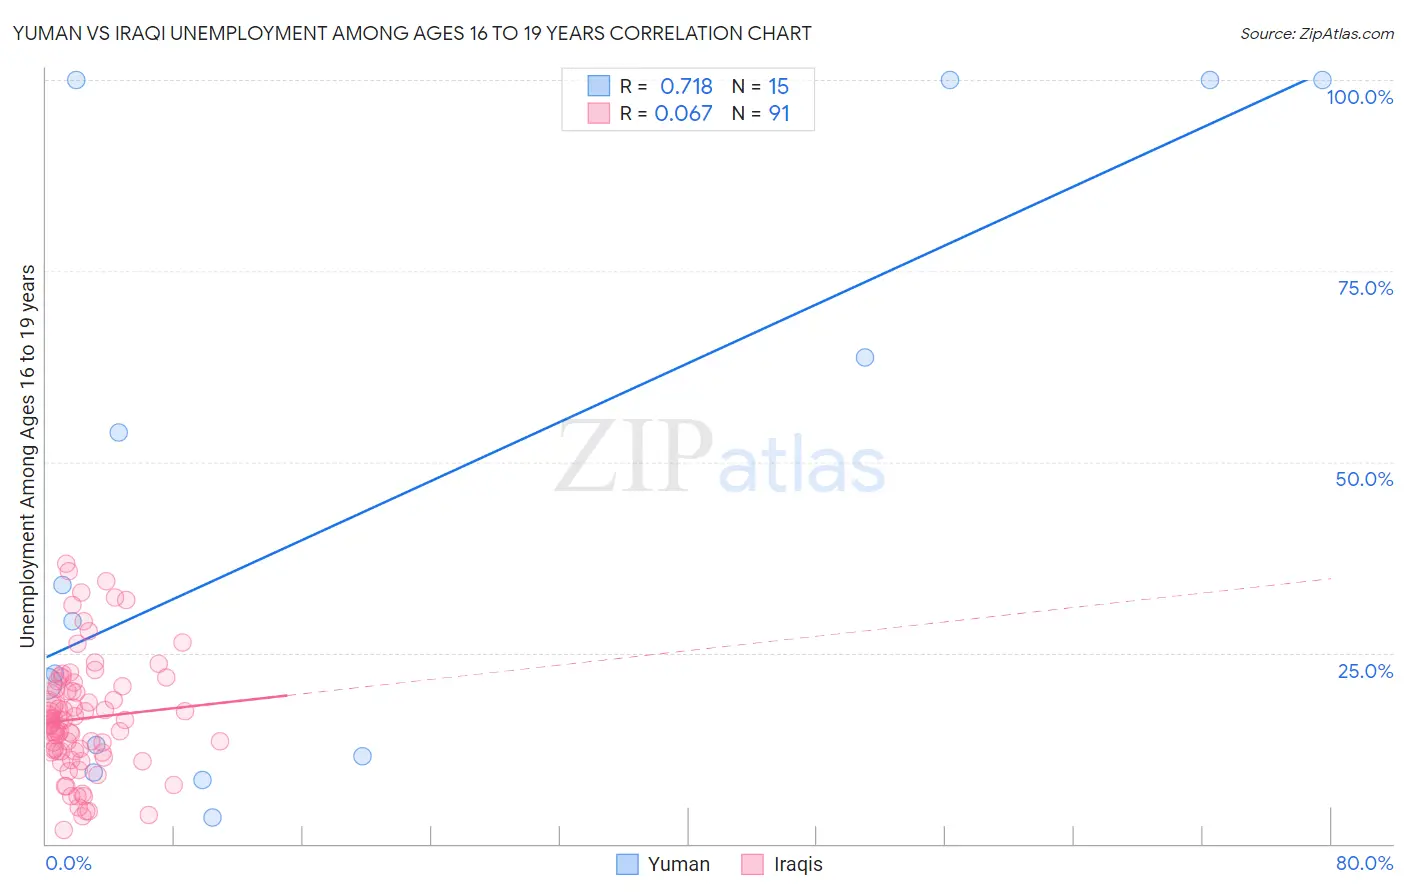
Yuman vs Iraqi Unemployment Among Ages 16 to 19 years Correlation Chart
The statistical analysis conducted on geographies consisting of 40,333,032 people shows a strong positive correlation between the proportion of Yuman and unemployment rate among population between the ages 16 and 19 in the United States with a correlation coefficient (R) of 0.718 and weighted average of 37.4%. Similarly, the statistical analysis conducted on geographies consisting of 166,767,371 people shows a slight positive correlation between the proportion of Iraqis and unemployment rate among population between the ages 16 and 19 in the United States with a correlation coefficient (R) of 0.067 and weighted average of 16.4%, a difference of 128.4%.
Unemployment Among Ages 16 to 19 years Correlation Summary
| Measurement | Yuman | Iraqi |
| Minimum | 3.5% | 1.8% |
| Maximum | 100.0% | 36.7% |
| Range | 96.5% | 34.9% |
| Mean | 44.6% | 16.4% |
| Median | 29.1% | 15.9% |
| Interquartile 25% (IQ1) | 11.5% | 12.0% |
| Interquartile 75% (IQ3) | 100.0% | 20.3% |
| Interquartile Range (IQR) | 88.5% | 8.3% |
| Standard Deviation (Sample) | 38.2% | 7.6% |
| Standard Deviation (Population) | 36.9% | 7.5% |
Similar Demographics by Unemployment Among Ages 16 to 19 years
Demographics Similar to Yuman by Unemployment Among Ages 16 to 19 years
In terms of unemployment among ages 16 to 19 years, the demographic groups most similar to Yuman are Yup'ik (41.0%, a difference of 9.5%), Hopi (30.7%, a difference of 22.1%), Colville (29.7%, a difference of 26.2%), Navajo (29.0%, a difference of 28.9%), and Inupiat (28.1%, a difference of 33.4%).
| Demographics | Rating | Rank | Unemployment Among Ages 16 to 19 years |
| Paiute | 0.0 /100 | #333 | Tragic 24.4% |
| Guyanese | 0.0 /100 | #334 | Tragic 24.8% |
| Arapaho | 0.0 /100 | #335 | Tragic 25.2% |
| Kiowa | 0.0 /100 | #336 | Tragic 25.2% |
| Immigrants | Guyana | 0.0 /100 | #337 | Tragic 25.5% |
| Immigrants | St. Vincent and the Grenadines | 0.0 /100 | #338 | Tragic 25.7% |
| Immigrants | Grenada | 0.0 /100 | #339 | Tragic 25.7% |
| Crow | 0.0 /100 | #340 | Tragic 26.2% |
| Puerto Ricans | 0.0 /100 | #341 | Tragic 27.5% |
| Inupiat | 0.0 /100 | #342 | Tragic 28.1% |
| Navajo | 0.0 /100 | #343 | Tragic 29.0% |
| Colville | 0.0 /100 | #344 | Tragic 29.7% |
| Hopi | 0.0 /100 | #345 | Tragic 30.7% |
| Yuman | 0.0 /100 | #346 | Tragic 37.4% |
| Yup'ik | 0.0 /100 | #347 | Tragic 41.0% |
Demographics Similar to Iraqis by Unemployment Among Ages 16 to 19 years
In terms of unemployment among ages 16 to 19 years, the demographic groups most similar to Iraqis are Maltese (16.4%, a difference of 0.070%), Immigrants from Vietnam (16.4%, a difference of 0.12%), Bhutanese (16.4%, a difference of 0.14%), Immigrants from North Macedonia (16.4%, a difference of 0.19%), and Polish (16.4%, a difference of 0.21%).
| Demographics | Rating | Rank | Unemployment Among Ages 16 to 19 years |
| Fijians | 99.8 /100 | #42 | Exceptional 16.3% |
| Immigrants | Lebanon | 99.8 /100 | #43 | Exceptional 16.3% |
| Immigrants | Zimbabwe | 99.7 /100 | #44 | Exceptional 16.3% |
| Poles | 99.7 /100 | #45 | Exceptional 16.4% |
| Immigrants | North Macedonia | 99.7 /100 | #46 | Exceptional 16.4% |
| Immigrants | Vietnam | 99.7 /100 | #47 | Exceptional 16.4% |
| Maltese | 99.7 /100 | #48 | Exceptional 16.4% |
| Iraqis | 99.7 /100 | #49 | Exceptional 16.4% |
| Bhutanese | 99.6 /100 | #50 | Exceptional 16.4% |
| Lebanese | 99.6 /100 | #51 | Exceptional 16.4% |
| Welsh | 99.6 /100 | #52 | Exceptional 16.4% |
| Slovenes | 99.6 /100 | #53 | Exceptional 16.4% |
| British | 99.5 /100 | #54 | Exceptional 16.5% |
| Czechoslovakians | 99.5 /100 | #55 | Exceptional 16.5% |
| Sri Lankans | 99.5 /100 | #56 | Exceptional 16.5% |