Yuman vs Immigrants from Western Europe Unemployment Among Ages 16 to 19 years
COMPARE
Yuman
Immigrants from Western Europe
Unemployment Among Ages 16 to 19 years
Unemployment Among Ages 16 to 19 years Comparison
Yuman
Immigrants from Western Europe
37.4%
UNEMPLOYMENT AMONG AGES 16 TO 19 YEARS
0.0/ 100
METRIC RATING
346th/ 347
METRIC RANK
17.6%
UNEMPLOYMENT AMONG AGES 16 TO 19 YEARS
52.2/ 100
METRIC RATING
172nd/ 347
METRIC RANK
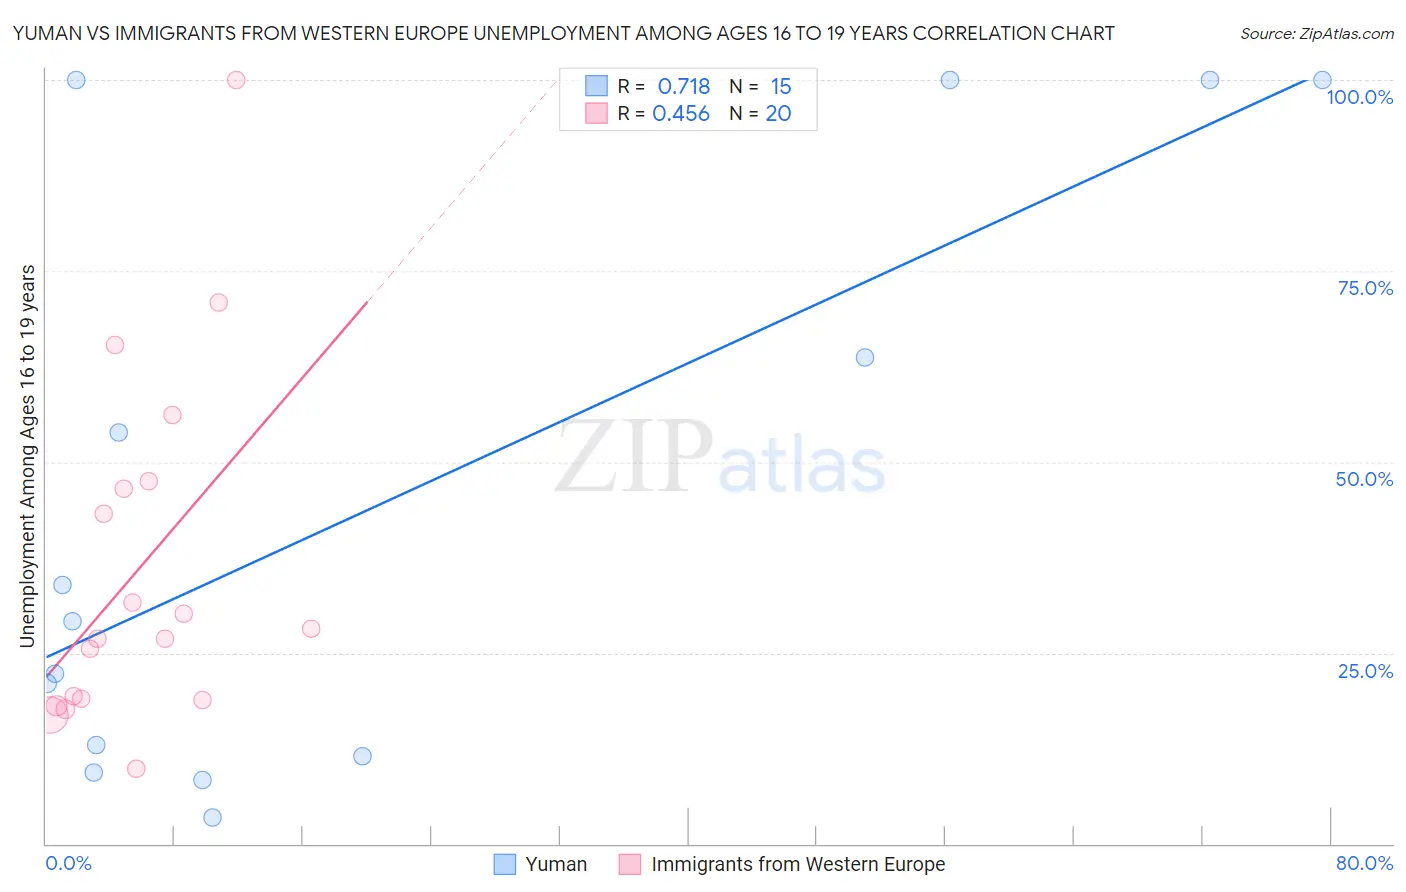
Yuman vs Immigrants from Western Europe Unemployment Among Ages 16 to 19 years Correlation Chart
The statistical analysis conducted on geographies consisting of 40,333,032 people shows a strong positive correlation between the proportion of Yuman and unemployment rate among population between the ages 16 and 19 in the United States with a correlation coefficient (R) of 0.718 and weighted average of 37.4%. Similarly, the statistical analysis conducted on geographies consisting of 457,110,117 people shows a moderate positive correlation between the proportion of Immigrants from Western Europe and unemployment rate among population between the ages 16 and 19 in the United States with a correlation coefficient (R) of 0.456 and weighted average of 17.6%, a difference of 113.2%.
Unemployment Among Ages 16 to 19 years Correlation Summary
| Measurement | Yuman | Immigrants from Western Europe |
| Minimum | 3.5% | 9.8% |
| Maximum | 100.0% | 100.0% |
| Range | 96.5% | 90.2% |
| Mean | 44.6% | 35.9% |
| Median | 29.1% | 27.5% |
| Interquartile 25% (IQ1) | 11.5% | 18.9% |
| Interquartile 75% (IQ3) | 100.0% | 46.9% |
| Interquartile Range (IQR) | 88.5% | 28.0% |
| Standard Deviation (Sample) | 38.2% | 22.8% |
| Standard Deviation (Population) | 36.9% | 22.2% |
Similar Demographics by Unemployment Among Ages 16 to 19 years
Demographics Similar to Yuman by Unemployment Among Ages 16 to 19 years
In terms of unemployment among ages 16 to 19 years, the demographic groups most similar to Yuman are Yup'ik (41.0%, a difference of 9.5%), Hopi (30.7%, a difference of 22.1%), Colville (29.7%, a difference of 26.2%), Navajo (29.0%, a difference of 28.9%), and Inupiat (28.1%, a difference of 33.4%).
| Demographics | Rating | Rank | Unemployment Among Ages 16 to 19 years |
| Paiute | 0.0 /100 | #333 | Tragic 24.4% |
| Guyanese | 0.0 /100 | #334 | Tragic 24.8% |
| Arapaho | 0.0 /100 | #335 | Tragic 25.2% |
| Kiowa | 0.0 /100 | #336 | Tragic 25.2% |
| Immigrants | Guyana | 0.0 /100 | #337 | Tragic 25.5% |
| Immigrants | St. Vincent and the Grenadines | 0.0 /100 | #338 | Tragic 25.7% |
| Immigrants | Grenada | 0.0 /100 | #339 | Tragic 25.7% |
| Crow | 0.0 /100 | #340 | Tragic 26.2% |
| Puerto Ricans | 0.0 /100 | #341 | Tragic 27.5% |
| Inupiat | 0.0 /100 | #342 | Tragic 28.1% |
| Navajo | 0.0 /100 | #343 | Tragic 29.0% |
| Colville | 0.0 /100 | #344 | Tragic 29.7% |
| Hopi | 0.0 /100 | #345 | Tragic 30.7% |
| Yuman | 0.0 /100 | #346 | Tragic 37.4% |
| Yup'ik | 0.0 /100 | #347 | Tragic 41.0% |
Demographics Similar to Immigrants from Western Europe by Unemployment Among Ages 16 to 19 years
In terms of unemployment among ages 16 to 19 years, the demographic groups most similar to Immigrants from Western Europe are Immigrants from Romania (17.5%, a difference of 0.050%), Immigrants from Switzerland (17.5%, a difference of 0.050%), Chilean (17.6%, a difference of 0.070%), Immigrants from Cambodia (17.5%, a difference of 0.11%), and Osage (17.6%, a difference of 0.11%).
| Demographics | Rating | Rank | Unemployment Among Ages 16 to 19 years |
| Cape Verdeans | 55.8 /100 | #165 | Average 17.5% |
| Immigrants | Italy | 55.2 /100 | #166 | Average 17.5% |
| Immigrants | France | 54.9 /100 | #167 | Average 17.5% |
| Immigrants | Hungary | 54.7 /100 | #168 | Average 17.5% |
| Immigrants | Cambodia | 54.5 /100 | #169 | Average 17.5% |
| Immigrants | Romania | 53.3 /100 | #170 | Average 17.5% |
| Immigrants | Switzerland | 53.2 /100 | #171 | Average 17.5% |
| Immigrants | Western Europe | 52.2 /100 | #172 | Average 17.6% |
| Chileans | 50.8 /100 | #173 | Average 17.6% |
| Osage | 50.0 /100 | #174 | Average 17.6% |
| Immigrants | Sweden | 49.1 /100 | #175 | Average 17.6% |
| Nicaraguans | 48.9 /100 | #176 | Average 17.6% |
| Bermudans | 48.7 /100 | #177 | Average 17.6% |
| Celtics | 48.7 /100 | #178 | Average 17.6% |
| Americans | 47.4 /100 | #179 | Average 17.6% |