Tsimshian vs Russian Unemployment Among Seniors over 75 years
COMPARE
Tsimshian
Russian
Unemployment Among Seniors over 75 years
Unemployment Among Seniors over 75 years Comparison
Tsimshian
Russians
10.5%
UNEMPLOYMENT AMONG SENIORS OVER 75 YEARS
0.0/ 100
METRIC RATING
329th/ 347
METRIC RANK
8.9%
UNEMPLOYMENT AMONG SENIORS OVER 75 YEARS
24.1/ 100
METRIC RATING
202nd/ 347
METRIC RANK
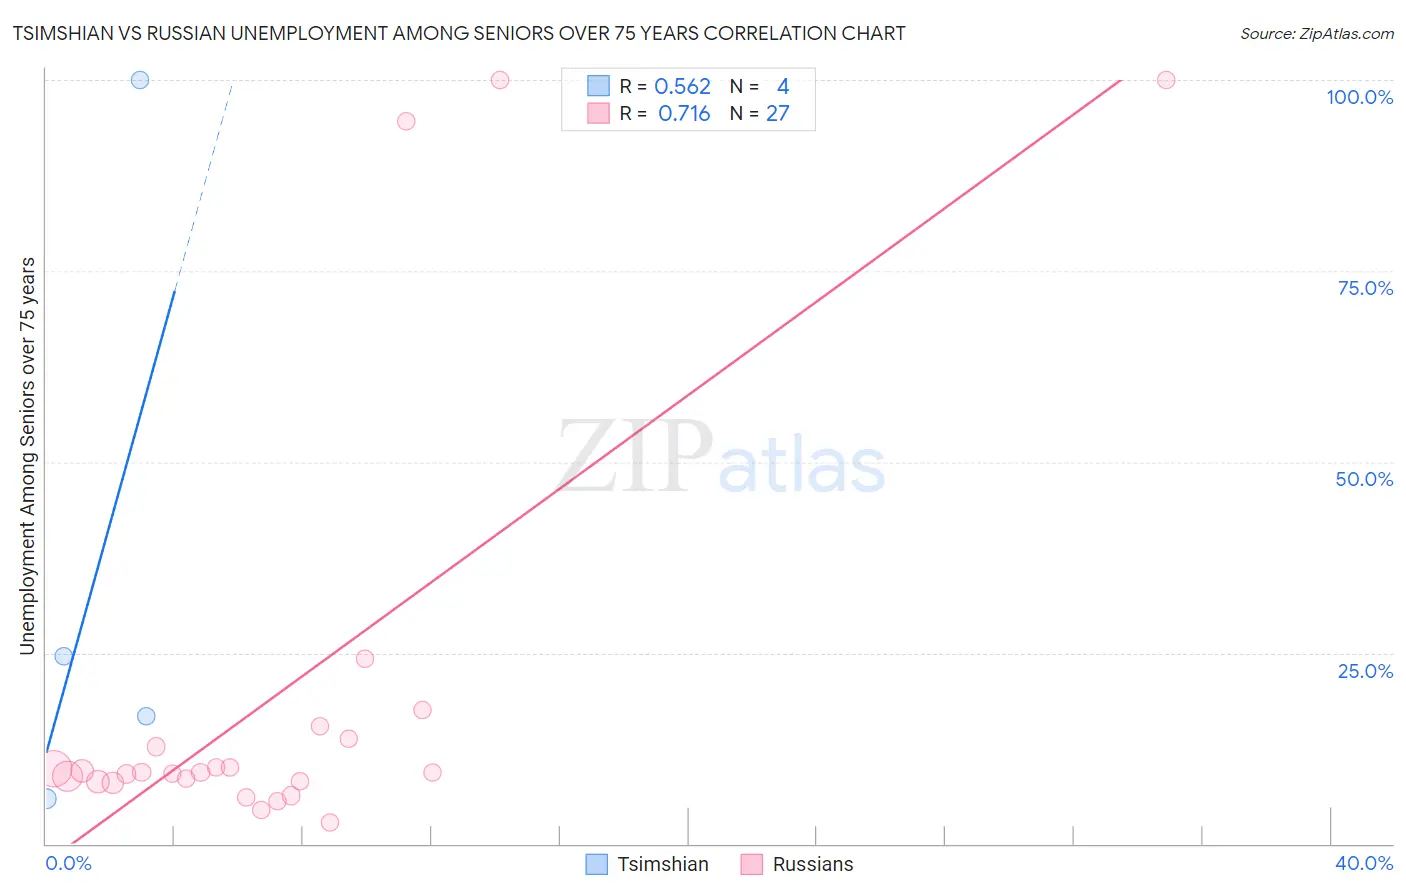
Tsimshian vs Russian Unemployment Among Seniors over 75 years Correlation Chart
The statistical analysis conducted on geographies consisting of 12,337,833 people shows a substantial positive correlation between the proportion of Tsimshian and unemployment rate among seniors over the age of 75 in the United States with a correlation coefficient (R) of 0.562 and weighted average of 10.5%. Similarly, the statistical analysis conducted on geographies consisting of 227,559,855 people shows a strong positive correlation between the proportion of Russians and unemployment rate among seniors over the age of 75 in the United States with a correlation coefficient (R) of 0.716 and weighted average of 8.9%, a difference of 18.7%.
Unemployment Among Seniors over 75 years Correlation Summary
| Measurement | Tsimshian | Russian |
| Minimum | 5.9% | 2.8% |
| Maximum | 100.0% | 100.0% |
| Range | 94.1% | 97.2% |
| Mean | 36.8% | 19.7% |
| Median | 20.6% | 9.3% |
| Interquartile 25% (IQ1) | 11.3% | 8.1% |
| Interquartile 75% (IQ3) | 62.3% | 13.7% |
| Interquartile Range (IQR) | 51.0% | 5.6% |
| Standard Deviation (Sample) | 42.8% | 28.6% |
| Standard Deviation (Population) | 37.1% | 28.1% |
Similar Demographics by Unemployment Among Seniors over 75 years
Demographics Similar to Tsimshian by Unemployment Among Seniors over 75 years
In terms of unemployment among seniors over 75 years, the demographic groups most similar to Tsimshian are Immigrants from Portugal (10.5%, a difference of 0.35%), Dutch (10.4%, a difference of 0.99%), Slovak (10.4%, a difference of 1.1%), Portuguese (10.4%, a difference of 1.3%), and American (10.4%, a difference of 1.5%).
| Demographics | Rating | Rank | Unemployment Among Seniors over 75 years |
| Poles | 0.0 /100 | #322 | Tragic 10.3% |
| Tongans | 0.0 /100 | #323 | Tragic 10.4% |
| Americans | 0.0 /100 | #324 | Tragic 10.4% |
| Portuguese | 0.0 /100 | #325 | Tragic 10.4% |
| Slovaks | 0.0 /100 | #326 | Tragic 10.4% |
| Dutch | 0.0 /100 | #327 | Tragic 10.4% |
| Immigrants | Portugal | 0.0 /100 | #328 | Tragic 10.5% |
| Tsimshian | 0.0 /100 | #329 | Tragic 10.5% |
| Immigrants | Azores | 0.0 /100 | #330 | Tragic 10.7% |
| Tohono O'odham | 0.0 /100 | #331 | Tragic 10.8% |
| Immigrants | Liberia | 0.0 /100 | #332 | Tragic 10.9% |
| Alaskan Athabascans | 0.0 /100 | #333 | Tragic 11.0% |
| Assyrians/Chaldeans/Syriacs | 0.0 /100 | #334 | Tragic 11.1% |
| French Canadians | 0.0 /100 | #335 | Tragic 11.2% |
| Immigrants | North Macedonia | 0.0 /100 | #336 | Tragic 11.3% |
Demographics Similar to Russians by Unemployment Among Seniors over 75 years
In terms of unemployment among seniors over 75 years, the demographic groups most similar to Russians are Immigrants from Peru (8.9%, a difference of 0.010%), Immigrants from Northern Europe (8.9%, a difference of 0.020%), Pakistani (8.9%, a difference of 0.090%), Osage (8.9%, a difference of 0.090%), and Eastern European (8.9%, a difference of 0.12%).
| Demographics | Rating | Rank | Unemployment Among Seniors over 75 years |
| Okinawans | 28.9 /100 | #195 | Fair 8.8% |
| Immigrants | Jamaica | 27.7 /100 | #196 | Fair 8.9% |
| Immigrants | Laos | 26.3 /100 | #197 | Fair 8.9% |
| Eastern Europeans | 25.9 /100 | #198 | Fair 8.9% |
| Pakistanis | 25.4 /100 | #199 | Fair 8.9% |
| Osage | 25.4 /100 | #200 | Fair 8.9% |
| Immigrants | Peru | 24.3 /100 | #201 | Fair 8.9% |
| Russians | 24.1 /100 | #202 | Fair 8.9% |
| Immigrants | Northern Europe | 23.9 /100 | #203 | Fair 8.9% |
| Spaniards | 22.0 /100 | #204 | Fair 8.9% |
| Koreans | 21.9 /100 | #205 | Fair 8.9% |
| Immigrants | Western Europe | 18.2 /100 | #206 | Poor 8.9% |
| Malaysians | 16.3 /100 | #207 | Poor 8.9% |
| Immigrants | Philippines | 15.8 /100 | #208 | Poor 8.9% |
| Salvadorans | 15.4 /100 | #209 | Poor 8.9% |