Armenian vs Russian Unemployment Among Seniors over 75 years
COMPARE
Armenian
Russian
Unemployment Among Seniors over 75 years
Unemployment Among Seniors over 75 years Comparison
Armenians
Russians
7.2%
UNEMPLOYMENT AMONG SENIORS OVER 75 YEARS
100.0/ 100
METRIC RATING
20th/ 347
METRIC RANK
8.9%
UNEMPLOYMENT AMONG SENIORS OVER 75 YEARS
24.1/ 100
METRIC RATING
202nd/ 347
METRIC RANK
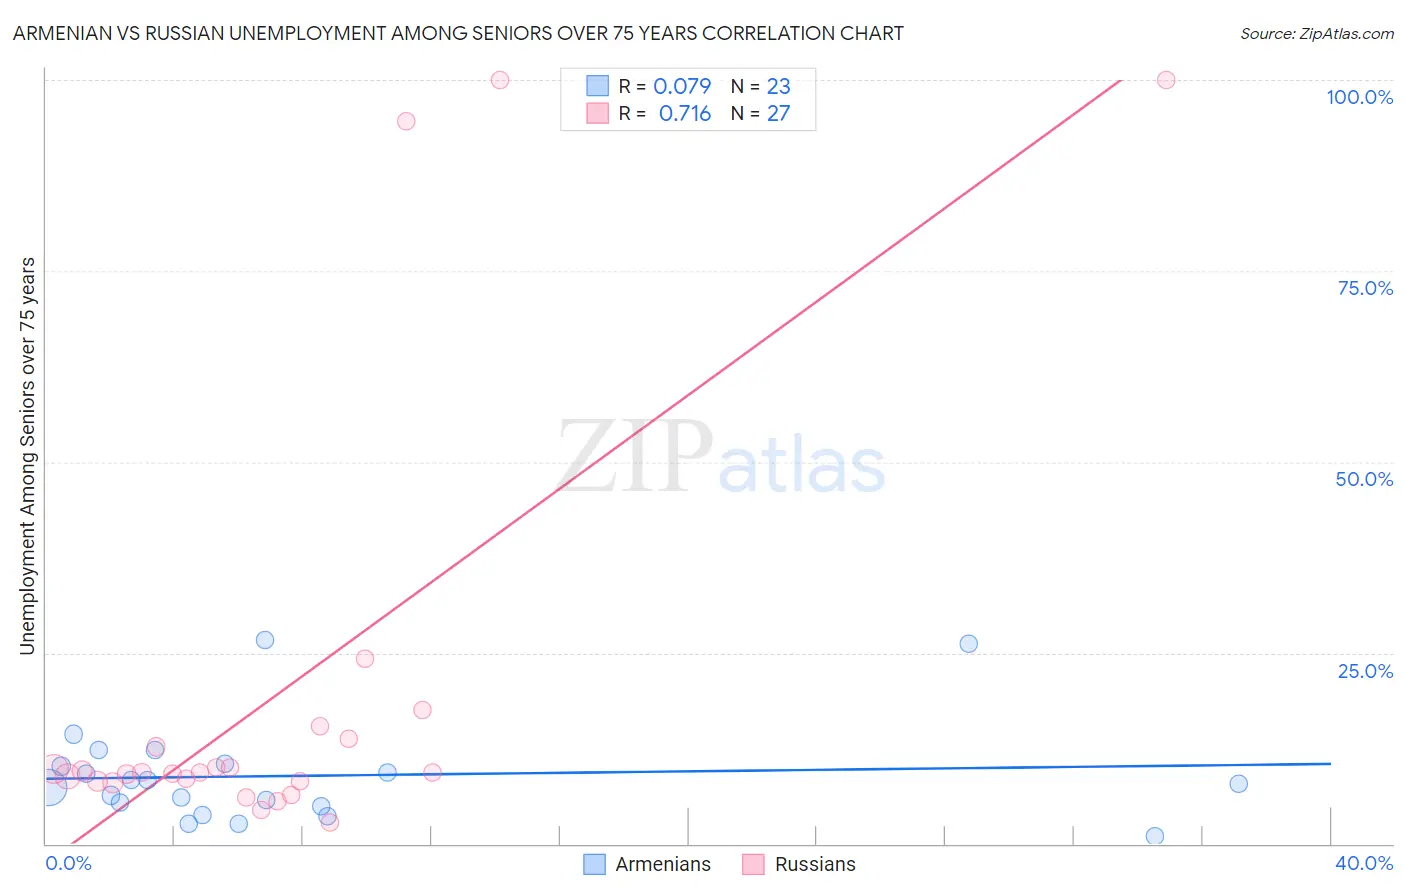
Armenian vs Russian Unemployment Among Seniors over 75 years Correlation Chart
The statistical analysis conducted on geographies consisting of 177,448,888 people shows a slight positive correlation between the proportion of Armenians and unemployment rate among seniors over the age of 75 in the United States with a correlation coefficient (R) of 0.079 and weighted average of 7.2%. Similarly, the statistical analysis conducted on geographies consisting of 227,559,855 people shows a strong positive correlation between the proportion of Russians and unemployment rate among seniors over the age of 75 in the United States with a correlation coefficient (R) of 0.716 and weighted average of 8.9%, a difference of 22.5%.
Unemployment Among Seniors over 75 years Correlation Summary
| Measurement | Armenian | Russian |
| Minimum | 1.0% | 2.8% |
| Maximum | 26.6% | 100.0% |
| Range | 25.6% | 97.2% |
| Mean | 8.9% | 19.7% |
| Median | 7.8% | 9.3% |
| Interquartile 25% (IQ1) | 4.9% | 8.1% |
| Interquartile 75% (IQ3) | 10.4% | 13.7% |
| Interquartile Range (IQR) | 5.5% | 5.6% |
| Standard Deviation (Sample) | 6.5% | 28.6% |
| Standard Deviation (Population) | 6.3% | 28.1% |
Similar Demographics by Unemployment Among Seniors over 75 years
Demographics Similar to Armenians by Unemployment Among Seniors over 75 years
In terms of unemployment among seniors over 75 years, the demographic groups most similar to Armenians are Immigrants from Zaire (7.2%, a difference of 0.35%), Immigrants from Uzbekistan (7.2%, a difference of 0.44%), Immigrants from Switzerland (7.2%, a difference of 0.73%), Chickasaw (7.3%, a difference of 1.4%), and Seminole (7.1%, a difference of 1.8%).
| Demographics | Rating | Rank | Unemployment Among Seniors over 75 years |
| Immigrants | Congo | 100.0 /100 | #13 | Exceptional 6.7% |
| Ute | 100.0 /100 | #14 | Exceptional 6.8% |
| Icelanders | 100.0 /100 | #15 | Exceptional 7.0% |
| Seminole | 100.0 /100 | #16 | Exceptional 7.1% |
| Immigrants | Switzerland | 100.0 /100 | #17 | Exceptional 7.2% |
| Immigrants | Uzbekistan | 100.0 /100 | #18 | Exceptional 7.2% |
| Immigrants | Zaire | 100.0 /100 | #19 | Exceptional 7.2% |
| Armenians | 100.0 /100 | #20 | Exceptional 7.2% |
| Chickasaw | 100.0 /100 | #21 | Exceptional 7.3% |
| Cypriots | 100.0 /100 | #22 | Exceptional 7.4% |
| Israelis | 100.0 /100 | #23 | Exceptional 7.4% |
| Immigrants | Cuba | 100.0 /100 | #24 | Exceptional 7.4% |
| Immigrants | Uruguay | 100.0 /100 | #25 | Exceptional 7.5% |
| South Africans | 100.0 /100 | #26 | Exceptional 7.5% |
| Immigrants | Barbados | 100.0 /100 | #27 | Exceptional 7.6% |
Demographics Similar to Russians by Unemployment Among Seniors over 75 years
In terms of unemployment among seniors over 75 years, the demographic groups most similar to Russians are Immigrants from Peru (8.9%, a difference of 0.010%), Immigrants from Northern Europe (8.9%, a difference of 0.020%), Pakistani (8.9%, a difference of 0.090%), Osage (8.9%, a difference of 0.090%), and Eastern European (8.9%, a difference of 0.12%).
| Demographics | Rating | Rank | Unemployment Among Seniors over 75 years |
| Okinawans | 28.9 /100 | #195 | Fair 8.8% |
| Immigrants | Jamaica | 27.7 /100 | #196 | Fair 8.9% |
| Immigrants | Laos | 26.3 /100 | #197 | Fair 8.9% |
| Eastern Europeans | 25.9 /100 | #198 | Fair 8.9% |
| Pakistanis | 25.4 /100 | #199 | Fair 8.9% |
| Osage | 25.4 /100 | #200 | Fair 8.9% |
| Immigrants | Peru | 24.3 /100 | #201 | Fair 8.9% |
| Russians | 24.1 /100 | #202 | Fair 8.9% |
| Immigrants | Northern Europe | 23.9 /100 | #203 | Fair 8.9% |
| Spaniards | 22.0 /100 | #204 | Fair 8.9% |
| Koreans | 21.9 /100 | #205 | Fair 8.9% |
| Immigrants | Western Europe | 18.2 /100 | #206 | Poor 8.9% |
| Malaysians | 16.3 /100 | #207 | Poor 8.9% |
| Immigrants | Philippines | 15.8 /100 | #208 | Poor 8.9% |
| Salvadorans | 15.4 /100 | #209 | Poor 8.9% |