Tongan vs Chilean Unemployment Among Seniors over 65 years
COMPARE
Tongan
Chilean
Unemployment Among Seniors over 65 years
Unemployment Among Seniors over 65 years Comparison
Tongans
Chileans
4.7%
UNEMPLOYMENT AMONG SENIORS OVER 65 YEARS
100.0/ 100
METRIC RATING
25th/ 347
METRIC RANK
5.1%
UNEMPLOYMENT AMONG SENIORS OVER 65 YEARS
85.6/ 100
METRIC RATING
132nd/ 347
METRIC RANK
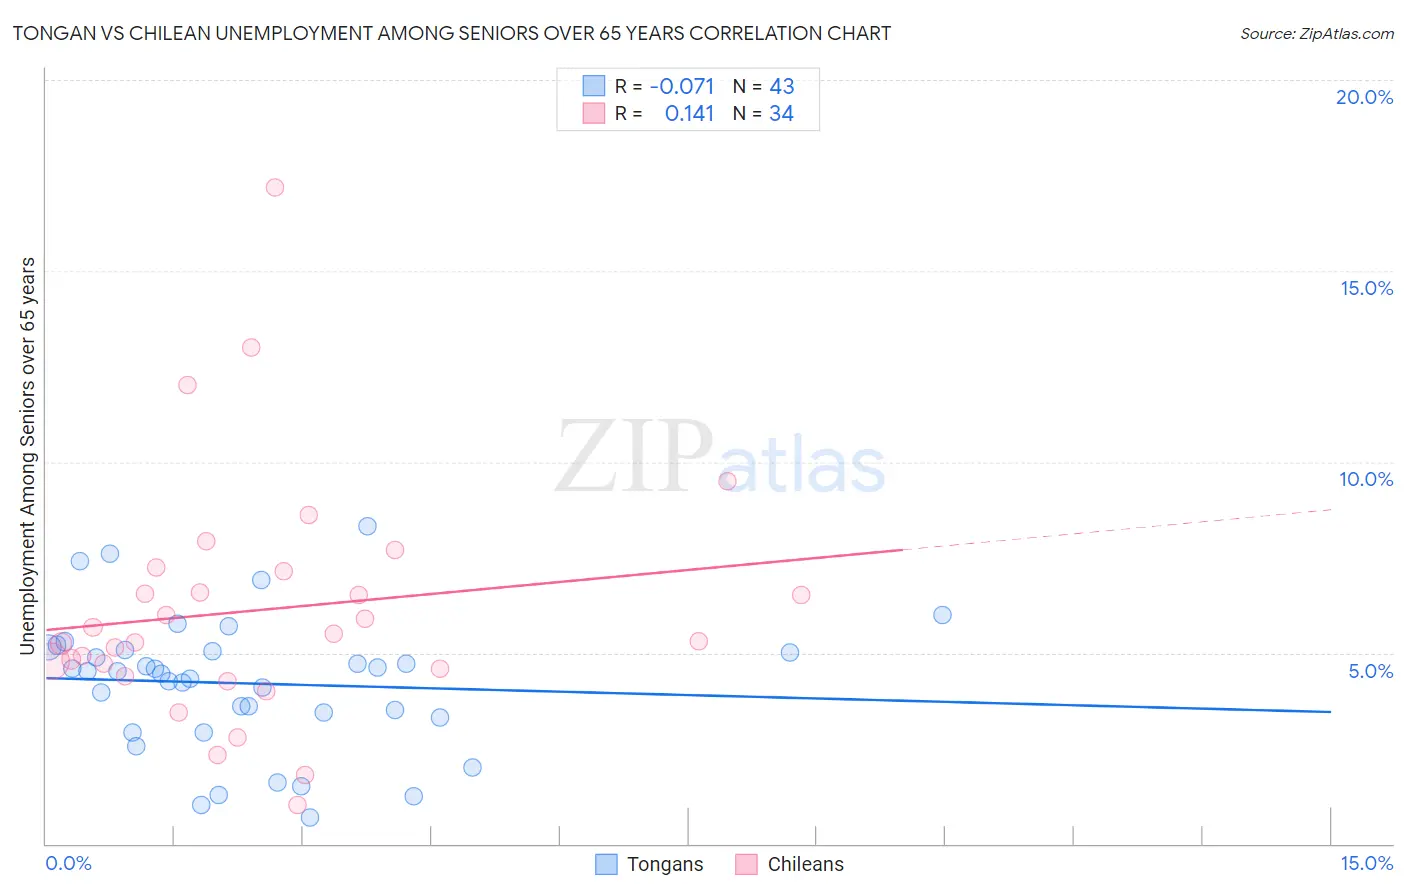
Tongan vs Chilean Unemployment Among Seniors over 65 years Correlation Chart
The statistical analysis conducted on geographies consisting of 97,809,218 people shows a slight negative correlation between the proportion of Tongans and unemployment rate amomg seniors over the age of 65 in the United States with a correlation coefficient (R) of -0.071 and weighted average of 4.7%. Similarly, the statistical analysis conducted on geographies consisting of 242,211,258 people shows a poor positive correlation between the proportion of Chileans and unemployment rate amomg seniors over the age of 65 in the United States with a correlation coefficient (R) of 0.141 and weighted average of 5.1%, a difference of 6.9%.
Unemployment Among Seniors over 65 years Correlation Summary
| Measurement | Tongan | Chilean |
| Minimum | 0.70% | 1.0% |
| Maximum | 8.3% | 17.2% |
| Range | 7.6% | 16.2% |
| Mean | 4.2% | 6.1% |
| Median | 4.5% | 5.4% |
| Interquartile 25% (IQ1) | 3.3% | 4.6% |
| Interquartile 75% (IQ3) | 5.1% | 7.1% |
| Interquartile Range (IQR) | 1.8% | 2.5% |
| Standard Deviation (Sample) | 1.7% | 3.2% |
| Standard Deviation (Population) | 1.7% | 3.1% |
Similar Demographics by Unemployment Among Seniors over 65 years
Demographics Similar to Tongans by Unemployment Among Seniors over 65 years
In terms of unemployment among seniors over 65 years, the demographic groups most similar to Tongans are Iraqi (4.7%, a difference of 0.22%), Immigrants from Lebanon (4.8%, a difference of 0.38%), Houma (4.8%, a difference of 0.45%), Ugandan (4.8%, a difference of 0.53%), and Kenyan (4.7%, a difference of 0.61%).
| Demographics | Rating | Rank | Unemployment Among Seniors over 65 years |
| Immigrants | Eritrea | 100.0 /100 | #18 | Exceptional 4.7% |
| Lebanese | 100.0 /100 | #19 | Exceptional 4.7% |
| Immigrants | Nepal | 100.0 /100 | #20 | Exceptional 4.7% |
| Norwegians | 100.0 /100 | #21 | Exceptional 4.7% |
| Czechs | 100.0 /100 | #22 | Exceptional 4.7% |
| Kenyans | 100.0 /100 | #23 | Exceptional 4.7% |
| Iraqis | 100.0 /100 | #24 | Exceptional 4.7% |
| Tongans | 100.0 /100 | #25 | Exceptional 4.7% |
| Immigrants | Lebanon | 100.0 /100 | #26 | Exceptional 4.8% |
| Houma | 100.0 /100 | #27 | Exceptional 4.8% |
| Ugandans | 100.0 /100 | #28 | Exceptional 4.8% |
| Immigrants | North Macedonia | 100.0 /100 | #29 | Exceptional 4.8% |
| Belgians | 100.0 /100 | #30 | Exceptional 4.8% |
| Immigrants | Uganda | 100.0 /100 | #31 | Exceptional 4.8% |
| Slovenes | 100.0 /100 | #32 | Exceptional 4.8% |
Demographics Similar to Chileans by Unemployment Among Seniors over 65 years
In terms of unemployment among seniors over 65 years, the demographic groups most similar to Chileans are Immigrants from Australia (5.1%, a difference of 0.010%), Syrian (5.1%, a difference of 0.020%), Turkish (5.1%, a difference of 0.050%), Iranian (5.1%, a difference of 0.070%), and Ukrainian (5.1%, a difference of 0.070%).
| Demographics | Rating | Rank | Unemployment Among Seniors over 65 years |
| Dutch | 87.6 /100 | #125 | Excellent 5.1% |
| Immigrants | Sri Lanka | 87.4 /100 | #126 | Excellent 5.1% |
| Sri Lankans | 87.4 /100 | #127 | Excellent 5.1% |
| Australians | 87.1 /100 | #128 | Excellent 5.1% |
| Immigrants | England | 86.7 /100 | #129 | Excellent 5.1% |
| Iranians | 86.6 /100 | #130 | Excellent 5.1% |
| Immigrants | Australia | 85.8 /100 | #131 | Excellent 5.1% |
| Chileans | 85.6 /100 | #132 | Excellent 5.1% |
| Syrians | 85.3 /100 | #133 | Excellent 5.1% |
| Turks | 84.9 /100 | #134 | Excellent 5.1% |
| Ukrainians | 84.4 /100 | #135 | Excellent 5.1% |
| Whites/Caucasians | 84.4 /100 | #136 | Excellent 5.1% |
| Arabs | 84.3 /100 | #137 | Excellent 5.1% |
| New Zealanders | 83.2 /100 | #138 | Excellent 5.1% |
| Immigrants | Panama | 83.0 /100 | #139 | Excellent 5.1% |