Moroccan vs Chilean Unemployment Among Seniors over 65 years
COMPARE
Moroccan
Chilean
Unemployment Among Seniors over 65 years
Unemployment Among Seniors over 65 years Comparison
Moroccans
Chileans
5.4%
UNEMPLOYMENT AMONG SENIORS OVER 65 YEARS
0.5/ 100
METRIC RATING
256th/ 347
METRIC RANK
5.1%
UNEMPLOYMENT AMONG SENIORS OVER 65 YEARS
85.6/ 100
METRIC RATING
132nd/ 347
METRIC RANK
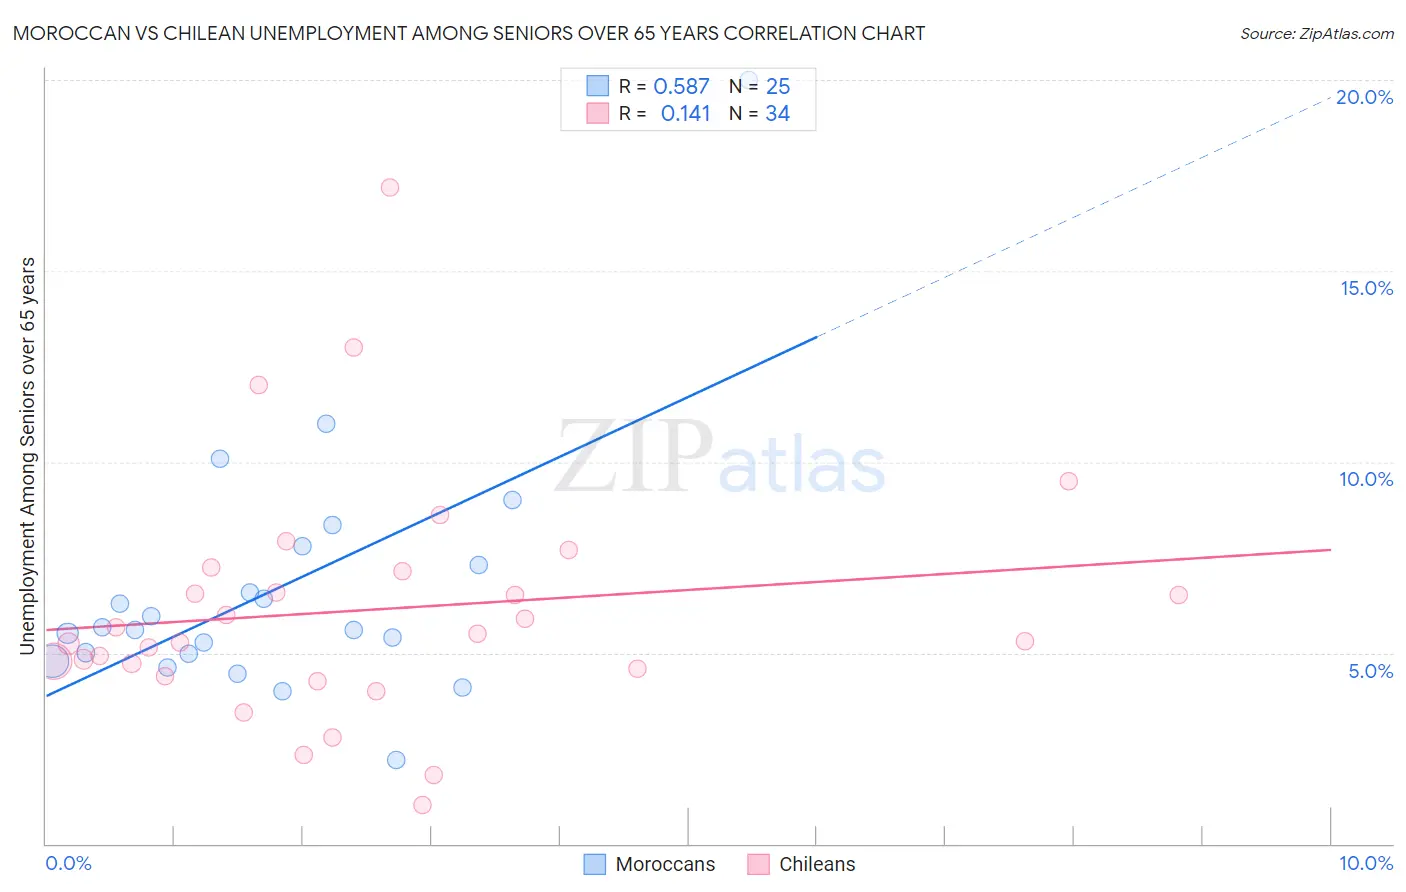
Moroccan vs Chilean Unemployment Among Seniors over 65 years Correlation Chart
The statistical analysis conducted on geographies consisting of 191,654,032 people shows a substantial positive correlation between the proportion of Moroccans and unemployment rate amomg seniors over the age of 65 in the United States with a correlation coefficient (R) of 0.587 and weighted average of 5.4%. Similarly, the statistical analysis conducted on geographies consisting of 242,211,258 people shows a poor positive correlation between the proportion of Chileans and unemployment rate amomg seniors over the age of 65 in the United States with a correlation coefficient (R) of 0.141 and weighted average of 5.1%, a difference of 5.8%.
Unemployment Among Seniors over 65 years Correlation Summary
| Measurement | Moroccan | Chilean |
| Minimum | 2.2% | 1.0% |
| Maximum | 20.0% | 17.2% |
| Range | 17.8% | 16.2% |
| Mean | 6.6% | 6.1% |
| Median | 5.6% | 5.4% |
| Interquartile 25% (IQ1) | 4.9% | 4.6% |
| Interquartile 75% (IQ3) | 7.5% | 7.1% |
| Interquartile Range (IQR) | 2.7% | 2.5% |
| Standard Deviation (Sample) | 3.4% | 3.2% |
| Standard Deviation (Population) | 3.3% | 3.1% |
Similar Demographics by Unemployment Among Seniors over 65 years
Demographics Similar to Moroccans by Unemployment Among Seniors over 65 years
In terms of unemployment among seniors over 65 years, the demographic groups most similar to Moroccans are Paraguayan (5.4%, a difference of 0.030%), Immigrants from Peru (5.4%, a difference of 0.030%), Immigrants from Sierra Leone (5.4%, a difference of 0.090%), Immigrants from Micronesia (5.4%, a difference of 0.090%), and Trinidadian and Tobagonian (5.4%, a difference of 0.12%).
| Demographics | Rating | Rank | Unemployment Among Seniors over 65 years |
| Immigrants | Immigrants | 0.6 /100 | #249 | Tragic 5.4% |
| Ghanaians | 0.6 /100 | #250 | Tragic 5.4% |
| West Indians | 0.6 /100 | #251 | Tragic 5.4% |
| Trinidadians and Tobagonians | 0.6 /100 | #252 | Tragic 5.4% |
| Immigrants | Sierra Leone | 0.6 /100 | #253 | Tragic 5.4% |
| Paraguayans | 0.5 /100 | #254 | Tragic 5.4% |
| Immigrants | Peru | 0.5 /100 | #255 | Tragic 5.4% |
| Moroccans | 0.5 /100 | #256 | Tragic 5.4% |
| Immigrants | Micronesia | 0.4 /100 | #257 | Tragic 5.4% |
| Sierra Leoneans | 0.4 /100 | #258 | Tragic 5.4% |
| Immigrants | Ghana | 0.4 /100 | #259 | Tragic 5.4% |
| Native Hawaiians | 0.3 /100 | #260 | Tragic 5.4% |
| Spanish American Indians | 0.2 /100 | #261 | Tragic 5.4% |
| Immigrants | Grenada | 0.2 /100 | #262 | Tragic 5.4% |
| South Americans | 0.2 /100 | #263 | Tragic 5.4% |
Demographics Similar to Chileans by Unemployment Among Seniors over 65 years
In terms of unemployment among seniors over 65 years, the demographic groups most similar to Chileans are Immigrants from Australia (5.1%, a difference of 0.010%), Syrian (5.1%, a difference of 0.020%), Turkish (5.1%, a difference of 0.050%), Iranian (5.1%, a difference of 0.070%), and Ukrainian (5.1%, a difference of 0.070%).
| Demographics | Rating | Rank | Unemployment Among Seniors over 65 years |
| Dutch | 87.6 /100 | #125 | Excellent 5.1% |
| Immigrants | Sri Lanka | 87.4 /100 | #126 | Excellent 5.1% |
| Sri Lankans | 87.4 /100 | #127 | Excellent 5.1% |
| Australians | 87.1 /100 | #128 | Excellent 5.1% |
| Immigrants | England | 86.7 /100 | #129 | Excellent 5.1% |
| Iranians | 86.6 /100 | #130 | Excellent 5.1% |
| Immigrants | Australia | 85.8 /100 | #131 | Excellent 5.1% |
| Chileans | 85.6 /100 | #132 | Excellent 5.1% |
| Syrians | 85.3 /100 | #133 | Excellent 5.1% |
| Turks | 84.9 /100 | #134 | Excellent 5.1% |
| Ukrainians | 84.4 /100 | #135 | Excellent 5.1% |
| Whites/Caucasians | 84.4 /100 | #136 | Excellent 5.1% |
| Arabs | 84.3 /100 | #137 | Excellent 5.1% |
| New Zealanders | 83.2 /100 | #138 | Excellent 5.1% |
| Immigrants | Panama | 83.0 /100 | #139 | Excellent 5.1% |