Tohono O'odham vs Immigrants from Costa Rica Unemployment Among Youth under 25 years
COMPARE
Tohono O'odham
Immigrants from Costa Rica
Unemployment Among Youth under 25 years
Unemployment Among Youth under 25 years Comparison
Tohono O'odham
Immigrants from Costa Rica
13.8%
UNEMPLOYMENT AMONG YOUTH UNDER 25 YEARS
0.0/ 100
METRIC RATING
299th/ 347
METRIC RANK
11.8%
UNEMPLOYMENT AMONG YOUTH UNDER 25 YEARS
15.2/ 100
METRIC RATING
204th/ 347
METRIC RANK
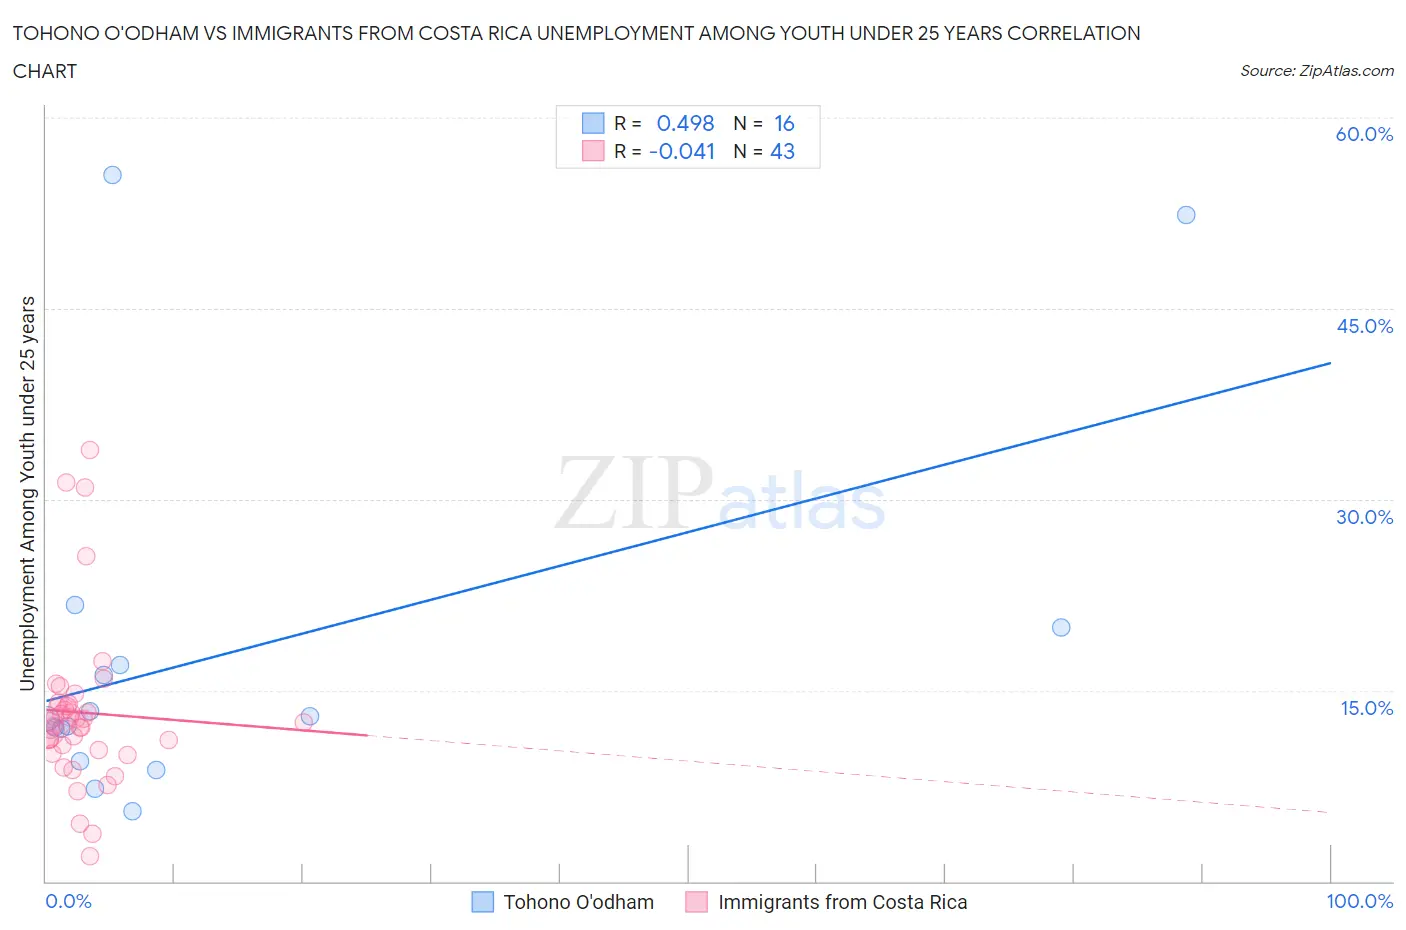
Tohono O'odham vs Immigrants from Costa Rica Unemployment Among Youth under 25 years Correlation Chart
The statistical analysis conducted on geographies consisting of 58,638,484 people shows a moderate positive correlation between the proportion of Tohono O'odham and unemployment rate among youth under the age of 25 in the United States with a correlation coefficient (R) of 0.498 and weighted average of 13.8%. Similarly, the statistical analysis conducted on geographies consisting of 203,462,703 people shows no correlation between the proportion of Immigrants from Costa Rica and unemployment rate among youth under the age of 25 in the United States with a correlation coefficient (R) of -0.041 and weighted average of 11.8%, a difference of 16.6%.
Unemployment Among Youth under 25 years Correlation Summary
| Measurement | Tohono O'odham | Immigrants from Costa Rica |
| Minimum | 5.5% | 2.0% |
| Maximum | 55.5% | 33.9% |
| Range | 50.0% | 31.9% |
| Mean | 18.1% | 13.2% |
| Median | 12.9% | 12.5% |
| Interquartile 25% (IQ1) | 10.7% | 10.3% |
| Interquartile 75% (IQ3) | 18.5% | 13.9% |
| Interquartile Range (IQR) | 7.7% | 3.6% |
| Standard Deviation (Sample) | 14.6% | 6.4% |
| Standard Deviation (Population) | 14.2% | 6.4% |
Similar Demographics by Unemployment Among Youth under 25 years
Demographics Similar to Tohono O'odham by Unemployment Among Youth under 25 years
In terms of unemployment among youth under 25 years, the demographic groups most similar to Tohono O'odham are Immigrants from Cabo Verde (13.8%, a difference of 0.21%), Shoshone (13.7%, a difference of 0.22%), Immigrants from Senegal (13.8%, a difference of 0.38%), Immigrants from Sierra Leone (13.8%, a difference of 0.43%), and Belizean (13.8%, a difference of 0.46%).
| Demographics | Rating | Rank | Unemployment Among Youth under 25 years |
| Central American Indians | 0.0 /100 | #292 | Tragic 13.5% |
| Spanish American Indians | 0.0 /100 | #293 | Tragic 13.5% |
| Immigrants | Caribbean | 0.0 /100 | #294 | Tragic 13.5% |
| Chippewa | 0.0 /100 | #295 | Tragic 13.5% |
| Senegalese | 0.0 /100 | #296 | Tragic 13.5% |
| U.S. Virgin Islanders | 0.0 /100 | #297 | Tragic 13.6% |
| Shoshone | 0.0 /100 | #298 | Tragic 13.7% |
| Tohono O'odham | 0.0 /100 | #299 | Tragic 13.8% |
| Immigrants | Cabo Verde | 0.0 /100 | #300 | Tragic 13.8% |
| Immigrants | Senegal | 0.0 /100 | #301 | Tragic 13.8% |
| Immigrants | Sierra Leone | 0.0 /100 | #302 | Tragic 13.8% |
| Belizeans | 0.0 /100 | #303 | Tragic 13.8% |
| Houma | 0.0 /100 | #304 | Tragic 13.8% |
| Haitians | 0.0 /100 | #305 | Tragic 13.9% |
| Pueblo | 0.0 /100 | #306 | Tragic 13.9% |
Demographics Similar to Immigrants from Costa Rica by Unemployment Among Youth under 25 years
In terms of unemployment among youth under 25 years, the demographic groups most similar to Immigrants from Costa Rica are Immigrants from Peru (11.8%, a difference of 0.010%), Marshallese (11.8%, a difference of 0.050%), Palestinian (11.8%, a difference of 0.060%), Peruvian (11.8%, a difference of 0.10%), and Arab (11.8%, a difference of 0.21%).
| Demographics | Rating | Rank | Unemployment Among Youth under 25 years |
| Koreans | 23.9 /100 | #197 | Fair 11.7% |
| Cherokee | 21.2 /100 | #198 | Fair 11.8% |
| Immigrants | Colombia | 20.9 /100 | #199 | Fair 11.8% |
| Arabs | 18.0 /100 | #200 | Poor 11.8% |
| Palestinians | 16.0 /100 | #201 | Poor 11.8% |
| Marshallese | 15.8 /100 | #202 | Poor 11.8% |
| Immigrants | Peru | 15.3 /100 | #203 | Poor 11.8% |
| Immigrants | Costa Rica | 15.2 /100 | #204 | Poor 11.8% |
| Peruvians | 14.0 /100 | #205 | Poor 11.8% |
| Immigrants | Pakistan | 12.6 /100 | #206 | Poor 11.8% |
| Immigrants | Southern Europe | 12.3 /100 | #207 | Poor 11.8% |
| Comanche | 12.1 /100 | #208 | Poor 11.8% |
| Immigrants | Lebanon | 11.3 /100 | #209 | Poor 11.8% |
| Assyrians/Chaldeans/Syriacs | 9.8 /100 | #210 | Tragic 11.9% |
| Immigrants | Philippines | 9.2 /100 | #211 | Tragic 11.9% |