Tohono O'odham vs Immigrants from Cameroon Unemployment Among Youth under 25 years
COMPARE
Tohono O'odham
Immigrants from Cameroon
Unemployment Among Youth under 25 years
Unemployment Among Youth under 25 years Comparison
Tohono O'odham
Immigrants from Cameroon
13.8%
UNEMPLOYMENT AMONG YOUTH UNDER 25 YEARS
0.0/ 100
METRIC RATING
299th/ 347
METRIC RANK
13.3%
UNEMPLOYMENT AMONG YOUTH UNDER 25 YEARS
0.0/ 100
METRIC RATING
283rd/ 347
METRIC RANK
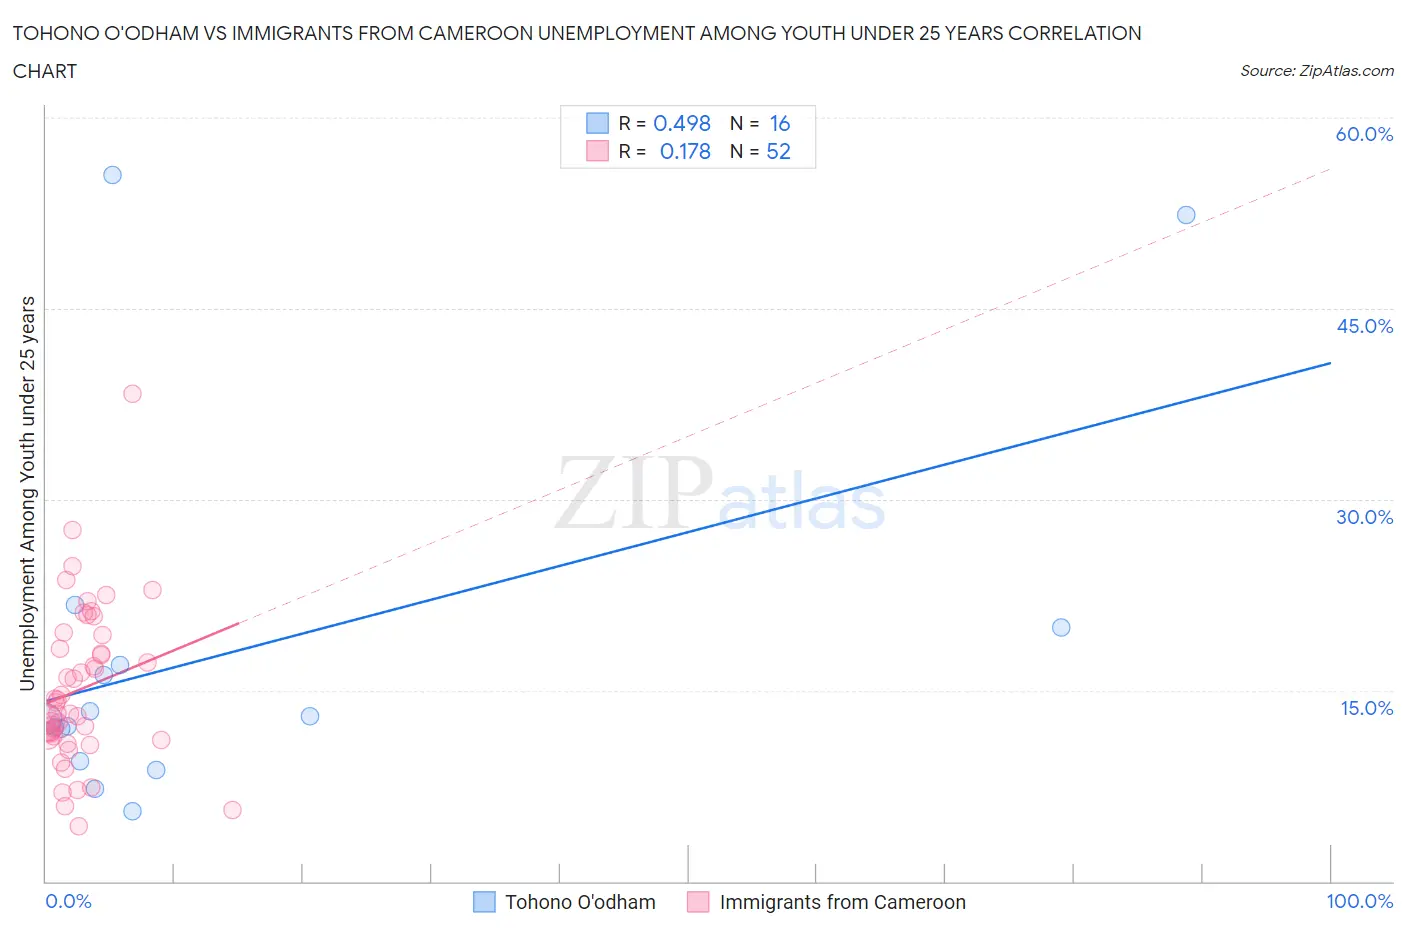
Tohono O'odham vs Immigrants from Cameroon Unemployment Among Youth under 25 years Correlation Chart
The statistical analysis conducted on geographies consisting of 58,638,484 people shows a moderate positive correlation between the proportion of Tohono O'odham and unemployment rate among youth under the age of 25 in the United States with a correlation coefficient (R) of 0.498 and weighted average of 13.8%. Similarly, the statistical analysis conducted on geographies consisting of 130,379,690 people shows a poor positive correlation between the proportion of Immigrants from Cameroon and unemployment rate among youth under the age of 25 in the United States with a correlation coefficient (R) of 0.178 and weighted average of 13.3%, a difference of 3.6%.
Unemployment Among Youth under 25 years Correlation Summary
| Measurement | Tohono O'odham | Immigrants from Cameroon |
| Minimum | 5.5% | 4.4% |
| Maximum | 55.5% | 38.3% |
| Range | 50.0% | 33.9% |
| Mean | 18.1% | 15.1% |
| Median | 12.9% | 13.6% |
| Interquartile 25% (IQ1) | 10.7% | 11.3% |
| Interquartile 75% (IQ3) | 18.5% | 18.8% |
| Interquartile Range (IQR) | 7.7% | 7.5% |
| Standard Deviation (Sample) | 14.6% | 6.2% |
| Standard Deviation (Population) | 14.2% | 6.2% |
Demographics Similar to Tohono O'odham and Immigrants from Cameroon by Unemployment Among Youth under 25 years
In terms of unemployment among youth under 25 years, the demographic groups most similar to Tohono O'odham are Immigrants from Cabo Verde (13.8%, a difference of 0.21%), Shoshone (13.7%, a difference of 0.22%), Immigrants from Senegal (13.8%, a difference of 0.38%), U.S. Virgin Islander (13.6%, a difference of 1.1%), and Senegalese (13.5%, a difference of 1.7%). Similarly, the demographic groups most similar to Immigrants from Cameroon are Lumbee (13.3%, a difference of 0.010%), Sierra Leonean (13.3%, a difference of 0.020%), Armenian (13.3%, a difference of 0.030%), Ghanaian (13.3%, a difference of 0.10%), and Blackfeet (13.3%, a difference of 0.15%).
| Demographics | Rating | Rank | Unemployment Among Youth under 25 years |
| Armenians | 0.0 /100 | #281 | Tragic 13.3% |
| Sierra Leoneans | 0.0 /100 | #282 | Tragic 13.3% |
| Immigrants | Cameroon | 0.0 /100 | #283 | Tragic 13.3% |
| Lumbee | 0.0 /100 | #284 | Tragic 13.3% |
| Ghanaians | 0.0 /100 | #285 | Tragic 13.3% |
| Blackfeet | 0.0 /100 | #286 | Tragic 13.3% |
| Ecuadorians | 0.0 /100 | #287 | Tragic 13.3% |
| Immigrants | Western Africa | 0.0 /100 | #288 | Tragic 13.4% |
| Immigrants | Ghana | 0.0 /100 | #289 | Tragic 13.4% |
| Immigrants | Ecuador | 0.0 /100 | #290 | Tragic 13.4% |
| Apache | 0.0 /100 | #291 | Tragic 13.5% |
| Central American Indians | 0.0 /100 | #292 | Tragic 13.5% |
| Spanish American Indians | 0.0 /100 | #293 | Tragic 13.5% |
| Immigrants | Caribbean | 0.0 /100 | #294 | Tragic 13.5% |
| Chippewa | 0.0 /100 | #295 | Tragic 13.5% |
| Senegalese | 0.0 /100 | #296 | Tragic 13.5% |
| U.S. Virgin Islanders | 0.0 /100 | #297 | Tragic 13.6% |
| Shoshone | 0.0 /100 | #298 | Tragic 13.7% |
| Tohono O'odham | 0.0 /100 | #299 | Tragic 13.8% |
| Immigrants | Cabo Verde | 0.0 /100 | #300 | Tragic 13.8% |
| Immigrants | Senegal | 0.0 /100 | #301 | Tragic 13.8% |