Tohono O'odham vs Immigrants from the Azores Male Unemployment
COMPARE
Tohono O'odham
Immigrants from the Azores
Male Unemployment
Male Unemployment Comparison
Tohono O'odham
Immigrants from the Azores
10.2%
MALE UNEMPLOYMENT
0.0/ 100
METRIC RATING
342nd/ 347
METRIC RANK
6.4%
MALE UNEMPLOYMENT
0.0/ 100
METRIC RATING
291st/ 347
METRIC RANK
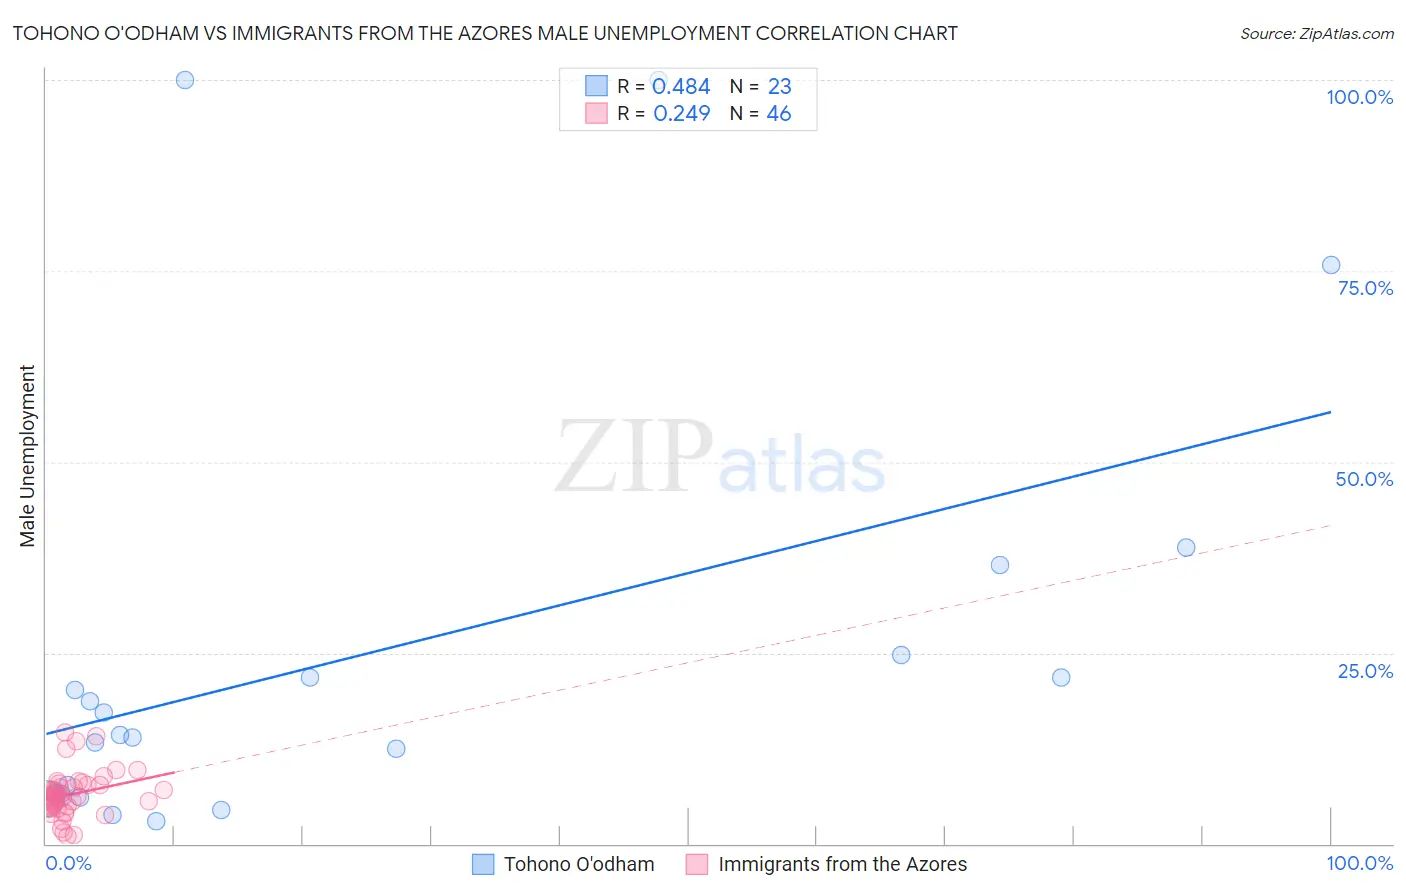
Tohono O'odham vs Immigrants from the Azores Male Unemployment Correlation Chart
The statistical analysis conducted on geographies consisting of 58,664,487 people shows a moderate positive correlation between the proportion of Tohono O'odham and unemployment rate among males in the United States with a correlation coefficient (R) of 0.484 and weighted average of 10.2%. Similarly, the statistical analysis conducted on geographies consisting of 46,221,475 people shows a weak positive correlation between the proportion of Immigrants from the Azores and unemployment rate among males in the United States with a correlation coefficient (R) of 0.249 and weighted average of 6.4%, a difference of 58.5%.
Male Unemployment Correlation Summary
| Measurement | Tohono O'odham | Immigrants from the Azores |
| Minimum | 2.9% | 1.0% |
| Maximum | 100.0% | 14.6% |
| Range | 97.1% | 13.6% |
| Mean | 24.9% | 6.5% |
| Median | 14.2% | 6.1% |
| Interquartile 25% (IQ1) | 6.5% | 4.9% |
| Interquartile 75% (IQ3) | 24.7% | 7.7% |
| Interquartile Range (IQR) | 18.2% | 2.8% |
| Standard Deviation (Sample) | 28.5% | 3.0% |
| Standard Deviation (Population) | 27.9% | 3.0% |
Similar Demographics by Male Unemployment
Demographics Similar to Tohono O'odham by Male Unemployment
In terms of male unemployment, the demographic groups most similar to Tohono O'odham are Navajo (9.8%, a difference of 3.4%), Alaskan Athabascan (9.8%, a difference of 3.7%), Cheyenne (9.8%, a difference of 3.8%), Crow (10.6%, a difference of 4.4%), and Hopi (10.8%, a difference of 6.1%).
| Demographics | Rating | Rank | Male Unemployment |
| Sioux | 0.0 /100 | #333 | Tragic 8.4% |
| Tsimshian | 0.0 /100 | #334 | Tragic 8.5% |
| Pueblo | 0.0 /100 | #335 | Tragic 8.5% |
| Yuman | 0.0 /100 | #336 | Tragic 8.6% |
| Puerto Ricans | 0.0 /100 | #337 | Tragic 8.6% |
| Apache | 0.0 /100 | #338 | Tragic 8.6% |
| Cheyenne | 0.0 /100 | #339 | Tragic 9.8% |
| Alaskan Athabascans | 0.0 /100 | #340 | Tragic 9.8% |
| Navajo | 0.0 /100 | #341 | Tragic 9.8% |
| Tohono O'odham | 0.0 /100 | #342 | Tragic 10.2% |
| Crow | 0.0 /100 | #343 | Tragic 10.6% |
| Hopi | 0.0 /100 | #344 | Tragic 10.8% |
| Arapaho | 0.0 /100 | #345 | Tragic 11.0% |
| Inupiat | 0.0 /100 | #346 | Tragic 12.1% |
| Yup'ik | 0.0 /100 | #347 | Tragic 16.4% |
Demographics Similar to Immigrants from the Azores by Male Unemployment
In terms of male unemployment, the demographic groups most similar to Immigrants from the Azores are Nepalese (6.4%, a difference of 0.34%), Haitian (6.4%, a difference of 0.38%), Senegalese (6.4%, a difference of 0.48%), U.S. Virgin Islander (6.4%, a difference of 0.52%), and Belizean (6.5%, a difference of 1.3%).
| Demographics | Rating | Rank | Male Unemployment |
| Spanish American Indians | 0.0 /100 | #284 | Tragic 6.2% |
| Immigrants | Ecuador | 0.0 /100 | #285 | Tragic 6.2% |
| Africans | 0.0 /100 | #286 | Tragic 6.3% |
| Central American Indians | 0.0 /100 | #287 | Tragic 6.3% |
| Immigrants | Senegal | 0.0 /100 | #288 | Tragic 6.3% |
| Immigrants | Caribbean | 0.0 /100 | #289 | Tragic 6.3% |
| U.S. Virgin Islanders | 0.0 /100 | #290 | Tragic 6.4% |
| Immigrants | Azores | 0.0 /100 | #291 | Tragic 6.4% |
| Nepalese | 0.0 /100 | #292 | Tragic 6.4% |
| Haitians | 0.0 /100 | #293 | Tragic 6.4% |
| Senegalese | 0.0 /100 | #294 | Tragic 6.4% |
| Belizeans | 0.0 /100 | #295 | Tragic 6.5% |
| Immigrants | Haiti | 0.0 /100 | #296 | Tragic 6.5% |
| Chippewa | 0.0 /100 | #297 | Tragic 6.6% |
| Jamaicans | 0.0 /100 | #298 | Tragic 6.6% |