Swedish vs Immigrants from the Azores Male Unemployment
COMPARE
Swedish
Immigrants from the Azores
Male Unemployment
Male Unemployment Comparison
Swedes
Immigrants from the Azores
4.6%
MALE UNEMPLOYMENT
100.0/ 100
METRIC RATING
11th/ 347
METRIC RANK
6.4%
MALE UNEMPLOYMENT
0.0/ 100
METRIC RATING
291st/ 347
METRIC RANK
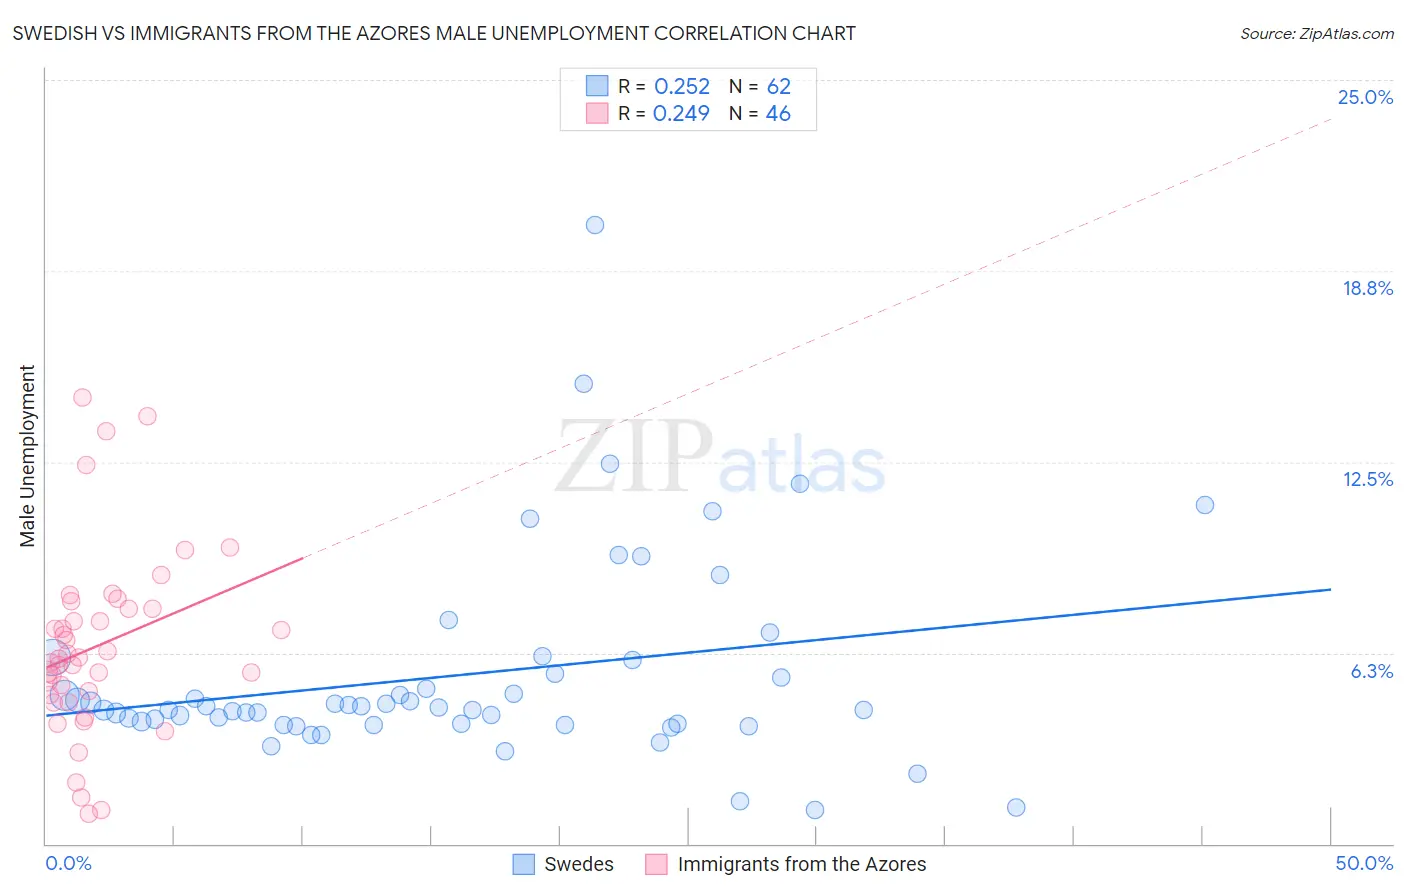
Swedish vs Immigrants from the Azores Male Unemployment Correlation Chart
The statistical analysis conducted on geographies consisting of 530,954,866 people shows a weak positive correlation between the proportion of Swedes and unemployment rate among males in the United States with a correlation coefficient (R) of 0.252 and weighted average of 4.6%. Similarly, the statistical analysis conducted on geographies consisting of 46,221,475 people shows a weak positive correlation between the proportion of Immigrants from the Azores and unemployment rate among males in the United States with a correlation coefficient (R) of 0.249 and weighted average of 6.4%, a difference of 38.6%.
Male Unemployment Correlation Summary
| Measurement | Swedish | Immigrants from the Azores |
| Minimum | 1.1% | 1.0% |
| Maximum | 20.3% | 14.6% |
| Range | 19.2% | 13.6% |
| Mean | 5.5% | 6.5% |
| Median | 4.4% | 6.1% |
| Interquartile 25% (IQ1) | 3.9% | 4.9% |
| Interquartile 75% (IQ3) | 5.6% | 7.7% |
| Interquartile Range (IQR) | 1.7% | 2.8% |
| Standard Deviation (Sample) | 3.3% | 3.0% |
| Standard Deviation (Population) | 3.3% | 3.0% |
Similar Demographics by Male Unemployment
Demographics Similar to Swedes by Male Unemployment
In terms of male unemployment, the demographic groups most similar to Swedes are Cuban (4.6%, a difference of 0.20%), Immigrants from Bolivia (4.7%, a difference of 0.73%), Thai (4.6%, a difference of 0.81%), Bolivian (4.7%, a difference of 1.4%), and German (4.7%, a difference of 1.4%).
| Demographics | Rating | Rank | Male Unemployment |
| Immigrants | Venezuela | 100.0 /100 | #4 | Exceptional 4.4% |
| Danes | 100.0 /100 | #5 | Exceptional 4.5% |
| Venezuelans | 100.0 /100 | #6 | Exceptional 4.5% |
| Czechs | 100.0 /100 | #7 | Exceptional 4.5% |
| Luxembourgers | 100.0 /100 | #8 | Exceptional 4.5% |
| Thais | 100.0 /100 | #9 | Exceptional 4.6% |
| Cubans | 100.0 /100 | #10 | Exceptional 4.6% |
| Swedes | 100.0 /100 | #11 | Exceptional 4.6% |
| Immigrants | Bolivia | 100.0 /100 | #12 | Exceptional 4.7% |
| Bolivians | 100.0 /100 | #13 | Exceptional 4.7% |
| Germans | 100.0 /100 | #14 | Exceptional 4.7% |
| Scandinavians | 100.0 /100 | #15 | Exceptional 4.7% |
| Swiss | 99.9 /100 | #16 | Exceptional 4.7% |
| Filipinos | 99.9 /100 | #17 | Exceptional 4.7% |
| English | 99.9 /100 | #18 | Exceptional 4.8% |
Demographics Similar to Immigrants from the Azores by Male Unemployment
In terms of male unemployment, the demographic groups most similar to Immigrants from the Azores are Nepalese (6.4%, a difference of 0.34%), Haitian (6.4%, a difference of 0.38%), Senegalese (6.4%, a difference of 0.48%), U.S. Virgin Islander (6.4%, a difference of 0.52%), and Belizean (6.5%, a difference of 1.3%).
| Demographics | Rating | Rank | Male Unemployment |
| Spanish American Indians | 0.0 /100 | #284 | Tragic 6.2% |
| Immigrants | Ecuador | 0.0 /100 | #285 | Tragic 6.2% |
| Africans | 0.0 /100 | #286 | Tragic 6.3% |
| Central American Indians | 0.0 /100 | #287 | Tragic 6.3% |
| Immigrants | Senegal | 0.0 /100 | #288 | Tragic 6.3% |
| Immigrants | Caribbean | 0.0 /100 | #289 | Tragic 6.3% |
| U.S. Virgin Islanders | 0.0 /100 | #290 | Tragic 6.4% |
| Immigrants | Azores | 0.0 /100 | #291 | Tragic 6.4% |
| Nepalese | 0.0 /100 | #292 | Tragic 6.4% |
| Haitians | 0.0 /100 | #293 | Tragic 6.4% |
| Senegalese | 0.0 /100 | #294 | Tragic 6.4% |
| Belizeans | 0.0 /100 | #295 | Tragic 6.5% |
| Immigrants | Haiti | 0.0 /100 | #296 | Tragic 6.5% |
| Chippewa | 0.0 /100 | #297 | Tragic 6.6% |
| Jamaicans | 0.0 /100 | #298 | Tragic 6.6% |