Tohono O'odham vs Guamanian/Chamorro Unemployment
COMPARE
Tohono O'odham
Guamanian/Chamorro
Unemployment
Unemployment Comparison
Tohono O'odham
Guamanians/Chamorros
8.9%
UNEMPLOYMENT
0.0/ 100
METRIC RATING
341st/ 347
METRIC RANK
5.5%
UNEMPLOYMENT
6.3/ 100
METRIC RATING
228th/ 347
METRIC RANK
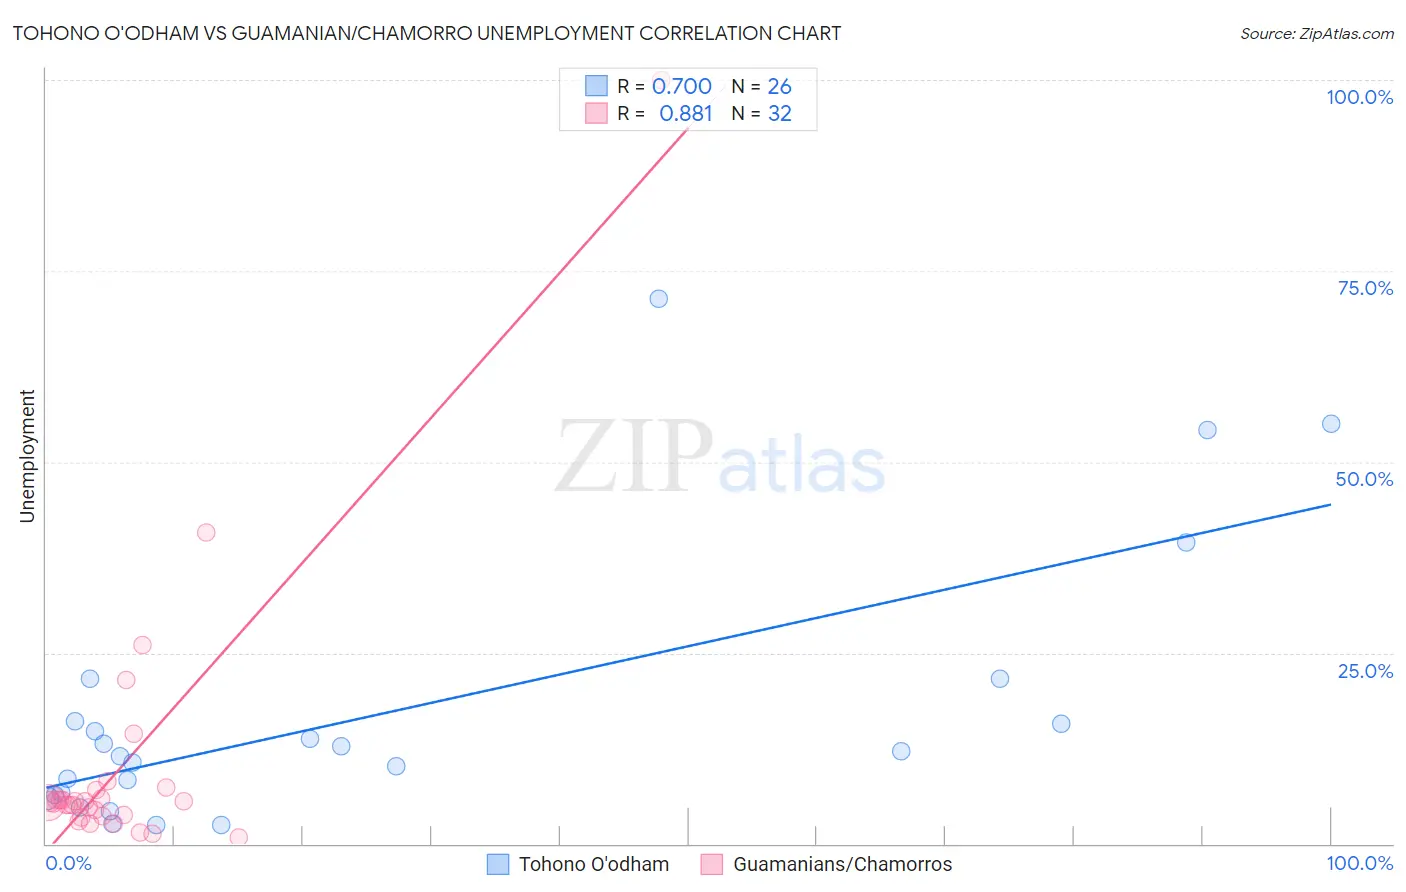
Tohono O'odham vs Guamanian/Chamorro Unemployment Correlation Chart
The statistical analysis conducted on geographies consisting of 58,714,465 people shows a strong positive correlation between the proportion of Tohono O'odham and unemployment in the United States with a correlation coefficient (R) of 0.700 and weighted average of 8.9%. Similarly, the statistical analysis conducted on geographies consisting of 221,788,183 people shows a very strong positive correlation between the proportion of Guamanians/Chamorros and unemployment in the United States with a correlation coefficient (R) of 0.881 and weighted average of 5.5%, a difference of 62.1%.
Unemployment Correlation Summary
| Measurement | Tohono O'odham | Guamanian/Chamorro |
| Minimum | 2.4% | 0.80% |
| Maximum | 71.4% | 100.0% |
| Range | 69.0% | 99.2% |
| Mean | 17.2% | 10.3% |
| Median | 11.8% | 5.5% |
| Interquartile 25% (IQ1) | 6.4% | 3.6% |
| Interquartile 75% (IQ3) | 16.1% | 6.5% |
| Interquartile Range (IQR) | 9.7% | 2.8% |
| Standard Deviation (Sample) | 17.8% | 18.2% |
| Standard Deviation (Population) | 17.5% | 17.9% |
Similar Demographics by Unemployment
Demographics Similar to Tohono O'odham by Unemployment
In terms of unemployment, the demographic groups most similar to Tohono O'odham are Hopi (8.9%, a difference of 0.45%), Yuman (9.1%, a difference of 2.1%), Puerto Rican (8.4%, a difference of 5.4%), Navajo (8.4%, a difference of 6.3%), and Pima (8.2%, a difference of 7.9%).
| Demographics | Rating | Rank | Unemployment |
| Immigrants | Dominican Republic | 0.0 /100 | #333 | Tragic 7.4% |
| Apache | 0.0 /100 | #334 | Tragic 7.4% |
| Alaskan Athabascans | 0.0 /100 | #335 | Tragic 7.7% |
| Immigrants | Yemen | 0.0 /100 | #336 | Tragic 7.7% |
| Cheyenne | 0.0 /100 | #337 | Tragic 8.0% |
| Pima | 0.0 /100 | #338 | Tragic 8.2% |
| Navajo | 0.0 /100 | #339 | Tragic 8.4% |
| Puerto Ricans | 0.0 /100 | #340 | Tragic 8.4% |
| Tohono O'odham | 0.0 /100 | #341 | Tragic 8.9% |
| Hopi | 0.0 /100 | #342 | Tragic 8.9% |
| Yuman | 0.0 /100 | #343 | Tragic 9.1% |
| Arapaho | 0.0 /100 | #344 | Tragic 9.8% |
| Inupiat | 0.0 /100 | #345 | Tragic 10.1% |
| Crow | 0.0 /100 | #346 | Tragic 11.1% |
| Yup'ik | 0.0 /100 | #347 | Tragic 13.6% |
Demographics Similar to Guamanians/Chamorros by Unemployment
In terms of unemployment, the demographic groups most similar to Guamanians/Chamorros are Immigrants from Lebanon (5.5%, a difference of 0.15%), Samoan (5.5%, a difference of 0.18%), Hawaiian (5.5%, a difference of 0.26%), Ottawa (5.5%, a difference of 0.26%), and South American Indian (5.5%, a difference of 0.33%).
| Demographics | Rating | Rank | Unemployment |
| Immigrants | Philippines | 10.4 /100 | #221 | Poor 5.4% |
| Iroquois | 10.3 /100 | #222 | Poor 5.4% |
| Seminole | 9.2 /100 | #223 | Tragic 5.4% |
| Israelis | 8.8 /100 | #224 | Tragic 5.4% |
| South American Indians | 7.8 /100 | #225 | Tragic 5.5% |
| Samoans | 7.1 /100 | #226 | Tragic 5.5% |
| Immigrants | Lebanon | 7.0 /100 | #227 | Tragic 5.5% |
| Guamanians/Chamorros | 6.3 /100 | #228 | Tragic 5.5% |
| Hawaiians | 5.4 /100 | #229 | Tragic 5.5% |
| Ottawa | 5.4 /100 | #230 | Tragic 5.5% |
| Immigrants | Africa | 4.9 /100 | #231 | Tragic 5.5% |
| Comanche | 4.9 /100 | #232 | Tragic 5.5% |
| Immigrants | Syria | 4.8 /100 | #233 | Tragic 5.5% |
| Panamanians | 4.7 /100 | #234 | Tragic 5.5% |
| Immigrants | Panama | 3.4 /100 | #235 | Tragic 5.5% |