Syrian vs Immigrants from Afghanistan Unemployment
COMPARE
Syrian
Immigrants from Afghanistan
Unemployment
Unemployment Comparison
Syrians
Immigrants from Afghanistan
5.2%
UNEMPLOYMENT
77.7/ 100
METRIC RATING
149th/ 347
METRIC RANK
5.3%
UNEMPLOYMENT
28.6/ 100
METRIC RATING
199th/ 347
METRIC RANK
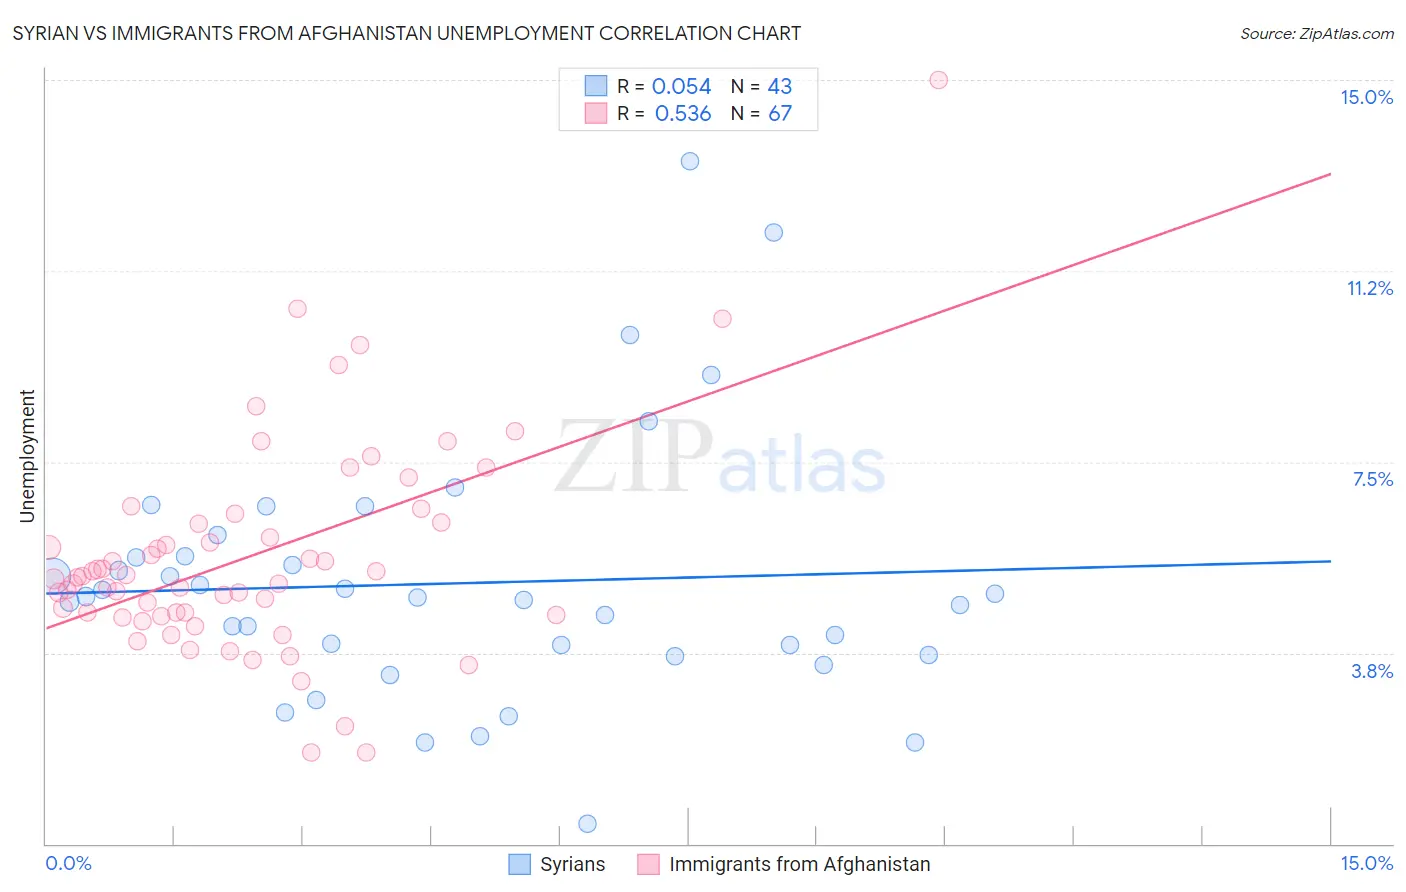
Syrian vs Immigrants from Afghanistan Unemployment Correlation Chart
The statistical analysis conducted on geographies consisting of 266,191,069 people shows a slight positive correlation between the proportion of Syrians and unemployment in the United States with a correlation coefficient (R) of 0.054 and weighted average of 5.2%. Similarly, the statistical analysis conducted on geographies consisting of 147,628,423 people shows a substantial positive correlation between the proportion of Immigrants from Afghanistan and unemployment in the United States with a correlation coefficient (R) of 0.536 and weighted average of 5.3%, a difference of 3.4%.
Unemployment Correlation Summary
| Measurement | Syrian | Immigrants from Afghanistan |
| Minimum | 0.40% | 1.8% |
| Maximum | 13.4% | 15.0% |
| Range | 13.0% | 13.2% |
| Mean | 5.1% | 5.6% |
| Median | 4.8% | 5.2% |
| Interquartile 25% (IQ1) | 3.7% | 4.5% |
| Interquartile 75% (IQ3) | 5.7% | 6.3% |
| Interquartile Range (IQR) | 2.0% | 1.8% |
| Standard Deviation (Sample) | 2.5% | 2.1% |
| Standard Deviation (Population) | 2.5% | 2.1% |
Similar Demographics by Unemployment
Demographics Similar to Syrians by Unemployment
In terms of unemployment, the demographic groups most similar to Syrians are Immigrants from Italy (5.1%, a difference of 0.13%), Potawatomi (5.2%, a difference of 0.14%), Immigrants from Eastern Europe (5.2%, a difference of 0.21%), Immigrants from Hong Kong (5.2%, a difference of 0.22%), and Egyptian (5.2%, a difference of 0.22%).
| Demographics | Rating | Rank | Unemployment |
| Immigrants | Pakistan | 83.2 /100 | #142 | Excellent 5.1% |
| Immigrants | Chile | 82.8 /100 | #143 | Excellent 5.1% |
| Indonesians | 82.3 /100 | #144 | Excellent 5.1% |
| Immigrants | Norway | 81.8 /100 | #145 | Excellent 5.1% |
| Immigrants | Asia | 81.8 /100 | #146 | Excellent 5.1% |
| Indians (Asian) | 81.6 /100 | #147 | Excellent 5.1% |
| Immigrants | Italy | 79.1 /100 | #148 | Good 5.1% |
| Syrians | 77.7 /100 | #149 | Good 5.2% |
| Potawatomi | 76.2 /100 | #150 | Good 5.2% |
| Immigrants | Eastern Europe | 75.3 /100 | #151 | Good 5.2% |
| Immigrants | Hong Kong | 75.2 /100 | #152 | Good 5.2% |
| Egyptians | 75.2 /100 | #153 | Good 5.2% |
| Immigrants | China | 74.7 /100 | #154 | Good 5.2% |
| Immigrants | Northern Africa | 71.3 /100 | #155 | Good 5.2% |
| Immigrants | Kazakhstan | 70.4 /100 | #156 | Good 5.2% |
Demographics Similar to Immigrants from Afghanistan by Unemployment
In terms of unemployment, the demographic groups most similar to Immigrants from Afghanistan are Immigrants from Israel (5.3%, a difference of 0.0%), Immigrants from Uruguay (5.3%, a difference of 0.090%), Korean (5.3%, a difference of 0.090%), Peruvian (5.3%, a difference of 0.10%), and Immigrants from South Eastern Asia (5.3%, a difference of 0.12%).
| Demographics | Rating | Rank | Unemployment |
| South Americans | 33.9 /100 | #192 | Fair 5.3% |
| Immigrants | Somalia | 33.8 /100 | #193 | Fair 5.3% |
| Immigrants | Laos | 30.9 /100 | #194 | Fair 5.3% |
| Immigrants | Southern Europe | 30.9 /100 | #195 | Fair 5.3% |
| Peruvians | 29.9 /100 | #196 | Fair 5.3% |
| Immigrants | Uruguay | 29.8 /100 | #197 | Fair 5.3% |
| Immigrants | Israel | 28.6 /100 | #198 | Fair 5.3% |
| Immigrants | Afghanistan | 28.6 /100 | #199 | Fair 5.3% |
| Koreans | 27.4 /100 | #200 | Fair 5.3% |
| Immigrants | South Eastern Asia | 27.0 /100 | #201 | Fair 5.3% |
| Cherokee | 25.5 /100 | #202 | Fair 5.3% |
| Immigrants | Micronesia | 25.2 /100 | #203 | Fair 5.3% |
| Immigrants | Ukraine | 24.9 /100 | #204 | Fair 5.3% |
| Native Hawaiians | 24.1 /100 | #205 | Fair 5.3% |
| Immigrants | Peru | 22.7 /100 | #206 | Fair 5.4% |