Swiss vs Immigrants from Nepal Female Unemployment
COMPARE
Swiss
Immigrants from Nepal
Female Unemployment
Female Unemployment Comparison
Swiss
Immigrants from Nepal
4.6%
FEMALE UNEMPLOYMENT
100.0/ 100
METRIC RATING
10th/ 347
METRIC RANK
4.9%
FEMALE UNEMPLOYMENT
98.6/ 100
METRIC RATING
62nd/ 347
METRIC RANK
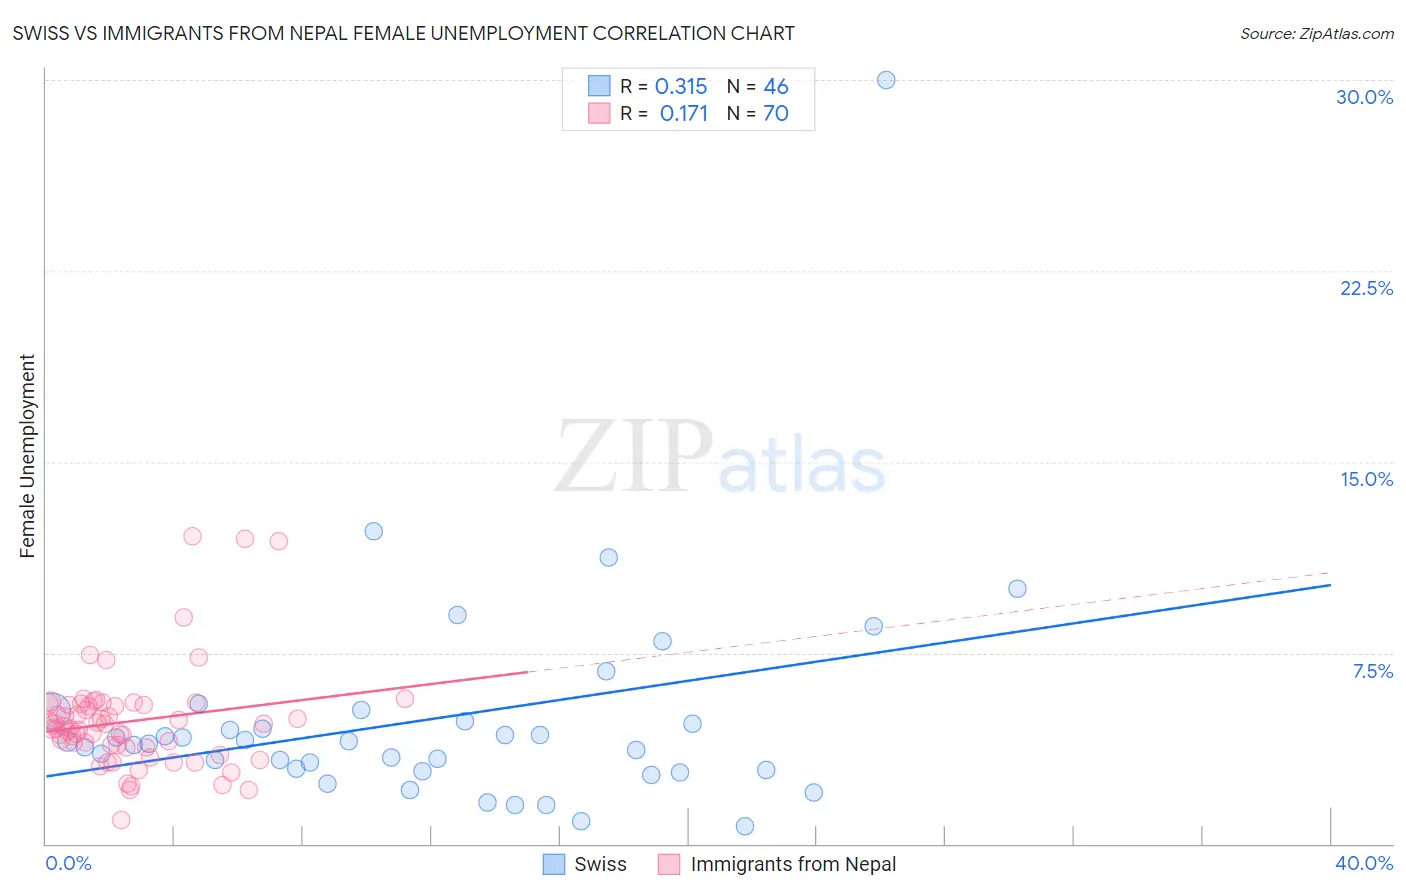
Swiss vs Immigrants from Nepal Female Unemployment Correlation Chart
The statistical analysis conducted on geographies consisting of 458,890,724 people shows a mild positive correlation between the proportion of Swiss and unemploymnet rate among females in the United States with a correlation coefficient (R) of 0.315 and weighted average of 4.6%. Similarly, the statistical analysis conducted on geographies consisting of 186,597,918 people shows a poor positive correlation between the proportion of Immigrants from Nepal and unemploymnet rate among females in the United States with a correlation coefficient (R) of 0.171 and weighted average of 4.9%, a difference of 8.0%.
Female Unemployment Correlation Summary
| Measurement | Swiss | Immigrants from Nepal |
| Minimum | 0.70% | 0.93% |
| Maximum | 30.0% | 12.1% |
| Range | 29.3% | 11.2% |
| Mean | 4.9% | 4.8% |
| Median | 4.0% | 4.6% |
| Interquartile 25% (IQ1) | 2.9% | 3.8% |
| Interquartile 75% (IQ3) | 4.8% | 5.5% |
| Interquartile Range (IQR) | 1.9% | 1.7% |
| Standard Deviation (Sample) | 4.5% | 2.0% |
| Standard Deviation (Population) | 4.5% | 2.0% |
Similar Demographics by Female Unemployment
Demographics Similar to Swiss by Female Unemployment
In terms of female unemployment, the demographic groups most similar to Swiss are Scandinavian (4.6%, a difference of 0.11%), Dutch (4.6%, a difference of 0.71%), Belgian (4.6%, a difference of 0.86%), Slovene (4.5%, a difference of 1.3%), and Finnish (4.6%, a difference of 1.5%).
| Demographics | Rating | Rank | Female Unemployment |
| Luxembourgers | 100.0 /100 | #3 | Exceptional 4.4% |
| Danes | 100.0 /100 | #4 | Exceptional 4.4% |
| Hmong | 100.0 /100 | #5 | Exceptional 4.4% |
| Swedes | 100.0 /100 | #6 | Exceptional 4.4% |
| Chinese | 100.0 /100 | #7 | Exceptional 4.5% |
| Germans | 100.0 /100 | #8 | Exceptional 4.5% |
| Slovenes | 100.0 /100 | #9 | Exceptional 4.5% |
| Swiss | 100.0 /100 | #10 | Exceptional 4.6% |
| Scandinavians | 100.0 /100 | #11 | Exceptional 4.6% |
| Dutch | 100.0 /100 | #12 | Exceptional 4.6% |
| Belgians | 100.0 /100 | #13 | Exceptional 4.6% |
| Finns | 100.0 /100 | #14 | Exceptional 4.6% |
| English | 100.0 /100 | #15 | Exceptional 4.6% |
| Carpatho Rusyns | 99.9 /100 | #16 | Exceptional 4.7% |
| Croatians | 99.9 /100 | #17 | Exceptional 4.7% |
Demographics Similar to Immigrants from Nepal by Female Unemployment
In terms of female unemployment, the demographic groups most similar to Immigrants from Nepal are Immigrants from Canada (4.9%, a difference of 0.0%), Immigrants from Scotland (4.9%, a difference of 0.010%), Bhutanese (4.9%, a difference of 0.090%), Immigrants from Belgium (4.9%, a difference of 0.11%), and Celtic (4.9%, a difference of 0.12%).
| Demographics | Rating | Rank | Female Unemployment |
| Immigrants | Moldova | 99.0 /100 | #55 | Exceptional 4.9% |
| Serbians | 99.0 /100 | #56 | Exceptional 4.9% |
| Icelanders | 98.8 /100 | #57 | Exceptional 4.9% |
| Immigrants | Lithuania | 98.8 /100 | #58 | Exceptional 4.9% |
| Bhutanese | 98.7 /100 | #59 | Exceptional 4.9% |
| Immigrants | Scotland | 98.6 /100 | #60 | Exceptional 4.9% |
| Immigrants | Canada | 98.6 /100 | #61 | Exceptional 4.9% |
| Immigrants | Nepal | 98.6 /100 | #62 | Exceptional 4.9% |
| Immigrants | Belgium | 98.5 /100 | #63 | Exceptional 4.9% |
| Celtics | 98.5 /100 | #64 | Exceptional 4.9% |
| Immigrants | North America | 98.3 /100 | #65 | Exceptional 4.9% |
| Hungarians | 98.3 /100 | #66 | Exceptional 4.9% |
| Cubans | 98.3 /100 | #67 | Exceptional 4.9% |
| Tlingit-Haida | 98.3 /100 | #68 | Exceptional 4.9% |
| Immigrants | Ireland | 98.2 /100 | #69 | Exceptional 4.9% |