Swedish vs Alsatian Female Unemployment
COMPARE
Swedish
Alsatian
Female Unemployment
Female Unemployment Comparison
Swedes
Alsatians
4.4%
FEMALE UNEMPLOYMENT
100.0/ 100
METRIC RATING
6th/ 347
METRIC RANK
5.3%
FEMALE UNEMPLOYMENT
23.9/ 100
METRIC RATING
197th/ 347
METRIC RANK
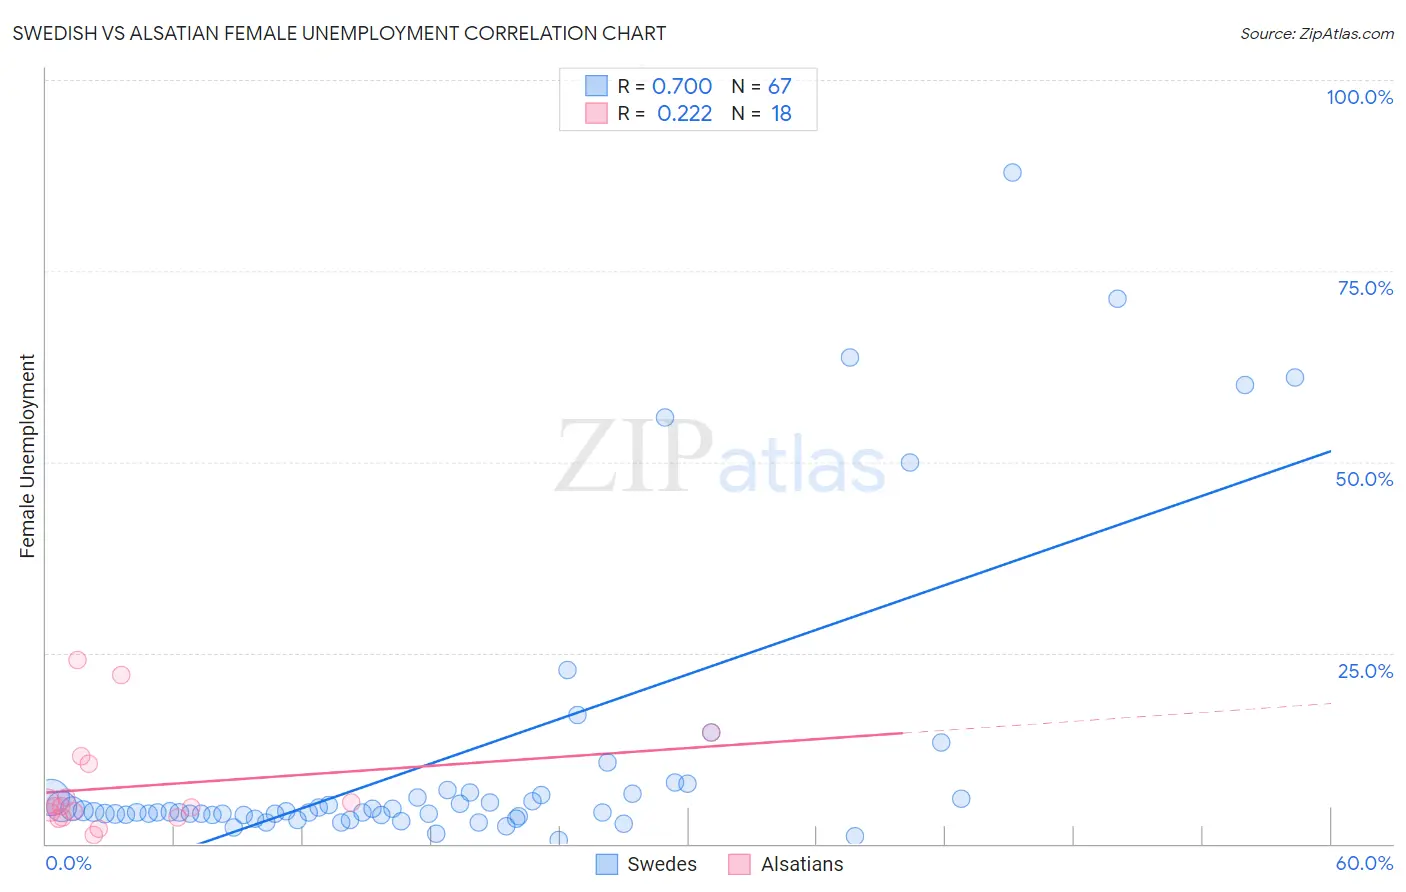
Swedish vs Alsatian Female Unemployment Correlation Chart
The statistical analysis conducted on geographies consisting of 528,532,486 people shows a strong positive correlation between the proportion of Swedes and unemploymnet rate among females in the United States with a correlation coefficient (R) of 0.700 and weighted average of 4.4%. Similarly, the statistical analysis conducted on geographies consisting of 82,574,814 people shows a weak positive correlation between the proportion of Alsatians and unemploymnet rate among females in the United States with a correlation coefficient (R) of 0.222 and weighted average of 5.3%, a difference of 20.2%.
Female Unemployment Correlation Summary
| Measurement | Swedish | Alsatian |
| Minimum | 0.50% | 1.2% |
| Maximum | 87.9% | 24.0% |
| Range | 87.4% | 22.8% |
| Mean | 11.3% | 7.5% |
| Median | 4.2% | 4.9% |
| Interquartile 25% (IQ1) | 3.7% | 3.5% |
| Interquartile 75% (IQ3) | 6.5% | 10.4% |
| Interquartile Range (IQR) | 2.8% | 6.9% |
| Standard Deviation (Sample) | 18.9% | 6.6% |
| Standard Deviation (Population) | 18.8% | 6.4% |
Similar Demographics by Female Unemployment
Demographics Similar to Swedes by Female Unemployment
In terms of female unemployment, the demographic groups most similar to Swedes are Chinese (4.5%, a difference of 0.77%), German (4.5%, a difference of 0.79%), Slovene (4.5%, a difference of 1.1%), Hmong (4.4%, a difference of 1.2%), and Danish (4.4%, a difference of 1.3%).
| Demographics | Rating | Rank | Female Unemployment |
| Norwegians | 100.0 /100 | #1 | Exceptional 4.2% |
| Czechs | 100.0 /100 | #2 | Exceptional 4.4% |
| Luxembourgers | 100.0 /100 | #3 | Exceptional 4.4% |
| Danes | 100.0 /100 | #4 | Exceptional 4.4% |
| Hmong | 100.0 /100 | #5 | Exceptional 4.4% |
| Swedes | 100.0 /100 | #6 | Exceptional 4.4% |
| Chinese | 100.0 /100 | #7 | Exceptional 4.5% |
| Germans | 100.0 /100 | #8 | Exceptional 4.5% |
| Slovenes | 100.0 /100 | #9 | Exceptional 4.5% |
| Swiss | 100.0 /100 | #10 | Exceptional 4.6% |
| Scandinavians | 100.0 /100 | #11 | Exceptional 4.6% |
| Dutch | 100.0 /100 | #12 | Exceptional 4.6% |
| Belgians | 100.0 /100 | #13 | Exceptional 4.6% |
| Finns | 100.0 /100 | #14 | Exceptional 4.6% |
| English | 100.0 /100 | #15 | Exceptional 4.6% |
Demographics Similar to Alsatians by Female Unemployment
In terms of female unemployment, the demographic groups most similar to Alsatians are Tsimshian (5.4%, a difference of 0.070%), Spaniard (5.3%, a difference of 0.10%), Hawaiian (5.4%, a difference of 0.14%), Immigrants from Colombia (5.3%, a difference of 0.18%), and Soviet Union (5.4%, a difference of 0.19%).
| Demographics | Rating | Rank | Female Unemployment |
| Ugandans | 31.2 /100 | #190 | Fair 5.3% |
| Cherokee | 30.8 /100 | #191 | Fair 5.3% |
| Portuguese | 28.6 /100 | #192 | Fair 5.3% |
| Arabs | 27.7 /100 | #193 | Fair 5.3% |
| Colombians | 27.0 /100 | #194 | Fair 5.3% |
| Immigrants | Colombia | 26.2 /100 | #195 | Fair 5.3% |
| Spaniards | 25.2 /100 | #196 | Fair 5.3% |
| Alsatians | 23.9 /100 | #197 | Fair 5.3% |
| Tsimshian | 23.1 /100 | #198 | Fair 5.4% |
| Hawaiians | 22.2 /100 | #199 | Fair 5.4% |
| Soviet Union | 21.7 /100 | #200 | Fair 5.4% |
| Immigrants | Middle Africa | 20.8 /100 | #201 | Fair 5.4% |
| Iroquois | 20.8 /100 | #202 | Fair 5.4% |
| Immigrants | South Eastern Asia | 20.3 /100 | #203 | Fair 5.4% |
| Immigrants | Israel | 19.7 /100 | #204 | Poor 5.4% |