Australian vs Alsatian Female Unemployment
COMPARE
Australian
Alsatian
Female Unemployment
Female Unemployment Comparison
Australians
Alsatians
4.9%
FEMALE UNEMPLOYMENT
99.2/ 100
METRIC RATING
49th/ 347
METRIC RANK
5.3%
FEMALE UNEMPLOYMENT
23.9/ 100
METRIC RATING
197th/ 347
METRIC RANK
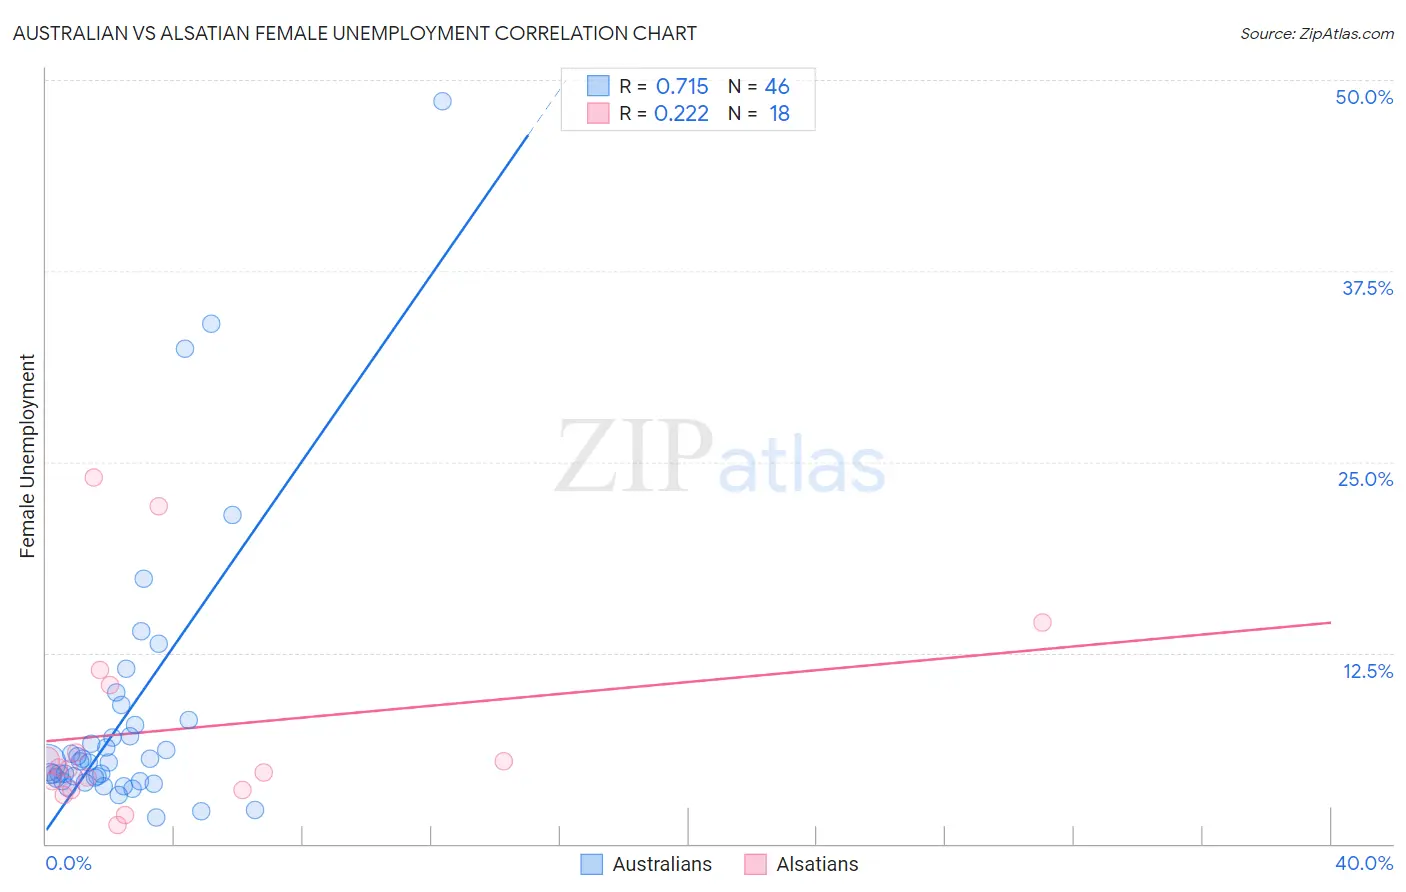
Australian vs Alsatian Female Unemployment Correlation Chart
The statistical analysis conducted on geographies consisting of 223,483,579 people shows a strong positive correlation between the proportion of Australians and unemploymnet rate among females in the United States with a correlation coefficient (R) of 0.715 and weighted average of 4.9%. Similarly, the statistical analysis conducted on geographies consisting of 82,574,814 people shows a weak positive correlation between the proportion of Alsatians and unemploymnet rate among females in the United States with a correlation coefficient (R) of 0.222 and weighted average of 5.3%, a difference of 9.7%.
Female Unemployment Correlation Summary
| Measurement | Australian | Alsatian |
| Minimum | 1.7% | 1.2% |
| Maximum | 48.6% | 24.0% |
| Range | 46.9% | 22.8% |
| Mean | 8.4% | 7.5% |
| Median | 5.3% | 4.9% |
| Interquartile 25% (IQ1) | 4.1% | 3.5% |
| Interquartile 75% (IQ3) | 7.8% | 10.4% |
| Interquartile Range (IQR) | 3.7% | 6.9% |
| Standard Deviation (Sample) | 9.1% | 6.6% |
| Standard Deviation (Population) | 9.0% | 6.4% |
Similar Demographics by Female Unemployment
Demographics Similar to Australians by Female Unemployment
In terms of female unemployment, the demographic groups most similar to Australians are Thai (4.9%, a difference of 0.0%), Okinawan (4.9%, a difference of 0.21%), Immigrants from Cuba (4.9%, a difference of 0.24%), Cambodian (4.9%, a difference of 0.25%), and Slavic (4.9%, a difference of 0.27%).
| Demographics | Rating | Rank | Female Unemployment |
| Italians | 99.5 /100 | #42 | Exceptional 4.8% |
| Eastern Europeans | 99.4 /100 | #43 | Exceptional 4.9% |
| Greeks | 99.4 /100 | #44 | Exceptional 4.9% |
| Austrians | 99.3 /100 | #45 | Exceptional 4.9% |
| Immigrants | Bulgaria | 99.3 /100 | #46 | Exceptional 4.9% |
| Okinawans | 99.3 /100 | #47 | Exceptional 4.9% |
| Thais | 99.2 /100 | #48 | Exceptional 4.9% |
| Australians | 99.2 /100 | #49 | Exceptional 4.9% |
| Immigrants | Cuba | 99.1 /100 | #50 | Exceptional 4.9% |
| Cambodians | 99.1 /100 | #51 | Exceptional 4.9% |
| Slavs | 99.1 /100 | #52 | Exceptional 4.9% |
| Whites/Caucasians | 99.0 /100 | #53 | Exceptional 4.9% |
| Immigrants | Zimbabwe | 99.0 /100 | #54 | Exceptional 4.9% |
| Immigrants | Moldova | 99.0 /100 | #55 | Exceptional 4.9% |
| Serbians | 99.0 /100 | #56 | Exceptional 4.9% |
Demographics Similar to Alsatians by Female Unemployment
In terms of female unemployment, the demographic groups most similar to Alsatians are Tsimshian (5.4%, a difference of 0.070%), Spaniard (5.3%, a difference of 0.10%), Hawaiian (5.4%, a difference of 0.14%), Immigrants from Colombia (5.3%, a difference of 0.18%), and Soviet Union (5.4%, a difference of 0.19%).
| Demographics | Rating | Rank | Female Unemployment |
| Ugandans | 31.2 /100 | #190 | Fair 5.3% |
| Cherokee | 30.8 /100 | #191 | Fair 5.3% |
| Portuguese | 28.6 /100 | #192 | Fair 5.3% |
| Arabs | 27.7 /100 | #193 | Fair 5.3% |
| Colombians | 27.0 /100 | #194 | Fair 5.3% |
| Immigrants | Colombia | 26.2 /100 | #195 | Fair 5.3% |
| Spaniards | 25.2 /100 | #196 | Fair 5.3% |
| Alsatians | 23.9 /100 | #197 | Fair 5.3% |
| Tsimshian | 23.1 /100 | #198 | Fair 5.4% |
| Hawaiians | 22.2 /100 | #199 | Fair 5.4% |
| Soviet Union | 21.7 /100 | #200 | Fair 5.4% |
| Immigrants | Middle Africa | 20.8 /100 | #201 | Fair 5.4% |
| Iroquois | 20.8 /100 | #202 | Fair 5.4% |
| Immigrants | South Eastern Asia | 20.3 /100 | #203 | Fair 5.4% |
| Immigrants | Israel | 19.7 /100 | #204 | Poor 5.4% |